Embed Size (px)
Citation preview
1 Classification: Internal Use© Fifth Third Bancorp | All Rights Reserved
Morgan Stanley
2021 US Financials, Payments & CRE
Conference
Greg D. Carmichael
Chairman & Chief Executive Officer
June 16, 2021
2 Classification: Internal Use© Fifth Third Bancorp | All Rights Reserved
Cautionary statementThis presentation contains statements that we believe are “forward-looking statements” within the meaning of Section 27A of the Securities Act of 1933, as amended, and Rule 175
promulgated thereunder, and Section 21E of the Securities Exchange Act of 1934, as amended, and Rule 3b-6 promulgated thereunder. These statements relate to our financial
condition, results of operations, plans, objectives, future performance, capital actions or business. They usually can be identified by the use of forward-looking language such as “will
likely result,” “may,” “are expected to,” “is anticipated,” “potential,” “estimate,” “forecast,” “projected,” “intends to,” or may include other similar words or phrases such as “believes,”
“plans,” “trend,” “objective,” “continue,” “remain,” or similar expressions, or future or conditional verbs such as “will,” “would,” “should,” “could,” “might,” “can,” or similar verbs. You
should not place undue reliance on these statements, as they are subject to risks and uncertainties, including but not limited to the risk factors set forth in our most recent Annual
Report on Form 10-K as updated by our filings with the U.S. Securities and Exchange Commission (“SEC”). When considering these forward-looking statements, you should keep in
mind these risks and uncertainties, as well as any cautionary statements we may make. Moreover, you should treat these statements as speaking only as of the date they are made
and based only on information then actually known to us. We undertake no obligation to release revisions to these forward-looking statements or reflect events or circumstances after
the date of this presentation.
There are a number of important factors that could cause future results to differ materially from historical performance and these forward-looking statements. Factors that might
cause such a difference include, but are not limited to: (1) effects of the global COVID-19 pandemic; (2) deteriorating credit quality; (3) loan concentration by location or industry of
borrowers or collateral; (4) problems encountered by other financial institutions; (5) inadequate sources of funding or liquidity; (6) unfavorable actions of rating agencies; (7) inability
to maintain or grow deposits; (8) limitations on the ability to receive dividends from subsidiaries; (9) cyber-security risks; (10) Fifth Third’s ability to secure confidential information and
deliver products and services through the use of computer systems and telecommunications networks; (11) failures by third-party service providers; (12) inability to manage strategic
initiatives and/or organizational changes; (13) inability to implement technology system enhancements; (14) failure of internal controls and other risk management systems; (15)
losses related to fraud, theft, misappropriation or violence; (16) inability to attract and retain skilled personnel; (17) adverse impacts of government regulation; (18) governmental or
regulatory changes or other actions; (19) failures to meet applicable capital requirements; (20) regulatory objections to Fif th Third’s capital plan; (21) regulation of Fifth Third’s
derivatives activities; (22) deposit insurance premiums; (23) assessments for the orderly liquidation fund; (24) replacement of LIBOR; (25) weakness in the national or local
economies; (26) global political and economic uncertainty or negative actions; (27) changes in interest rates; (28) changes and trends in capital markets; (29) fluctuation of Fifth
Third’s stock price; (30) volatility in mortgage banking revenue; (31) litigation, investigations, and enforcement proceedings by governmental authorities; (32) breaches of contractual
covenants, representations and warranties; (33) competition and changes in the financial services industry; (34) changing retail distribution strategies, customer preferences and
behavior; (35) difficulties in identifying, acquiring or integrating suitable strategic partnerships, investments or acquisit ions; (36) potential dilution from future acquisitions; (37) loss of
income and/or difficulties encountered in the sale and separation of businesses, investments or other assets; (38) results of investments or acquired entities; (39) changes in
accounting standards or interpretation or declines in the value of Fifth Third’s goodwill or other intangible assets; (40) inaccuracies or other failures from the use of models; (41)
effects of critical accounting policies and judgments or the use of inaccurate estimates; (42) weather-related events, other natural disasters, or health emergencies (including
pandemics); (43) the impact of reputational risk created by these or other developments on such matters as business generation and retention, funding and liquidity; and (44)
changes in law or requirements imposed by Fifth Third’s regulators impacting our capital actions, including dividend payments and stock repurchases.
You should refer to our periodic reports filed with the SEC for further information or other factors, which could cause actual results to be significantly different from those expressed or
implied by these forward-looking statements.
Annualized, pro forma, projected and estimated numbers are used for illustrative purposes only, are not forecasts and may not reflect actual results.
In this presentation, we may sometimes provide non-GAAP financial information. Please note that although non-GAAP financial measures provide useful insight to analysts,
investors and regulators, they should not be considered in isolation or relied upon as a substitute for analysis using GAAP measures. We provide a discussion of non-GAAP
measures and reconciliations to the most directly comparable GAAP measures in later slides in this presentation, as well as on page 25-27 of our 1Q21 earnings release.
Management does not provide a reconciliation for forward-looking non-GAAP financial measures where it is unable to provide a meaningful or accurate calculation or estimation of
reconciling items and the information is not available without unreasonable effort. This is due to the inherent difficulty of forecasting the occurrence and the financial impact of
various items that have not yet occurred, are out of the Bancorp’s control or cannot be reasonably predicted. For the same reasons, the Bancorp’s management is unable to
address the probable significance of the unavailable information. Forward-looking non-GAAP financial measures provided without the most directly comparable GAAP financial
measures may vary materially from the corresponding GAAP financial measures.
3 Classification: Internal Use© Fifth Third Bancorp | All Rights Reserved
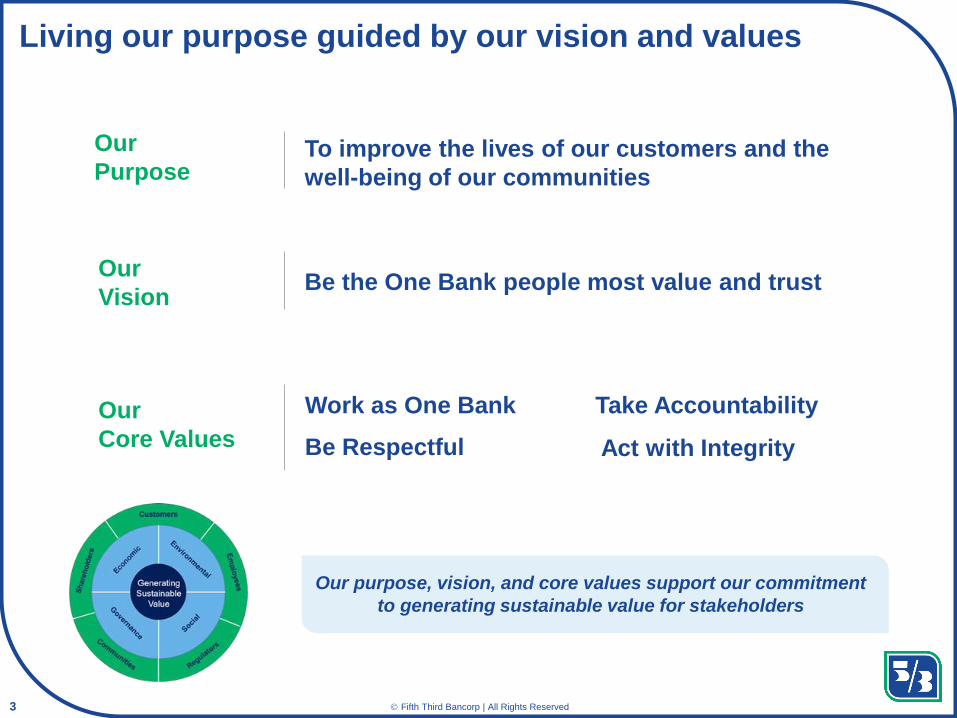
Living our purpose guided by our vision and values
Our
VisionBe the One Bank people most value and trust
Our
Core Values
Our
PurposeTo improve the lives of our customers and the
well-being of our communities
Work as One Bank Take Accountability
Be Respectful Act with Integrity
Our purpose, vision, and core values support our commitment
to generating sustainable value for stakeholders
4 Classification: Internal Use© Fifth Third Bancorp | All Rights Reserved
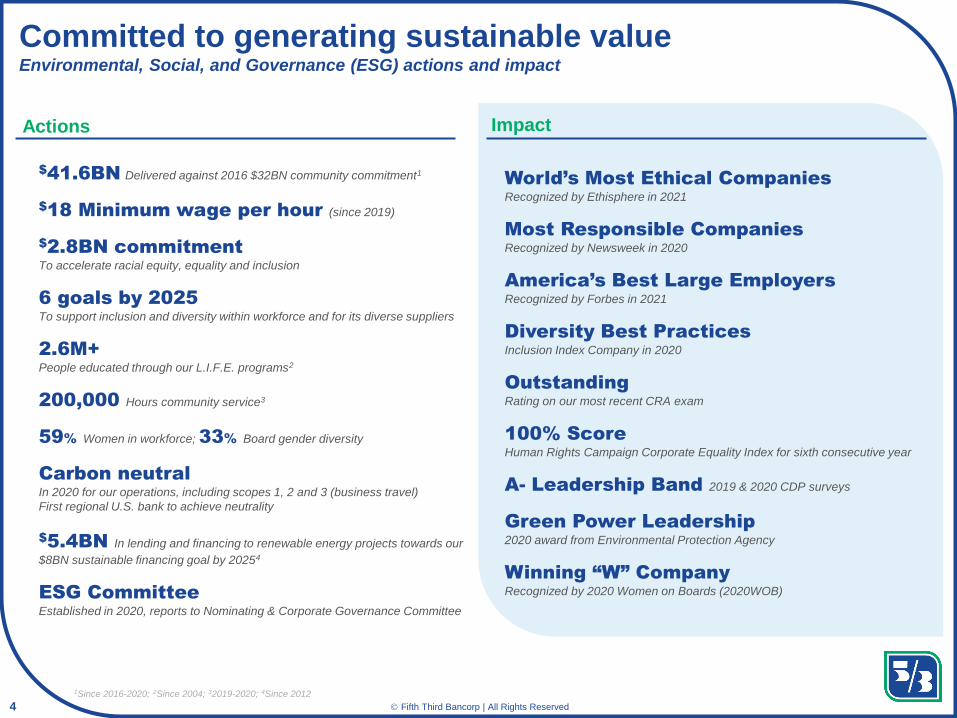
Committed to generating sustainable valueEnvironmental, Social, and Governance (ESG) actions and impact
Actions Impact
$41.6BN Delivered against 2016 $32BN community commitment1
$18 Minimum wage per hour (since 2019)
$2.8BN commitmentTo accelerate racial equity, equality and inclusion
6 goals by 2025To support inclusion and diversity within workforce and for its diverse suppliers
2.6M+ People educated through our L.I.F.E. programs2
200,000 Hours community service3
59% Women in workforce; 33% Board gender diversity
Carbon neutralIn 2020 for our operations, including scopes 1, 2 and 3 (business travel)
First regional U.S. bank to achieve neutrality
$5.4BN In lending and financing to renewable energy projects towards our
$8BN sustainable financing goal by 20254
ESG CommitteeEstablished in 2020, reports to Nominating & Corporate Governance Committee
World’s Most Ethical CompaniesRecognized by Ethisphere in 2021
Most Responsible CompaniesRecognized by Newsweek in 2020
America’s Best Large EmployersRecognized by Forbes in 2021
Diversity Best PracticesInclusion Index Company in 2020
OutstandingRating on our most recent CRA exam
100% ScoreHuman Rights Campaign Corporate Equality Index for sixth consecutive year
A- Leadership Band 2019 & 2020 CDP surveys
Green Power Leadership 2020 award from Environmental Protection Agency
Winning “W” CompanyRecognized by 2020 Women on Boards (2020WOB)
1Since 2016-2020; 2Since 2004; 32019-2020; 4Since 2012
5 Classification: Internal Use© Fifth Third Bancorp | All Rights Reserved
FY15 1Q21 LTM
Commercial banking Deposit service
W&AM Card & processing
Leasing Mortgage
Other
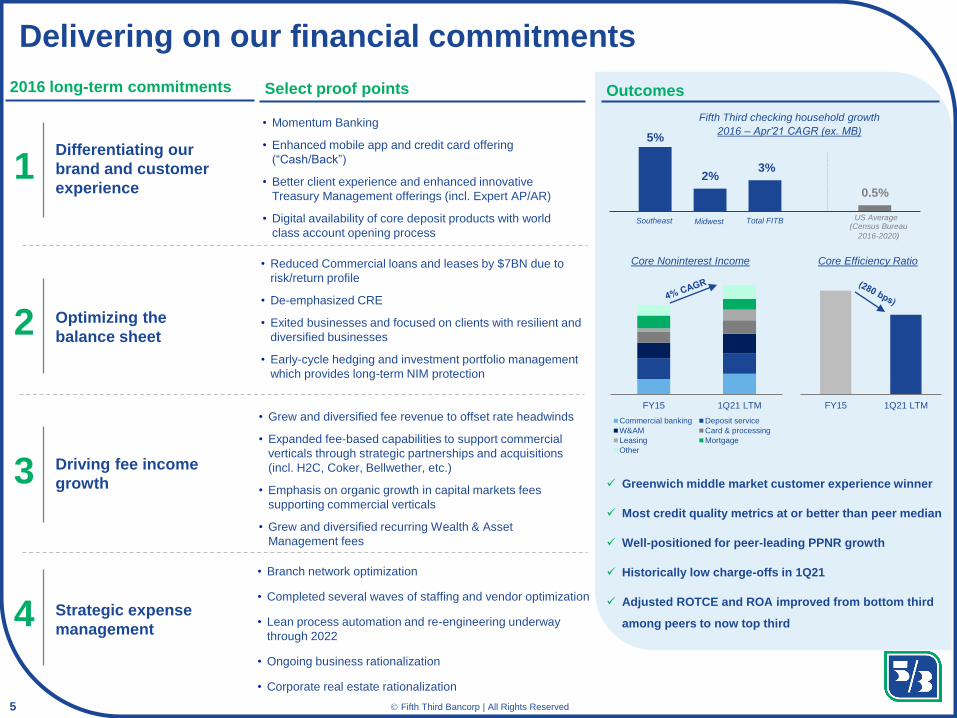
Delivering on our financial commitments
1Differentiating our
brand and customer
experience
2 Optimizing the
balance sheet
3 Driving fee income
growth
4 Strategic expense
management
2016 long-term commitments Select proof points
• Reduced Commercial loans and leases by $7BN due to
risk/return profile
• De-emphasized CRE
• Exited businesses and focused on clients with resilient and
diversified businesses
• Early-cycle hedging and investment portfolio management
which provides long-term NIM protection
• Grew and diversified fee revenue to offset rate headwinds
• Expanded fee-based capabilities to support commercial
verticals through strategic partnerships and acquisitions
(incl. H2C, Coker, Bellwether, etc.)
• Emphasis on organic growth in capital markets fees
supporting commercial verticals
• Grew and diversified recurring Wealth & Asset
Management fees
• Branch network optimization
• Completed several waves of staffing and vendor optimization
• Lean process automation and re-engineering underway
through 2022
• Ongoing business rationalization
• Corporate real estate rationalization
Outcomes
• Momentum Banking
• Enhanced mobile app and credit card offering
(“Cash/Back”)
• Better client experience and enhanced innovative
Treasury Management offerings (incl. Expert AP/AR)
• Digital availability of core deposit products with world
class account opening process
FY15 1Q21 LTM
✓ Greenwich middle market customer experience winner
✓ Most credit quality metrics at or better than peer median
✓ Well-positioned for peer-leading PPNR growth
✓ Historically low charge-offs in 1Q21
✓ Adjusted ROTCE and ROA improved from bottom third
among peers to now top third
Core Noninterest Income Core Efficiency Ratio
5%
2%3%
0.5%
Fifth Third checking household growth
2016 – Apr’21 CAGR (ex. MB)
Southeast Midwest Total FITB US Average(Census Bureau
2016-2020)
6 Classification: Internal Use© Fifth Third Bancorp | All Rights Reserved
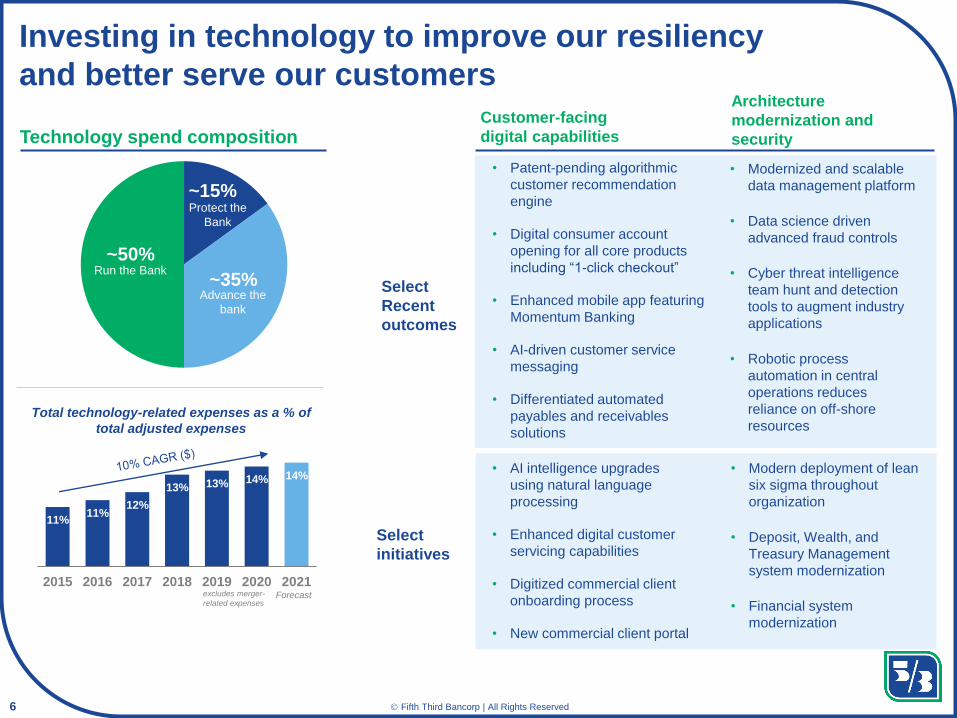
Investing in technology to improve our resiliency
and better serve our customers
Select
initiatives
Select
Recent
outcomes
Customer-facing
digital capabilitiesTechnology spend composition
Run the Bank
Advance the
bank
Protect the
Bank
~35%
~15%
~50%
Total technology-related expenses as a % of
total adjusted expenses
11%11%
12%
13% 13% 14% 14%
2015 2016 2017 2018 2019 2020 2021excludes merger-
related expensesForecast
Architecture
modernization and
security
• Patent-pending algorithmic
customer recommendation
engine
• Digital consumer account
opening for all core products
including “1-click checkout”
• Enhanced mobile app featuring
Momentum Banking
• AI-driven customer service
messaging
• Differentiated automated
payables and receivables
solutions
• AI intelligence upgrades
using natural language
processing
• Enhanced digital customer
servicing capabilities
• Digitized commercial client
onboarding process
• New commercial client portal
• Modernized and scalable
data management platform
• Data science driven
advanced fraud controls
• Cyber threat intelligence
team hunt and detection
tools to augment industry
applications
• Robotic process
automation in central
operations reduces
reliance on off-shore
resources
• Modern deployment of lean
six sigma throughout
organization
• Deposit, Wealth, and
Treasury Management
system modernization
• Financial system
modernization
7 Classification: Internal Use© Fifth Third Bancorp | All Rights Reserved
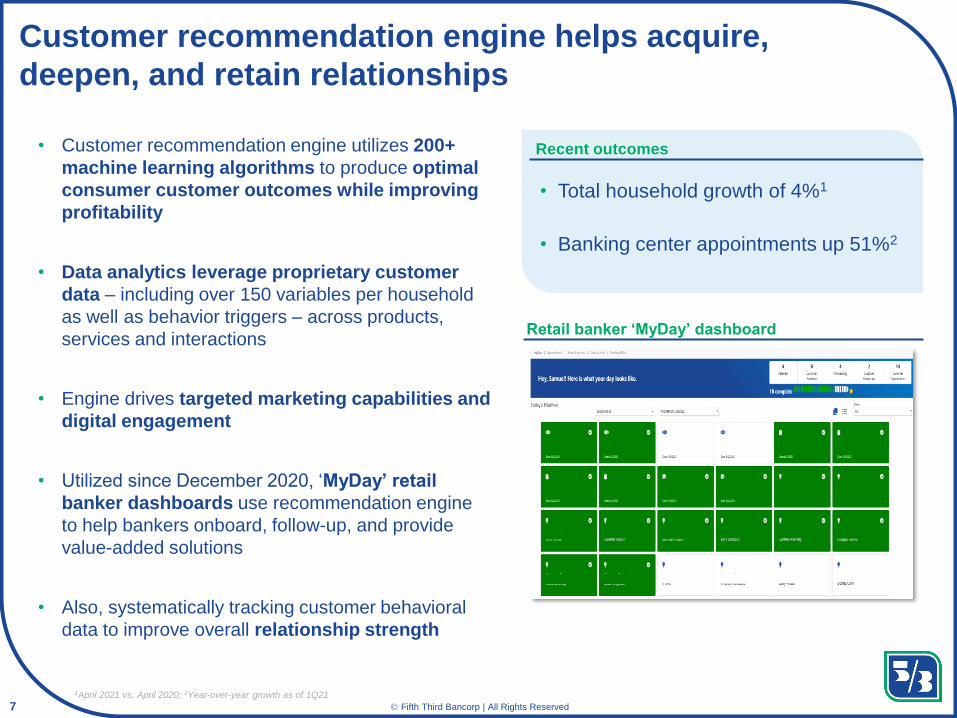
• Customer recommendation engine utilizes 200+
machine learning algorithms to produce optimal
consumer customer outcomes while improving
profitability
• Data analytics leverage proprietary customer
data – including over 150 variables per household
as well as behavior triggers – across products,
services and interactions
• Engine drives targeted marketing capabilities and
digital engagement
• Utilized since December 2020, ‘MyDay’ retail
banker dashboards use recommendation engine
to help bankers onboard, follow-up, and provide
value-added solutions
• Also, systematically tracking customer behavioral
data to improve overall relationship strength
Customer recommendation engine helps acquire,
deepen, and retain relationships
Retail banker ‘MyDay’ dashboard
• Total household growth of 4%1
• Banking center appointments up 51%2
Recent outcomes
1April 2021 vs. April 2020; 2Year-over-year growth as of 1Q21
8 Classification: Internal Use© Fifth Third Bancorp | All Rights Reserved
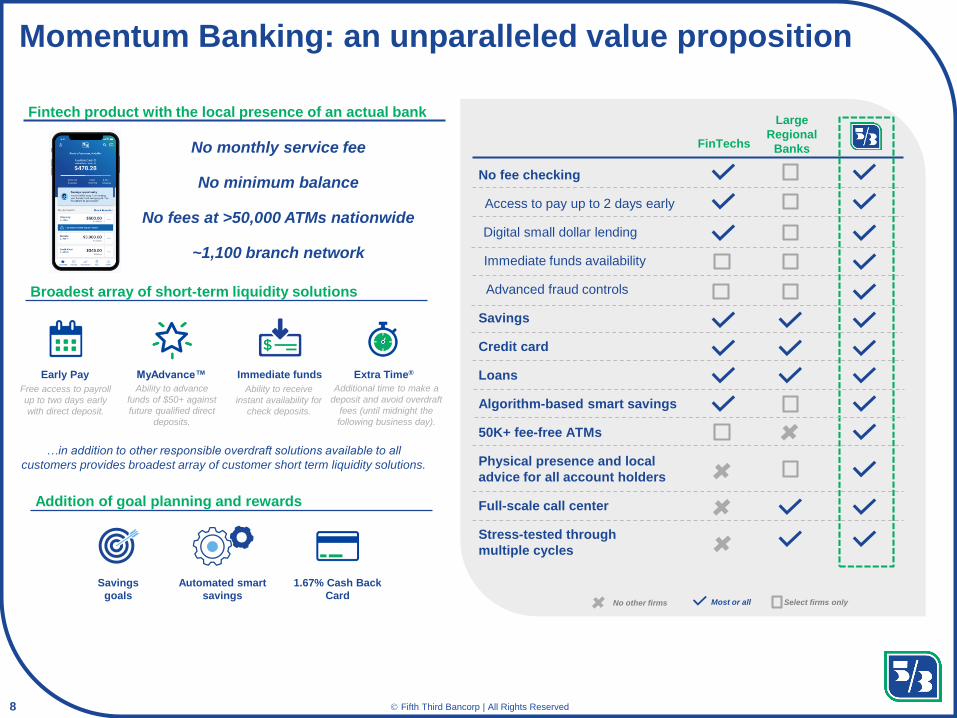
1.67% Cash Back
Card
Savings
goals
Automated smart
savings
Momentum Banking: an unparalleled value proposition
Fintech product with the local presence of an actual bank
Early Pay Extra Time®MyAdvance™ Immediate funds
Broadest array of short-term liquidity solutions
Addition of goal planning and rewards
No fee checking
Savings
Credit card
Digital small dollar lending
Loans
50K+ fee-free ATMs
Large
Regional
BanksFinTechsNo monthly service fee
No minimum balance
No fees at >50,000 ATMs nationwide
~1,100 branch network
Access to pay up to 2 days early
Physical presence and local
advice for all account holders
Full-scale call center
Algorithm-based smart savings
Immediate funds availability
Stress-tested through
multiple cycles
…in addition to other responsible overdraft solutions available to all
customers provides broadest array of customer short term liquidity solutions.
Free access to payroll
up to two days early
with direct deposit.
Ability to advance
funds of $50+ against
future qualified direct
deposits.
Ability to receive
instant availability for
check deposits.
Additional time to make a
deposit and avoid overdraft
fees (until midnight the
following business day).
Most or all Select firms only
Advanced fraud controls
No other firms
9 Classification: Internal Use© Fifth Third Bancorp | All Rights Reserved
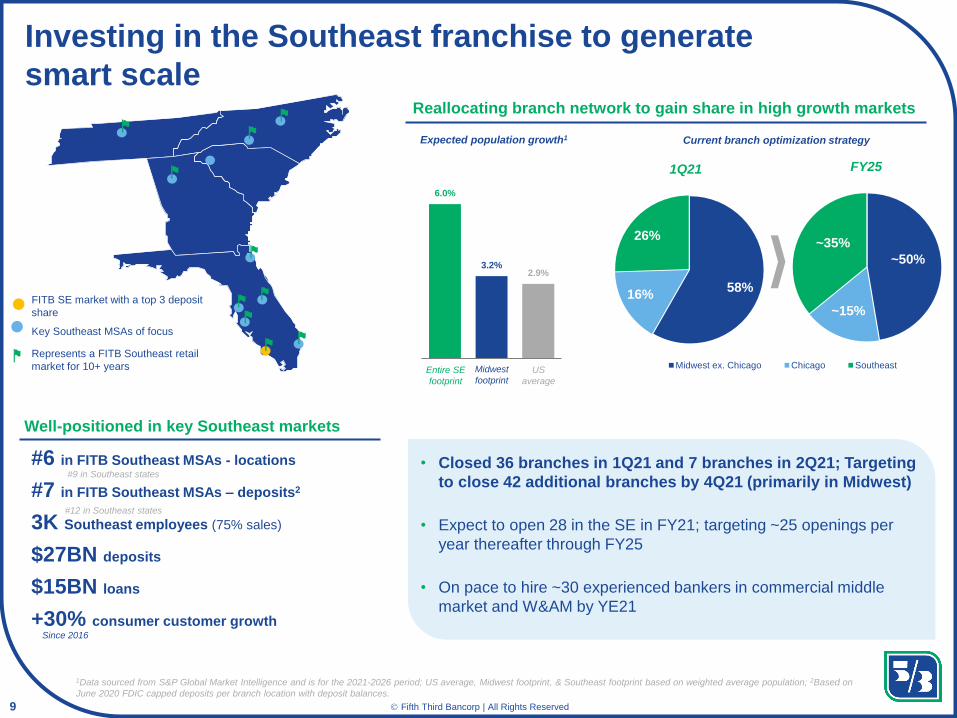
58%16%
26%
Midwest ex. Chicago Chicago Southeast
Investing in the Southeast franchise to generate
smart scale
FITB SE market with a top 3 deposit
share
Key Southeast MSAs of focus
Represents a FITB Southeast retail
market for 10+ years
Well-positioned in key Southeast markets
• Closed 36 branches in 1Q21 and 7 branches in 2Q21; Targeting
to close 42 additional branches by 4Q21 (primarily in Midwest)
• Expect to open 28 in the SE in FY21; targeting ~25 openings per
year thereafter through FY25
• On pace to hire ~30 experienced bankers in commercial middle
market and W&AM by YE21
#6 in FITB Southeast MSAs - locations
#7 in FITB Southeast MSAs – deposits2
3K Southeast employees (75% sales)
$27BN deposits
$15BN loans
+30% consumer customer growth
1Data sourced from S&P Global Market Intelligence and is for the 2021-2026 period; US average, Midwest footprint, & Southeast footprint based on weighted average population; 2Based on
June 2020 FDIC capped deposits per branch location with deposit balances.
#9 in Southeast states
#12 in Southeast states
Reallocating branch network to gain share in high growth markets
Since 2016
6.0%
3.2%2.9%
Expected population growth1
US
average
Entire SE
footprint
Midwest
footprint
Current branch optimization strategy
1Q21 FY25
~50%
~35%
~15%
10 Classification: Internal Use© Fifth Third Bancorp | All Rights Reserved
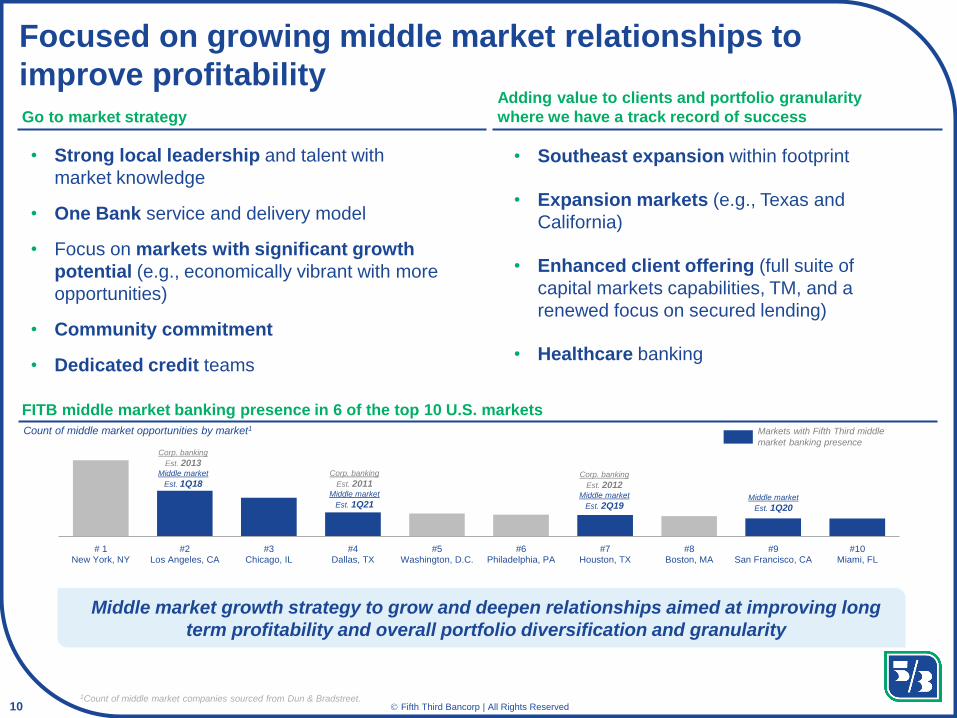
# 1New York, NY
#2Los Angeles, CA
#3Chicago, IL
#4Dallas, TX
#5Washington, D.C.
#6Philadelphia, PA
#7Houston, TX
#8Boston, MA
#9San Francisco, CA
#10Miami, FL
Corp. banking
Est. 2013Middle market
Est. 1Q18
Focused on growing middle market relationships to
improve profitabilityGo to market strategy
• Strong local leadership and talent with
market knowledge
• One Bank service and delivery model
• Focus on markets with significant growth
potential (e.g., economically vibrant with more
opportunities)
• Community commitment
• Dedicated credit teams
• Southeast expansion within footprint
• Expansion markets (e.g., Texas and
California)
• Enhanced client offering (full suite of
capital markets capabilities, TM, and a
renewed focus on secured lending)
• Healthcare banking
Adding value to clients and portfolio granularity
where we have a track record of success
Middle market growth strategy to grow and deepen relationships aimed at improving long
term profitability and overall portfolio diversification and granularity
FITB middle market banking presence in 6 of the top 10 U.S. markets
Count of middle market opportunities by market1 Markets with Fifth Third middle
market banking presence
1Count of middle market companies sourced from Dun & Bradstreet.
Corp. banking
Est. 2011Middle market
Est. 1Q21
Corp. banking
Est. 2012Middle market
Est. 2Q19Middle market
Est. 1Q20
11 Classification: Internal Use© Fifth Third Bancorp | All Rights Reserved
Appendix
12 Classification: Internal Use© Fifth Third Bancorp | All Rights Reserved
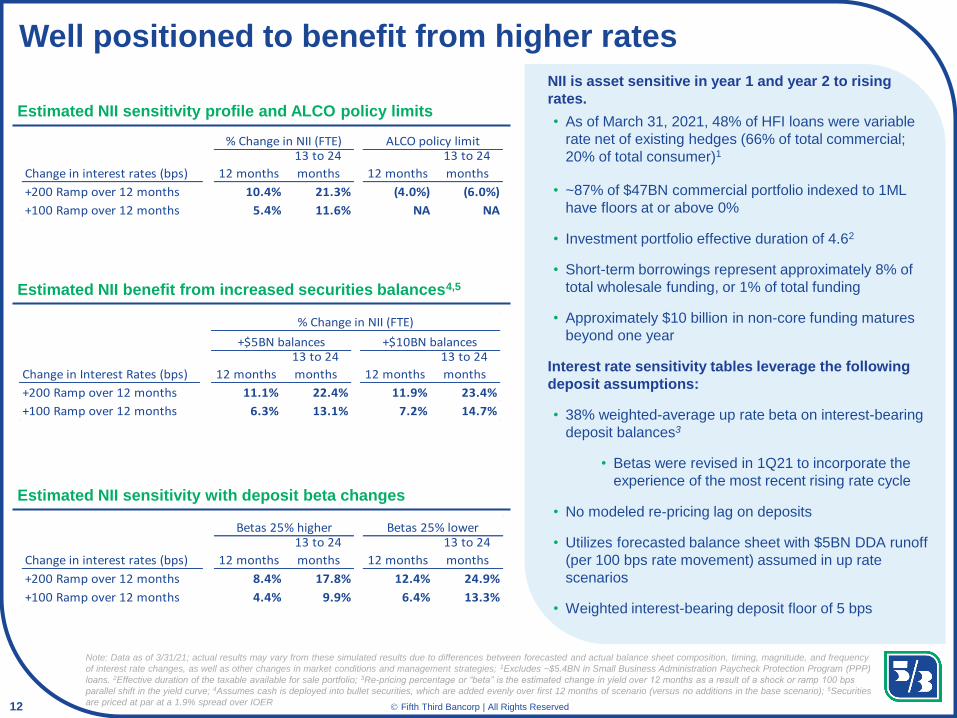
Well positioned to benefit from higher rates
Estimated NII sensitivity profile and ALCO policy limits
Estimated NII sensitivity with deposit beta changes
Estimated NII benefit from increased securities balances4,5
NII is asset sensitive in year 1 and year 2 to rising
rates.
• As of March 31, 2021, 48% of HFI loans were variable
rate net of existing hedges (66% of total commercial;
20% of total consumer)1
• ~87% of $47BN commercial portfolio indexed to 1ML
have floors at or above 0%
• Investment portfolio effective duration of 4.62
• Short-term borrowings represent approximately 8% of
total wholesale funding, or 1% of total funding
• Approximately $10 billion in non-core funding matures
beyond one year
Interest rate sensitivity tables leverage the following
deposit assumptions:
• 38% weighted-average up rate beta on interest-bearing
deposit balances3
• Betas were revised in 1Q21 to incorporate the
experience of the most recent rising rate cycle
• No modeled re-pricing lag on deposits
• Utilizes forecasted balance sheet with $5BN DDA runoff
(per 100 bps rate movement) assumed in up rate
scenarios
• Weighted interest-bearing deposit floor of 5 bps
Note: Data as of 3/31/21; actual results may vary from these simulated results due to differences between forecasted and actual balance sheet composition, timing, magnitude, and frequency
of interest rate changes, as well as other changes in market conditions and management strategies; 1Excludes ~$5.4BN in Small Business Administration Paycheck Protection Program (PPP)
loans. 2Effective duration of the taxable available for sale portfolio; 3Re-pricing percentage or “beta” is the estimated change in yield over 12 months as a result of a shock or ramp 100 bps
parallel shift in the yield curve; 4Assumes cash is deployed into bullet securities, which are added evenly over first 12 months of scenario (versus no additions in the base scenario); 5Securities
are priced at par at a 1.9% spread over IOER
ALCO policy limit
Change in interest rates (bps) 12 months
13 to 24
months 12 months
13 to 24
months
+200 Ramp over 12 months 10.4% 21.3% (4.0%) (6.0%)
+100 Ramp over 12 months 5.4% 11.6% NA NA
% Change in NII (FTE)
Betas 25% higher Betas 25% lower
Change in interest rates (bps) 12 months
13 to 24
months 12 months
13 to 24
months
+200 Ramp over 12 months 8.4% 17.8% 12.4% 24.9%
+100 Ramp over 12 months 4.4% 9.9% 6.4% 13.3%
% Change in NII (FTE)
+$5BN balances +$10BN balances
Change in Interest Rates (bps) 12 months
13 to 24
months 12 months
13 to 24
months
+200 Ramp over 12 months 11.1% 22.4% 11.9% 23.4%
+100 Ramp over 12 months 6.3% 13.1% 7.2% 14.7%
13 Classification: Internal Use© Fifth Third Bancorp | All Rights Reserved
Peer 6
Peer 7
Peer 2
Peer 4
Peer 3
Peer 8
Peer 5
Peer 9
(35%)
(30%)
(25%)
(20%)
(15%)
(10%)
(5%)
0%
(30%) (20%) (10%) 0% 10% 20% 30% 40%
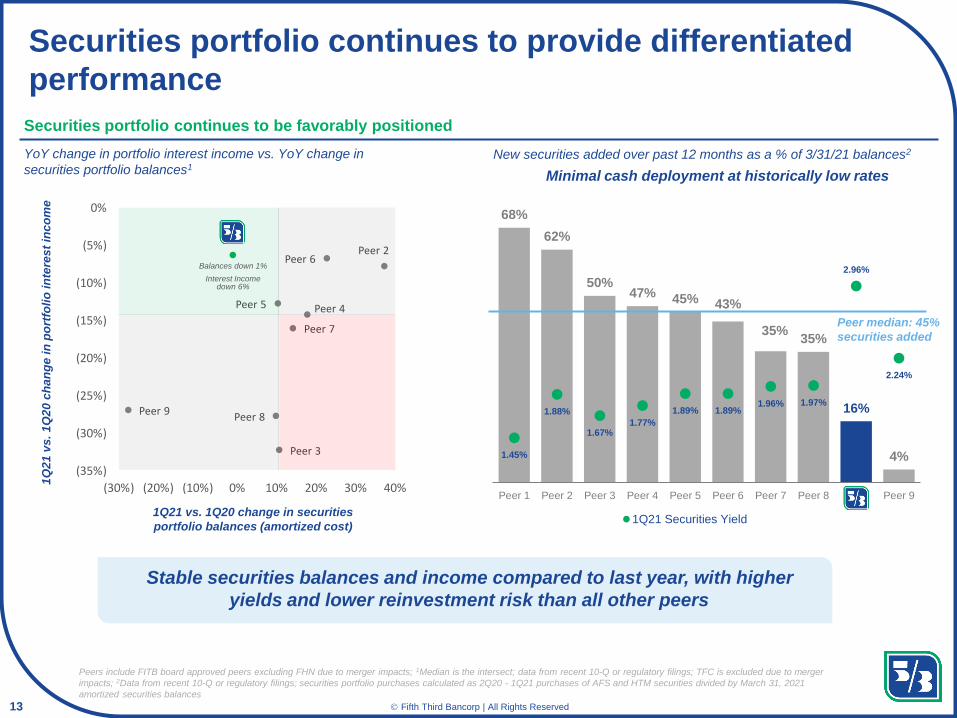
Securities portfolio continues to provide differentiated
performance
68%
62%
50%47% 45% 43%
35%35%
16%
4%1.45%
1.88%
1.67%1.77%
1.89% 1.89%1.96% 1.97%
2.96%
2.24%
1.00%
1.50%
2.00%
2.50%
3.00%
3.50%
4.00%
0
0.1
0.2
0.3
0.4
0.5
0.6
0.7
0.8
Peer 1 Peer 2 Peer 3 Peer 4 Peer 5 Peer 6 Peer 7 Peer 8 x Peer 9
1Q21 Securities Yield
Peers include FITB board approved peers excluding FHN due to merger impacts; 1Median is the intersect; data from recent 10-Q or regulatory filings; TFC is excluded due to merger
impacts; 2Data from recent 10-Q or regulatory filings; securities portfolio purchases calculated as 2Q20 - 1Q21 purchases of AFS and HTM securities divided by March 31, 2021
amortized securities balances
New securities added over past 12 months as a % of 3/31/21 balances2YoY change in portfolio interest income vs. YoY change in
securities portfolio balances1
1Q21 vs. 1Q20 change in securities
portfolio balances (amortized cost)
1Q
21
vs
. 1
Q2
0 c
ha
ng
e in
po
rtfo
lio
in
tere
st
inc
om
e
Securities portfolio continues to be favorably positioned
Stable securities balances and income compared to last year, with higher
yields and lower reinvestment risk than all other peers
Balances down 1%
Interest Income down 6%
Minimal cash deployment at historically low rates
Peer median: 45%
securities added
14 Classification: Internal Use© Fifth Third Bancorp | All Rights Reserved
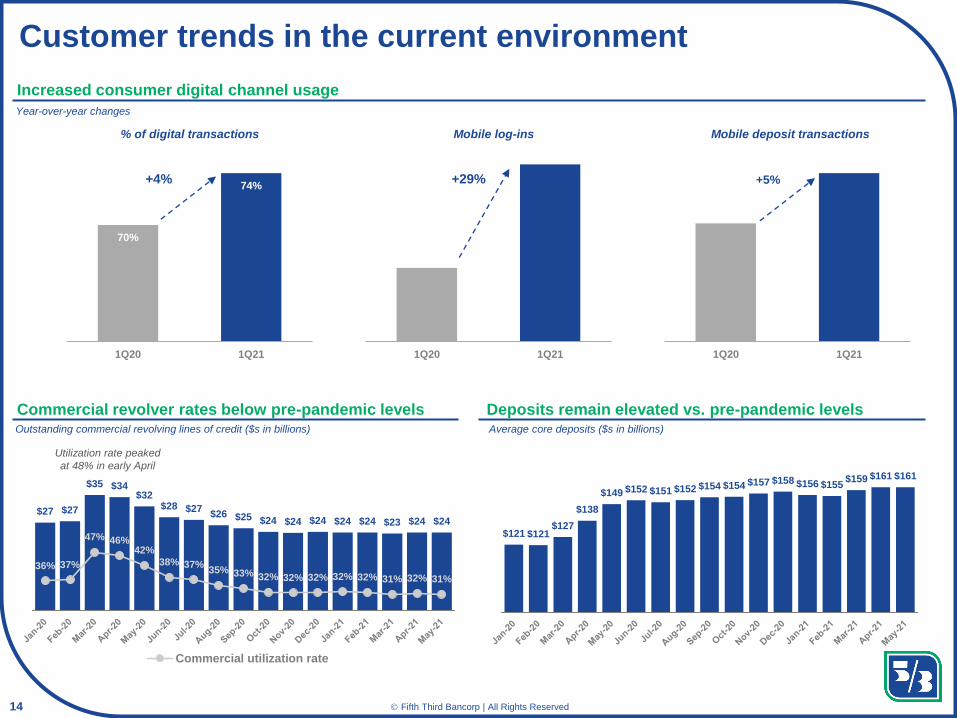
70%
74%
1Q20 1Q21
+4%
Customer trends in the current environment
Deposits remain elevated vs. pre-pandemic levels
$27 $27
$35 $34$32
$28 $27$26 $25 $24 $24 $24 $24 $24 $23 $24 $24
36% 37%
47% 46%42%
38% 37%35% 33% 32% 32% 32% 32% 32% 31% 32% 31%
0
5
10
15
20
25
30
35
40
Commercial utilization rate
Outstanding commercial revolving lines of credit ($s in billions)
Commercial revolver rates below pre-pandemic levels
$121 $121$127
$138
$149 $152 $151 $152 $154 $154 $157 $158 $156 $155$159 $161 $161
Average core deposits ($s in billions)
Increased consumer digital channel usage
1Q20 1Q21 1Q20 1Q21
% of digital transactions Mobile log-ins Mobile deposit transactions
+5%+29%
Year-over-year changes
Utilization rate peaked
at 48% in early April
15 Classification: Internal Use© Fifth Third Bancorp | All Rights Reserved
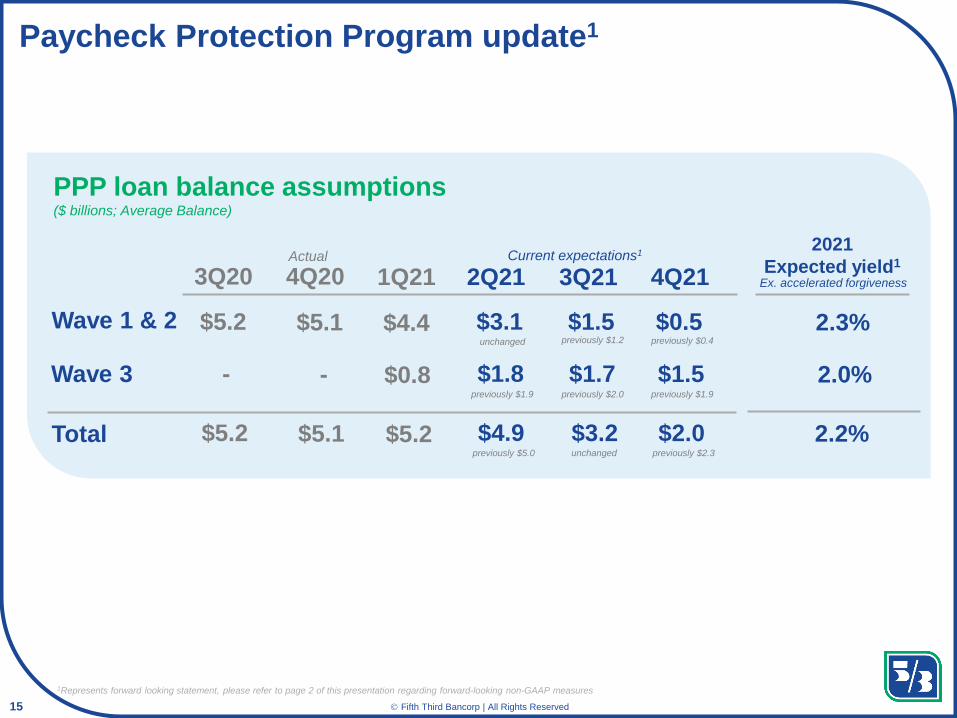
Paycheck Protection Program update1
PPP loan balance assumptions($ billions; Average Balance)
1Q21 2Q21 3Q21 4Q21
Wave 1 & 2
Wave 3
Total
3Q20 4Q20
$5.2 $5.1 $4.4 $3.1 $1.5 $0.5
- - $0.8 $1.8 $1.7 $1.5
$5.2 $5.1 $5.2 $4.9 $3.2 $2.0
Actual Current expectations12021
Expected yield1
2.3%
2.0%
2.2%
unchanged previously $1.2 previously $0.4
previously $1.9 previously $2.0 previously $1.9
previously $5.0 unchanged previously $2.3
Ex. accelerated forgiveness
1Represents forward looking statement, please refer to page 2 of this presentation regarding forward-looking non-GAAP measures