Embed Size (px)
Citation preview
London, 25-27 March 2014
Mediobanca Presentation
Morgan Stanley 10th Annual European Financials Conference

2
Agenda
1. MB Group
1.1 MB Group profile
1.2 Strategic achievements in last decade
1.3 Developments in governance
1.4 Business Plan 14-16 guidelines and targets
2. Corporate and Private Banking (“CIB”)
2.1 Market positioning and strategy
2.2 International operations
2.3 KPIs
3. Principal Investing (“PI”)
4. Consumer and Retail Banking (“RCB”)
4.1 Consumer lending: market positioning and strategy
4.2 Retail banking: market positioning and strategy
Annex
1. 1H results as at December 13
1.1 1H14 Group results
1.2 Segmental reporting
1.3 Closing remarks
Section 1
MB Group
Section 1.1
MB Group profile
5
History and mission
MB Group profile Section 1.1
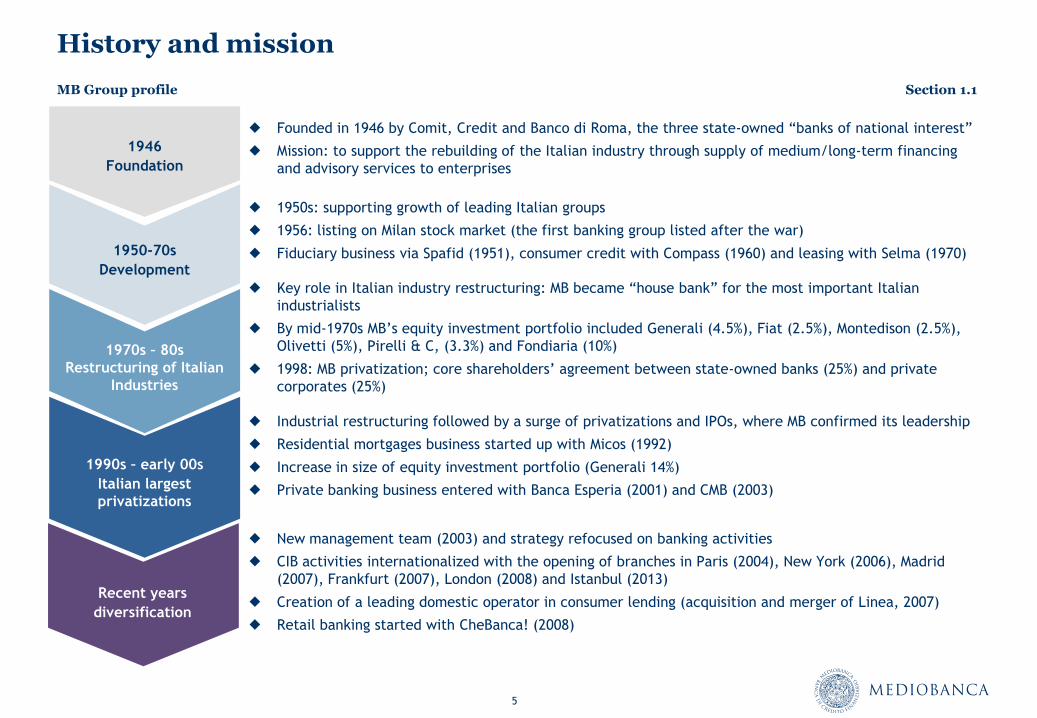
1950s: supporting growth of leading Italian groups
1956: listing on Milan stock market (the first banking group listed after the war)
Fiduciary business via Spafid (1951), consumer credit with Compass (1960) and leasing with Selma (1970)
Founded in 1946 by Comit, Credit and Banco di Roma, the three state-owned “banks of national interest”
Mission: to support the rebuilding of the Italian industry through supply of medium/long-term financing
and advisory services to enterprises
Key role in Italian industry restructuring: MB became “house bank” for the most important Italian
industrialists
By mid-1970s MB’s equity investment portfolio included Generali (4.5%), Fiat (2.5%), Montedison (2.5%),
Olivetti (5%), Pirelli & C, (3.3%) and Fondiaria (10%)
1998: MB privatization; core shareholders’ agreement between state-owned banks (25%) and private
corporates (25%)
New management team (2003) and strategy refocused on banking activities
CIB activities internationalized with the opening of branches in Paris (2004), New York (2006), Madrid
(2007), Frankfurt (2007), London (2008) and Istanbul (2013)
Creation of a leading domestic operator in consumer lending (acquisition and merger of Linea, 2007)
Retail banking started with CheBanca! (2008)
Industrial restructuring followed by a surge of privatizations and IPOs, where MB confirmed its leadership
Residential mortgages business started up with Micos (1992)
Increase in size of equity investment portfolio (Generali 14%)
Private banking business entered with Banca Esperia (2001) and CMB (2003)
Recent years
diversification
1990s – early 00s
Italian largest
privatizations
1970s – 80s
Restructuring of Italian
Industries
1946
Foundation
1950-70s
Development
6
MB shareholders’ agreement
Mediobanca shareholders’ agreement
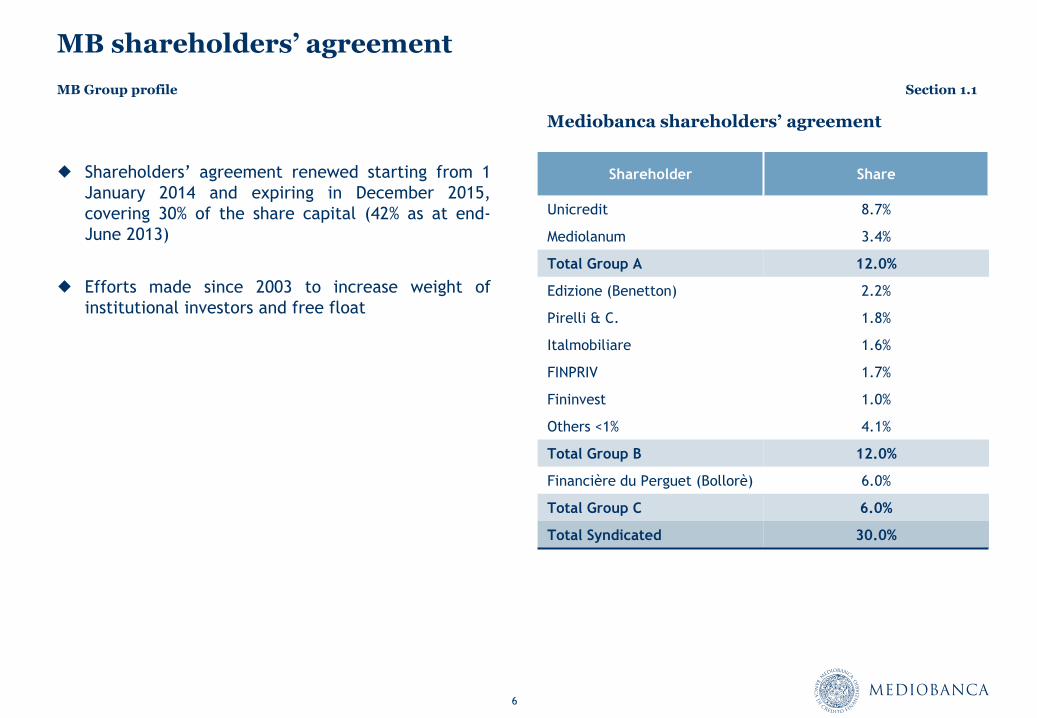
Shareholders’ agreement renewed starting from 1
January 2014 and expiring in December 2015,
covering 30% of the share capital (42% as at end-
June 2013)
Efforts made since 2003 to increase weight of
institutional investors and free float
Shareholder Share
Unicredit 8.7%
Mediolanum 3.4%
Total Group A 12.0%
Edizione (Benetton) 2.2%
Pirelli & C. 1.8%
Italmobiliare 1.6%
FINPRIV 1.7%
Fininvest 1.0%
Others <1% 4.1%
Total Group B 12.0%
Financière du Perguet (Bollorè) 6.0%
Total Group C 6.0%
Total Syndicated 30.0%
MB Group profile Section 1.1
7
Business model
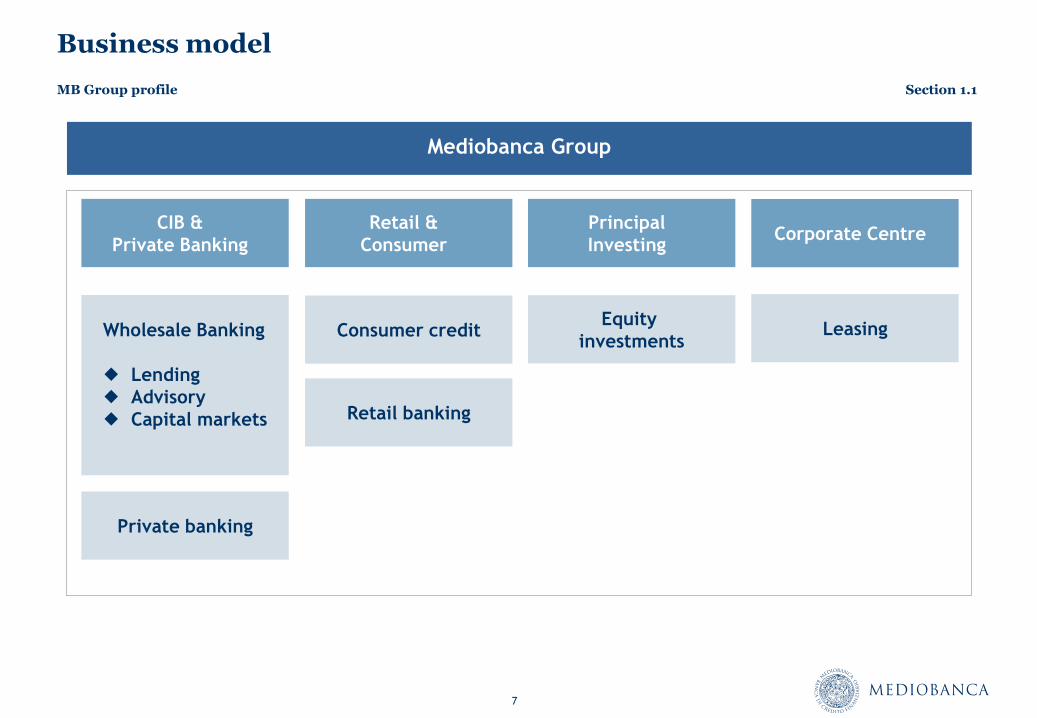
Mediobanca Group
Principal
Investing
Retail &
Consumer
CIB &
Private Banking
Wholesale Banking
Lending
Advisory
Capital markets
Equity
investments
Retail banking
Consumer credit
Private banking
Corporate Centre
Leasing
MB Group profile Section 1.1
8
MB Group’s Key Performance Indicators (“KPIs”)
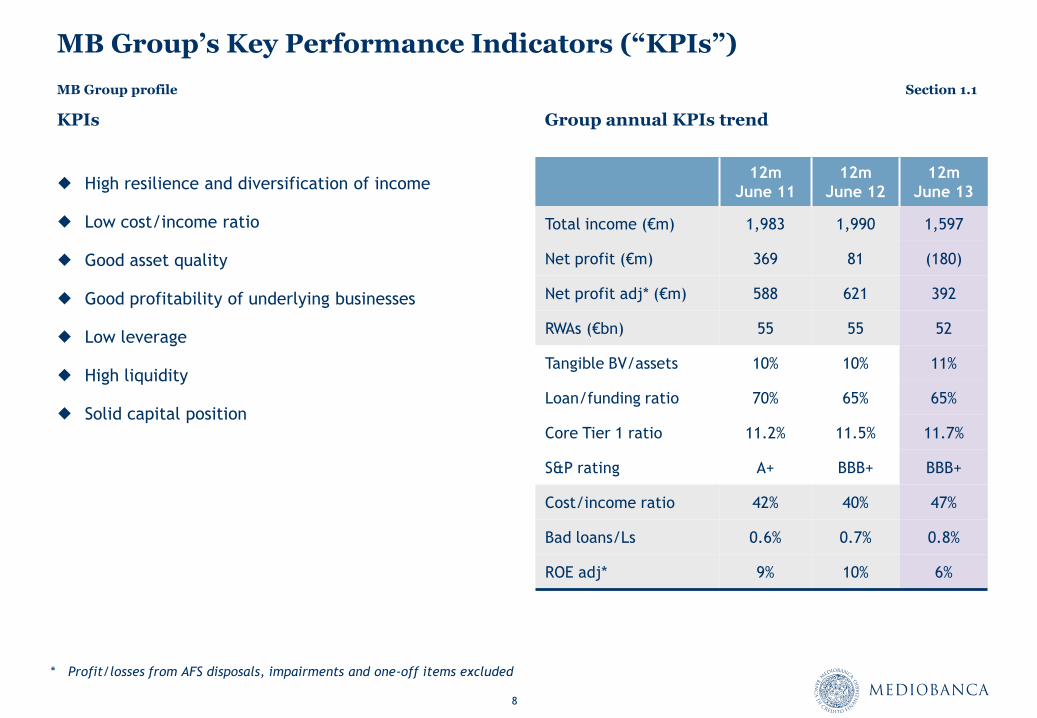
High resilience and diversification of income
Low cost/income ratio
Good asset quality
Good profitability of underlying businesses
Low leverage
High liquidity
Solid capital position
Group annual KPIs trend
12m
June 11
12m
June 12
12m
June 13
Total income (€m) 1,983 1,990 1,597
Net profit (€m) 369 81 (180)
Net profit adj* (€m) 588 621 392
RWAs (€bn) 55 55 52
Tangible BV/assets 10% 10% 11%
Loan/funding ratio 70% 65% 65%
Core Tier 1 ratio 11.2% 11.5% 11.7%
S&P rating A+ BBB+ BBB+
Cost/income ratio 42% 40% 47%
Bad loans/Ls 0.6% 0.7% 0.8%
ROE adj* 9% 10% 6%
* Profit/losses from AFS disposals, impairments and one-off items excluded
KPIs
MB Group profile Section 1.1
9
June 07 June 08 June 09 June 10 June 11 June 12 June 13
NII Fees Trading Equity acc.co.
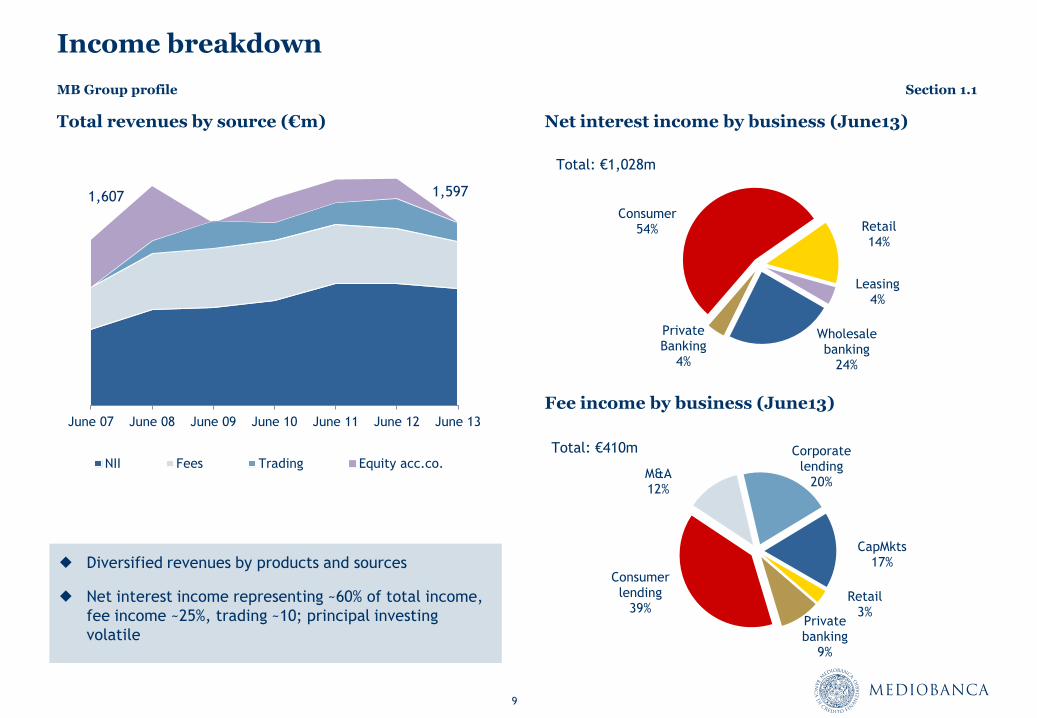
Income breakdown
Total revenues by source (€m)
Diversified revenues by products and sources
Net interest income representing ~60% of total income,
fee income ~25%, trading ~10; principal investing
volatile
Retail 3%
Private banking
9%
Consumer lending
39%
M&A 12%
Corporate lending
20%
CapMkts 17%
Wholesale banking
24%
Private Banking
4%
Consumer 54% Retail
14%
Leasing 4%
Fee income by business (June13)
1,607 1,597
Net interest income by business (June13)
Total: €1,028m
Total: €410m
MB Group profile Section 1.1
10
June 07
June 08
June 09
June 10
June 11
June 12
June 13
Dec 13
MB bonds to retail MB bonds to institutionals
Retail deposits Banks
PB & Other ECB
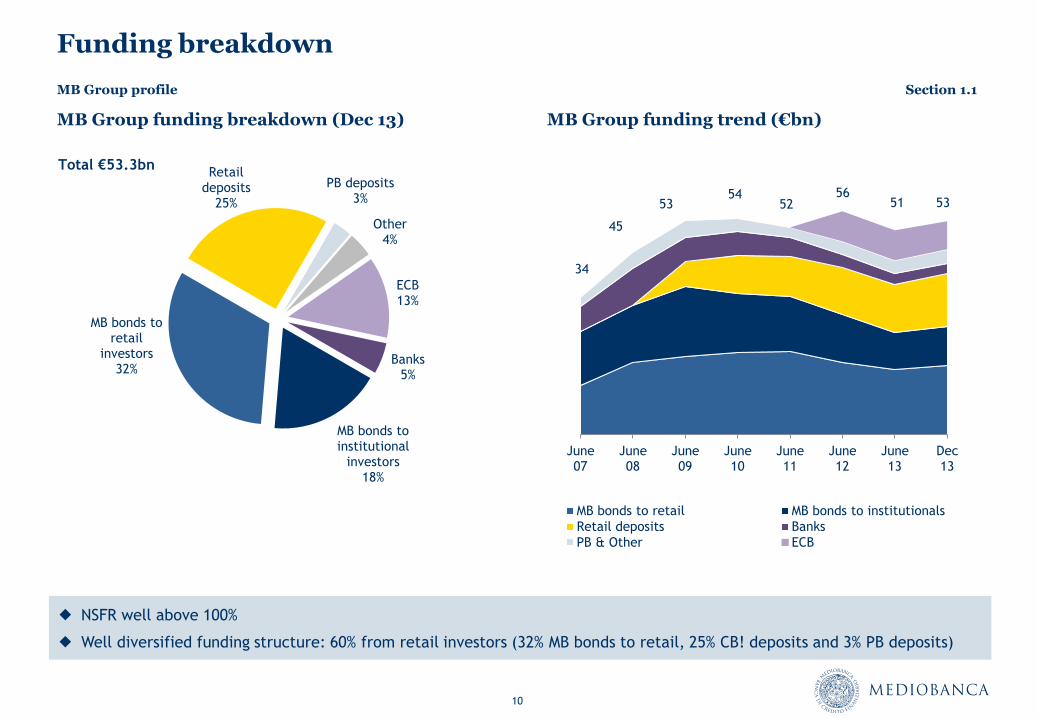
MB Group funding trend (€bn)
Funding breakdown
MB Group funding breakdown (Dec 13)
MB bonds to institutional
investors 18%
MB bonds to retail
investors 32%
Retail deposits
25%
PB deposits 3%
Other 4%
ECB 13%
Banks 5%
Total €53.3bn
NSFR well above 100%
Well diversified funding structure: 60% from retail investors (32% MB bonds to retail, 25% CB! deposits and 3% PB deposits)
34
56 54 53
45
52 51 53
MB Group profile Section 1.1
11
June 07
June 08
June 09
June 10
June 11
June 12
June 13
Dec 13
Large corporate Leasing Consumer lending
Mortgages Private Banking
27
36 34 35 35
36 33
32
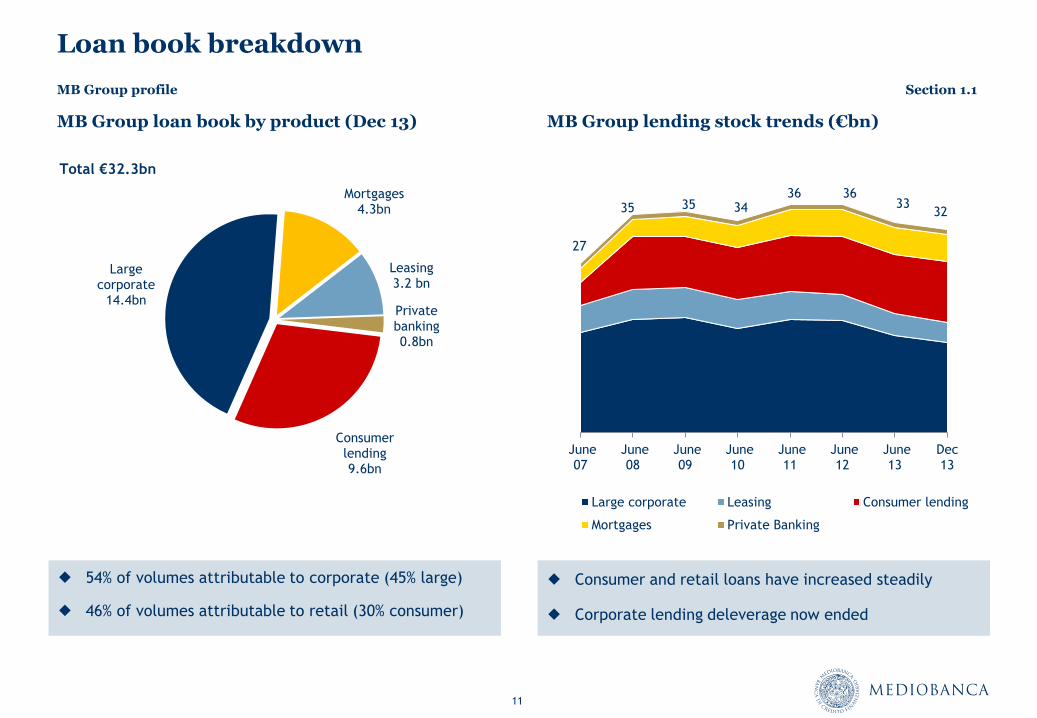
Loan book breakdown
MB Group loan book by product (Dec 13)
MB Group lending stock trends (€bn)
54% of volumes attributable to corporate (45% large)
46% of volumes attributable to retail (30% consumer)
Consumer and retail loans have increased steadily
Corporate lending deleverage now ended
Private banking 0.8bn
Consumer lending 9.6bn
Large corporate
14.4bn
Mortgages 4.3bn
Leasing 3.2 bn
Total €32.3bn
MB Group profile Section 1.1
12
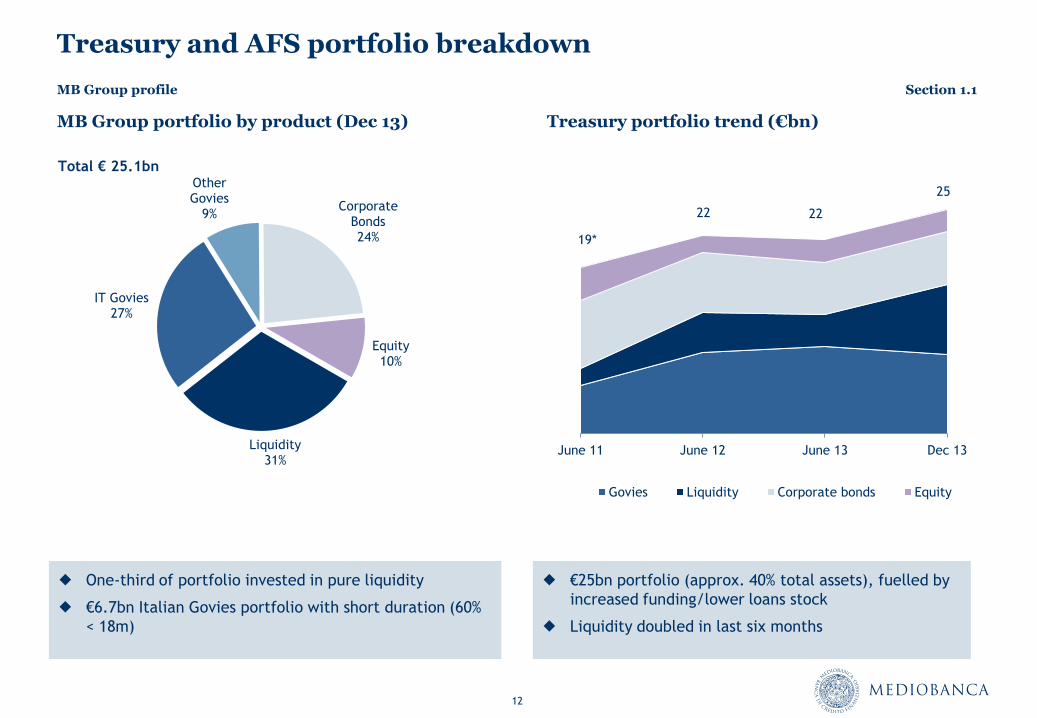
Treasury and AFS portfolio breakdown
MB Group portfolio by product (Dec 13) Treasury portfolio trend (€bn)
Liquidity 31%
IT Govies 27%
Other Govies
9% Corporate
Bonds 24%
Equity 10%
Total € 25.1bn
One-third of portfolio invested in pure liquidity
€6.7bn Italian Govies portfolio with short duration (60%
< 18m)
€25bn portfolio (approx. 40% total assets), fuelled by
increased funding/lower loans stock
Liquidity doubled in last six months
June 11 June 12 June 13 Dec 13
Govies Liquidity Corporate bonds Equity
19*
22 22
25
MB Group profile Section 1.1
13
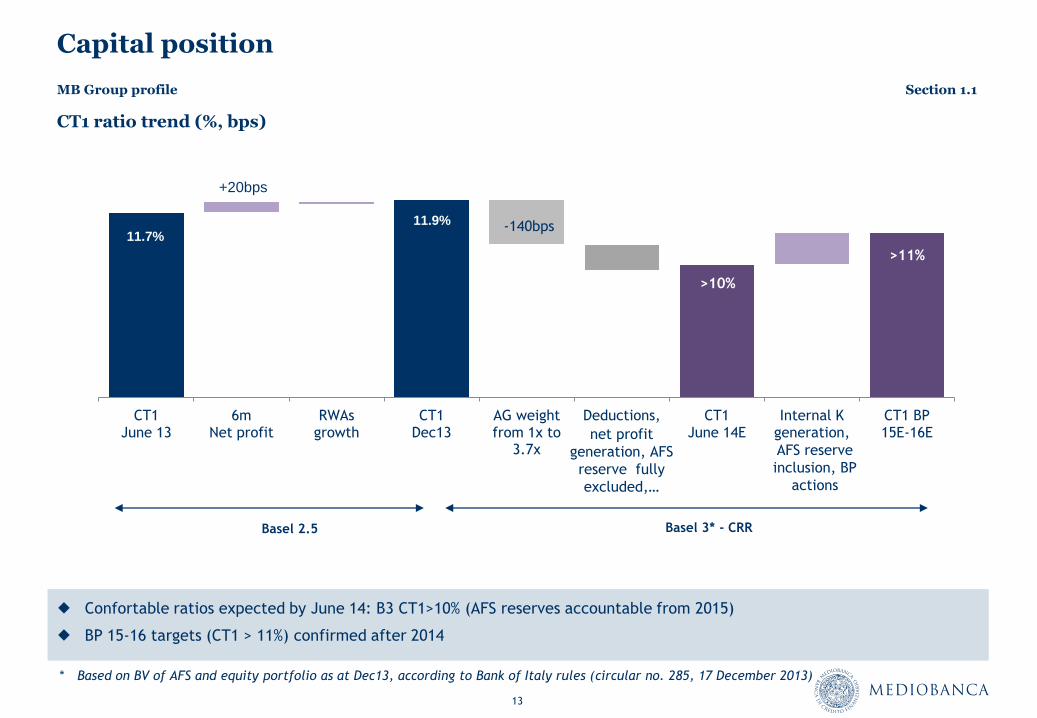
Capital position
Confortable ratios expected by June 14: B3 CT1>10% (AFS reserves accountable from 2015)
BP 15-16 targets (CT1 > 11%) confirmed after 2014
CT1 ratio trend (%, bps)
-140bps
>10%
>11%
CT1 June 13
6m Net profit
RWAs growth
CT1 Dec13
AG weight from 1x to
3.7x
Deductions, CT1 June 14E
Internal K generation,
CT1 BP 15E-16E
11.7%
11.9%
+20bps
+35bps
Basel 2.5 Basel 3* - CRR
* Based on BV of AFS and equity portfolio as at Dec13, according to Bank of Italy rules (circular no. 285, 17 December 2013)
net profit
generation, AFS
reserve fully
excluded,…
AFS reserve
inclusion, BP
actions
MB Group profile Section 1.1
14
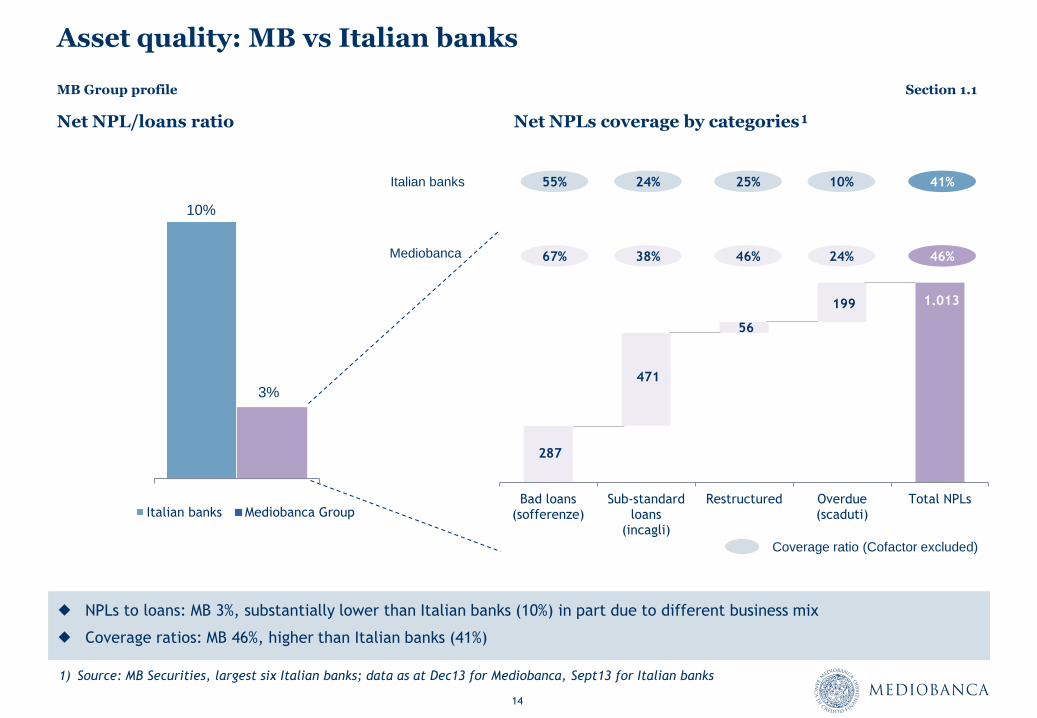
Asset quality: MB vs Italian banks
Net NPL/loans ratio Net NPLs coverage by categories¹
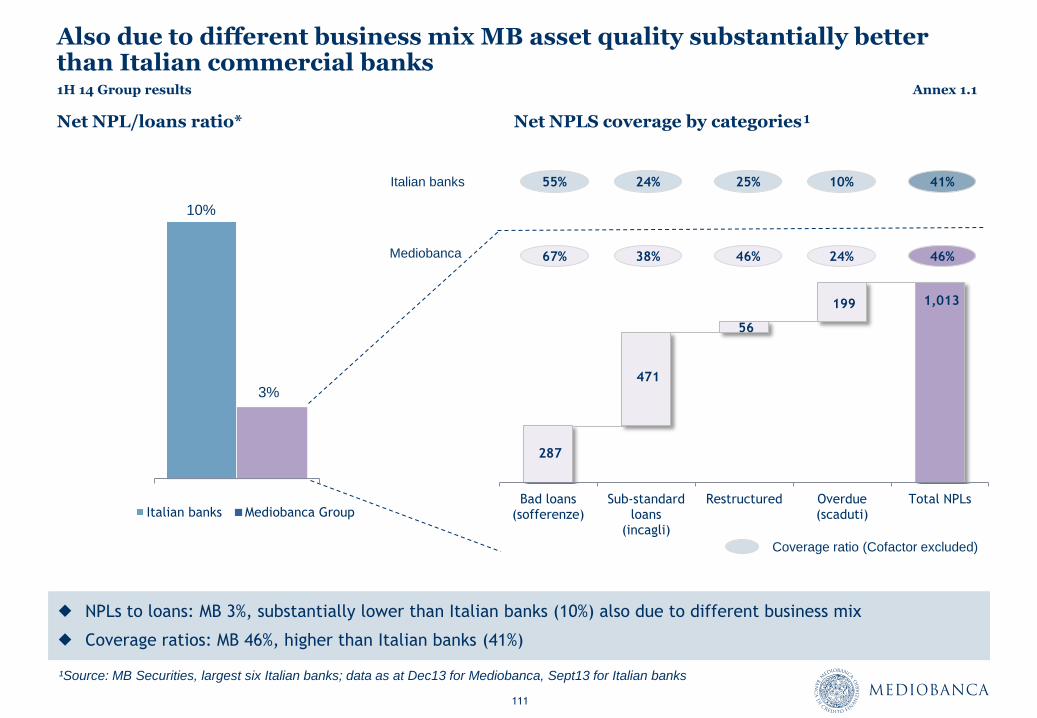
1) Source: MB Securities, largest six Italian banks; data as at Dec13 for Mediobanca, Sept13 for Italian banks
NPLs to loans: MB 3%, substantially lower than Italian banks (10%) in part due to different business mix
Coverage ratios: MB 46%, higher than Italian banks (41%)
287
1.013
471
56
199
Bad loans (sofferenze)
Sub-standard loans
(incagli)
Restructured Overdue (scaduti)
Total NPLs
46%
Coverage ratio (Cofactor excluded)
24% 46% 38% 67%
41% 10% 25% 24% 55% Italian banks
Mediobanca
Italian banks Mediobanca Group
10%
3%
MB Group profile Section 1.1
15
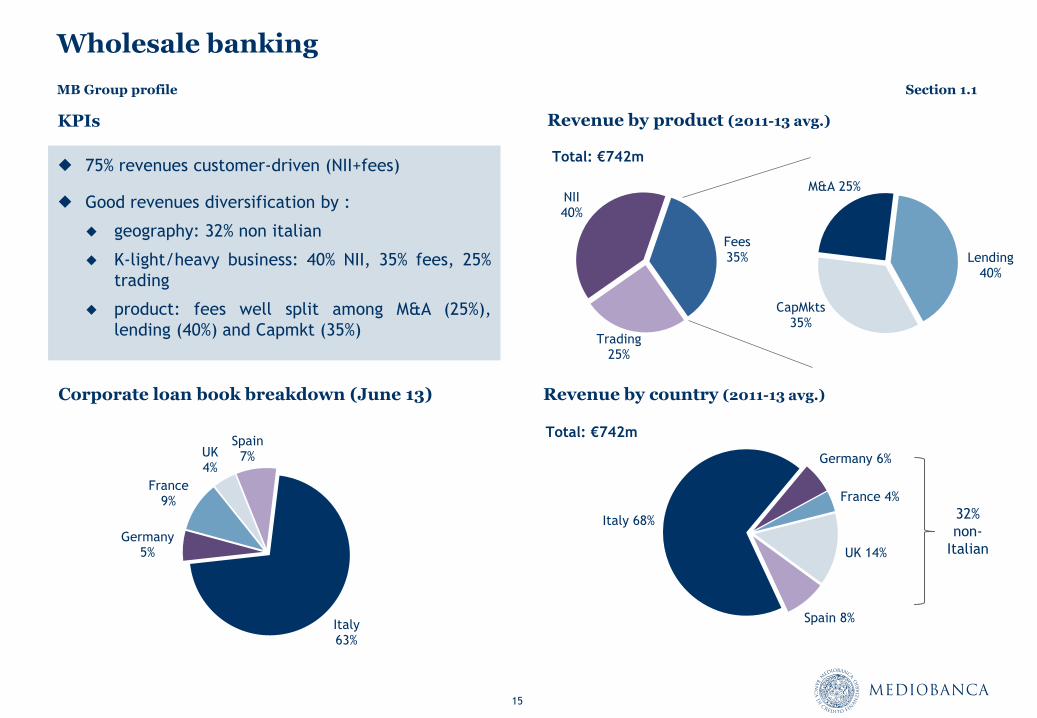
Lending 40%
CapMkts 35%
M&A 25%
Trading 25%
NII 40%
Fees 35%
Wholesale banking
75% revenues customer-driven (NII+fees)
Good revenues diversification by :
geography: 32% non italian
K-light/heavy business: 40% NII, 35% fees, 25%
trading
product: fees well split among M&A (25%),
lending (40%) and Capmkt (35%)
Revenue by product (2011-13 avg.) KPIs
Italy 68%
Germany 6%
France 4%
UK 14%
Spain 8%
Revenue by country (2011-13 avg.)
Total: €742m
32%
non-
Italian
Total: €742m
Corporate loan book breakdown (June 13)
Italy 63%
Germany 5%
France 9%
UK 4%
Spain 7%
MB Group profile Section 1.1
16
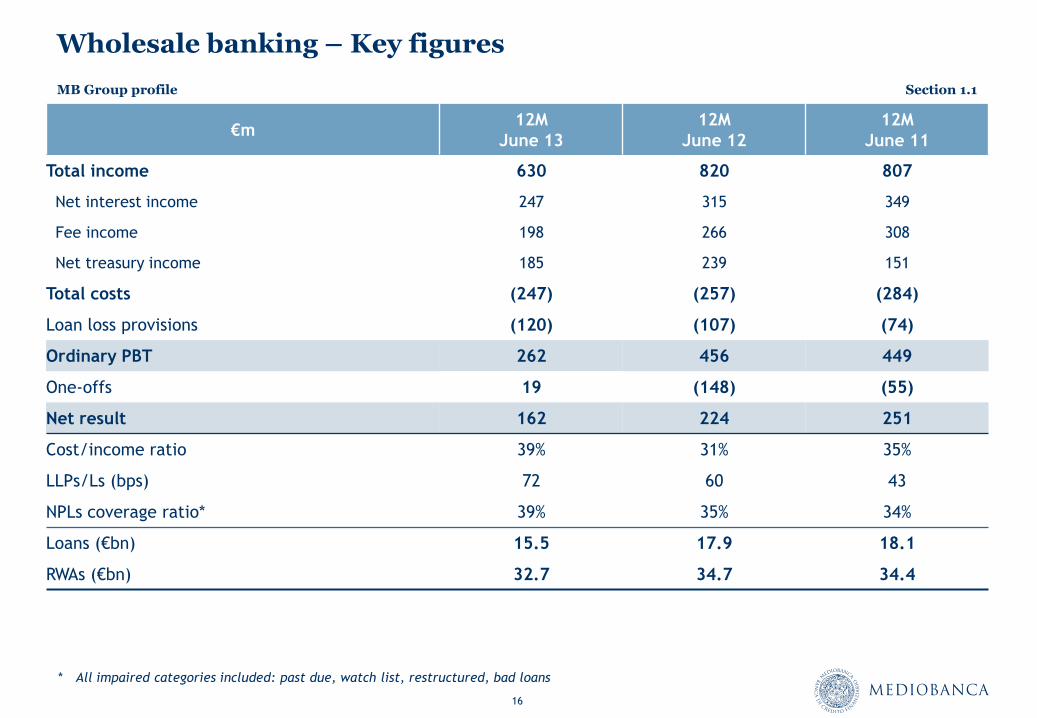
Wholesale banking – Key figures
€m 12M
June 13
12M
June 12
12M
June 11
Total income 630 820 807
Net interest income 247 315 349
Fee income 198 266 308
Net treasury income 185 239 151
Total costs (247) (257) (284)
Loan loss provisions (120) (107) (74)
Ordinary PBT 262 456 449
One-offs 19 (148) (55)
Net result 162 224 251
Cost/income ratio 39% 31% 35%
LLPs/Ls (bps) 72 60 43
NPLs coverage ratio* 39% 35% 34%
Loans (€bn) 15.5 17.9 18.1
RWAs (€bn) 32.7 34.7 34.4
* All impaired categories included: past due, watch list, restructured, bad loans
MB Group profile Section 1.1

17
Private banking
Banca Esperia KPIs (June 13)
CMB KPIs (June 13)
Founded in 2001 (50% partnership with Mediolanum)
Highly synergic with CIB operations
Top ranked in Italy as specialist player for UHNWI
€14.2bn AUM . AUM breakdown:
72% private investors, 28% institutional investors
48% managed, 52% administered
Distribution network: 70 bankers, 12 branches in Italy
Banca Esperia (100%)
Compagnie Monégasque de Banque
CMB: stake since 1989, fully owned since 2004
Leading financial institution in Principality of Monaco,
with around 10% market share
€6.7bn AUM . AUM breakdown:
mainly private investors
47% managed assets, 53% administered
Distribution network: 40 bankers
Steady profitability
€m June 13 June 12 June 11
Revenues 68 65 67
Costs (72) (64) (62)
GOP risk adj (5) 4 5
Net result 1 4 1
AUM €bn 14.2 13.2 13.7
€m June 13 June 12 June 11
Revenues 83 71 72
Costs (45) (46) (47)
GOPrisk adj 37 22 25
Net result 41 22(*) 24
AUM €bn 6.7 6.0 5.8
MB Group profile Section 1.1
* Excluding one-off items
18
2.2 2.3 2.5 2.5
2.5 1.8 1.5 1.5
June 11 June 12 June 13 Dec 13
AG Other stakes
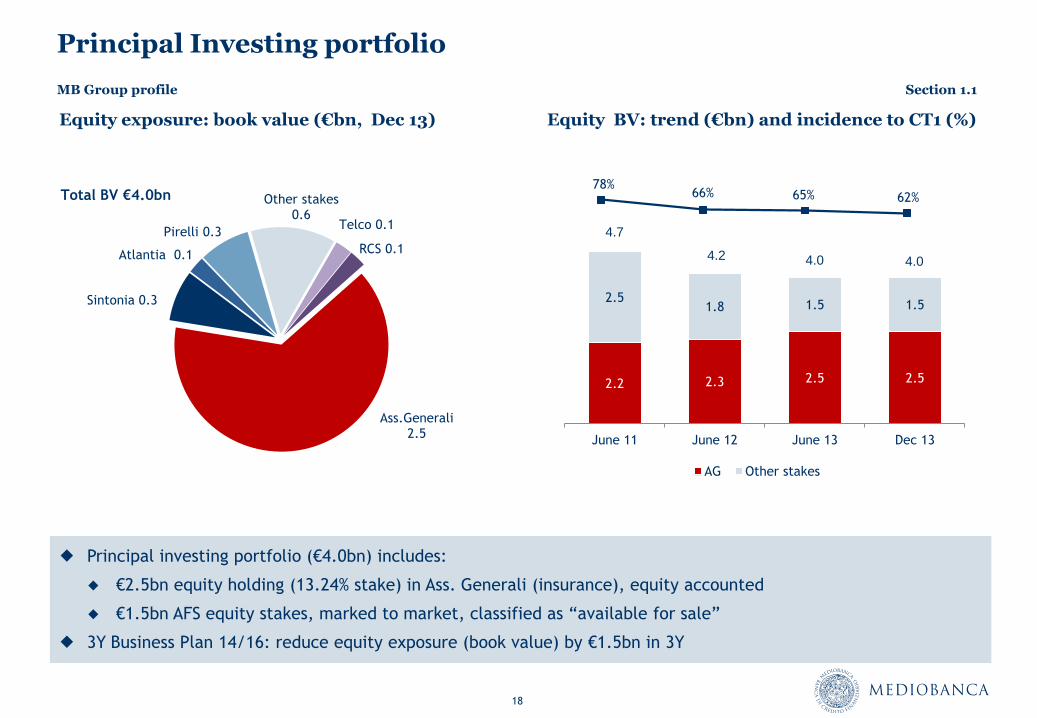
Principal Investing portfolio
Equity exposure: book value (€bn, Dec 13) Equity BV: trend (€bn) and incidence to CT1 (%)
Telco 0.1
RCS 0.1
Ass.Generali 2.5
Sintonia 0.3
Atlantia 0.1
Pirelli 0.3
Other stakes 0.6
Total BV €4.0bn
Principal investing portfolio (€4.0bn) includes:
€2.5bn equity holding (13.24% stake) in Ass. Generali (insurance), equity accounted
€1.5bn AFS equity stakes, marked to market, classified as “available for sale”
3Y Business Plan 14/16: reduce equity exposure (book value) by €1.5bn in 3Y
78% 66% 65% 62%
4.0 4.2
4.7
4.0
MB Group profile Section 1.1
19
Principal investing – key figures
€m 12M
June 13
12M
June 12
12M
June 11
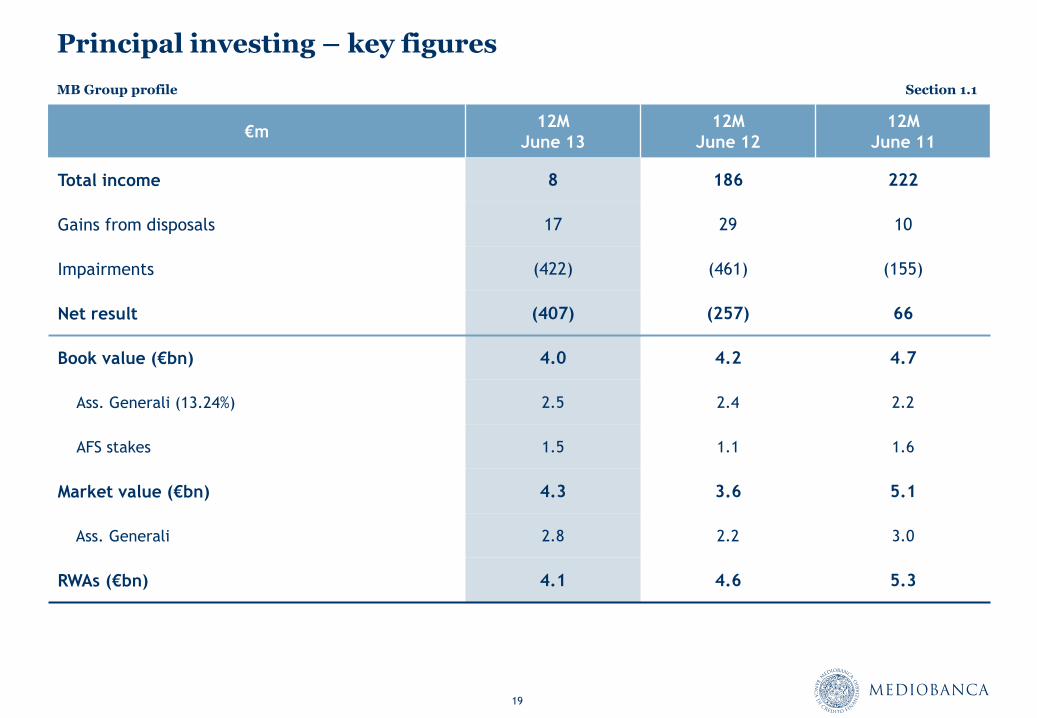
Total income 8 186 222
Gains from disposals 17 29 10
Impairments (422) (461) (155)
Net result (407) (257) 66
Book value (€bn) 4.0 4.2 4.7
Ass. Generali (13.24%) 2.5 2.4 2.2
AFS stakes 1.5 1.1 1.6
Market value (€bn) 4.3 3.6 5.1
Ass. Generali 2.8 2.2 3.0
RWAs (€bn) 4.1 4.6 5.3
MB Group profile Section 1.1
20
Cars 11%
Special purposes
10%
Personal loans 51%
Credit cards 20%
Salary guar.
6%
Consumer lending – Compass profile
Top 5 Italian consumer players (12m , Dec 13)
New loans by product (12m, Dec 13)
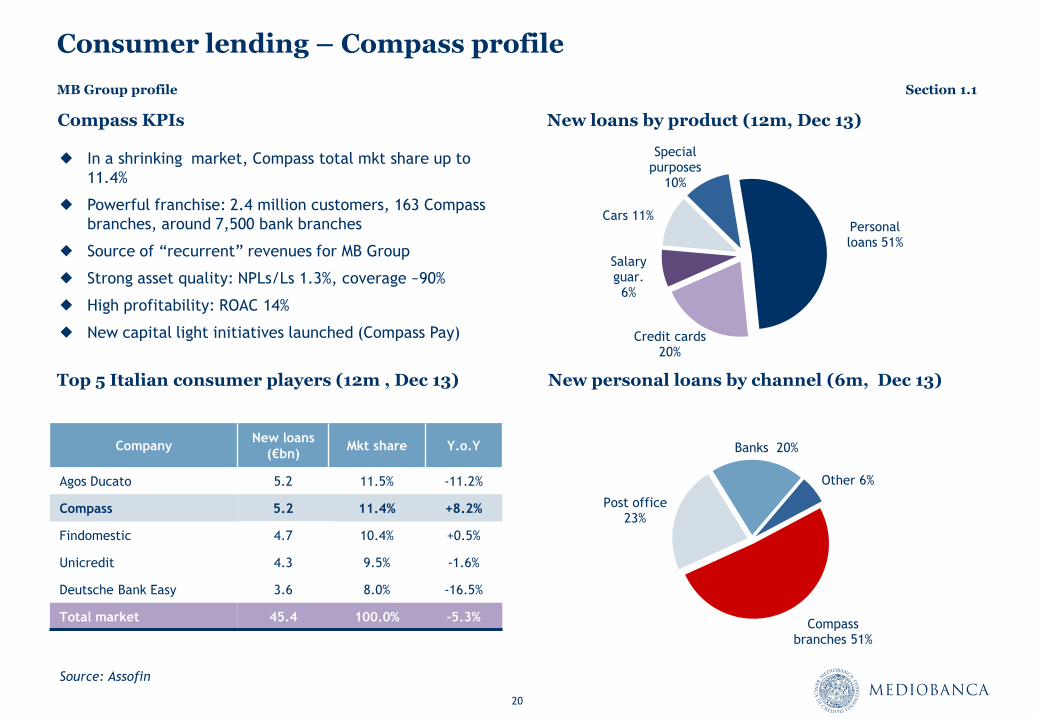
In a shrinking market, Compass total mkt share up to
11.4%
Powerful franchise: 2.4 million customers, 163 Compass
branches, around 7,500 bank branches
Source of “recurrent” revenues for MB Group
Strong asset quality: NPLs/Ls 1.3%, coverage ~90%
High profitability: ROAC 14%
New capital light initiatives launched (Compass Pay)
New personal loans by channel (6m, Dec 13)
Compass branches 51%
Post office 23%
Banks 20%
Other 6%
Compass KPIs
Company New loans
(€bn) Mkt share Y.o.Y
Agos Ducato 5.2 11.5% -11.2%
Compass 5.2 11.4% +8.2%
Findomestic 4.7 10.4% +0.5%
Unicredit 4.3 9.5% -1.6%
Deutsche Bank Easy 3.6 8.0% -16.5%
Total market 45.4 100.0% -5.3%
Source: Assofin
MB Group profile Section 1.1
21
Consumer lending - Key figures
€m 12M
June 13
12M
June 12
12M
June 11
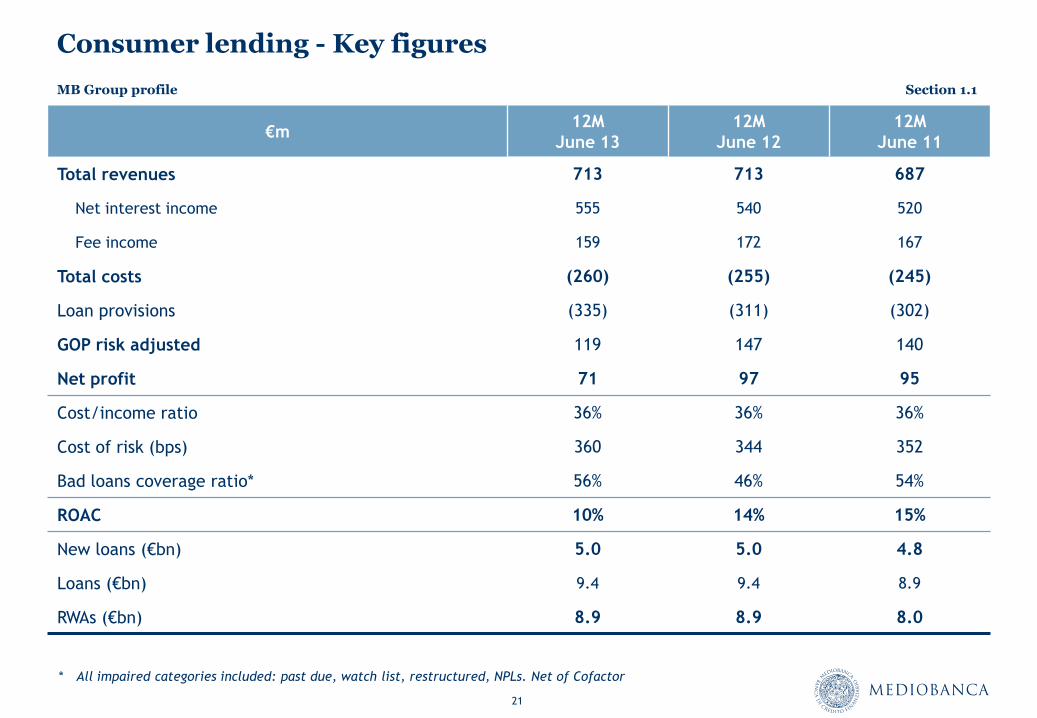
Total revenues 713 713 687
Net interest income 555 540 520
Fee income 159 172 167
Total costs (260) (255) (245)
Loan provisions (335) (311) (302)
GOP risk adjusted 119 147 140
Net profit 71 97 95
Cost/income ratio 36% 36% 36%
Cost of risk (bps) 360 344 352
Bad loans coverage ratio* 56% 46% 54%
ROAC 10% 14% 15%
New loans (€bn) 5.0 5.0 4.8
Loans (€bn) 9.4 9.4 8.9
RWAs (€bn) 8.9 8.9 8.0
* All impaired categories included: past due, watch list, restructured, NPLs. Net of Cofactor
MB Group profile Section 1.1
22
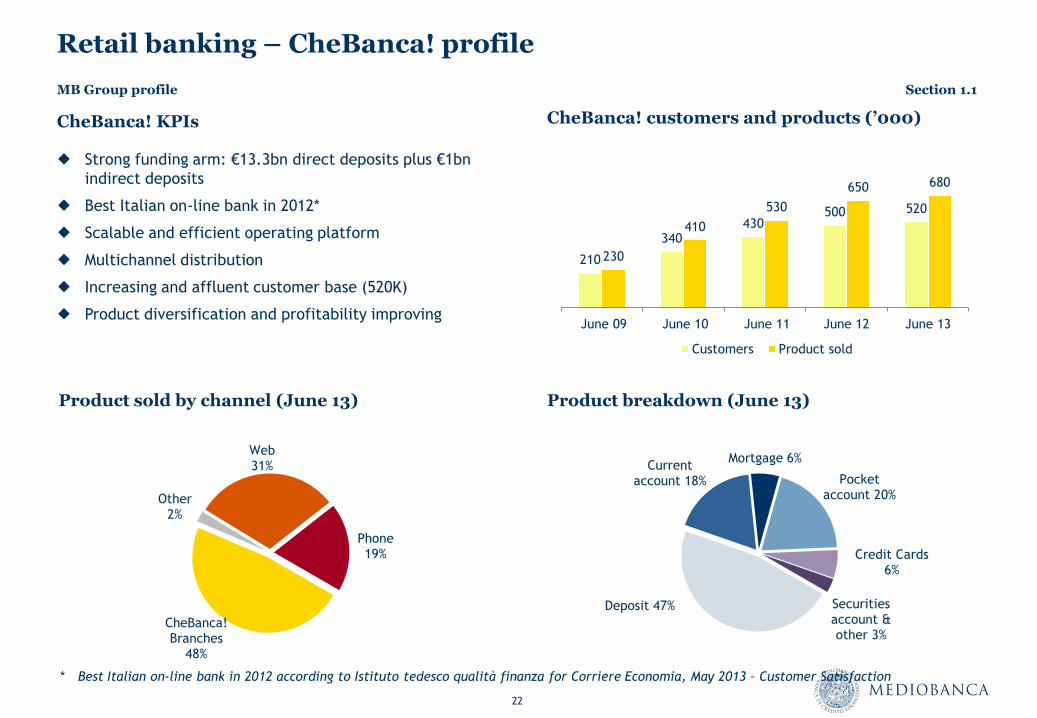
Retail banking – CheBanca! profile
CheBanca! KPIs
Product sold by channel (June 13) Product breakdown (June 13)
CheBanca! Branches
48%
Other 2%
Web 31%
Phone 19%
210
340 430
500 520
230
410
530
650 680
June 09 June 10 June 11 June 12 June 13
Customers Product sold
CheBanca! customers and products (’000)
Deposit 47%
Current account 18%
Mortgage 6%
Pocket account 20%
Credit Cards 6%
Securities account & other 3%
* Best Italian on-line bank in 2012 according to Istituto tedesco qualità finanza for Corriere Economia, May 2013 – Customer Satisfaction
Strong funding arm: €13.3bn direct deposits plus €1bn
indirect deposits
Best Italian on-line bank in 2012*
Scalable and efficient operating platform
Multichannel distribution
Increasing and affluent customer base (520K)
Product diversification and profitability improving
MB Group profile Section 1.1
23
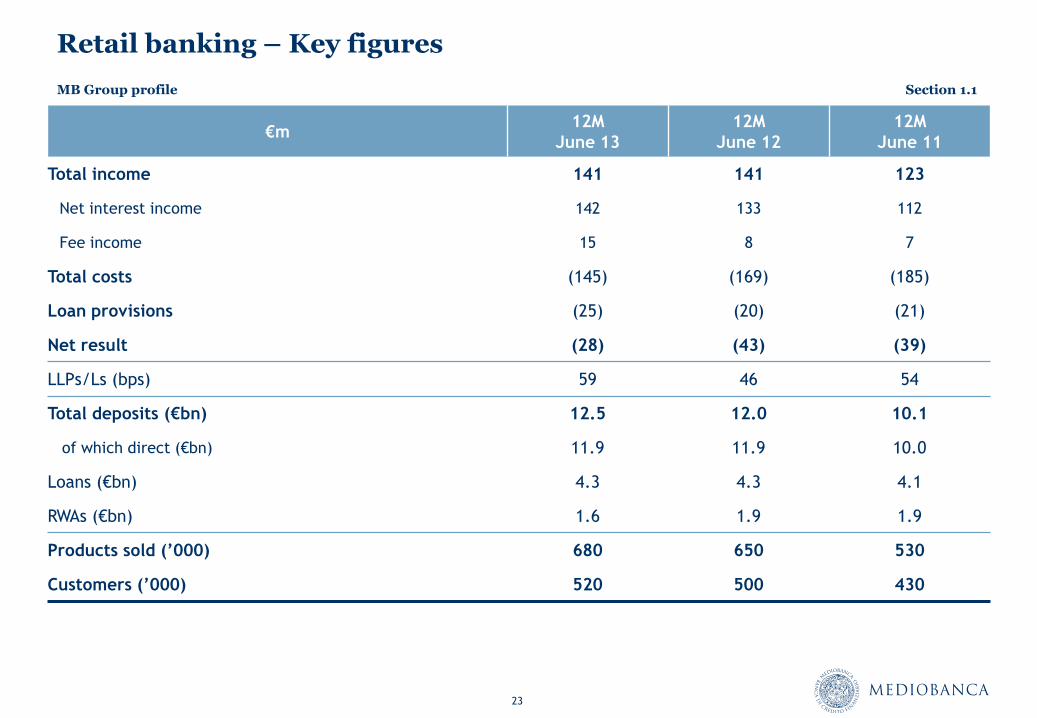
Retail banking – Key figures
€m 12M
June 13
12M
June 12
12M
June 11
Total income 141 141 123
Net interest income 142 133 112
Fee income 15 8 7
Total costs (145) (169) (185)
Loan provisions (25) (20) (21)
Net result (28) (43) (39)
LLPs/Ls (bps) 59 46 54
Total deposits (€bn) 12.5 12.0 10.1
of which direct (€bn) 11.9 11.9 10.0
Loans (€bn) 4.3 4.3 4.1
RWAs (€bn) 1.6 1.9 1.9
Products sold (’000) 680 650 530
Customers (’000) 520 500 430
MB Group profile Section 1.1
Strategic achievements in last decade
Section 1.2
25
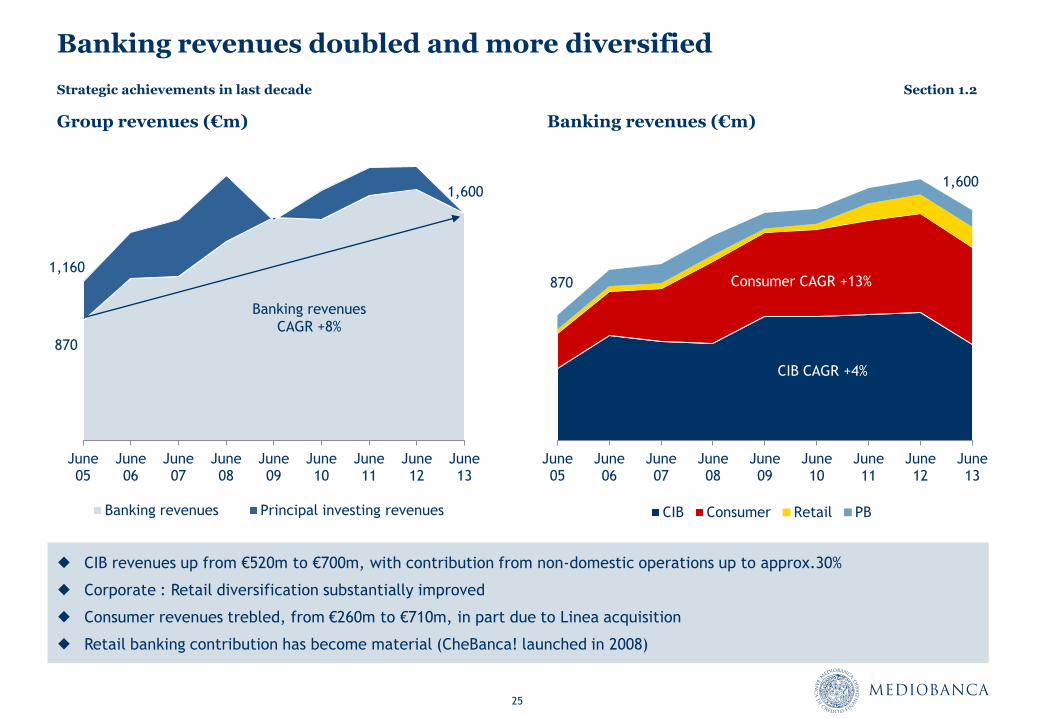
Banking revenues doubled and more diversified
June 05
June 06
June 07
June 08
June 09
June 10
June 11
June 12
June 13
CIB Consumer Retail PB
Group revenues (€m) Banking revenues (€m)
CIB revenues up from €520m to €700m, with contribution from non-domestic operations up to approx.30%
Corporate : Retail diversification substantially improved
Consumer revenues trebled, from €260m to €710m, in part due to Linea acquisition
Retail banking contribution has become material (CheBanca! launched in 2008)
CIB CAGR +4%
Consumer CAGR +13%
1,600
870
June 05
June 06
June 07
June 08
June 09
June 10
June 11
June 12
June 13
Banking revenues Principal investing revenues
1,600
870
Banking revenues
CAGR +8%
1,160
Strategic achievements in last decade Section 1.2
26
June 05
June 06
June 07
June 08
June 09
June 10
June 11
June 12
June 13
Corporate Leasing Consumer
Mortgages Private banking
June 05
June 06
June 07
June 08
June 09
June 10
June 11
June 12
June 13
MB bonds to institutionals MB bonds to retail
Retail deposits LTROs
Other
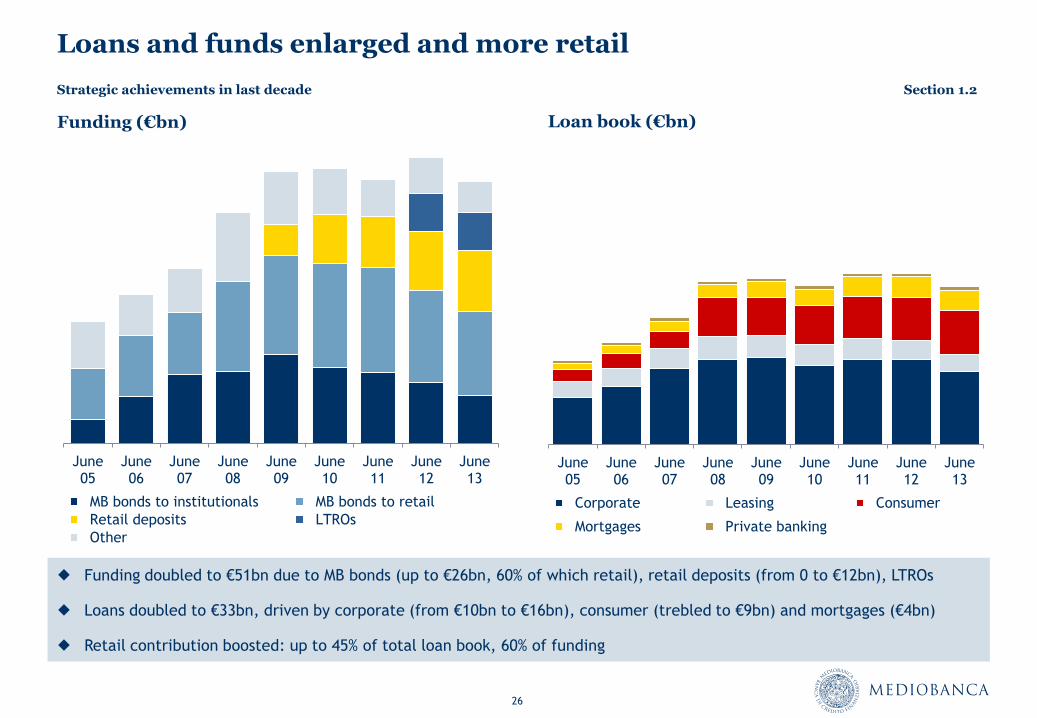
Loans and funds enlarged and more retail
Loan book (€bn) Funding (€bn)
Funding doubled to €51bn due to MB bonds (up to €26bn, 60% of which retail), retail deposits (from 0 to €12bn), LTROs
Loans doubled to €33bn, driven by corporate (from €10bn to €16bn), consumer (trebled to €9bn) and mortgages (€4bn)
Retail contribution boosted: up to 45% of total loan book, 60% of funding
Strategic achievements in last decade Section 1.2
27
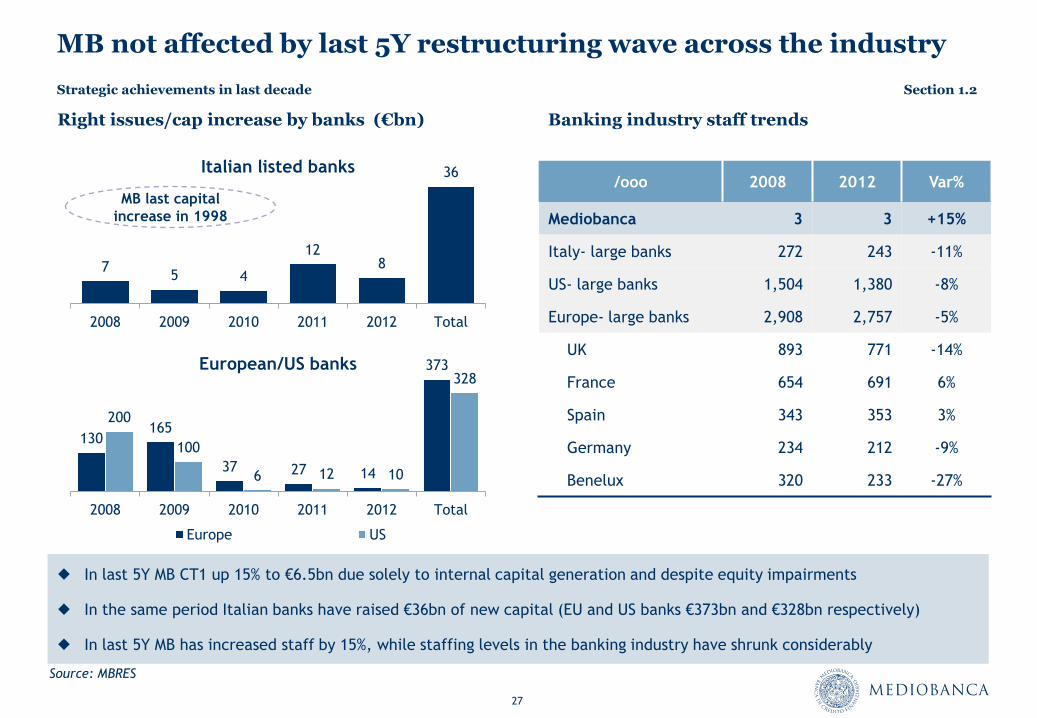
MB not affected by last 5Y restructuring wave across the industry
Banking industry staff trends Right issues/cap increase by banks (€bn)
/ooo 2008 2012 Var%
Mediobanca 3 3 +15%
Italy- large banks 272 243 -11%
US- large banks 1,504 1,380 -8%
Europe- large banks 2,908 2,757 -5%
UK 893 771 -14%
France 654 691 6%
Spain 343 353 3%
Germany 234 212 -9%
Benelux 320 233 -27%
In last 5Y MB CT1 up 15% to €6.5bn due solely to internal capital generation and despite equity impairments
In the same period Italian banks have raised €36bn of new capital (EU and US banks €373bn and €328bn respectively)
In last 5Y MB has increased staff by 15%, while staffing levels in the banking industry have shrunk considerably
Source: MBRES
7 5 4
12 8
36
2008 2009 2010 2011 2012 Total
Italian listed banks
130 165
37 27 14
373
200
100
6 12 10
328
2008 2009 2010 2011 2012 Total
European/US banks
Europe US
MB last capital
increase in 1998
Strategic achievements in last decade Section 1.2
28
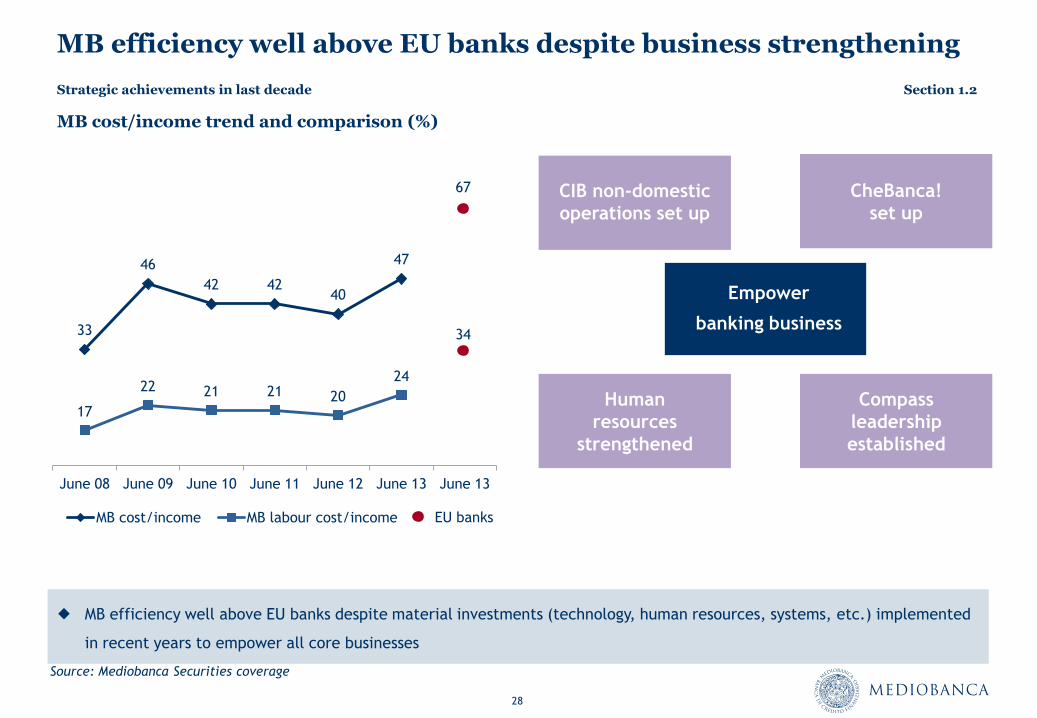
MB efficiency well above EU banks despite business strengthening
Source: Mediobanca Securities coverage
MB cost/income trend and comparison (%)
33
46
42 42 40
47
17
22 21 21 20
24
June 08 June 09 June 10 June 11 June 12 June 13 June 13
MB cost/income MB labour cost/income
34
EU banks
67
Strategic achievements in last decade Section 1.2
CIB non-domestic
operations set up
CheBanca!
set up
Compass
leadership
established
Human
resources
strengthened
Empower
banking business
MB efficiency well above EU banks despite material investments (technology, human resources, systems, etc.) implemented
in recent years to empower all core businesses
29
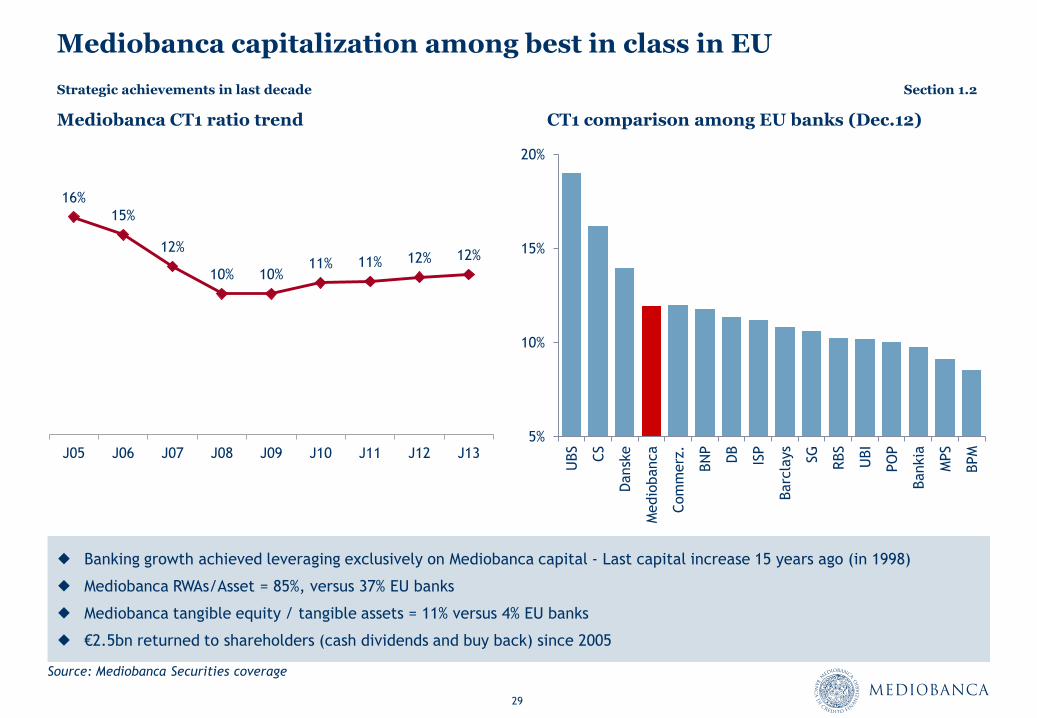
Mediobanca capitalization among best in class in EU
Mediobanca CT1 ratio trend CT1 comparison among EU banks (Dec.12)
Banking growth achieved leveraging exclusively on Mediobanca capital - Last capital increase 15 years ago (in 1998)
Mediobanca RWAs/Asset = 85%, versus 37% EU banks
Mediobanca tangible equity / tangible assets = 11% versus 4% EU banks
€2.5bn returned to shareholders (cash dividends and buy back) since 2005
16%
15%
12%
10% 10% 11% 11% 12% 12%
J05 J06 J07 J08 J09 J10 J11 J12 J13 5%
10%
15%
20%
UBS
CS
Dansk
e
Medio
banca
Com
merz
.
BN
P
DB
ISP
Barc
lays
SG
RBS
UBI
PO
P
Bankia
MPS
BPM
Source: Mediobanca Securities coverage
Strategic achievements in last decade Section 1.2
30
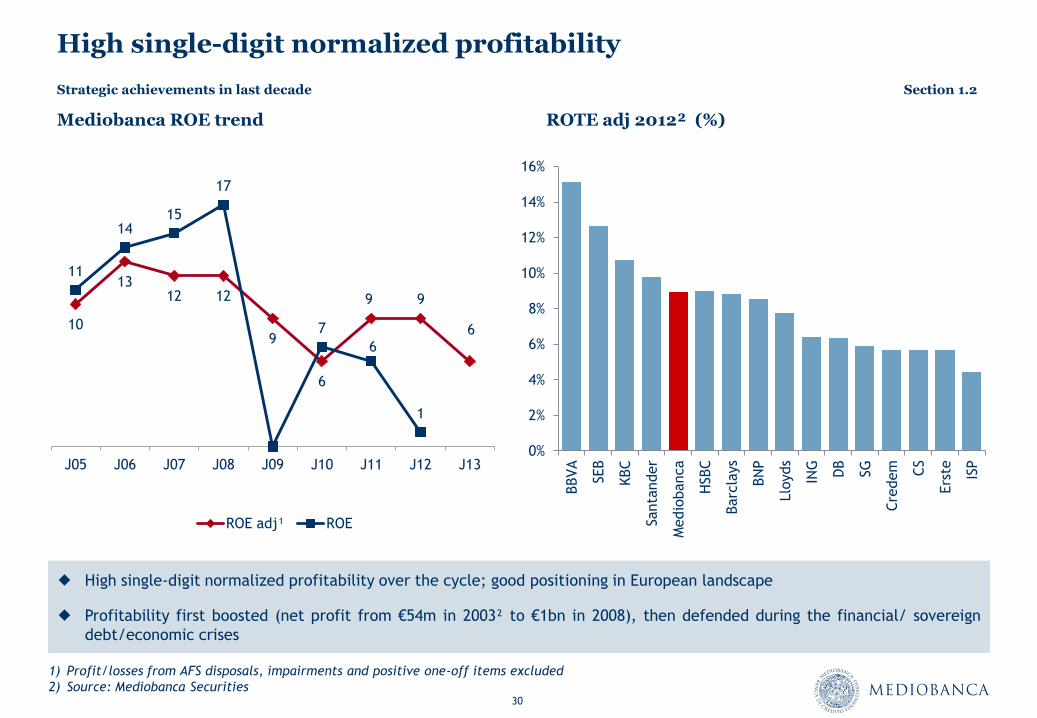
High single-digit normalized profitability
Mediobanca ROE trend ROTE adj 2012² (%)
High single-digit normalized profitability over the cycle; good positioning in European landscape
Profitability first boosted (net profit from €54m in 2003² to €1bn in 2008), then defended during the financial/ sovereign
debt/economic crises
1) Profit/losses from AFS disposals, impairments and positive one-off items excluded
2) Source: Mediobanca Securities
10
13 12 12
9
6
9 9
6
11
14 15
17
7
6
1
J05 J06 J07 J08 J09 J10 J11 J12 J13
ROE adj¹ ROE
0%
2%
4%
6%
8%
10%
12%
14%
16%
BBVA
SEB
KBC
Santa
nder
Medio
banca
HSBC
Barc
lays
BN
P
Llo
yds
ING
DB
SG
Cre
dem
CS
Ers
te
ISP
Strategic achievements in last decade Section 1.2

Developments in governance
Section 1.3
32
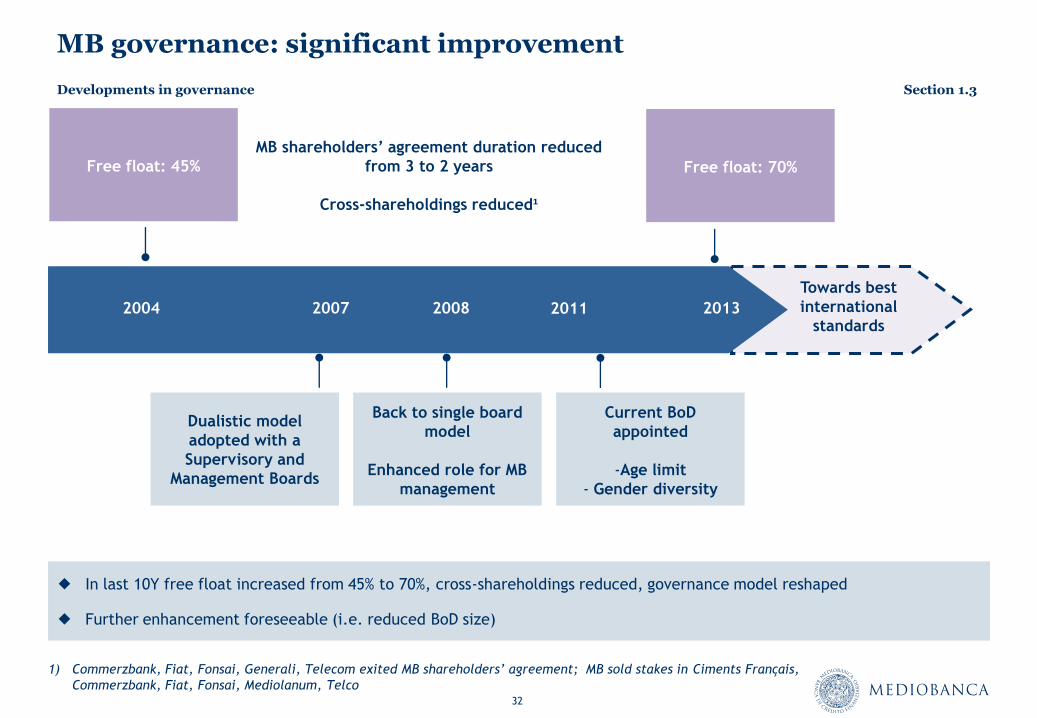
MB governance: significant improvement
Back to single board
model
Enhanced role for MB
management
Current BoD
appointed
-Age limit
- Gender diversity
Free float: 45%
2004 2007
Towards best
international
standards 2008 2013
Dualistic model
adopted with a
Supervisory and
Management Boards
Developments in governance Section 1.3
MB shareholders’ agreement duration reduced
from 3 to 2 years
Cross-shareholdings reduced¹
2011
In last 10Y free float increased from 45% to 70%, cross-shareholdings reduced, governance model reshaped
Further enhancement foreseeable (i.e. reduced BoD size)
Free float: 70%
1) Commerzbank, Fiat, Fonsai, Generali, Telecom exited MB shareholders’ agreement; MB sold stakes in Ciments Français,
Commerzbank, Fiat, Fonsai, Mediolanum, Telco
33
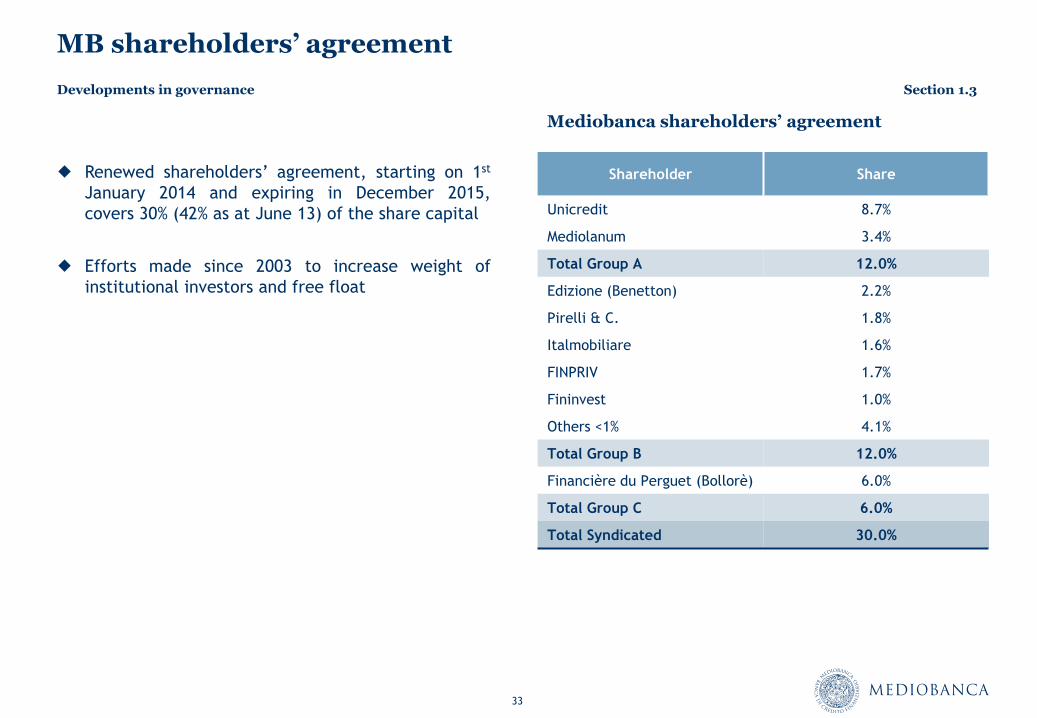
MB shareholders’ agreement
Mediobanca shareholders’ agreement
Renewed shareholders’ agreement, starting on 1st
January 2014 and expiring in December 2015,
covers 30% (42% as at June 13) of the share capital
Efforts made since 2003 to increase weight of
institutional investors and free float
Shareholder Share
Unicredit 8.7%
Mediolanum 3.4%
Total Group A 12.0%
Edizione (Benetton) 2.2%
Pirelli & C. 1.8%
Italmobiliare 1.6%
FINPRIV 1.7%
Fininvest 1.0%
Others <1% 4.1%
Total Group B 12.0%
Financière du Perguet (Bollorè) 6.0%
Total Group C 6.0%
Total Syndicated 30.0%
Developments in governance Section 1.3
Business Plan 14-16 guidelines and targets
Section 1.4
35
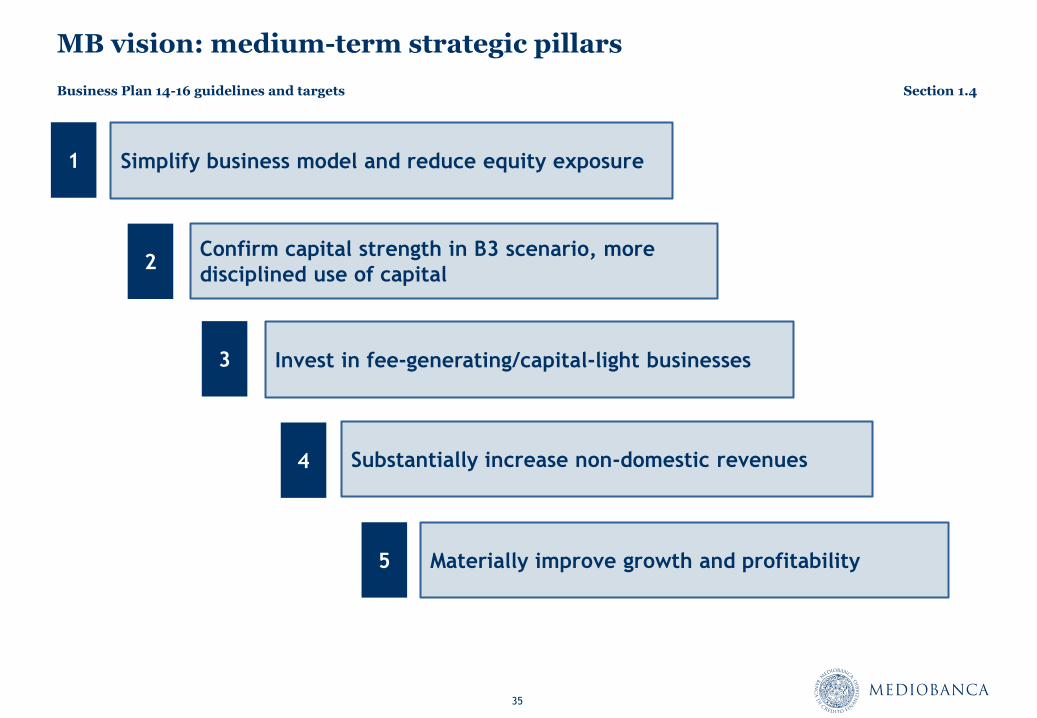
MB vision: medium-term strategic pillars
Simplify business model and reduce equity exposure
Invest in fee-generating/capital-light businesses
Confirm capital strength in B3 scenario, more
disciplined use of capital
Substantially increase non-domestic revenues
Materially improve growth and profitability
1
2
3
4
5
Business Plan 14-16 guidelines and targets Section 1.4
36
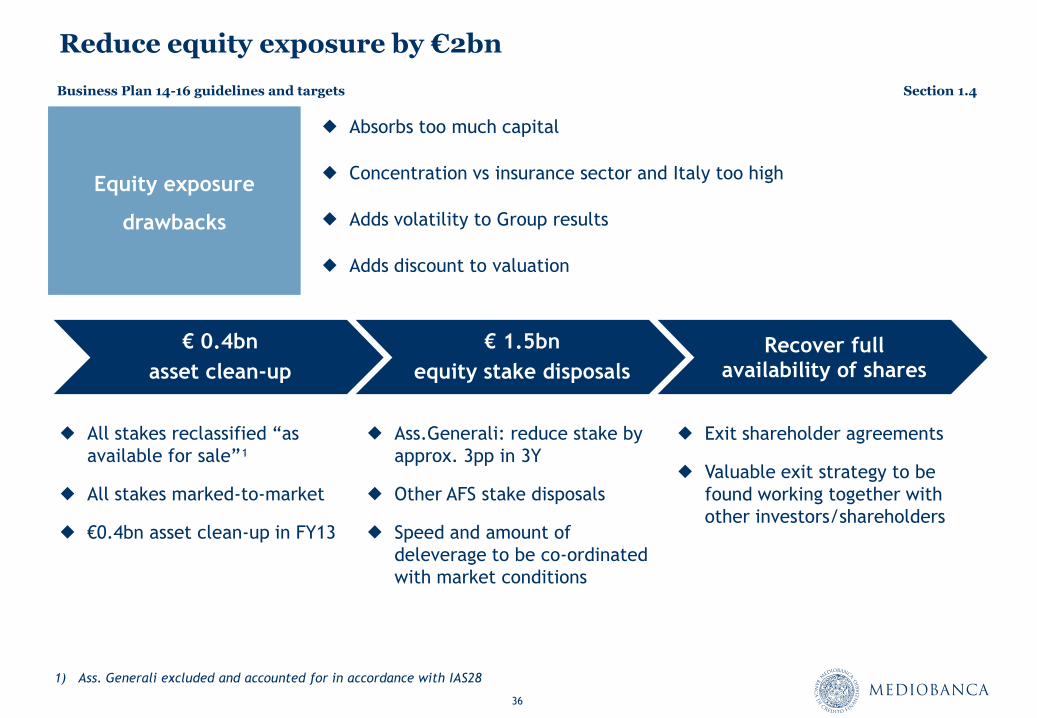
Reduce equity exposure by €2bn
Absorbs too much capital
Concentration vs insurance sector and Italy too high
Adds volatility to Group results
Adds discount to valuation
All stakes reclassified “as
available for sale”¹
All stakes marked-to-market
€0.4bn asset clean-up in FY13
Ass.Generali: reduce stake by
approx. 3pp in 3Y
Other AFS stake disposals
Speed and amount of
deleverage to be co-ordinated
with market conditions
Equity exposure
drawbacks
Exit shareholder agreements
Valuable exit strategy to be
found working together with
other investors/shareholders
€ 0.4bn
asset clean-up
€ 1.5bn
equity stake disposals
Recover full availability of shares
1) Ass. Generali excluded and accounted for in accordance with IAS28
Business Plan 14-16 guidelines and targets Section 1.4
37
56.5
53
7 60 -3.5
-2 +3.5 58 -2
FY13 RWAs B2 FY13 RWAs B3 FY16 RWAs B3
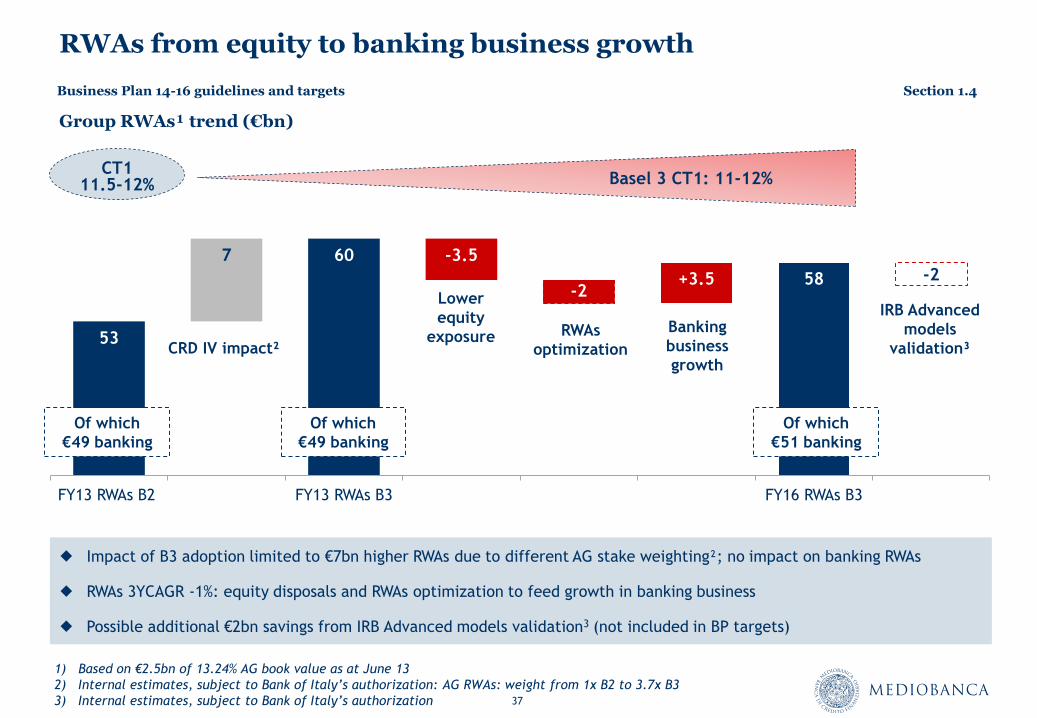
RWAs from equity to banking business growth
Group RWAs¹ trend (€bn)
Impact of B3 adoption limited to €7bn higher RWAs due to different AG stake weighting²; no impact on banking RWAs
RWAs 3YCAGR -1%: equity disposals and RWAs optimization to feed growth in banking business
Possible additional €2bn savings from IRB Advanced models validation3 (not included in BP targets)
1) Based on €2.5bn of 13.24% AG book value as at June 13
2) Internal estimates, subject to Bank of Italy’s authorization: AG RWAs: weight from 1x B2 to 3.7x B3
3) Internal estimates, subject to Bank of Italy’s authorization
CRD IV impact²
Lower
equity
exposure RWAs
optimization
Banking
business
growth
Of which
€49 banking
Of which
€49 banking
Of which
€51 banking
IRB Advanced
models
validation³
CT1 11.5-12% Basel 3 CT1: 11-12%
Business Plan 14-16 guidelines and targets Section 1.4
38
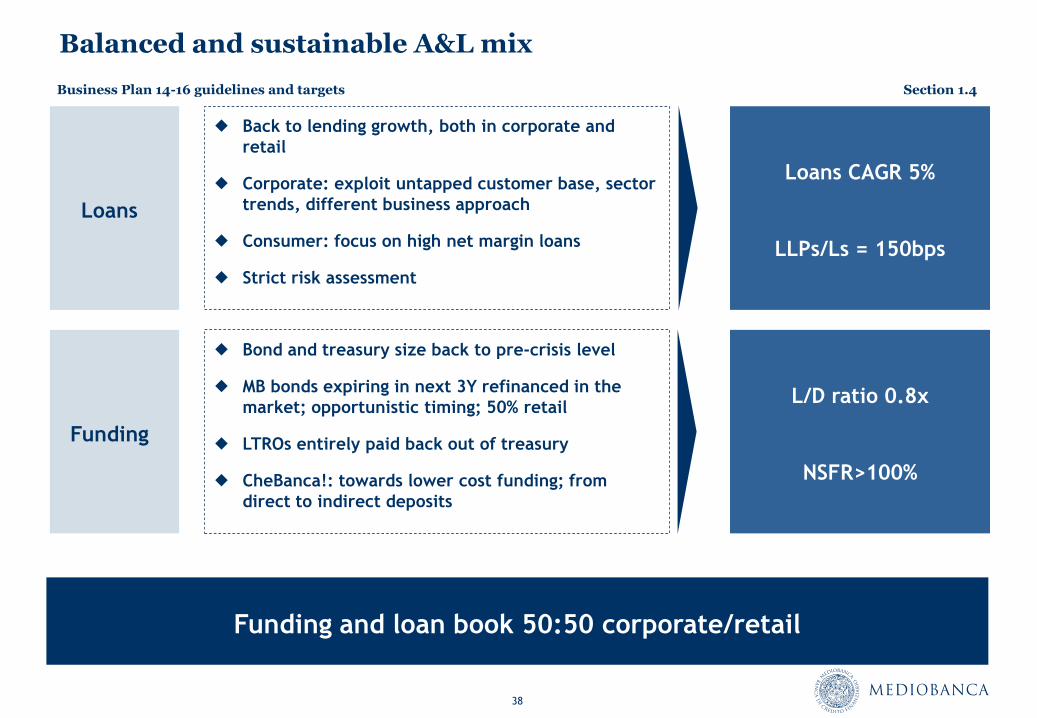
Balanced and sustainable A&L mix
Funding
Bond and treasury size back to pre-crisis level
MB bonds expiring in next 3Y refinanced in the
market; opportunistic timing; 50% retail
LTROs entirely paid back out of treasury
CheBanca!: towards lower cost funding; from
direct to indirect deposits
L/D ratio 0.8x
NSFR>100%
Loans CAGR 5%
LLPs/Ls = 150bps
Loans
Back to lending growth, both in corporate and
retail
Corporate: exploit untapped customer base, sector
trends, different business approach
Consumer: focus on high net margin loans
Strict risk assessment
Funding and loan book 50:50 corporate/retail
Business Plan 14-16 guidelines and targets Section 1.4
39
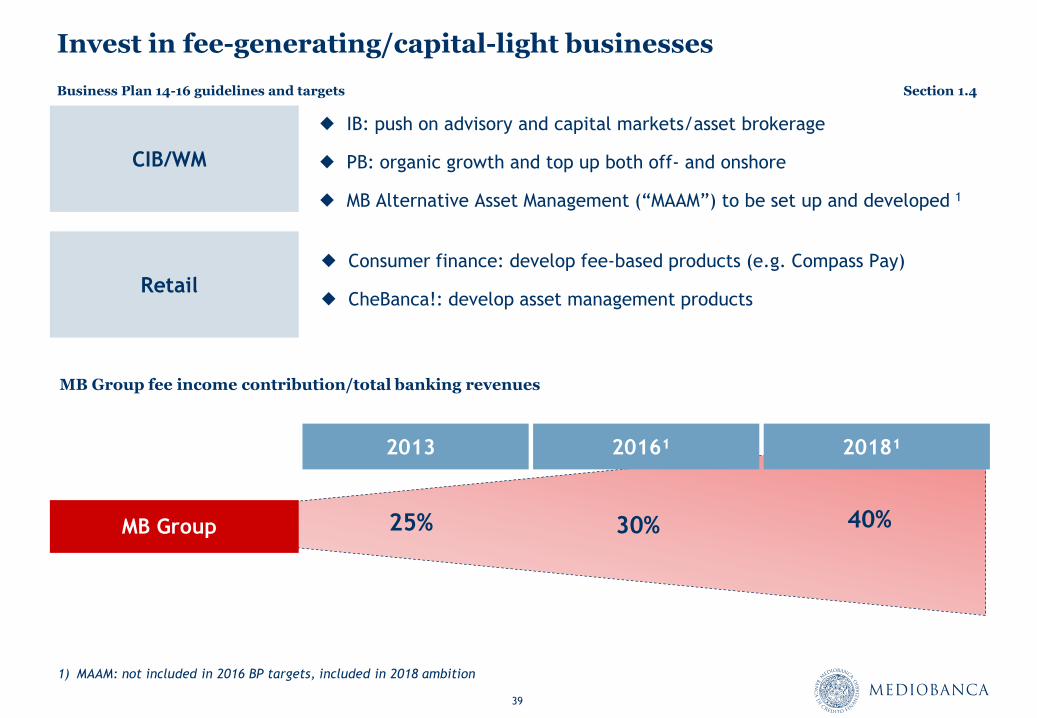
Invest in fee-generating/capital-light businesses
IB: push on advisory and capital markets/asset brokerage
PB: organic growth and top up both off- and onshore
MB Alternative Asset Management (“MAAM”) to be set up and developed 1
CIB/WM
Retail
Consumer finance: develop fee-based products (e.g. Compass Pay)
CheBanca!: develop asset management products
2013
25%
2016¹
30%
2018¹
40% MB Group
MB Group fee income contribution/total banking revenues
1) MAAM: not included in 2016 BP targets, included in 2018 ambition
Business Plan 14-16 guidelines and targets Section 1.4
40
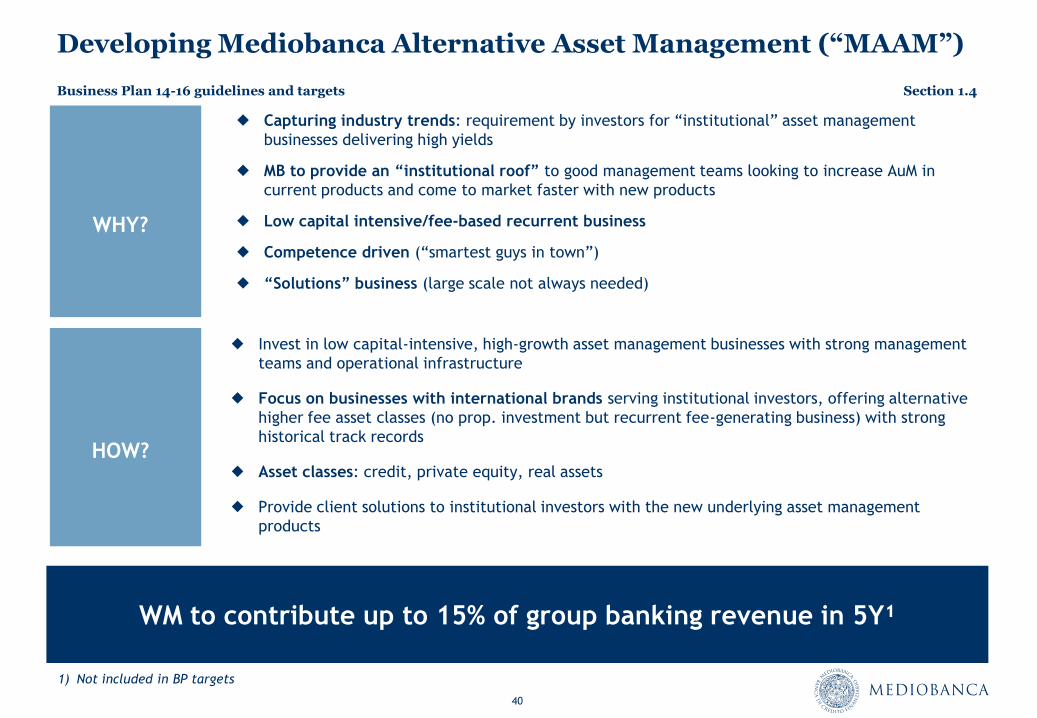
Developing Mediobanca Alternative Asset Management (“MAAM”)
1) Not included in BP targets
WM to contribute up to 15% of group banking revenue in 5Y¹
WHY?
HOW?
Capturing industry trends: requirement by investors for “institutional” asset management
businesses delivering high yields
MB to provide an “institutional roof” to good management teams looking to increase AuM in
current products and come to market faster with new products
Low capital intensive/fee-based recurrent business
Competence driven (“smartest guys in town”)
“Solutions” business (large scale not always needed)
Invest in low capital-intensive, high-growth asset management businesses with strong management
teams and operational infrastructure
Focus on businesses with international brands serving institutional investors, offering alternative
higher fee asset classes (no prop. investment but recurrent fee-generating business) with strong
historical track records
Asset classes: credit, private equity, real assets
Provide client solutions to institutional investors with the new underlying asset management
products
Business Plan 14-16 guidelines and targets Section 1.4
41
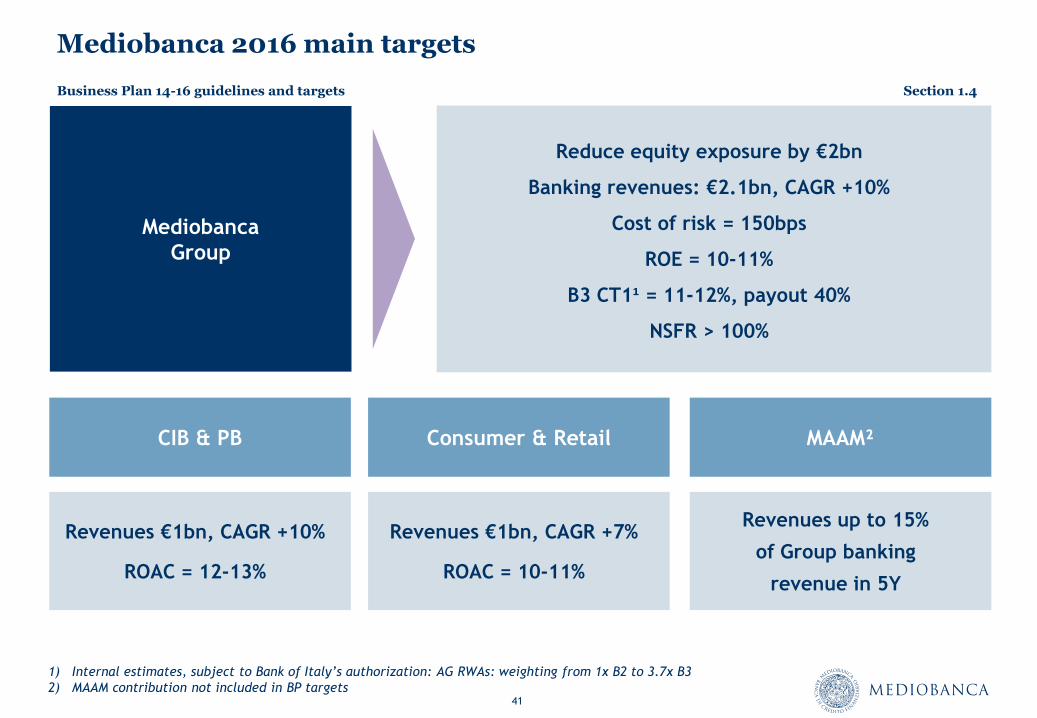
Mediobanca 2016 main targets
CIB & PB
Revenues €1bn, CAGR +10%
ROAC = 12-13%
MAAM²
Revenues up to 15%
of Group banking
revenue in 5Y
Consumer & Retail
Revenues €1bn, CAGR +7%
ROAC = 10-11%
Mediobanca
Group
Reduce equity exposure by €2bn
Banking revenues: €2.1bn, CAGR +10%
Cost of risk = 150bps
ROE = 10-11%
B3 CT1¹ = 11-12%, payout 40%
NSFR > 100%
1) Internal estimates, subject to Bank of Italy’s authorization: AG RWAs: weighting from 1x B2 to 3.7x B3
2) MAAM contribution not included in BP targets
Business Plan 14-16 guidelines and targets Section 1.4
Section 2
Corporate and Private Banking

Market positioning and strategy
Section 2.1
44
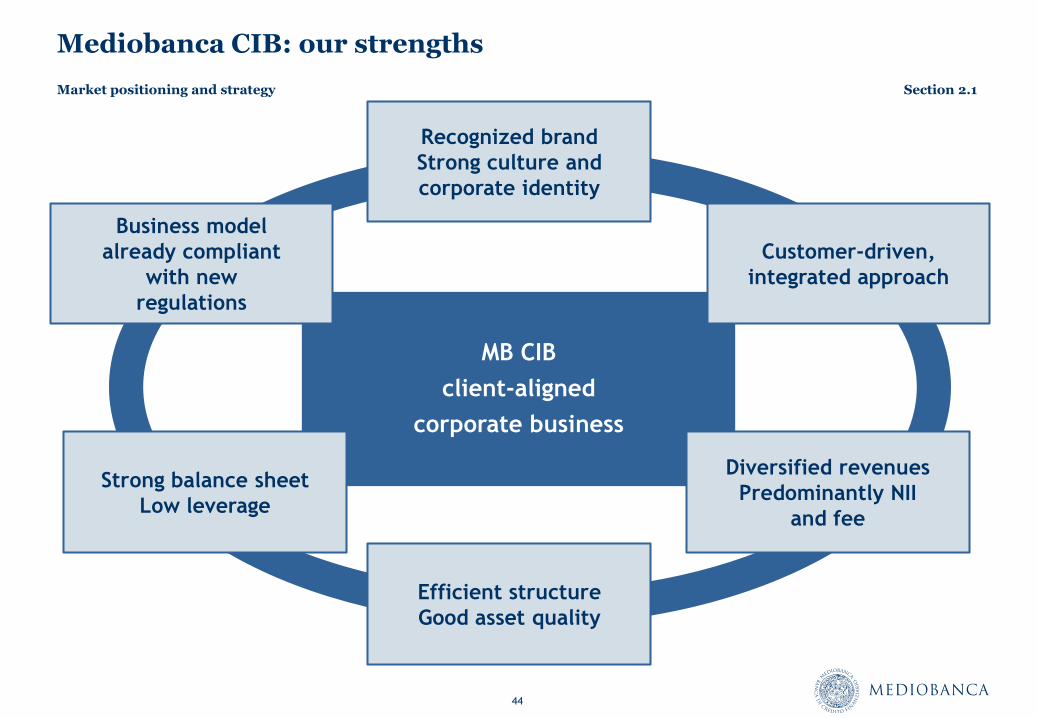
Mediobanca CIB: our strengths
MB CIB
client-aligned
corporate business
Recognized brand
Strong culture and
corporate identity
Customer-driven,
integrated approach
Diversified revenues
Predominantly NII
and fee
Efficient structure
Good asset quality
Strong balance sheet
Low leverage
Business model
already compliant
with new
regulations
Market positioning and strategy Section 2.1
45
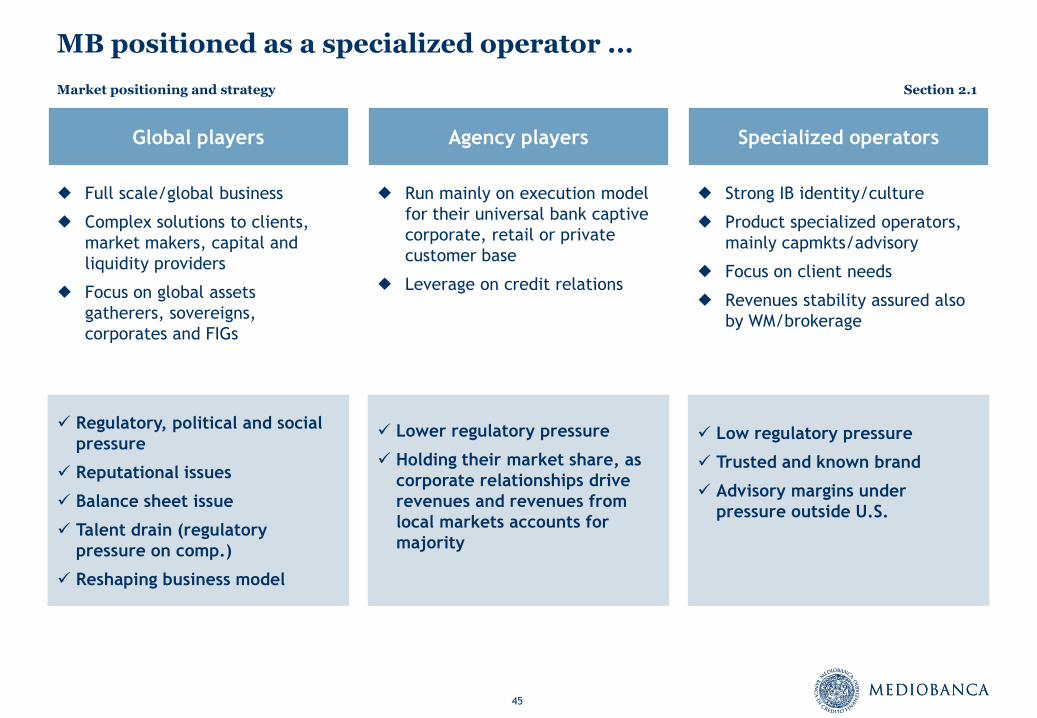
MB positioned as a specialized operator ...
Global players
Full scale/global business
Complex solutions to clients,
market makers, capital and
liquidity providers
Focus on global assets
gatherers, sovereigns,
corporates and FIGs
Agency players Specialized operators
Regulatory, political and social
pressure
Reputational issues
Balance sheet issue
Talent drain (regulatory
pressure on comp.)
Reshaping business model
Run mainly on execution model
for their universal bank captive
corporate, retail or private
customer base
Leverage on credit relations
Strong IB identity/culture
Product specialized operators,
mainly capmkts/advisory
Focus on client needs
Revenues stability assured also
by WM/brokerage
Low regulatory pressure
Trusted and known brand
Advisory margins under
pressure outside U.S.
Lower regulatory pressure
Holding their market share, as
corporate relationships drive
revenues and revenues from
local markets accounts for
majority
Market positioning and strategy Section 2.1
46
MEDIOBANCA
LAZARD
INVESTEC
ROTHSCHILD GREENHILL
EVERCORE -10%
0%
10%
20%
30%
40%
50%
60%
70%
80%
90%
100%
200 400 600 800 1,000 1,200
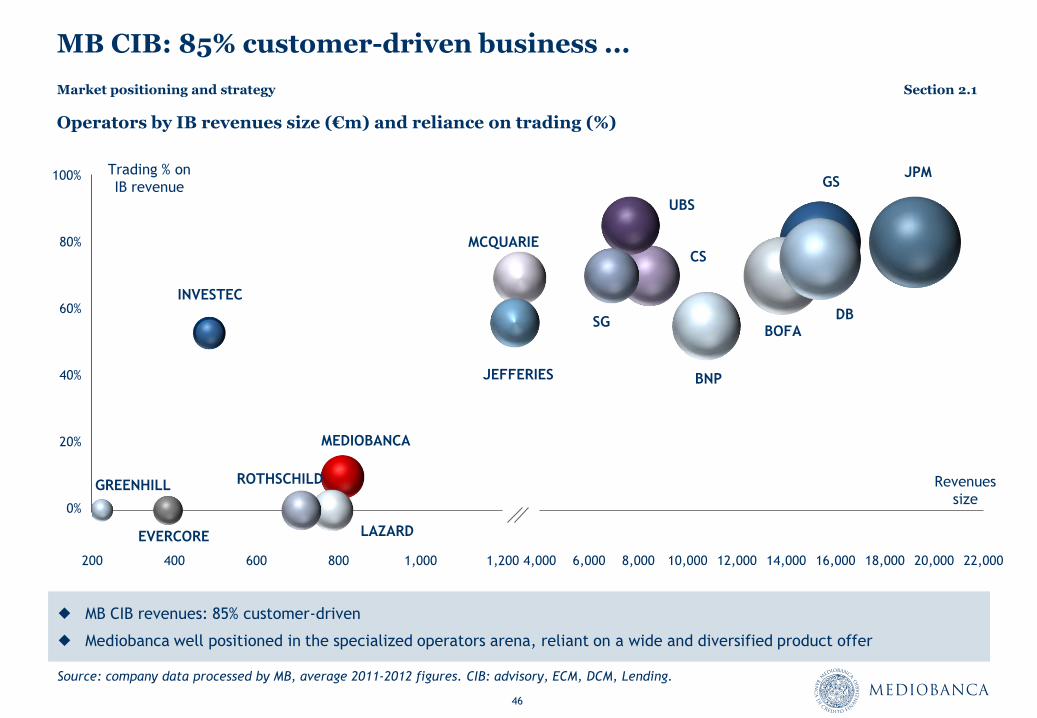
MB CIB: 85% customer-driven business ...
Source: company data processed by MB, average 2011-2012 figures. CIB: advisory, ECM, DCM, Lending.
Operators by IB revenues size (€m) and reliance on trading (%)
Trading % on
IB revenue
Revenues
size
MCQUARIE
100%
80%
60%
40%
20%
0%
MB CIB revenues: 85% customer-driven
Mediobanca well positioned in the specialized operators arena, reliant on a wide and diversified product offer
Market positioning and strategy Section 2.1
GS JPM
BOFA
CS
UBS
BNP
SG DB
4,000 6,000 8,000 10,000 12,000 14,000 16,000 18,000 20,000 22,000
JEFFERIES
47
MEDIOBANCA
LAZARD
INVESTEC
EVERCORE
GREENHILL
-10%
0%
10%
20%
30%
40%
50%
60%
70%
80%
90%
100%
200 400 600 800 1,000 1,200
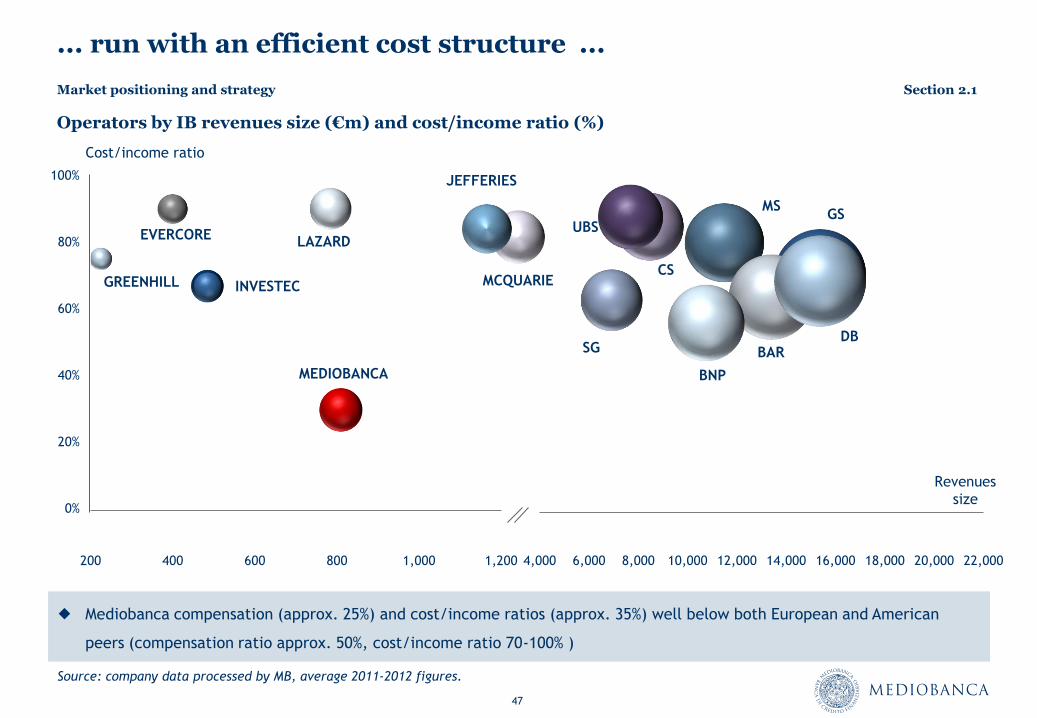
... run with an efficient cost structure ...
Source: company data processed by MB, average 2011-2012 figures.
GS MS
BAR
CS
UBS
BNP
SG DB
4,000 6,000 8,000 10,000 12,000 14,000 16,000 18,000 20,000 22,000
Operators by IB revenues size (€m) and cost/income ratio (%)
Cost/income ratio
MCQUARIE
100%
80%
60%
40%
20%
0%
Mediobanca compensation (approx. 25%) and cost/income ratios (approx. 35%) well below both European and American
peers (compensation ratio approx. 50%, cost/income ratio 70-100% )
Market positioning and strategy Section 2.1
Revenues
size
JEFFERIES
48
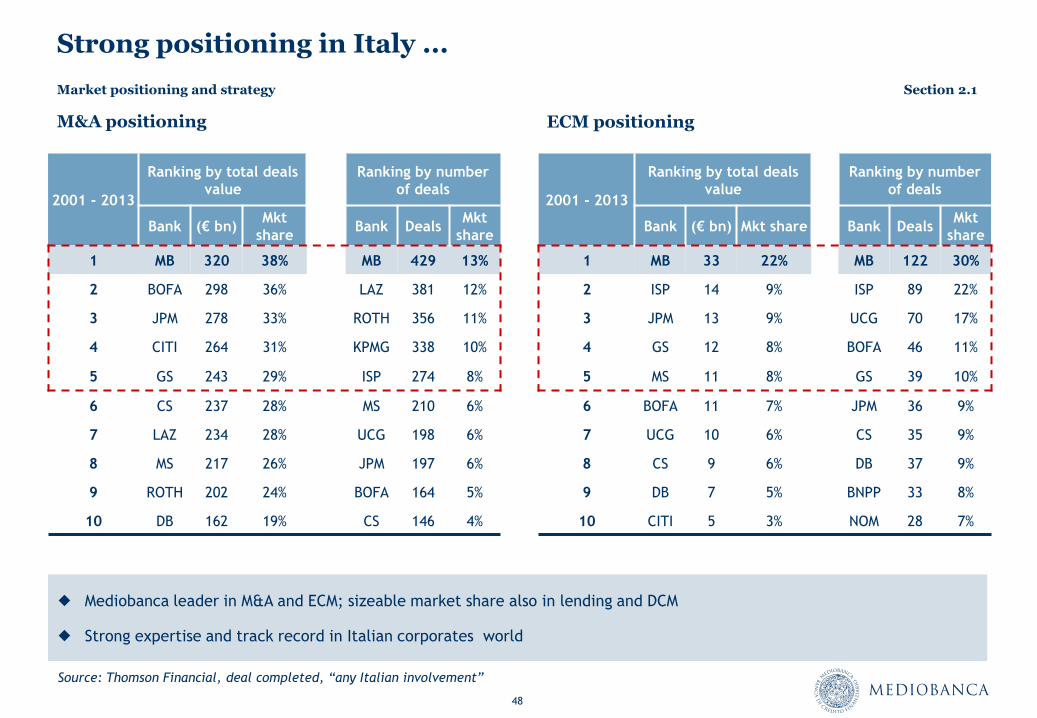
Strong positioning in Italy ...
ECM positioning M&A positioning
Mediobanca leader in M&A and ECM; sizeable market share also in lending and DCM
Strong expertise and track record in Italian corporates world
2001 - 2013
Ranking by total deals
value
Ranking by number
of deals
Bank (€ bn) Mkt
share Bank Deals
Mkt
share
1 MB 320 38% MB 429 13%
2 BOFA 298 36% LAZ 381 12%
3 JPM 278 33% ROTH 356 11%
4 CITI 264 31% KPMG 338 10%
5 GS 243 29% ISP 274 8%
6 CS 237 28% MS 210 6%
7 LAZ 234 28% UCG 198 6%
8 MS 217 26% JPM 197 6%
9 ROTH 202 24% BOFA 164 5%
10 DB 162 19% CS 146 4%
2001 - 2013
Ranking by total deals
value
Ranking by number
of deals
Bank (€ bn) Mkt share Bank Deals Mkt
share
1 MB 33 22% MB 122 30%
2 ISP 14 9% ISP 89 22%
3 JPM 13 9% UCG 70 17%
4 GS 12 8% BOFA 46 11%
5 MS 11 8% GS 39 10%
6 BOFA 11 7% JPM 36 9%
7 UCG 10 6% CS 35 9%
8 CS 9 6% DB 37 9%
9 DB 7 5% BNPP 33 8%
10 CITI 5 3% NOM 28 7%
Source: Thomson Financial, deal completed, “any Italian involvement”
Market positioning and strategy Section 2.1

49
… leveraged since 2004 on a European scale
London set up
Focus: capital markets
solutions, equity
research & sales
Istanbul set up
Focus: corporate
advisory
Paris set up
Focus: corporate
advisory and lending
Frankfurt and Madrid set up
Focus: corporate advisory and
lending
2004 2007
Empower MB
geographical
footprint
2008 2013
2014-16 Business Plan
Leading domestic positioning in CIB leveraged outside Italy since 2004, following customers’ international needs
Local client coverage and advisory execution; risk assessment and book keeping in Milan
Enhanced coverage of
existing branches
London as a “hub”
Mexico and China
2006
New York set up
Focus: brokerage
Market positioning and strategy Section 2.1
50
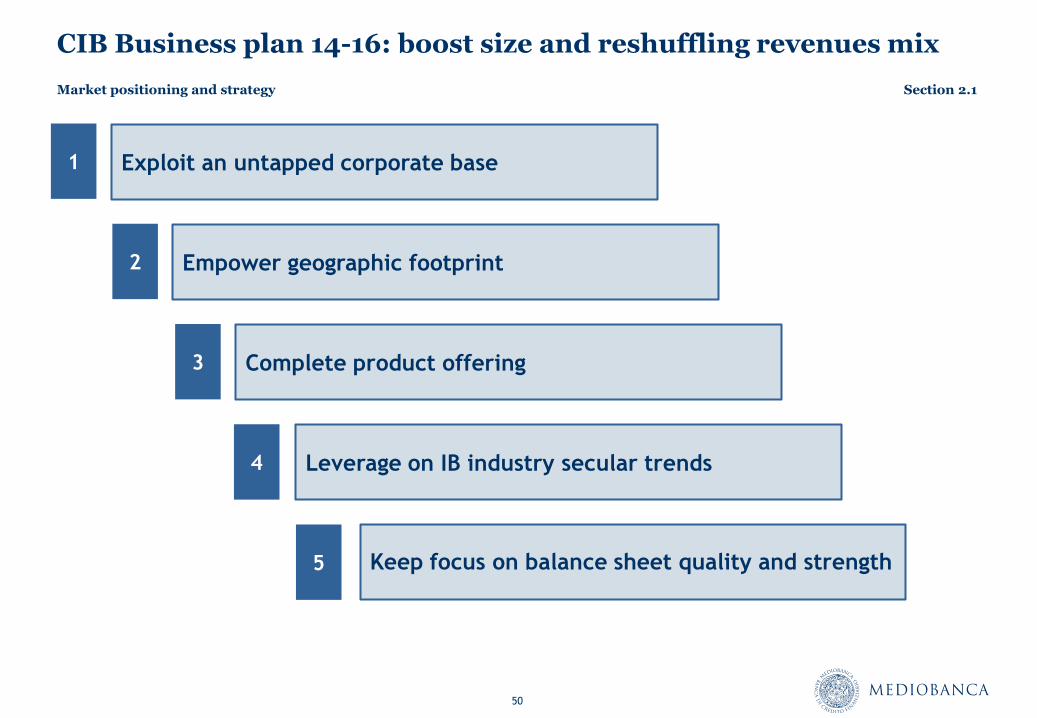
CIB Business plan 14-16: boost size and reshuffling revenues mix
Exploit an untapped corporate base
Leverage on IB industry secular trends
Complete product offering
Empower geographic footprint
Keep focus on balance sheet quality and strength
1
2
3
4
5
Market positioning and strategy Section 2.1
51
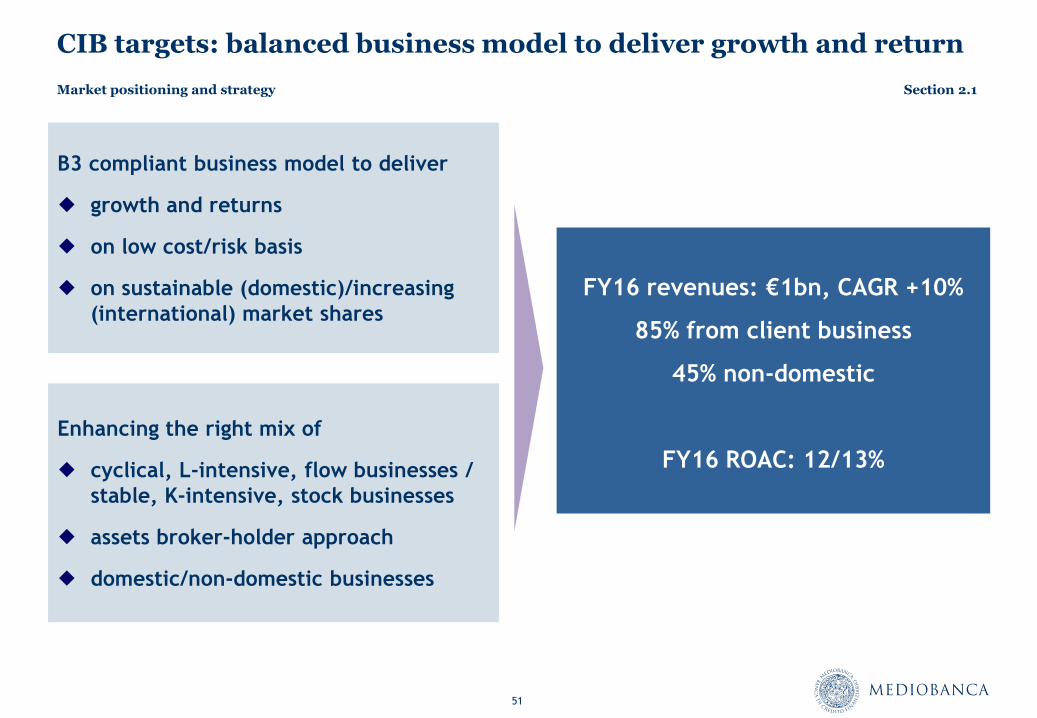
CIB targets: balanced business model to deliver growth and return
B3 compliant business model to deliver
growth and returns
on low cost/risk basis
on sustainable (domestic)/increasing
(international) market shares
Enhancing the right mix of
cyclical, L-intensive, flow businesses /
stable, K-intensive, stock businesses
assets broker-holder approach
domestic/non-domestic businesses
FY16 revenues: €1bn, CAGR +10%
85% from client business
45% non-domestic
FY16 ROAC: 12/13%
Market positioning and strategy Section 2.1
International operations
Section 2.2
53
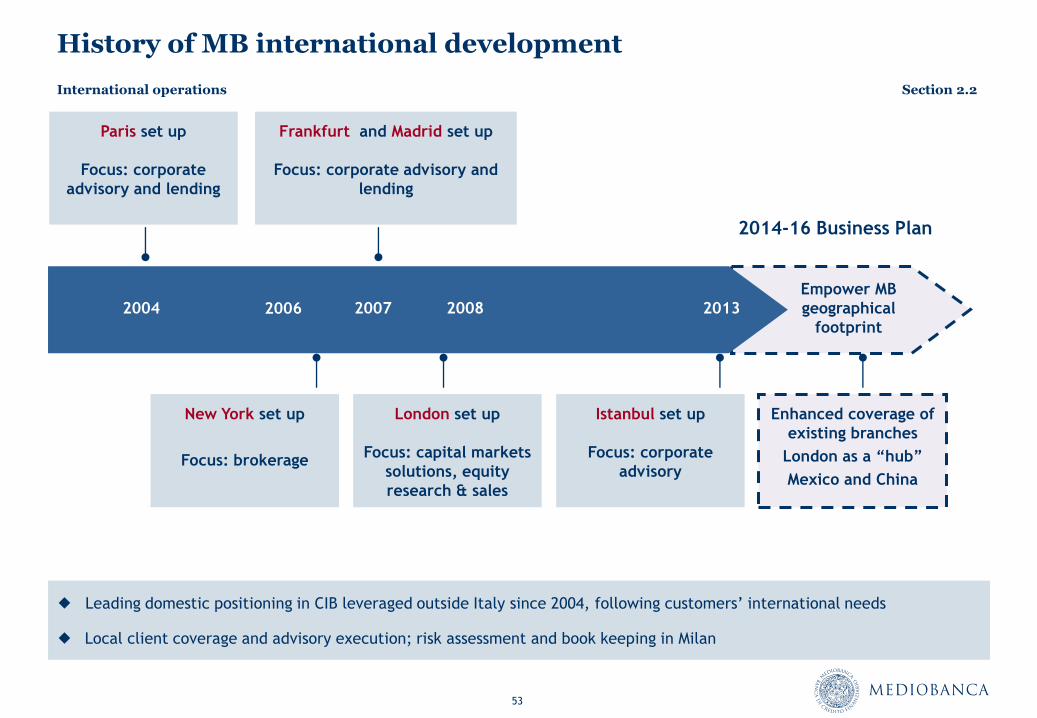
History of MB international development
London set up
Focus: capital markets
solutions, equity
research & sales
Istanbul set up
Focus: corporate
advisory
Paris set up
Focus: corporate
advisory and lending
Frankfurt and Madrid set up
Focus: corporate advisory and
lending
2004 2007
Empower MB
geographical
footprint
2008 2013
2014-16 Business Plan
Leading domestic positioning in CIB leveraged outside Italy since 2004, following customers’ international needs
Local client coverage and advisory execution; risk assessment and book keeping in Milan
Enhanced coverage of
existing branches
London as a “hub”
Mexico and China
2006
New York set up
Focus: brokerage
International operations Section 2.2
54
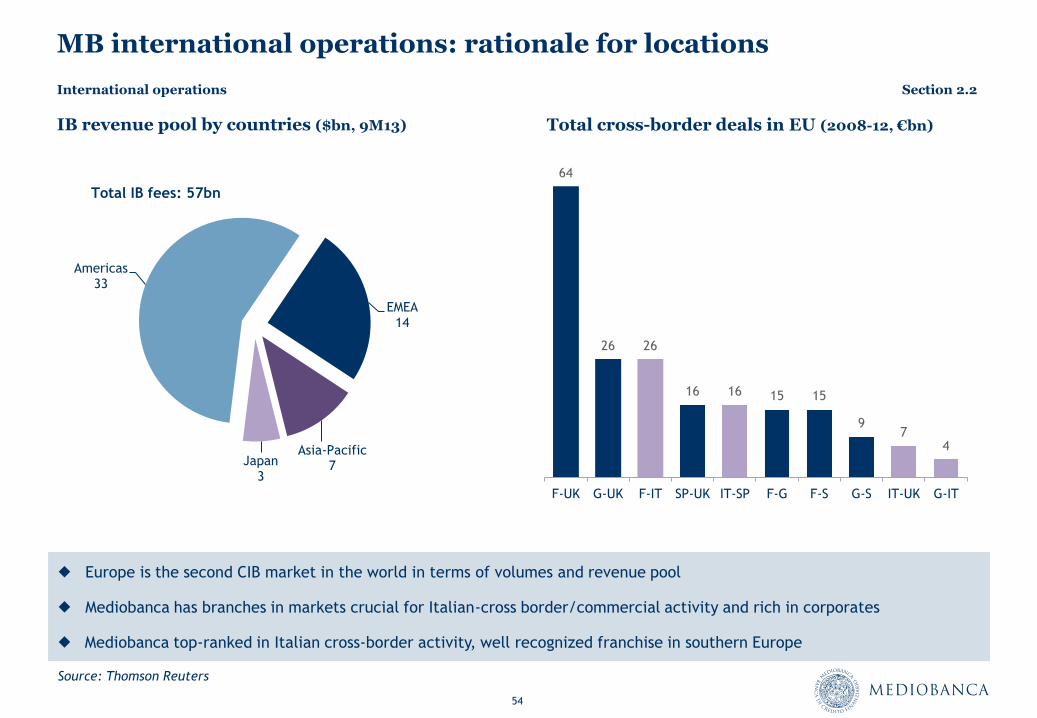
MB international operations: rationale for locations
Source: Thomson Reuters
IB revenue pool by countries ($bn, 9M13) Total cross-border deals in EU (2008-12, €bn)
64
26 26
16 16 15 15
9 7
4
F-UK G-UK F-IT SP-UK IT-SP F-G F-S G-S IT-UK G-IT
Europe is the second CIB market in the world in terms of volumes and revenue pool
Mediobanca has branches in markets crucial for Italian-cross border/commercial activity and rich in corporates
Mediobanca top-ranked in Italian cross-border activity, well recognized franchise in southern Europe
Americas 33
EMEA 14
Asia-Pacific 7 Japan
3
Total IB fees: 57bn
International operations Section 2.2
55
MB international CIB: a “pragmatic & differentiated” approach
Non-domestic countries largely covered by local IB and by bulge bracket firms
Core Europe: mature but very large corporate market in which MB has a sub-optimal market share
Even “small bites of the big cake” have material impact on the relatively small-size MB balance sheet
MB mission: to be recognized as an high-quality specialized operator (no league tables)
MB: customer-driven/tailor-made offering (solutions business vs flow business)
Good profiles-selective hirings possible given:
talents moving from bulge brackets to boutiques
strong MB brand, corporate culture and balance sheet
MB “flexibility” and entrepreneurial approach
International operations Section 2.2
56
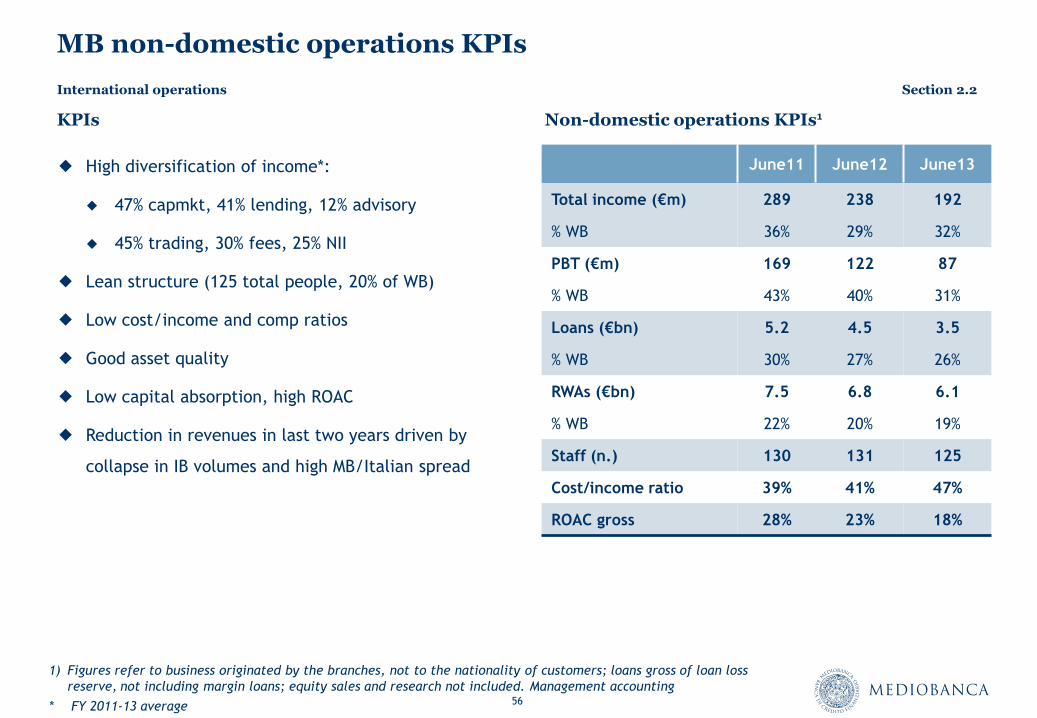
MB non-domestic operations KPIs
High diversification of income*:
47% capmkt, 41% lending, 12% advisory
45% trading, 30% fees, 25% NII
Lean structure (125 total people, 20% of WB)
Low cost/income and comp ratios
Good asset quality
Low capital absorption, high ROAC
Reduction in revenues in last two years driven by
collapse in IB volumes and high MB/Italian spread
Non-domestic operations KPIs¹
June11 June12 June13
Total income (€m) 289 238 192
% WB 36% 29% 32%
PBT (€m) 169 122 87
% WB 43% 40% 31%
Loans (€bn) 5.2 4.5 3.5
% WB 30% 27% 26%
RWAs (€bn) 7.5 6.8 6.1
% WB 22% 20% 19%
Staff (n.) 130 131 125
Cost/income ratio 39% 41% 47%
ROAC gross 28% 23% 18%
KPIs
1) Figures refer to business originated by the branches, not to the nationality of customers; loans gross of loan loss
reserve, not including margin loans; equity sales and research not included. Management accounting
* FY 2011-13 average
International operations Section 2.2
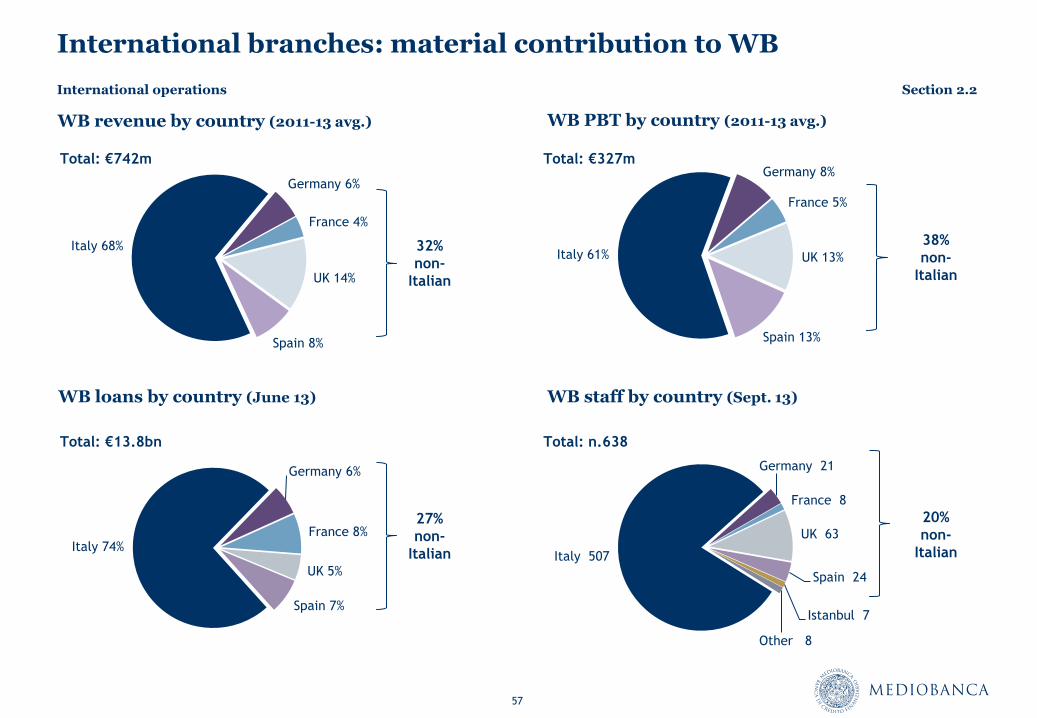
57
Italy 61%
Germany 8%
France 5%
UK 13%
Spain 13%
Italy 68%
Germany 6%
France 4%
UK 14%
Spain 8%
International branches: material contribution to WB
WB PBT by country (2011-13 avg.) WB revenue by country (2011-13 avg.)
Total: €742m
WB loans by country (June 13)
Italy 74%
Germany 6%
France 8%
UK 5%
Spain 7%
WB staff by country (Sept. 13)
Italy 507
Germany 21
France 8
UK 63
Spain 24
Istanbul 7
Other 8
Total: €327m
Total: €13.8bn Total: n.638
32%
non-
Italian
38%
non-
Italian
27%
non-
Italian
20%
non-
Italian
International operations Section 2.2
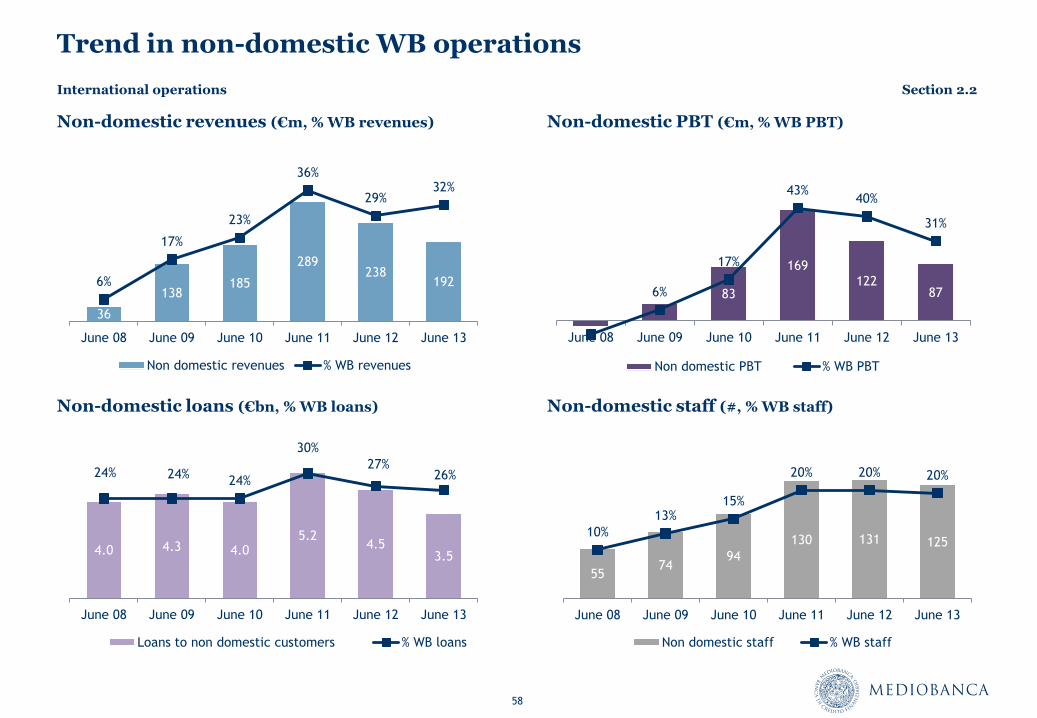
58
Trend in non-domestic WB operations
Non-domestic revenues (€m, % WB revenues)
Non-domestic PBT (€m, % WB PBT)
Non-domestic loans (€bn, % WB loans)
Non-domestic staff (#, % WB staff)
36
138 185
289 238
192 6%
17%
23%
36%
29% 32%
June 08 June 09 June 10 June 11 June 12 June 13
Non domestic revenues % WB revenues
83
169 122
87 6%
17%
43% 40%
31%
June 08 June 09 June 10 June 11 June 12 June 13
Non domestic PBT % WB PBT
4.0 4.3 4.0 5.2
4.5 3.5
24% 24% 24%
30%
27% 26%
June 08 June 09 June 10 June 11 June 12 June 13
Loans to non domestic customers % WB loans
55 74
94
130 131 125 10%
13% 15%
20% 20% 20%
June 08 June 09 June 10 June 11 June 12 June 13
Non domestic staff % WB staff
International operations Section 2.2
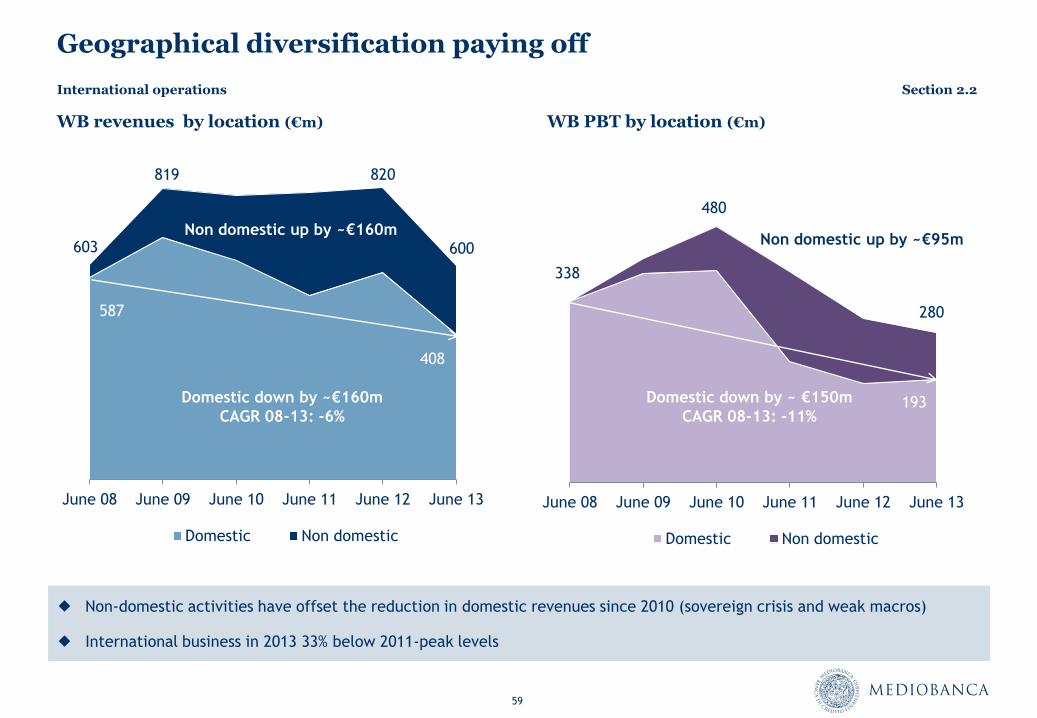
59
Geographical diversification paying off
WB revenues by location (€m) WB PBT by location (€m)
June 08 June 09 June 10 June 11 June 12 June 13
Domestic Non domestic
Domestic down by ~€160m
CAGR 08-13: -6%
Non domestic up by ~€160m 603 600
819 820
June 08 June 09 June 10 June 11 June 12 June 13
Domestic Non domestic
Non-domestic activities have offset the reduction in domestic revenues since 2010 (sovereign crisis and weak macros)
International business in 2013 33% below 2011-peak levels
338
280
480
Domestic down by ~ €150m
CAGR 08-13: -11%
Non domestic up by ~€95m
408
587
193
International operations Section 2.2
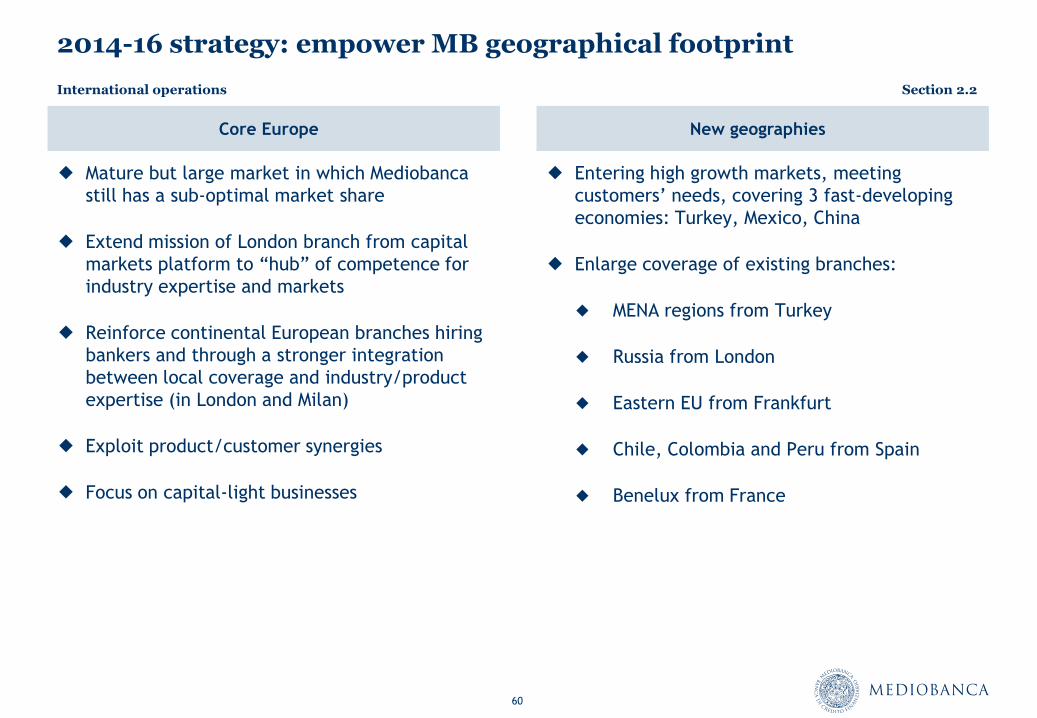
60
2014-16 strategy: empower MB geographical footprint
Entering high growth markets, meeting
customers’ needs, covering 3 fast-developing
economies: Turkey, Mexico, China
Enlarge coverage of existing branches:
MENA regions from Turkey
Russia from London
Eastern EU from Frankfurt
Chile, Colombia and Peru from Spain
Benelux from France
Mature but large market in which Mediobanca
still has a sub-optimal market share
Extend mission of London branch from capital
markets platform to “hub” of competence for
industry expertise and markets
Reinforce continental European branches hiring
bankers and through a stronger integration
between local coverage and industry/product
expertise (in London and Milan)
Exploit product/customer synergies
Focus on capital-light businesses
Core Europe New geographies
International operations Section 2.2
61
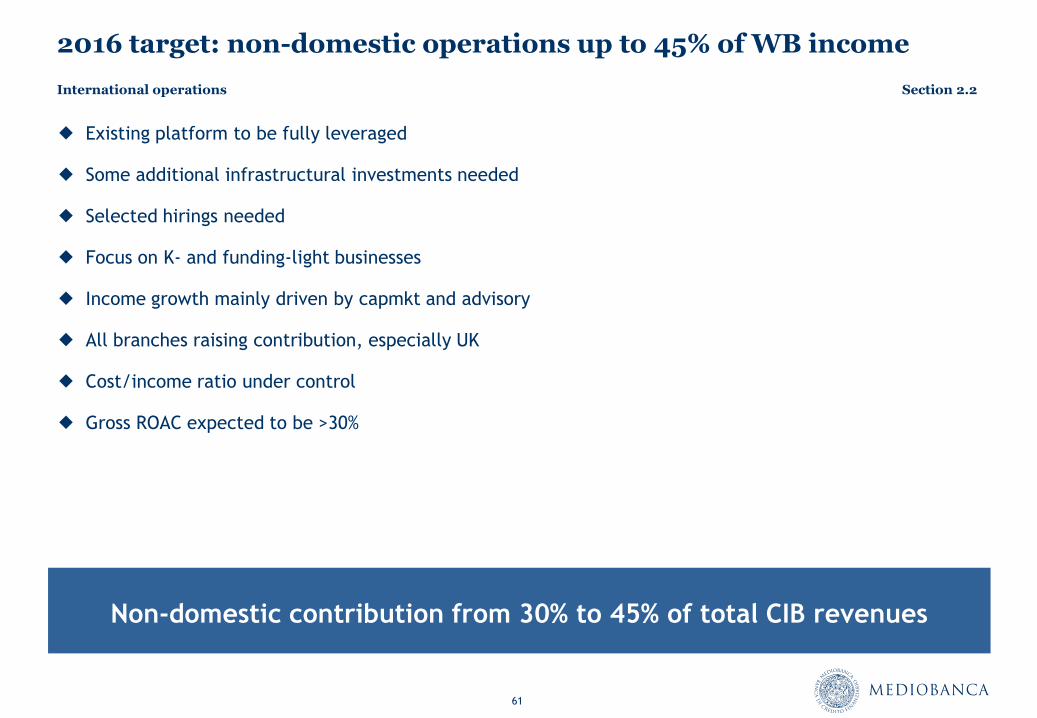
2016 target: non-domestic operations up to 45% of WB income
Existing platform to be fully leveraged
Some additional infrastructural investments needed
Selected hirings needed
Focus on K- and funding-light businesses
Income growth mainly driven by capmkt and advisory
All branches raising contribution, especially UK
Cost/income ratio under control
Gross ROAC expected to be >30%
Non-domestic contribution from 30% to 45% of total CIB revenues
International operations Section 2.2
Section 2.3
KPIs

63
Lending 40%
CapMkts 35%
M&A 25%
Trading 25%
NII 40%
Fees 35%
Wholesale banking
75% revenues customer-driven (NII+fees)
Good revenues diversification by :
geography: 32% non italian
K-light/heavy business: 40% NII, 35% fees, 25%
trading
product: fees well split among M&A (25%),
lending (40%) and Capmkt (35%)
Revenue by product (2011-13 avg.) KPIs
Italy 68%
Germany 6%
France 4%
UK 14%
Spain 8%
Revenue by country (2011-13 avg.)
Total: €742m
32%
non-
Italian
Total: €742m
Corporate loan book breakdown (June 13)
Italy 63%
Germany 5%
France 9%
UK 4%
Spain 7%
KPIs Section 2.3
64
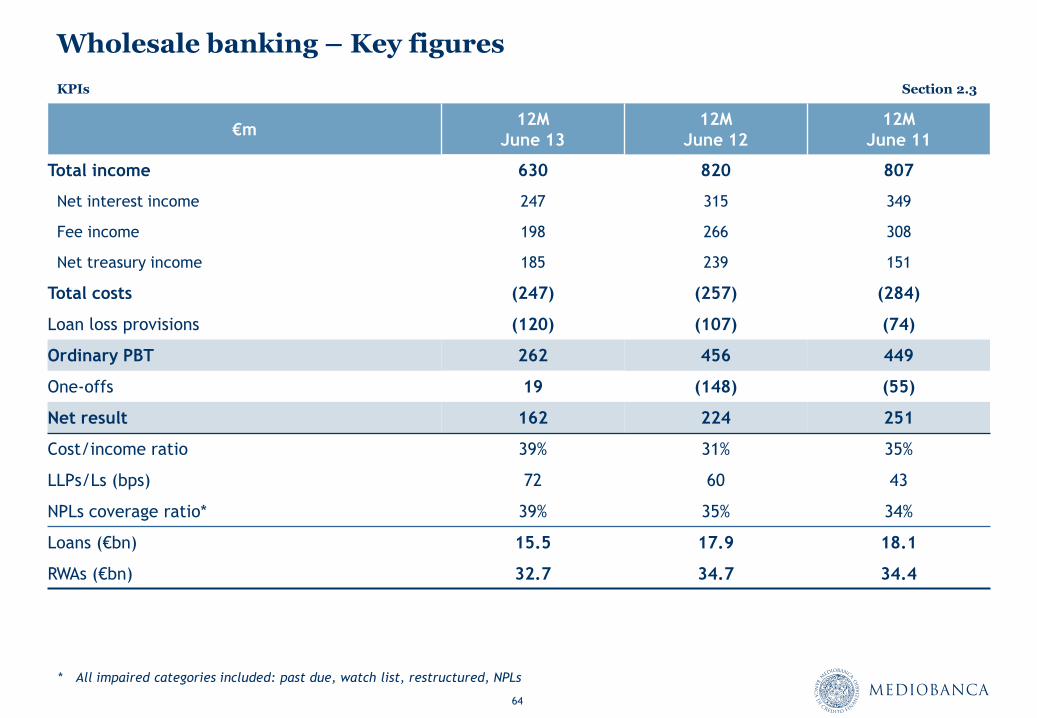
Wholesale banking – Key figures
€m 12M
June 13
12M
June 12
12M
June 11
Total income 630 820 807
Net interest income 247 315 349
Fee income 198 266 308
Net treasury income 185 239 151
Total costs (247) (257) (284)
Loan loss provisions (120) (107) (74)
Ordinary PBT 262 456 449
One-offs 19 (148) (55)
Net result 162 224 251
Cost/income ratio 39% 31% 35%
LLPs/Ls (bps) 72 60 43
NPLs coverage ratio* 39% 35% 34%
Loans (€bn) 15.5 17.9 18.1
RWAs (€bn) 32.7 34.7 34.4
* All impaired categories included: past due, watch list, restructured, NPLs
KPIs Section 2.3
65
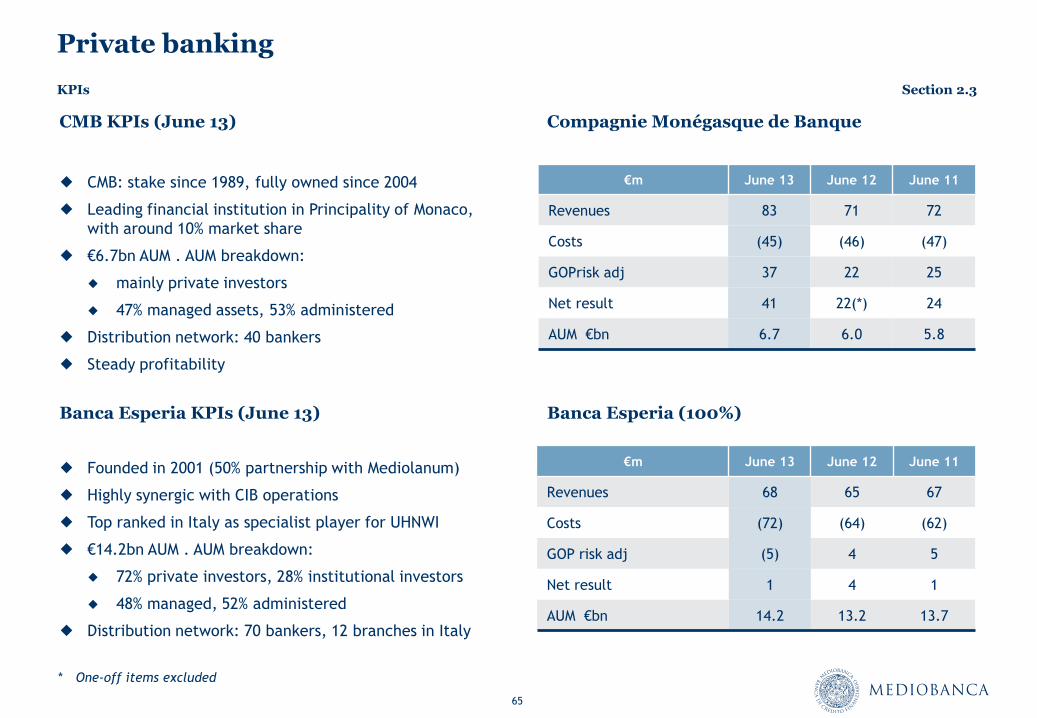
Private banking
Banca Esperia KPIs (June 13)
CMB KPIs (June 13)
Founded in 2001 (50% partnership with Mediolanum)
Highly synergic with CIB operations
Top ranked in Italy as specialist player for UHNWI
€14.2bn AUM . AUM breakdown:
72% private investors, 28% institutional investors
48% managed, 52% administered
Distribution network: 70 bankers, 12 branches in Italy
Banca Esperia (100%)
Compagnie Monégasque de Banque
CMB: stake since 1989, fully owned since 2004
Leading financial institution in Principality of Monaco,
with around 10% market share
€6.7bn AUM . AUM breakdown:
mainly private investors
47% managed assets, 53% administered
Distribution network: 40 bankers
Steady profitability
€m June 13 June 12 June 11
Revenues 68 65 67
Costs (72) (64) (62)
GOP risk adj (5) 4 5
Net result 1 4 1
AUM €bn 14.2 13.2 13.7
€m June 13 June 12 June 11
Revenues 83 71 72
Costs (45) (46) (47)
GOPrisk adj 37 22 25
Net result 41 22(*) 24
AUM €bn 6.7 6.0 5.8
KPIs Section 2.3
* One-off items excluded
66
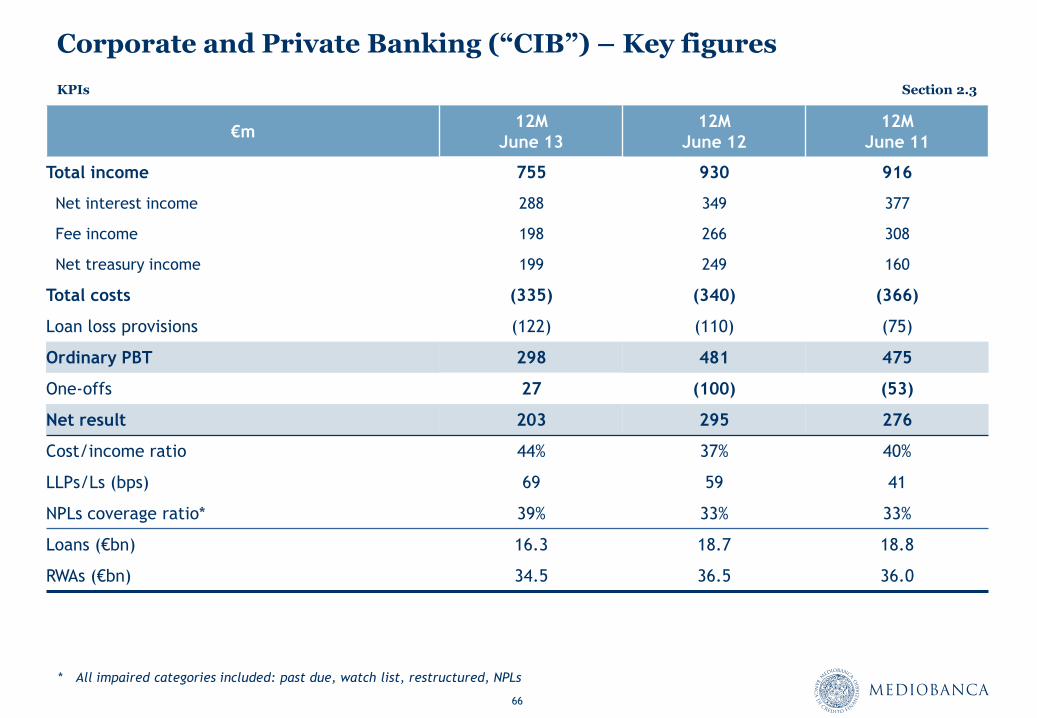
Corporate and Private Banking (“CIB”) – Key figures
€m 12M
June 13
12M
June 12
12M
June 11
Total income 755 930 916
Net interest income 288 349 377
Fee income 198 266 308
Net treasury income 199 249 160
Total costs (335) (340) (366)
Loan loss provisions (122) (110) (75)
Ordinary PBT 298 481 475
One-offs 27 (100) (53)
Net result 203 295 276
Cost/income ratio 44% 37% 40%
LLPs/Ls (bps) 69 59 41
NPLs coverage ratio* 39% 33% 33%
Loans (€bn) 16.3 18.7 18.8
RWAs (€bn) 34.5 36.5 36.0
* All impaired categories included: past due, watch list, restructured, NPLs
KPIs Section 2.3

Section 3
Principal Investing

68
2.2 2.3 2.5 2.5
2.5 1.8 1.5 1.5
June 11 June 12 June 13 Dec 13
AG Other stakes
Principal Investing portfolio
Equity exposure: book value (€bn, Dec 13) Equity BV: trend (€bn) and incidence to CT1 (%)
Telco 0.1
RCS 0.1
Ass.Generali 2.5
Sintonia 0.3
Atlantia 0.1
Pirelli 0.3
Other stakes 0.6
Total BV €4.0bn
Principal investing portfolio (€4.0bn) includes:
€2.5bn equity holding (13.24% stake) in Ass. Generali (insurance), equity accounted
€1.5bn AFS equity stakes, marked to market, classified as “available for sale”
3Y Business Plan 14/16: reduce equity exposure (book value) by €1.5bn in 3Y
78% 66% 65% 62%
4.0 4.2
4.7
4.0
Principal Investing Section 3
69
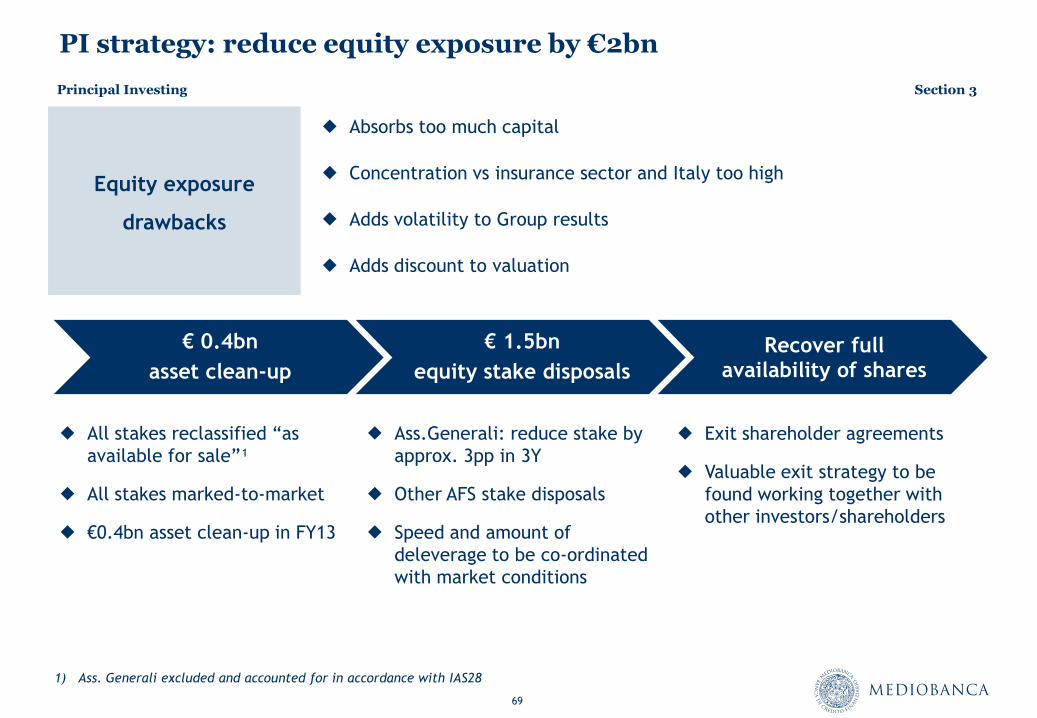
PI strategy: reduce equity exposure by €2bn
Absorbs too much capital
Concentration vs insurance sector and Italy too high
Adds volatility to Group results
Adds discount to valuation
All stakes reclassified “as
available for sale”¹
All stakes marked-to-market
€0.4bn asset clean-up in FY13
Ass.Generali: reduce stake by
approx. 3pp in 3Y
Other AFS stake disposals
Speed and amount of
deleverage to be co-ordinated
with market conditions
Equity exposure
drawbacks
Exit shareholder agreements
Valuable exit strategy to be
found working together with
other investors/shareholders
€ 0.4bn
asset clean-up
€ 1.5bn
equity stake disposals
Recover full availability of shares
1) Ass. Generali excluded and accounted for in accordance with IAS28
Principal Investing Section 3

70
AFS 1.6
AFS 1.3
AG 2.5
AG 2.5
AFS 1.5
AG 2.5
0.2
AG unrealized plus 0.3
AG unrealized
plusv 1
Book value 0.4
RCS aucap 0.1
Mkt val 227 AG
BV change 0.1
P&L gains 0.1
BV June13 AFS disposals AFS investments
AG BV increase BV Dec13 (mkt perf. excluded)
Mkt performance
BV Dec 13
Disposals
0.5
€500m equity sold in 2H13, €150m in capital gains realized
All full-year budgeted stake disposals completed within the first six months: €500m equity stakes sold
€150m in capital gains realized: €60m Telco,€40m Gemina/Atlantia, €29m Saks, etc.
Total value unchanged due to €215m AFS market value increase, €69m RCS rights issue and €73 AG BV increase
Sales
(BV) Stakes
€ mln June
13
Dec
13
Gemina 68 7.9% -
Atlantia 62 - 0.7%
Saks 55 3.5% -
Telco/Telefonica 35 11.6% 7.3%
Other 180 n.m. n.m.
Total 400
€bn
AFS equity stakes, market valued AG stake, equity accounted
NAV: 4.4
NAV: 5.1
Principal Investing Section 3
71
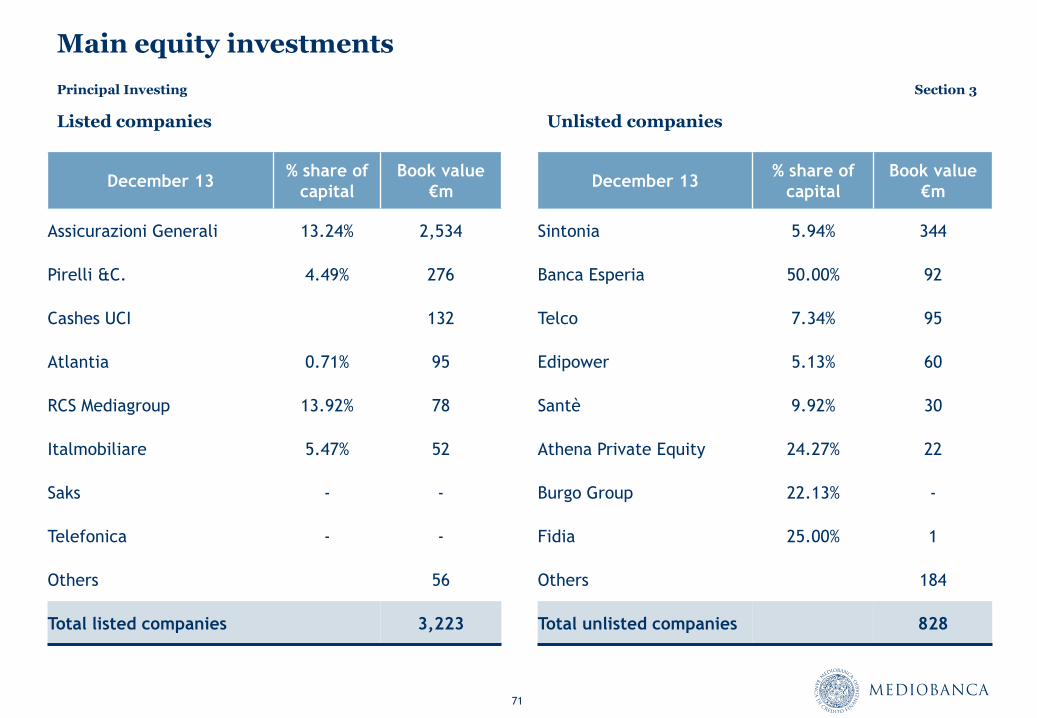
Main equity investments
Listed companies Unlisted companies
December 13 % share of
capital
Book value
€m
Assicurazioni Generali 13.24% 2,534
Pirelli &C. 4.49% 276
Cashes UCI 132
Atlantia 0.71% 95
RCS Mediagroup 13.92% 78
Italmobiliare 5.47% 52
Saks - -
Telefonica - -
Others 56
Total listed companies 3,223
December 13 % share of
capital
Book value
€m
Sintonia 5.94% 344
Banca Esperia 50.00% 92
Telco 7.34% 95
Edipower 5.13% 60
Santè 9.92% 30
Athena Private Equity 24.27% 22
Burgo Group 22.13% -
Fidia 25.00% 1
Others 184
Total unlisted companies 828
Principal Investing Section 3
72
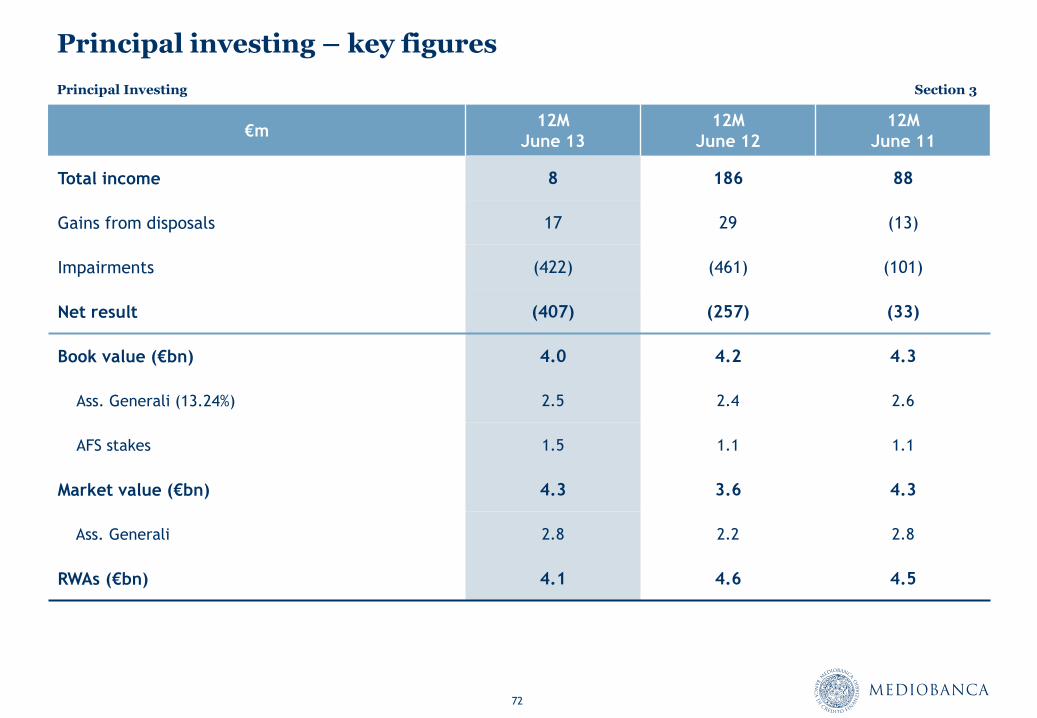
Principal investing – key figures
€m 12M
June 13
12M
June 12
12M
June 11
Total income 8 186 88
Gains from disposals 17 29 (13)
Impairments (422) (461) (101)
Net result (407) (257) (33)
Book value (€bn) 4.0 4.2 4.3
Ass. Generali (13.24%) 2.5 2.4 2.6
AFS stakes 1.5 1.1 1.1
Market value (€bn) 4.3 3.6 4.3
Ass. Generali 2.8 2.2 2.8
RWAs (€bn) 4.1 4.6 4.5
Principal Investing Section 3
Section 4
Consumer and Retail Banking
74
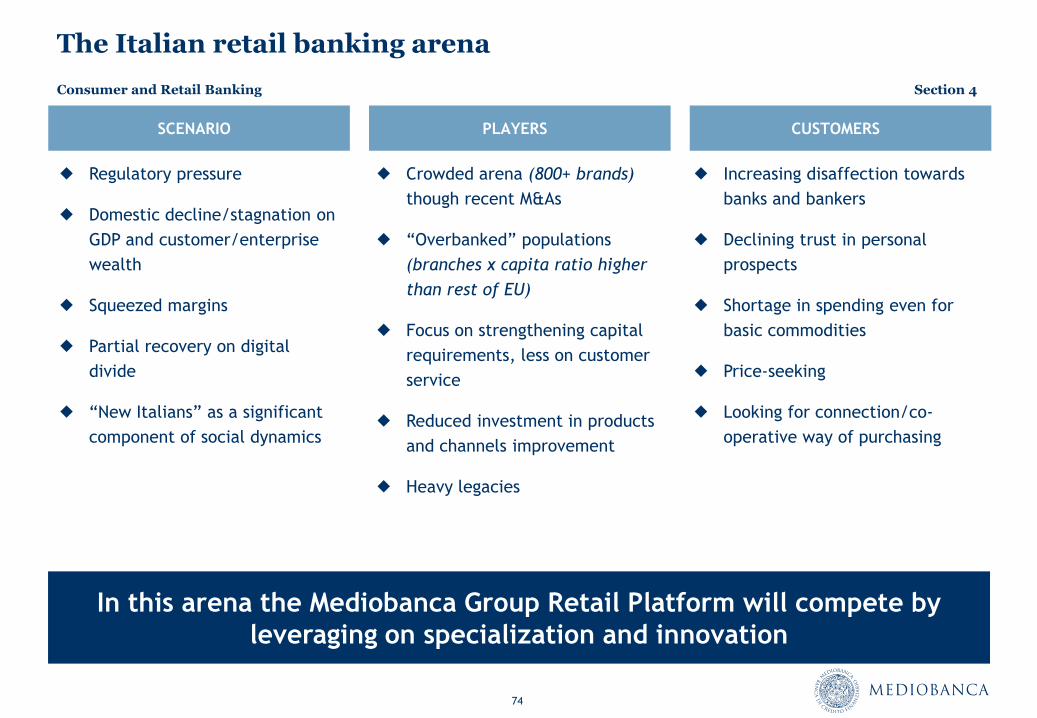
The Italian retail banking arena
SCENARIO PLAYERS CUSTOMERS
In this arena the Mediobanca Group Retail Platform will compete by
leveraging on specialization and innovation
Regulatory pressure
Domestic decline/stagnation on
GDP and customer/enterprise
wealth
Squeezed margins
Partial recovery on digital
divide
“New Italians” as a significant
component of social dynamics
Crowded arena (800+ brands)
though recent M&As
“Overbanked” populations
(branches x capita ratio higher
than rest of EU)
Focus on strengthening capital
requirements, less on customer
service
Reduced investment in products
and channels improvement
Heavy legacies
Increasing disaffection towards
banks and bankers
Declining trust in personal
prospects
Shortage in spending even for
basic commodities
Price-seeking
Looking for connection/co-
operative way of purchasing
Consumer and Retail Banking Section 4
75
0%
5%
10%
15%
20%
25%
30%
35%
40%
45%
Without bank relations
Low mass (0-25k)
Mass (25-50k)
Low affluent (50-100k)
Top affluent (100-250k)
Low private (250-500k)
HNWI* (500-1500k)
V+U HNWI** (> 1500k)
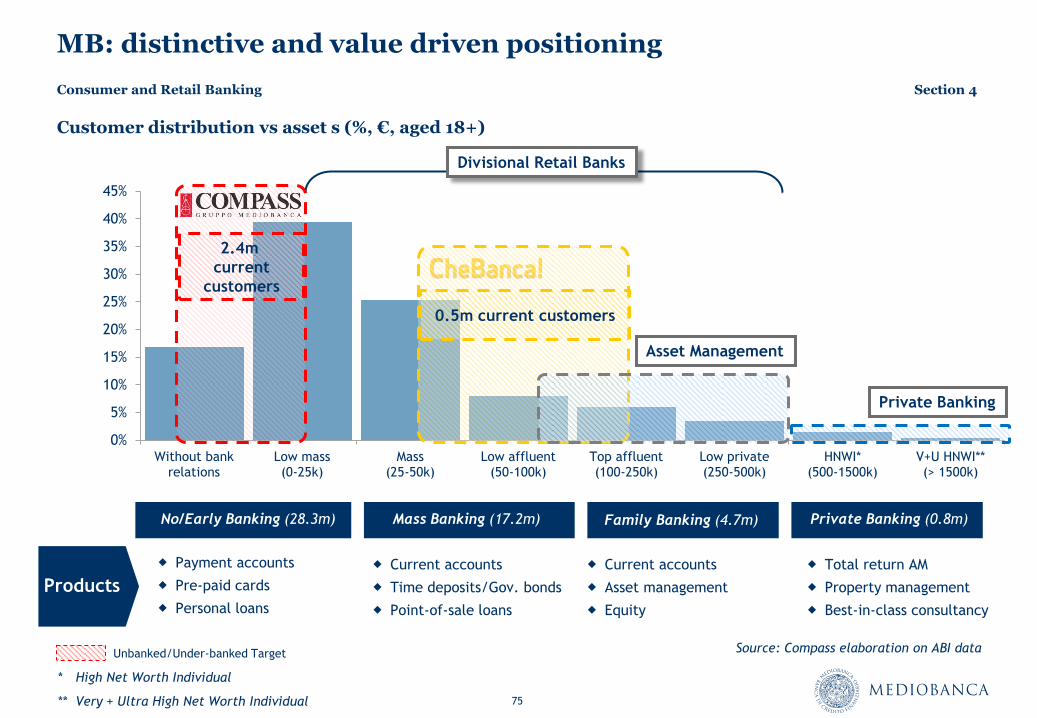
MB: distinctive and value driven positioning
Unbanked/Under-banked Target
Private Banking
Asset Management
Payment accounts
Pre-paid cards
Personal loans
* High Net Worth Individual
** Very + Ultra High Net Worth Individual
Current accounts
Time deposits/Gov. bonds
Point-of-sale loans
Current accounts
Asset management
Equity
Total return AM
Property management
Best-in-class consultancy
Divisional Retail Banks
Customer distribution vs asset s (%, €, aged 18+)
2.4m
current
customers
0.5m current customers
Source: Compass elaboration on ABI data
Consumer and Retail Banking Section 4
Family Banking (4.7m) Private Banking (0.8m)
Products
Mass Banking (17.2m) No/Early Banking (28.3m)
76
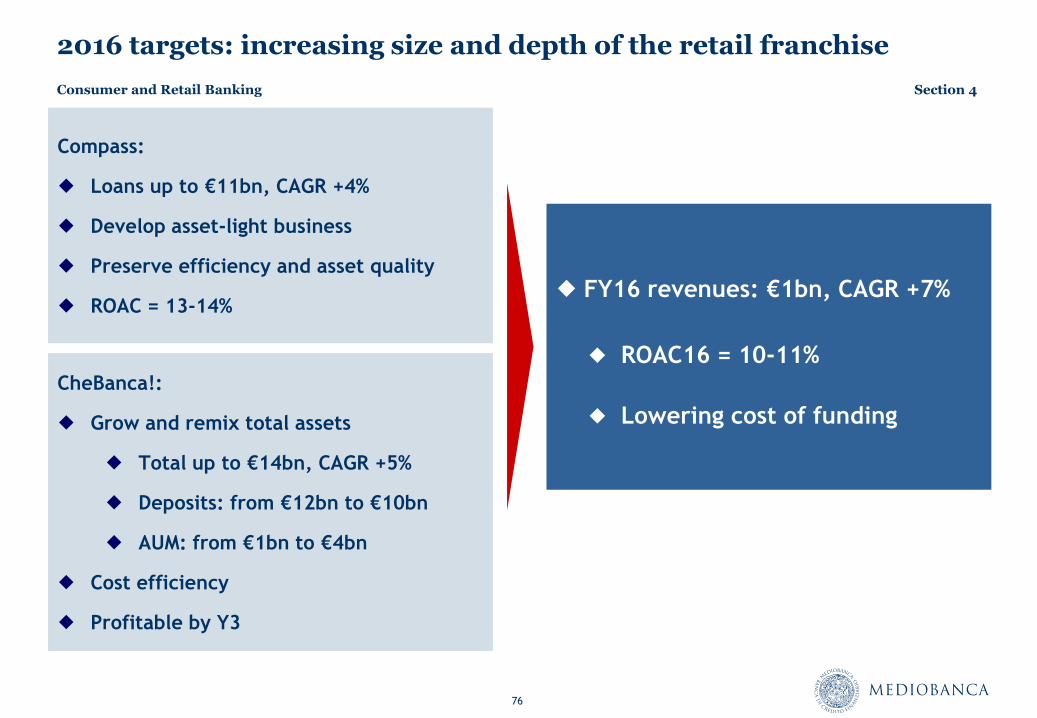
2016 targets: increasing size and depth of the retail franchise
Compass:
Loans up to €11bn, CAGR +4%
Develop asset-light business
Preserve efficiency and asset quality
ROAC = 13-14%
CheBanca!:
Grow and remix total assets
Total up to €14bn, CAGR +5%
Deposits: from €12bn to €10bn
AUM: from €1bn to €4bn
Cost efficiency
Profitable by Y3
FY16 revenues: €1bn, CAGR +7%
ROAC16 = 10-11%
Lowering cost of funding
Consumer and Retail Banking Section 4
77
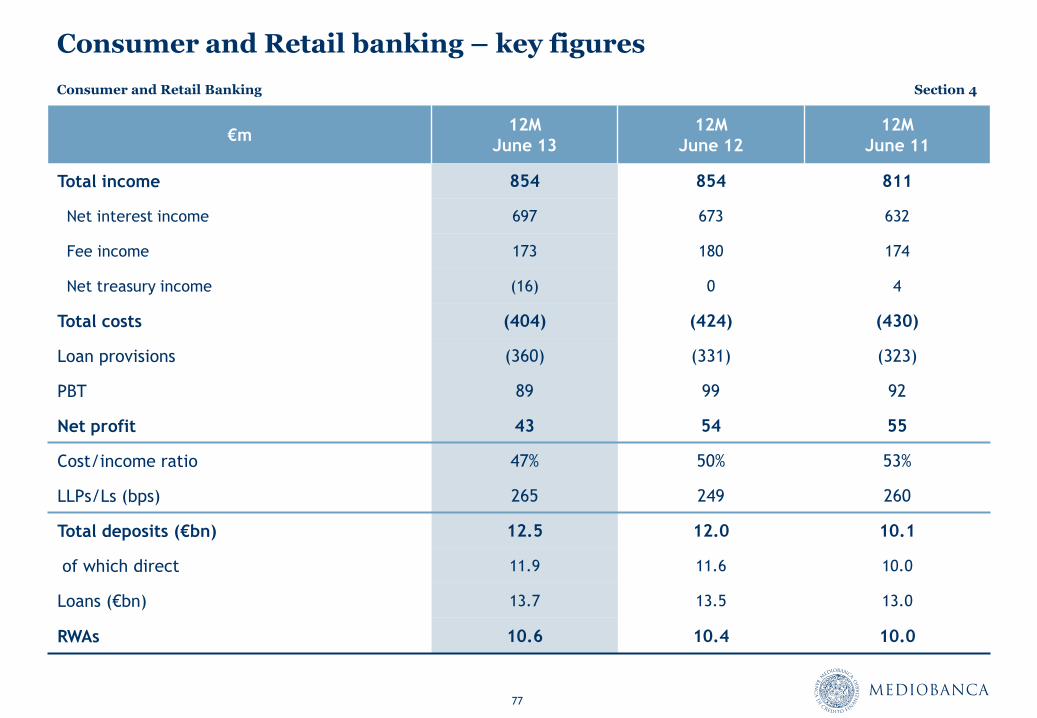
Consumer and Retail banking – key figures
€m 12M
June 13
12M
June 12
12M
June 11
Total income 854 854 811
Net interest income 697 673 632
Fee income 173 180 174
Net treasury income (16) 0 4
Total costs (404) (424) (430)
Loan provisions (360) (331) (323)
PBT 89 99 92
Net profit 43 54 55
Cost/income ratio 47% 50% 53%
LLPs/Ls (bps) 265 249 260
Total deposits (€bn) 12.5 12.0 10.1
of which direct 11.9 11.6 10.0
Loans (€bn) 13.7 13.5 13.0
RWAs 10.6 10.4 10.0
Consumer and Retail Banking Section 4
Consumer lending
Section 4.1
79
Cars 11%
Special purposes
10%
Personal loans 51%
Credit cards 20%
Salary guar. 6%
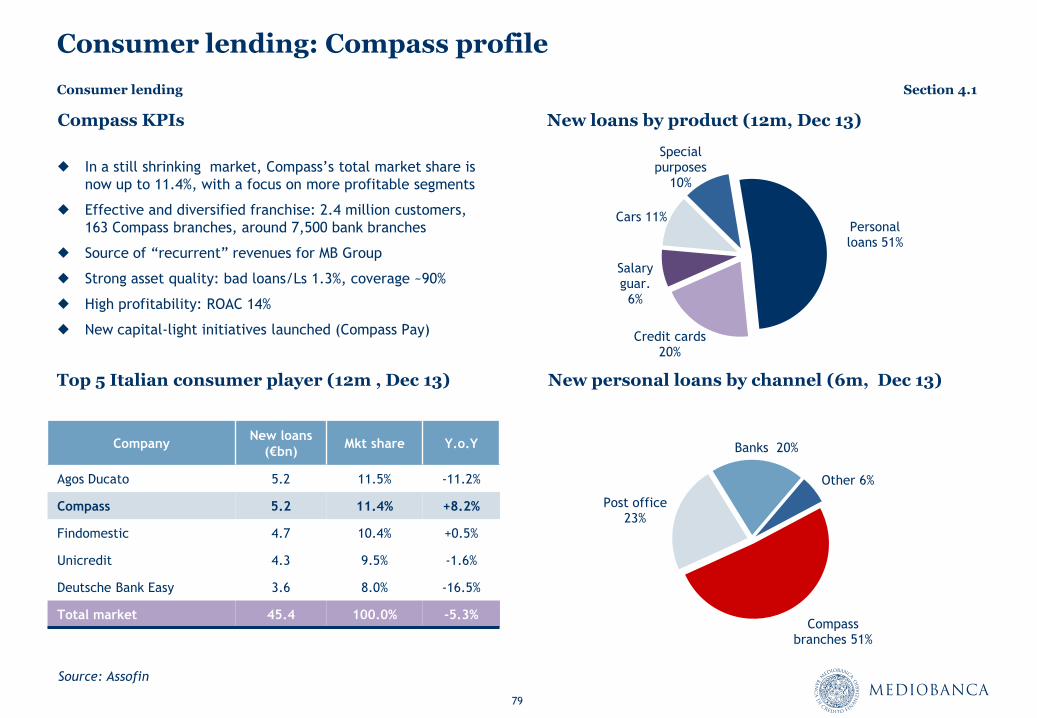
Consumer lending: Compass profile
Top 5 Italian consumer player (12m , Dec 13)
New loans by product (12m, Dec 13)
In a still shrinking market, Compass’s total market share is
now up to 11.4%, with a focus on more profitable segments
Effective and diversified franchise: 2.4 million customers,
163 Compass branches, around 7,500 bank branches
Source of “recurrent” revenues for MB Group
Strong asset quality: bad loans/Ls 1.3%, coverage ~90%
High profitability: ROAC 14%
New capital-light initiatives launched (Compass Pay)
New personal loans by channel (6m, Dec 13)
Compass branches 51%
Post office 23%
Banks 20%
Other 6%
Compass KPIs
Company New loans
(€bn) Mkt share Y.o.Y
Agos Ducato 5.2 11.5% -11.2%
Compass 5.2 11.4% +8.2%
Findomestic 4.7 10.4% +0.5%
Unicredit 4.3 9.5% -1.6%
Deutsche Bank Easy 3.6 8.0% -16.5%
Total market 45.4 100.0% -5.3%
Source: Assofin
Consumer lending Section 4.1
80
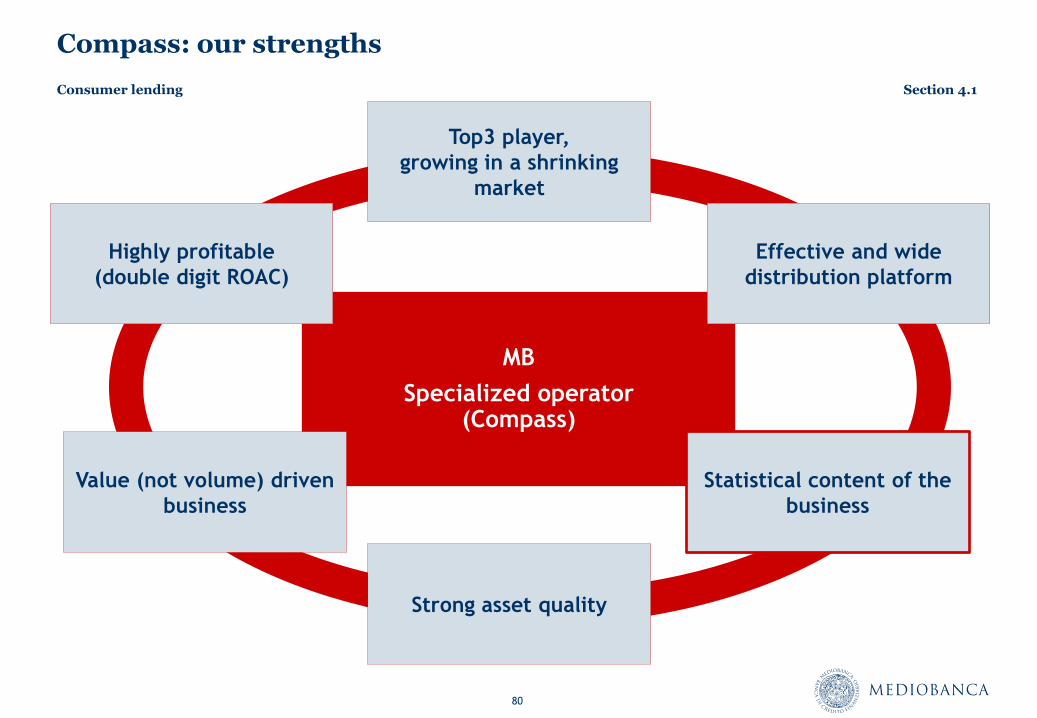
Compass: our strengths
Top3 player,
growing in a shrinking
market
Effective and wide
distribution platform
Statistical content of the
business
Strong asset quality
Value (not volume) driven
business
Highly profitable
(double digit ROAC)
MB
Specialized operator (Compass)
Consumer lending Section 4.1
81
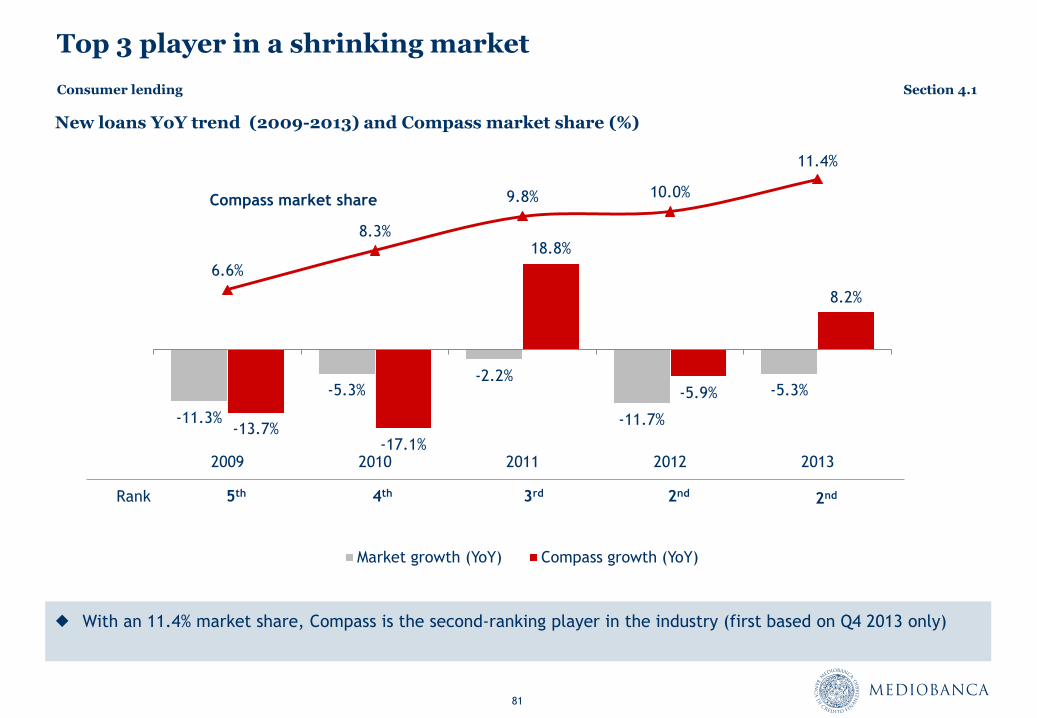
Top 3 player in a shrinking market
With an 11.4% market share, Compass is the second-ranking player in the industry (first based on Q4 2013 only)
New loans YoY trend (2009-2013) and Compass market share (%)
-11.3%
-5.3% -2.2%
-11.7%
-5.3%
-13.7% -17.1%
18.8%
-5.9%
8.2%
6.6%
8.3%
9.8% 10.0%
11.4%
0.0%
2.0%
4.0%
6.0%
8.0%
10.0%
12.0%
-20.0%
-10.0%
0.0%
10.0%
20.0%
30.0%
40.0%
2009 2010 2011 2012 2013
Market growth (YoY) Compass growth (YoY)
Rank 2nd 5th 4th 3rd 2nd
Compass market share
Consumer lending Section 4.1
82
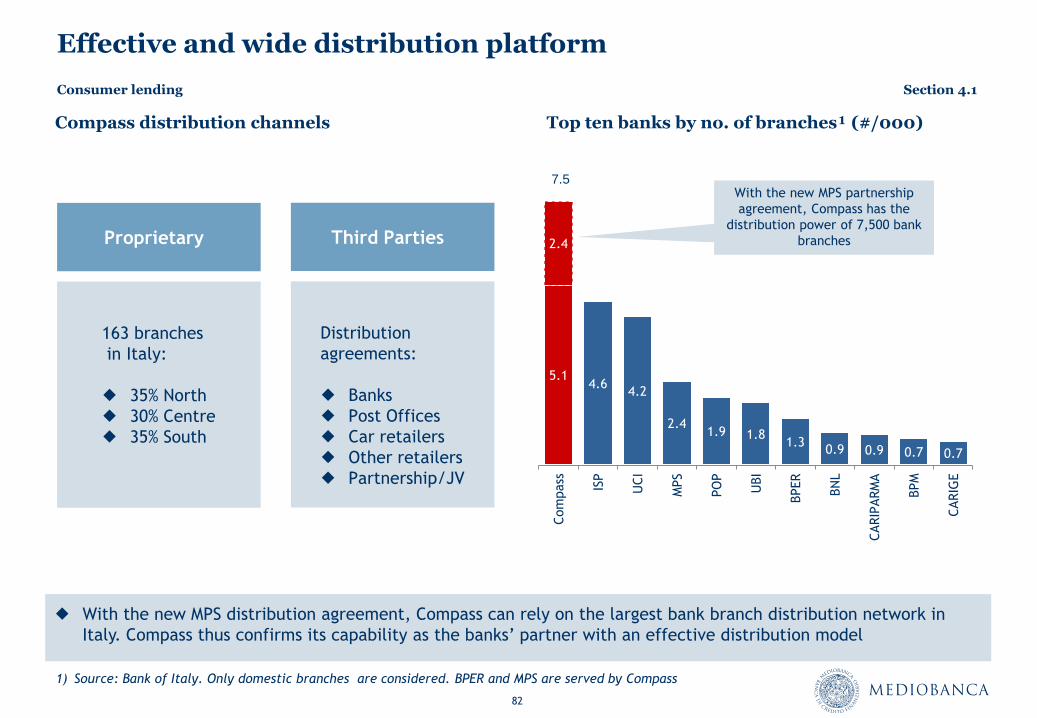
Effective and wide distribution platform
Top ten banks by no. of branches¹ (#/000)
With the new MPS distribution agreement, Compass can rely on the largest bank branch distribution network in
Italy. Compass thus confirms its capability as the banks’ partner with an effective distribution model
Compass distribution channels
1) Source: Bank of Italy. Only domestic branches are considered. BPER and MPS are served by Compass
5.1 4.6
4.2
2.4 1.9 1.8
1.3 0.9 0.9 0.7 0.7
2.4
Com
pass
ISP
UC
I
MPS
PO
P
UBI
BPER
BN
L
CARIP
ARM
A
BPM
CARIG
E
With the new MPS partnership
agreement, Compass has the
distribution power of 7,500 bank
branches
7.5
Proprietary
163 branches
in Italy:
35% North
30% Centre
35% South
Third Parties
Distribution
agreements:
Banks
Post Offices
Car retailers
Other retailers
Partnership/JV
Consumer lending Section 4.1
83
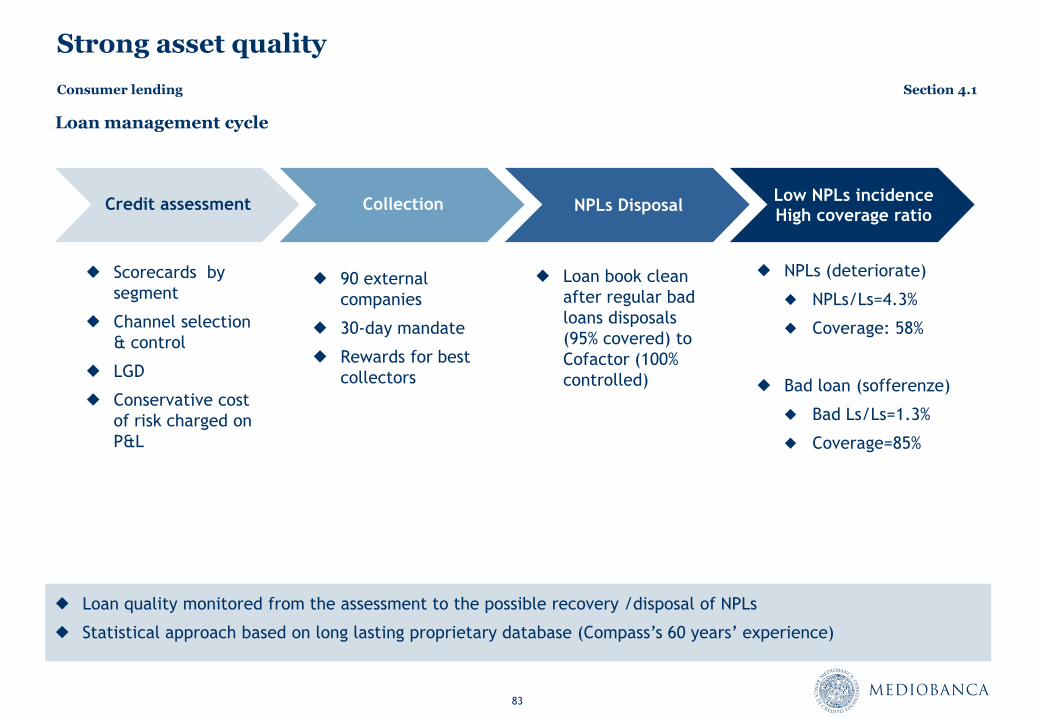
Strong asset quality
Loan quality monitored from the assessment to the possible recovery /disposal of NPLs
Statistical approach based on long lasting proprietary database (Compass’s 60 years’ experience)
Loan management cycle
90 external
companies
30-day mandate
Rewards for best
collectors
Credit assessment Collection NPLs Disposal Low NPLs incidence High coverage ratio
Loan book clean
after regular bad
loans disposals
(95% covered) to
Cofactor (100%
controlled)
Scorecards by
segment
Channel selection
& control
LGD
Conservative cost
of risk charged on
P&L
NPLs (deteriorate)
NPLs/Ls=4.3%
Coverage: 58%
Bad loan (sofferenze)
Bad Ls/Ls=1.3%
Coverage=85%
Consumer lending Section 4.1
84
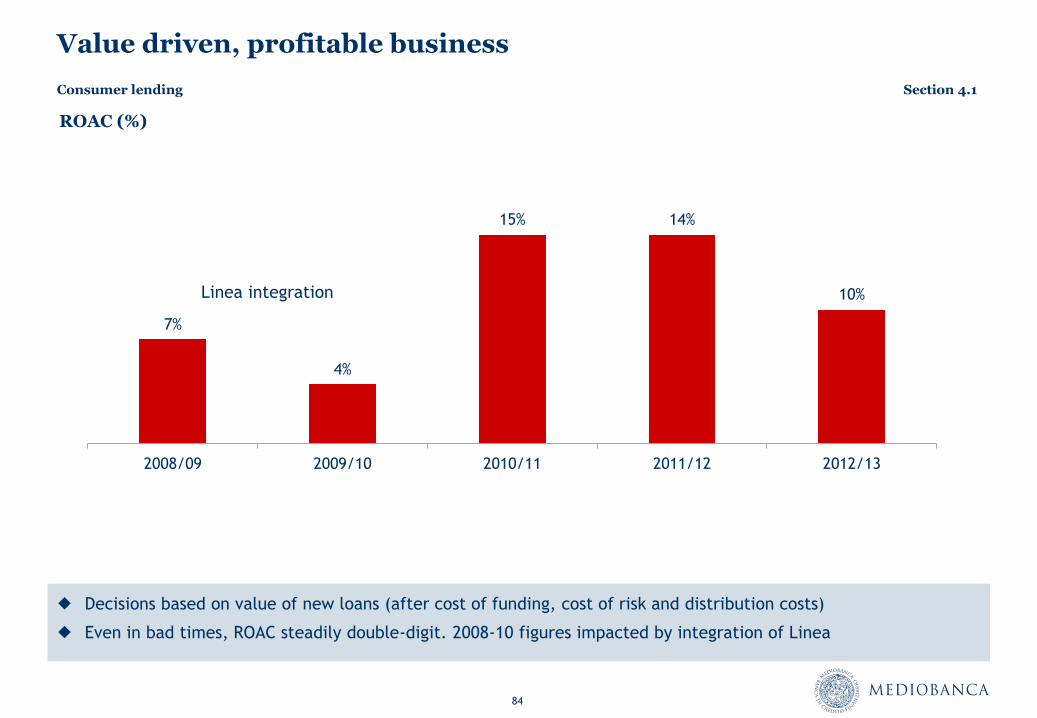
Value driven, profitable business
Decisions based on value of new loans (after cost of funding, cost of risk and distribution costs)
Even in bad times, ROAC steadily double-digit. 2008-10 figures impacted by integration of Linea
ROAC (%)
7%
4%
15% 14%
10%
2008/09 2009/10 2010/11 2011/12 2012/13
Linea integration
Consumer lending Section 4.1
85
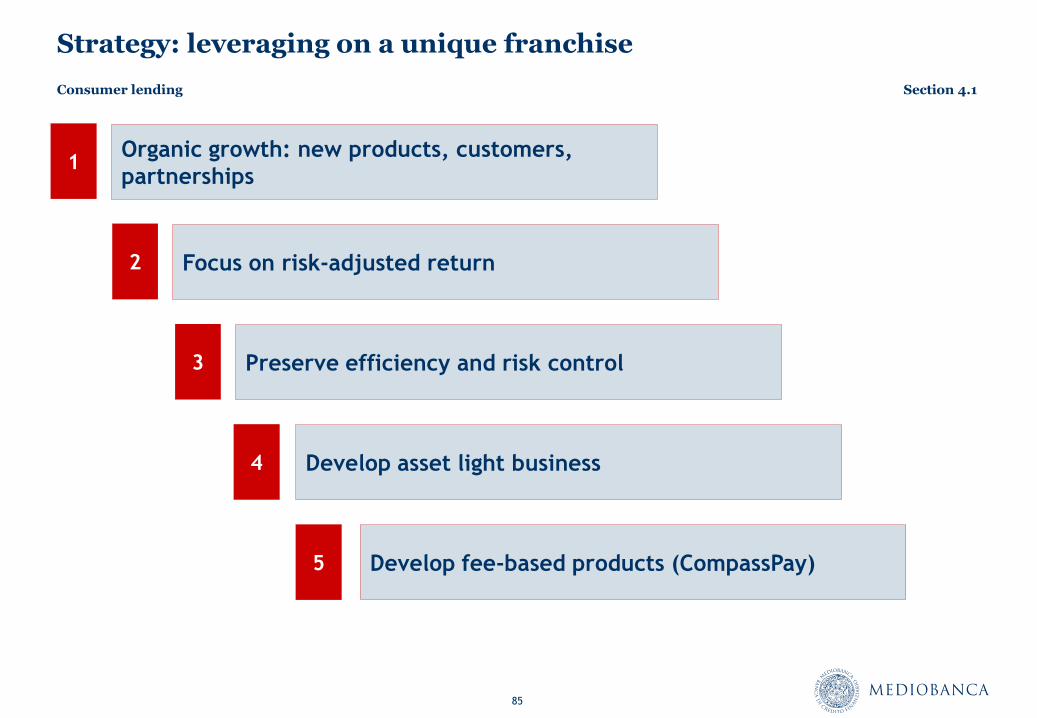
Strategy: leveraging on a unique franchise
Organic growth: new products, customers,
partnerships
Develop asset light business
Preserve efficiency and risk control
Focus on risk-adjusted return
Develop fee-based products (CompassPay)
1
2
3
4
5
Consumer lending Section 4.1
86
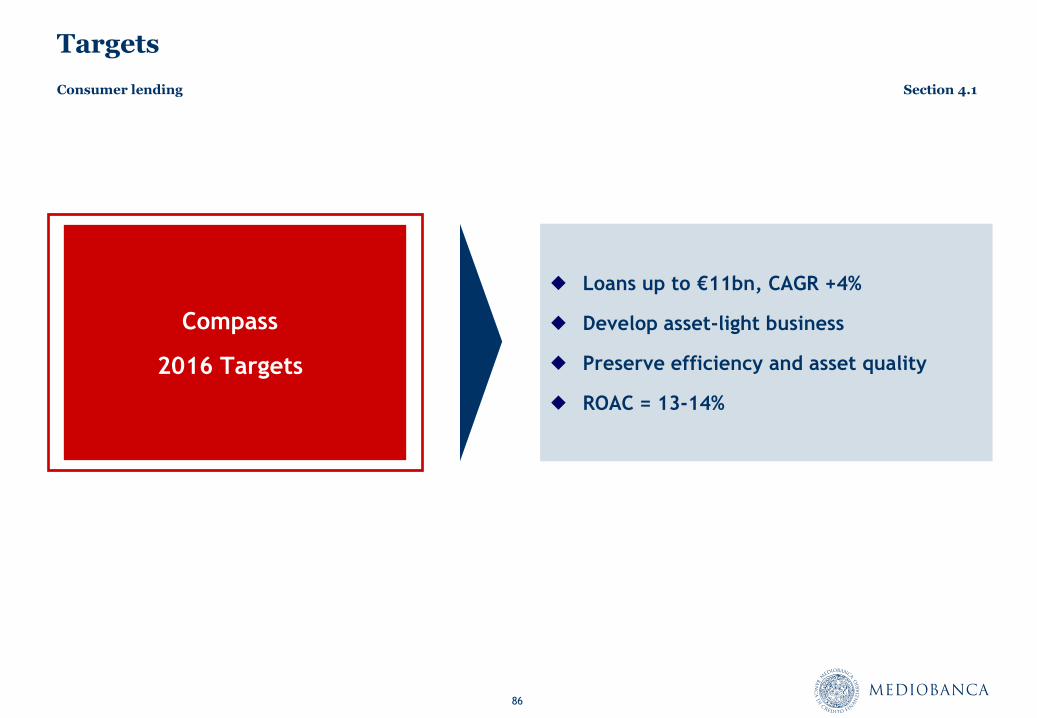
Targets
Compass
2016 Targets
Loans up to €11bn, CAGR +4%
Develop asset-light business
Preserve efficiency and asset quality
ROAC = 13-14%
Consumer lending Section 4.1
87
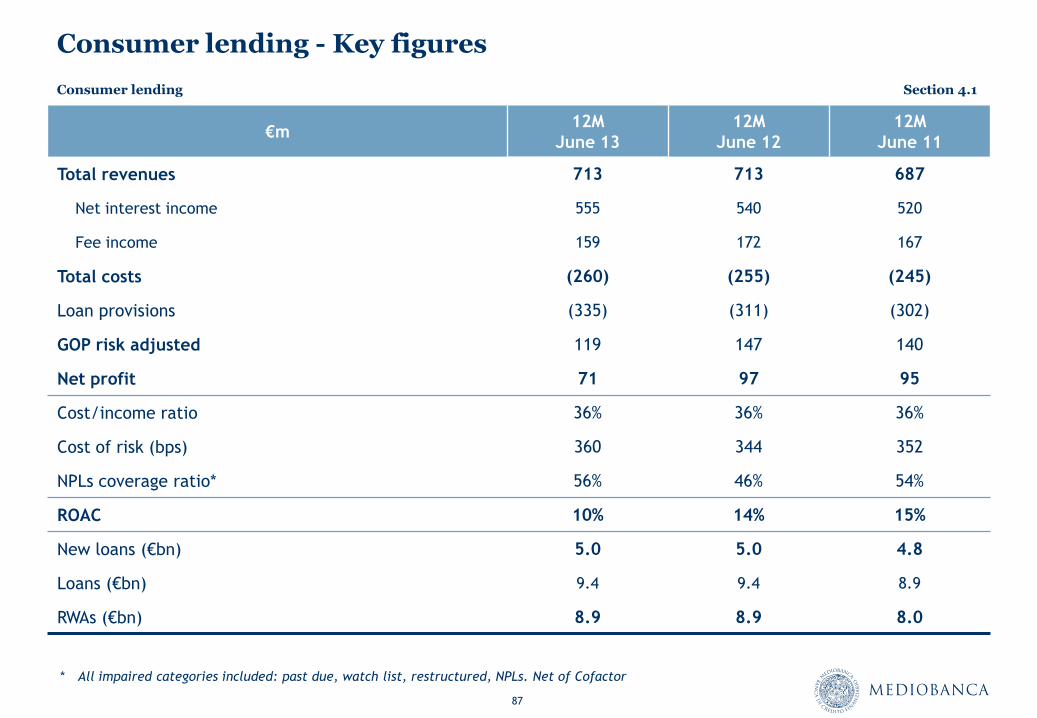
Consumer lending - Key figures
€m 12M
June 13
12M
June 12
12M
June 11
Total revenues 713 713 687
Net interest income 555 540 520
Fee income 159 172 167
Total costs (260) (255) (245)
Loan provisions (335) (311) (302)
GOP risk adjusted 119 147 140
Net profit 71 97 95
Cost/income ratio 36% 36% 36%
Cost of risk (bps) 360 344 352
NPLs coverage ratio* 56% 46% 54%
ROAC 10% 14% 15%
New loans (€bn) 5.0 5.0 4.8
Loans (€bn) 9.4 9.4 8.9
RWAs (€bn) 8.9 8.9 8.0
* All impaired categories included: past due, watch list, restructured, NPLs. Net of Cofactor
Consumer lending Section 4.1
Retail banking
Section 4.2

89
Retail banking: CheBanca! profile
CheBanca! KPIs
Product sold by channel (June 13) Product breakdown (June 13)
CheBanca! Branches
48%
Other 2%
Web 31%
Phone 19%
210
340 430
500 520
230
410
530
650 680
June 09 June 10 June 11 June 12 June 13
Customers Product sold
CheBanca! customers and products (’000)
Deposit 47%
Current account 18%
Mortgage 6%
Pocket account 20%
Credit Cards 6%
Securities account & other 3%
* Best Italian on-line bank in 2012 according to Istituto tedesco qualità finanza for Corriere Economia, May 2013 – Customer Satisfaction
Strong funding arm: €13.3bn direct deposits plus €1bn
indirect deposits
Best Italian online bank in 2012*
Scalable and efficient operating platform
Multichannel distribution
Increasing and affluent customer base (520,000)
Product diversification and profitability improving
Retail banking Section 4.2
90
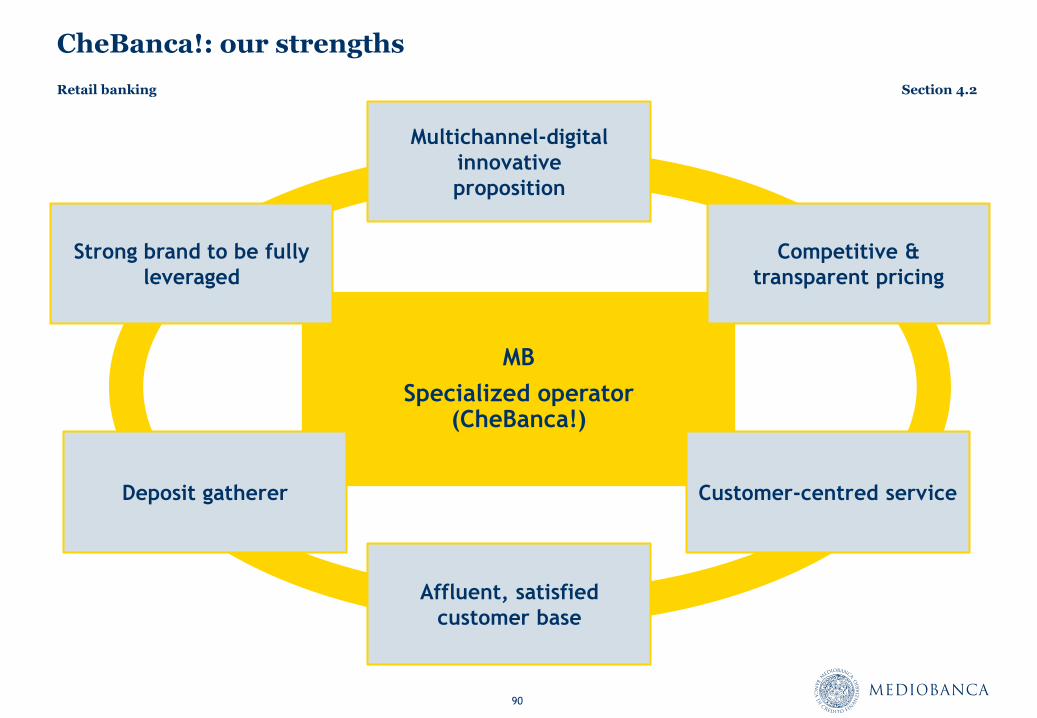
CheBanca!: our strengths
Multichannel-digital
innovative
proposition
Competitive &
transparent pricing
Customer-centred service
Affluent, satisfied
customer base
Deposit gatherer
Strong brand to be fully
leveraged
MB
Specialized operator (CheBanca!)
Retail banking Section 4.2
91
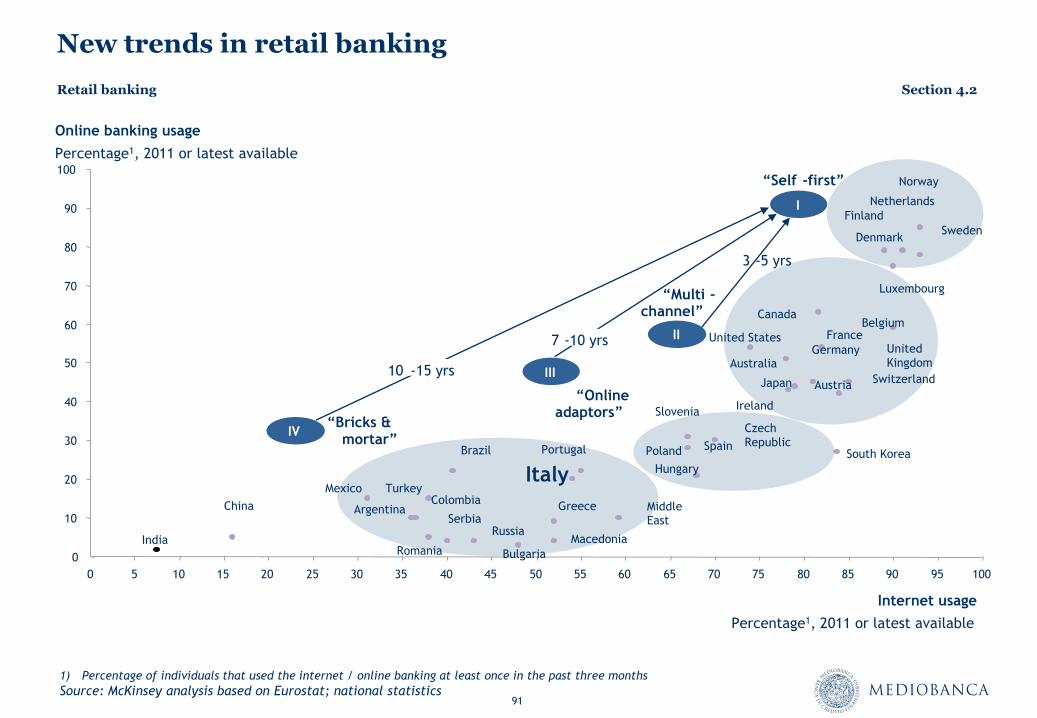
New trends in retail banking
1) Percentage of individuals that used the internet / online banking at least once in the past three months
Source: McKinsey analysis based on Eurostat; national statistics
0
10
20
30
40
50
60
70
80
90
100
0 5 10 15 20 25 30 35 40 45 50 55 60 65 70 75 80 85 90 95 100
Online banking usage
Internet usage
Percentage1, 2011 or latest available
Russia
South Korea
Japan
China Colombia
Argentina
Switzerland
Middle East
United States
Canada
Australia
Mexico
Brazil
India
Serbia
Norway
Turkey
Macedonia
United
Kingdom
Sweden
Finland
Slovenia
Romania
Portugal Poland
Austria
Netherlands
Hungary
Luxembourg
Italy
France
Spain
Greece
Ireland
Germany
Denmark
Czech
Republic
Bulgaria
Belgium
“Bricks & mortar”
“Multi - channel”
“Online adaptors”
“Self - first”
IV
II
III
I
10 - 15 yrs
7 - 10 yrs
3 - 5 yrs
Percentage1, 2011 or latest available
Retail banking Section 4.2
92
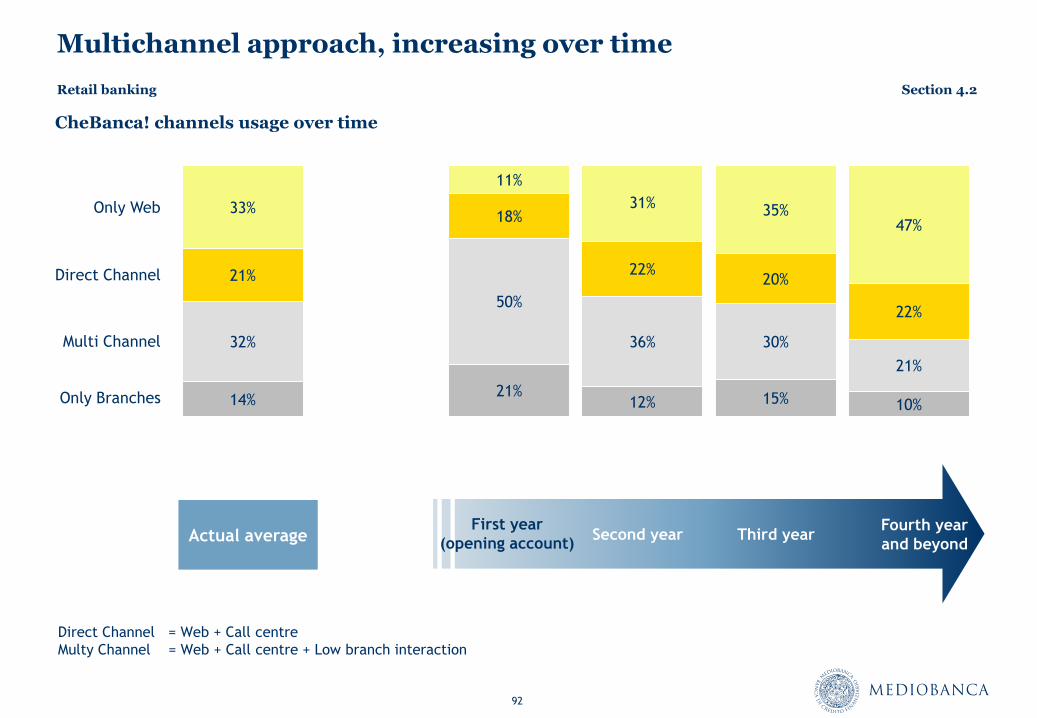
Multichannel approach, increasing over time
CheBanca! channels usage over time
Direct Channel = Web + Call centre
Multy Channel = Web + Call centre + Low branch interaction
Second year First year
(opening account) Third year
Fourth year
and beyond Actual average
Only Branches
Only Web
Direct Channel
Multi Channel
Retail banking Section 4.2
14% 21%
12% 15% 10%
32%
50%
36% 30%
21%
21%
18%
22% 20%
22%
33%
11%
31% 35%
47%
93
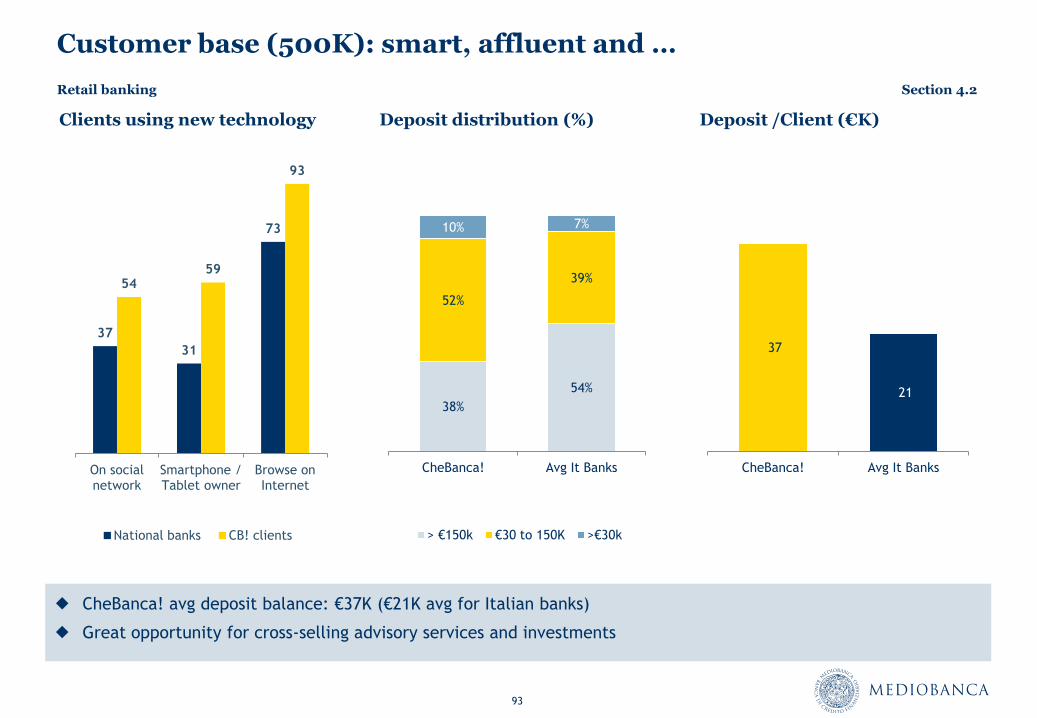
Customer base (500K): smart, affluent and …
Clients using new technology Deposit distribution (%)
37
31
73
54 59
93
On social network
Smartphone / Tablet owner
Browse on Internet
National banks CB! clients
CheBanca! avg deposit balance: €37K (€21K avg for Italian banks)
Great opportunity for cross-selling advisory services and investments
38%
54%
52%
39%
10% 7%
CheBanca! Avg It Banks
> €150k €30 to 150K >€30k
37
21
CheBanca! Avg It Banks
Deposit /Client (€K)
Retail banking Section 4.2
94
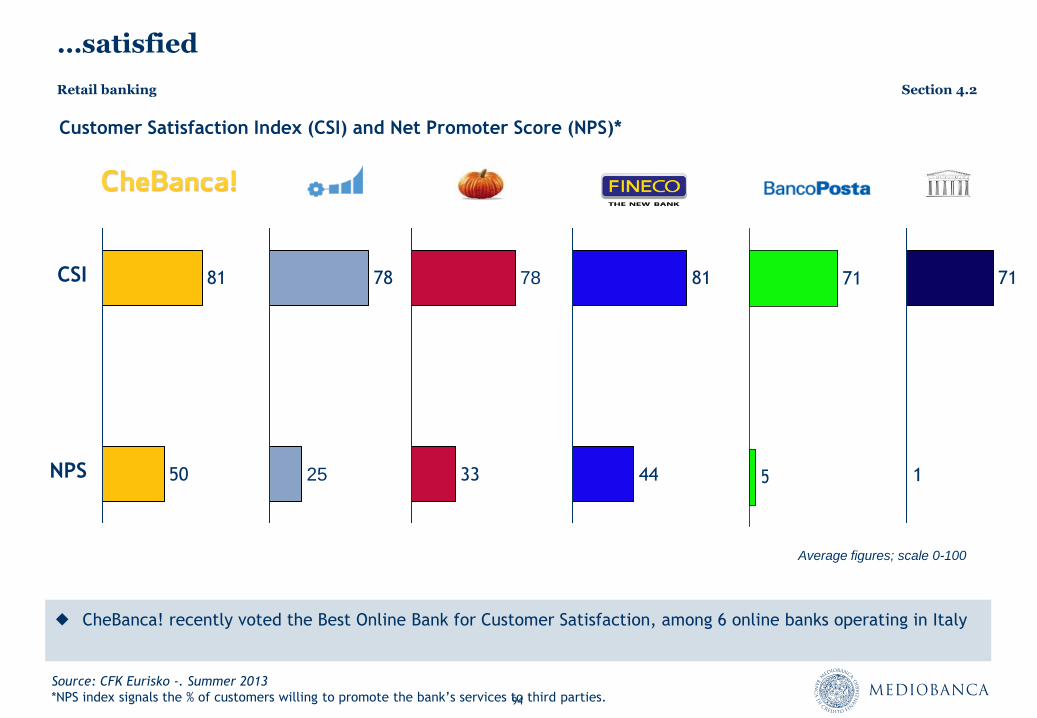
…satisfied
Customer Satisfaction Index (CSI) and Net Promoter Score (NPS)*
CheBanca! recently voted the Best Online Bank for Customer Satisfaction, among 6 online banks operating in Italy
Retail banking Section 4.2
Average figures; scale 0-100
81,3 77,7
CSI
50
81
44
81
5
71
25
78 78
33 1
71
NPS
Source: CFK Eurisko -. Summer 2013
*NPS index signals the % of customers willing to promote the bank’s services to third parties.
95
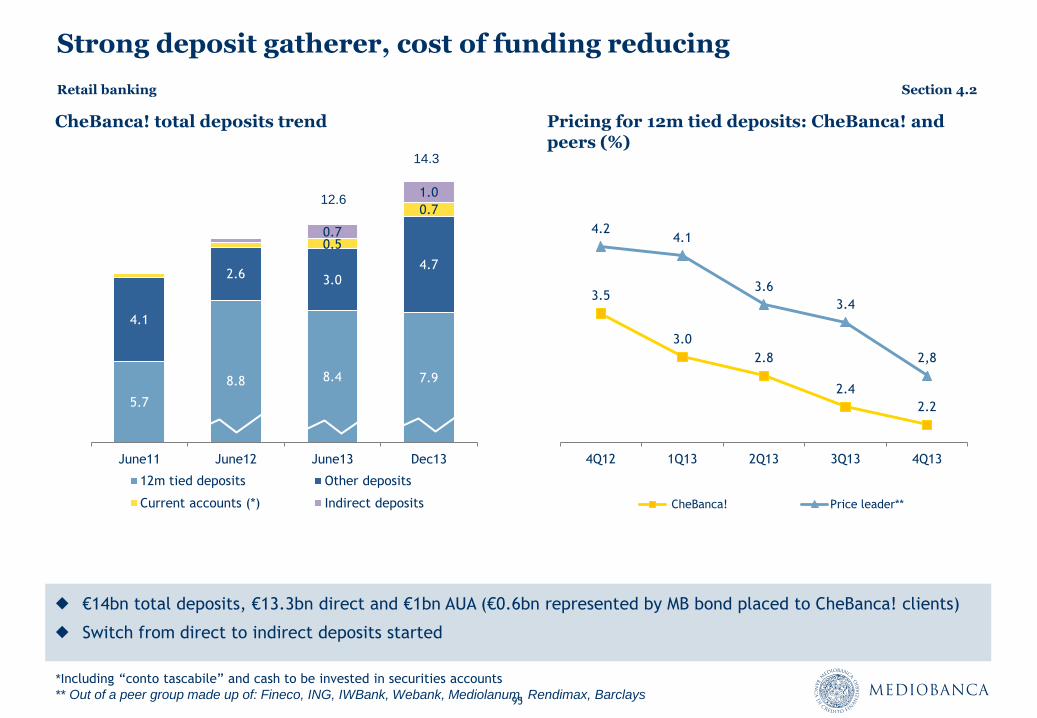
Strong deposit gatherer, cost of funding reducing
€14bn total deposits, €13.3bn direct and €1bn AUA (€0.6bn represented by MB bond placed to CheBanca! clients)
Switch from direct to indirect deposits started
CheBanca! total deposits trend
5.7
8.8 8.4 7.9
4.1
2.6 3.0 4.7
0.5
0.7
0.7
1.0
June11 June12 June13 Dec13
12m tied deposits Other deposits
Current accounts (*) Indirect deposits
14.3
12.6
Pricing for 12m tied deposits: CheBanca! and peers (%)
3.5
3.0
2.8
2.4
2.2
4.2 4.1
3.6
3.4
2,8
4Q12 1Q13 2Q13 3Q13 4Q13
CheBanca! Price leader**
Retail banking Section 4.2
*Including “conto tascabile” and cash to be invested in securities accounts
** Out of a peer group made up of: Fineco, ING, IWBank, Webank, Mediolanum, Rendimax, Barclays
96
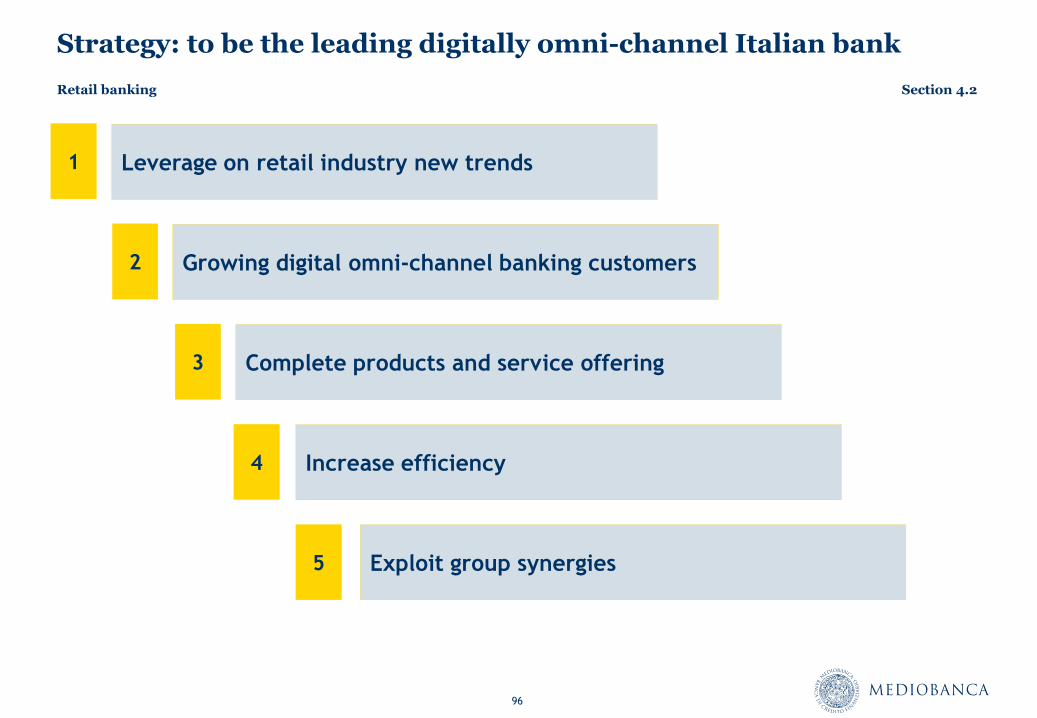
Strategy: to be the leading digitally omni-channel Italian bank
Leverage on retail industry new trends
Increase efficiency
Complete products and service offering
Growing digital omni-channel banking customers
Exploit group synergies
1
2
3
4
5
Retail banking Section 4.2
97
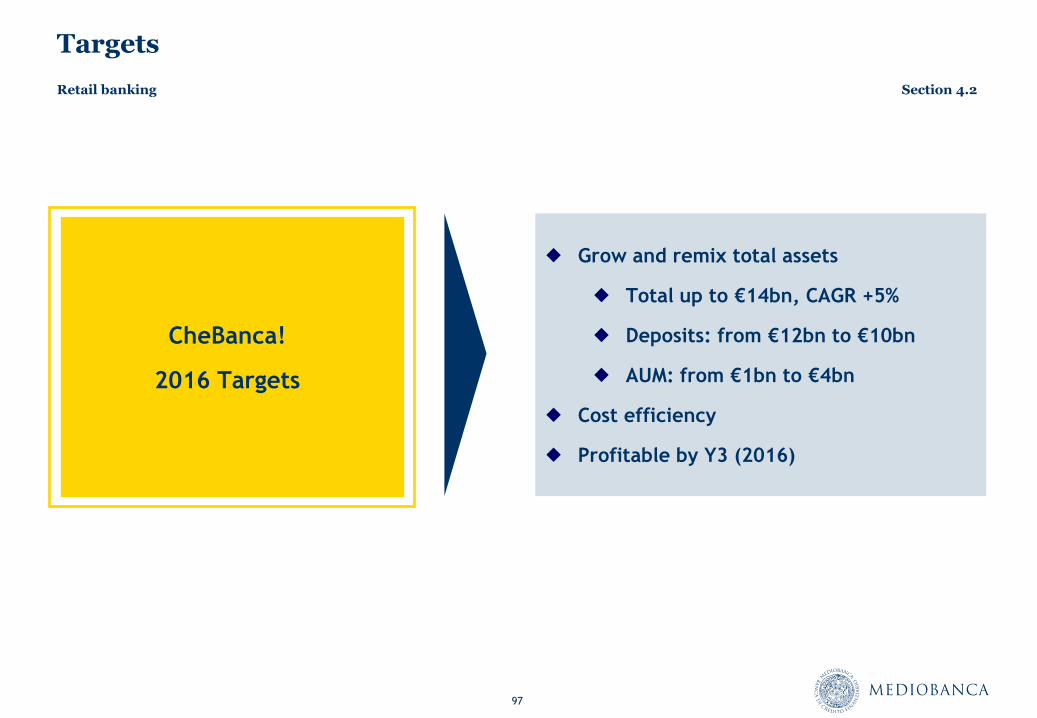
Targets
CheBanca!
2016 Targets
Grow and remix total assets
Total up to €14bn, CAGR +5%
Deposits: from €12bn to €10bn
AUM: from €1bn to €4bn
Cost efficiency
Profitable by Y3 (2016)
Retail banking Section 4.2

98
Retail banking – Key figures
€ m 12M
June 13
12M
June 12
12M
June 11
Total income 141 141 123
Net interest income 142 133 112
Fee income 15 8 7
Total costs (145) (169) (185)
Loan provisions (25) (20) (21)
Net result (28) (43) (39)
LLPs/Ls (bps) 59 46 54
Total deposits (€bn) 12.5 12.0 10.1
of which direct (€bn) 11.9 11.9 10.0
Loans (€bn) 4.3 4.3 4.1
RWAs (€bn) 1.6 1.9 1.9
Products sold (’000) 680 650 530
Customers (’000) 520 500 430
Retail banking Section 4.2

Annex 1
1H results as at December 2013
1H14 Group results
Annex 1.1
101
Net profit growth due to business diversification & stake disposals
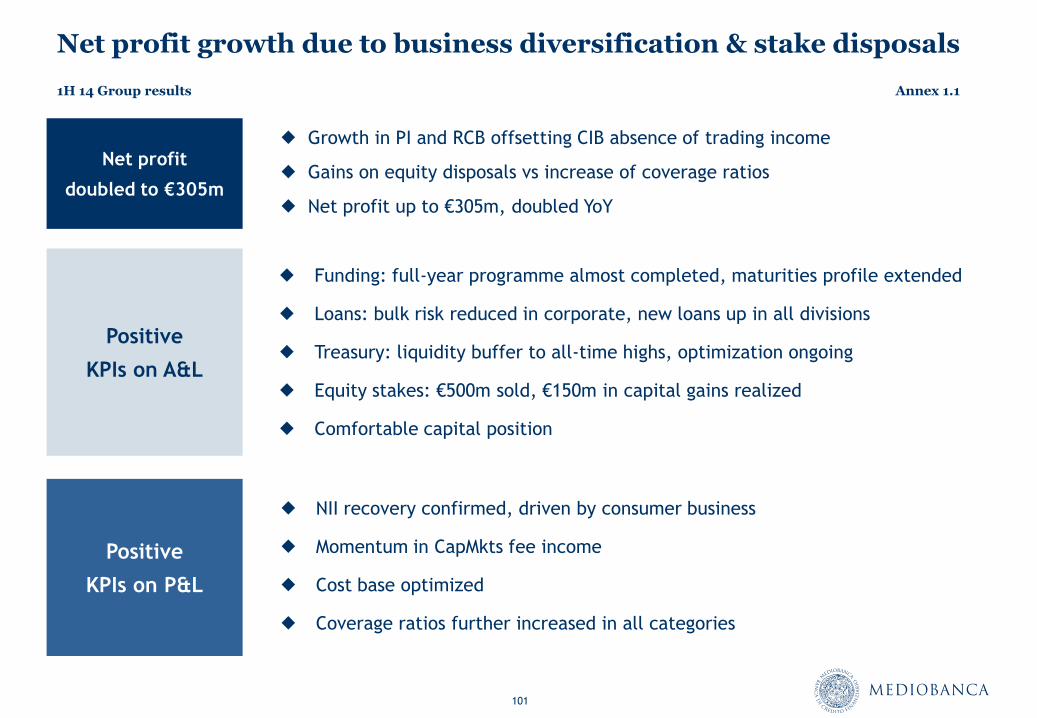
Funding: full-year programme almost completed, maturities profile extended
Loans: bulk risk reduced in corporate, new loans up in all divisions
Treasury: liquidity buffer to all-time highs, optimization ongoing
Equity stakes: €500m sold, €150m in capital gains realized
Comfortable capital position
NII recovery confirmed, driven by consumer business
Momentum in CapMkts fee income
Cost base optimized
Coverage ratios further increased in all categories
1H 14 Group results Annex 1.1
Positive
KPIs on A&L
Positive
KPIs on P&L
Net profit
doubled to €305m
Growth in PI and RCB offsetting CIB absence of trading income
Gains on equity disposals vs increase of coverage ratios
Net profit up to €305m, doubled YoY
102
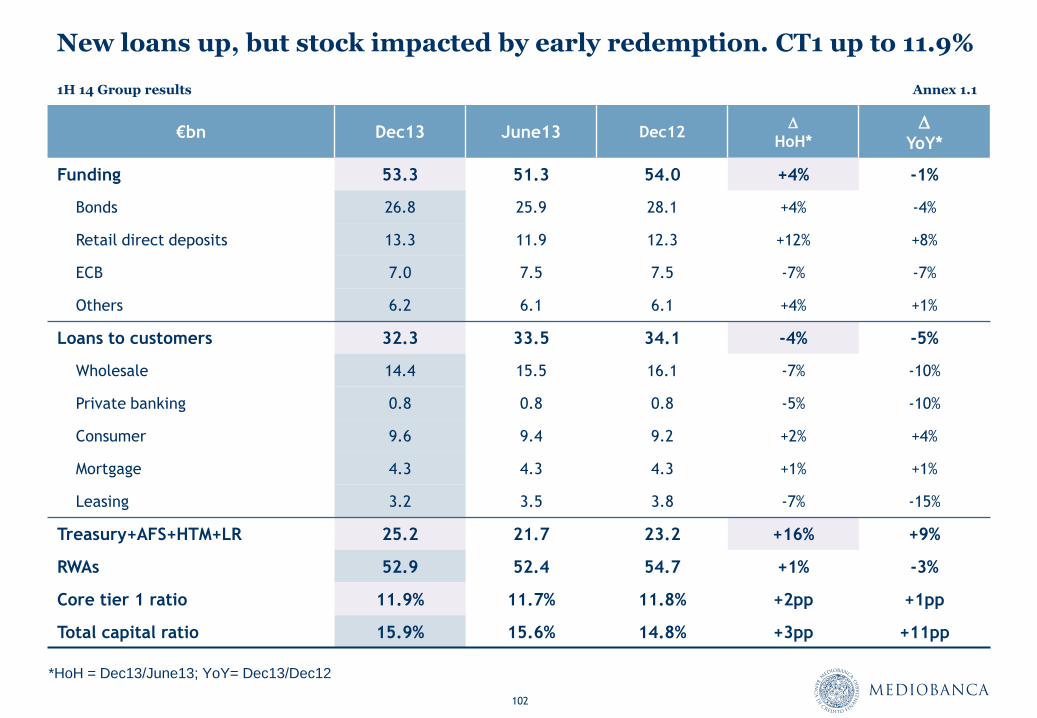
New loans up, but stock impacted by early redemption. CT1 up to 11.9%
€bn Dec13 June13 Dec12 D
HoH* D
YoY*
Funding 53.3 51.3 54.0 +4% -1%
Bonds 26.8 25.9 28.1 +4% -4%
Retail direct deposits 13.3 11.9 12.3 +12% +8%
ECB 7.0 7.5 7.5 -7% -7%
Others 6.2 6.1 6.1 +4% +1%
Loans to customers 32.3 33.5 34.1 -4% -5%
Wholesale 14.4 15.5 16.1 -7% -10%
Private banking 0.8 0.8 0.8 -5% -10%
Consumer 9.6 9.4 9.2 +2% +4%
Mortgage 4.3 4.3 4.3 +1% +1%
Leasing 3.2 3.5 3.8 -7% -15%
Treasury+AFS+HTM+LR 25.2 21.7 23.2 +16% +9%
RWAs 52.9 52.4 54.7 +1% -3%
Core tier 1 ratio 11.9% 11.7% 11.8% +2pp +1pp
Total capital ratio 15.9% 15.6% 14.8% +3pp +11pp
*HoH = Dec13/June13; YoY= Dec13/Dec12
1H 14 Group results Annex 1.1
103
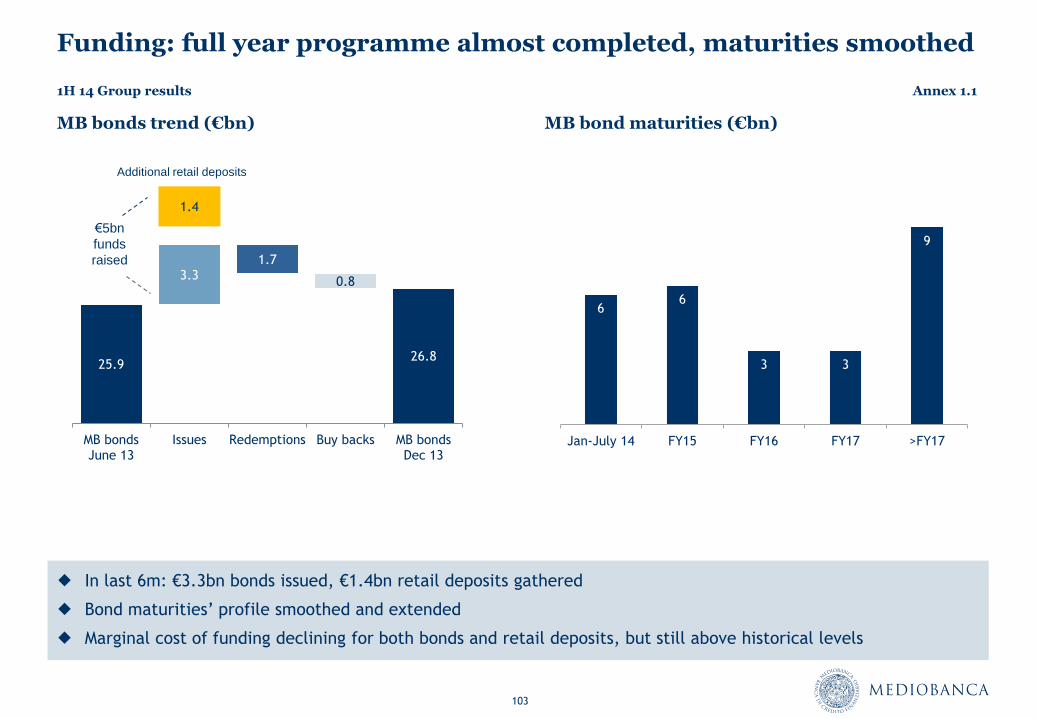
Funding: full year programme almost completed, maturities smoothed
MB bonds trend (€bn)
In last 6m: €3.3bn bonds issued, €1.4bn retail deposits gathered
Bond maturities’ profile smoothed and extended
Marginal cost of funding declining for both bonds and retail deposits, but still above historical levels
MB bond maturities (€bn)
6 6
3 3
9
Jan-July 14 FY15 FY16 FY17 >FY17
25.9
3.3 1.7
0.8
26.8
1.4
MB bonds June 13
Issues Redemptions Buy backs MB bonds Dec 13
Additional retail deposits
€5bn
funds
raised
1H 14 Group results Annex 1.1
104
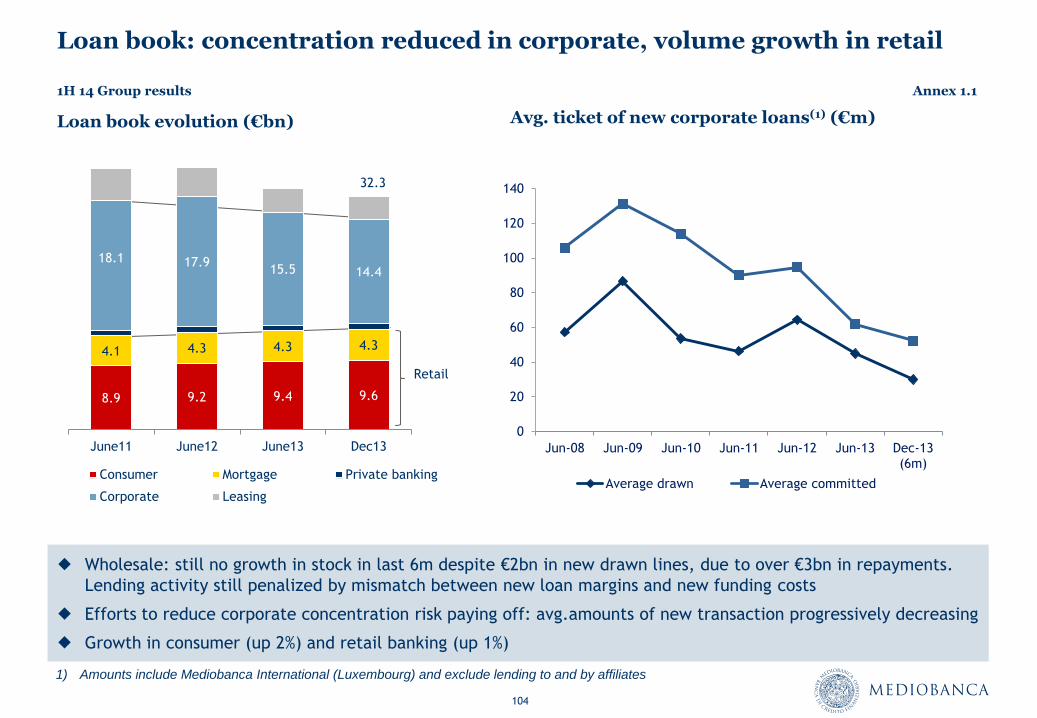
Loan book: concentration reduced in corporate, volume growth in retail
1H 14 Group results Annex 1.1
Loan book evolution (€bn)
Wholesale: still no growth in stock in last 6m despite €2bn in new drawn lines, due to over €3bn in repayments.
Lending activity still penalized by mismatch between new loan margins and new funding costs
Efforts to reduce corporate concentration risk paying off: avg.amounts of new transaction progressively decreasing
Growth in consumer (up 2%) and retail banking (up 1%)
8.9 9.2 9.4 9.6
4.1 4.3 4.3 4.3
18.1 17.9 15.5 14.4
June11 June12 June13 Dec13
Consumer Mortgage Private banking
Corporate Leasing
Retail
Avg. ticket of new corporate loans(1) (€m)
1) Amounts include Mediobanca International (Luxembourg) and exclude lending to and by affiliates
0
20
40
60
80
100
120
140
Jun-08 Jun-09 Jun-10 Jun-11 Jun-12 Jun-13 Dec-13 (6m)
Average drawn Average committed
32.3
105
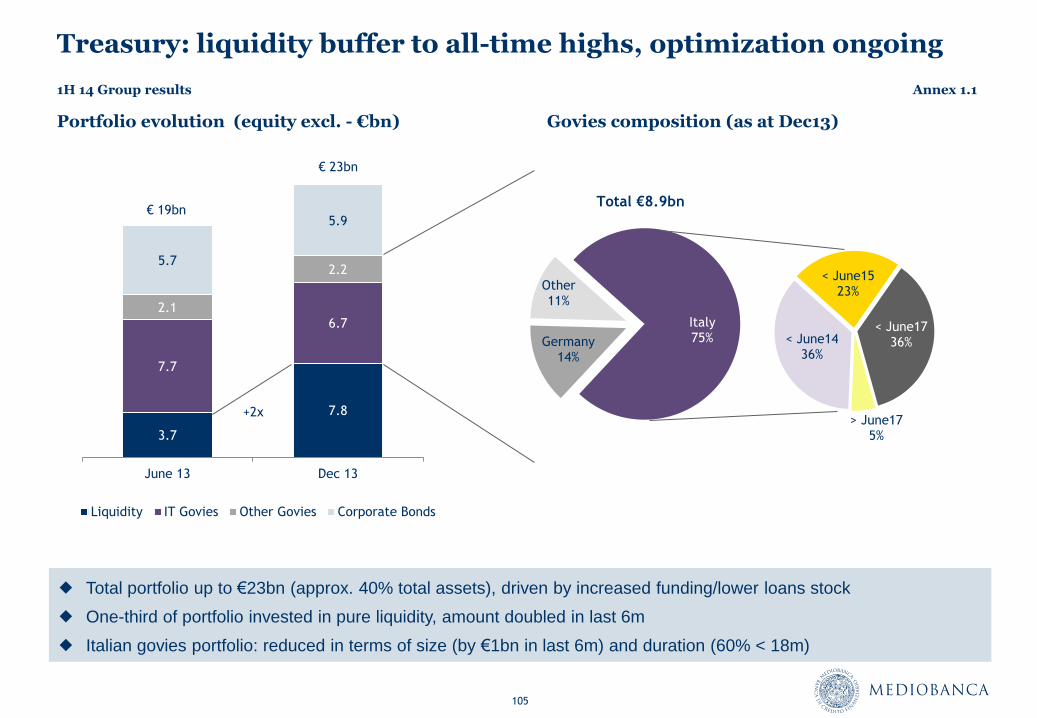
Treasury: liquidity buffer to all-time highs, optimization ongoing
Portfolio evolution (equity excl. - €bn) Govies composition (as at Dec13)
1H 14 Group results Annex 1.1
3.7
7.8
7.7
6.7
2.1
2.2 5.7
5.9
June 13 Dec 13
Liquidity IT Govies Other Govies Corporate Bonds
€ 23bn
Total €8.9bn
Total portfolio up to €23bn (approx. 40% total assets), driven by increased funding/lower loans stock
One-third of portfolio invested in pure liquidity, amount doubled in last 6m
Italian govies portfolio: reduced in terms of size (by €1bn in last 6m) and duration (60% < 18m)
€ 19bn
Italy 75% Germany
14%
Other 11%
< June15 23%
< June17 36%
> June17 5%
< June14 36%
+2x
106
AFS 1.6
AFS 1.3
AG 2.6
AG 2.6
AFS 1.5
AG 2.5
0.2
AG unrealized plus 0.3
AG unrealized
plusv 1
Book value 0.4
RCS aucap 0.1
Mkt val 227 AG
BV change 0.1
P&L gains 0.1
BV June13 AFS disposals
AFS investments
AG BV increase
BV Dec13 (mkt perf. excluded)
Mkt performance
BV Dec 13
Disposals
0.5
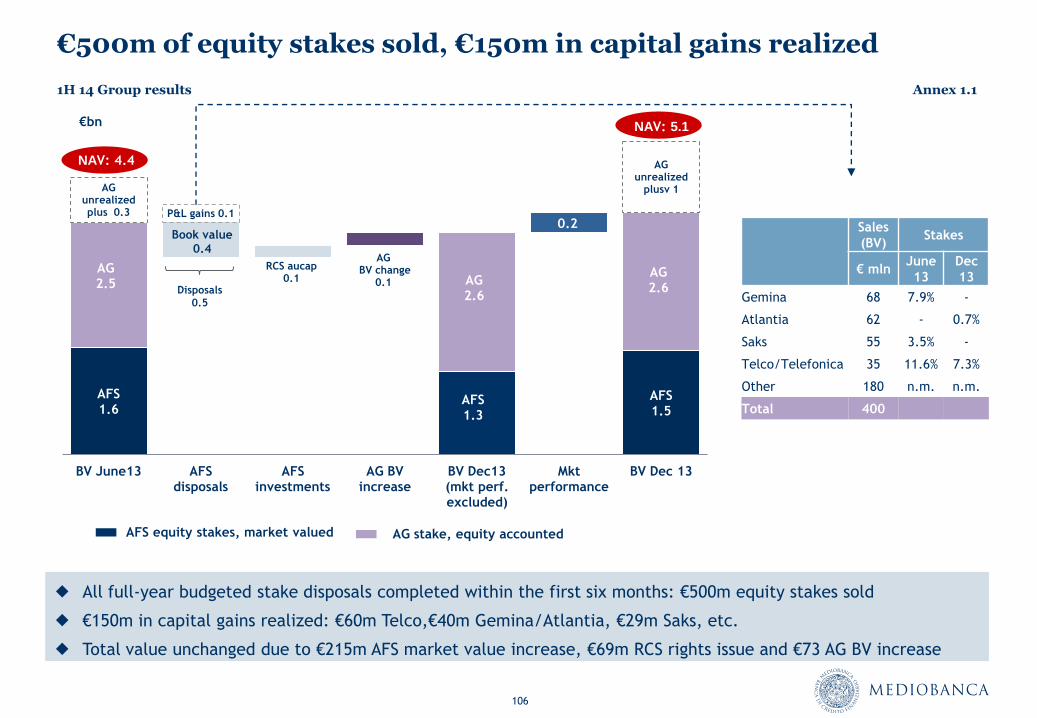
€500m of equity stakes sold, €150m in capital gains realized
All full-year budgeted stake disposals completed within the first six months: €500m equity stakes sold
€150m in capital gains realized: €60m Telco,€40m Gemina/Atlantia, €29m Saks, etc.
Total value unchanged due to €215m AFS market value increase, €69m RCS rights issue and €73 AG BV increase
Sales
(BV) Stakes
€ mln June
13
Dec
13
Gemina 68 7.9% -
Atlantia 62 - 0.7%
Saks 55 3.5% -
Telco/Telefonica 35 11.6% 7.3%
Other 180 n.m. n.m.
Total 400
1H 14 Group results Annex 1.1
€bn
AFS equity stakes, market valued AG stake, equity accounted
NAV: 4.4
NAV: 5.1
107
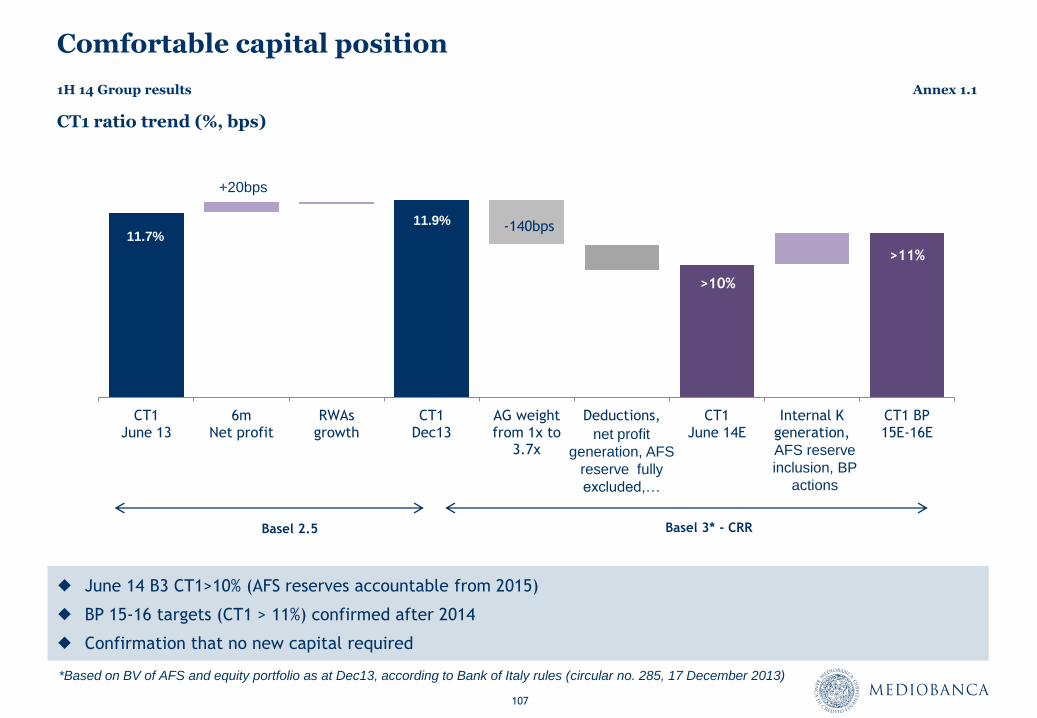
Comfortable capital position
June 14 B3 CT1>10% (AFS reserves accountable from 2015)
BP 15-16 targets (CT1 > 11%) confirmed after 2014
Confirmation that no new capital required
CT1 ratio trend (%, bps)
-140bps
>10%
>11%
CT1 June 13
6m Net profit
RWAs growth
CT1 Dec13
AG weight from 1x to
3.7x
Deductions, CT1 June 14E
Internal K generation,
CT1 BP 15E-16E
11.7%
11.9%
+20bps
+35bps
Basel 2.5 Basel 3* - CRR
*Based on BV of AFS and equity portfolio as at Dec13, according to Bank of Italy rules (circular no. 285, 17 December 2013)
net profit
generation, AFS
reserve fully
excluded,…
1H 14 Group results Annex 1.1
AFS reserve
inclusion, BP
actions
108
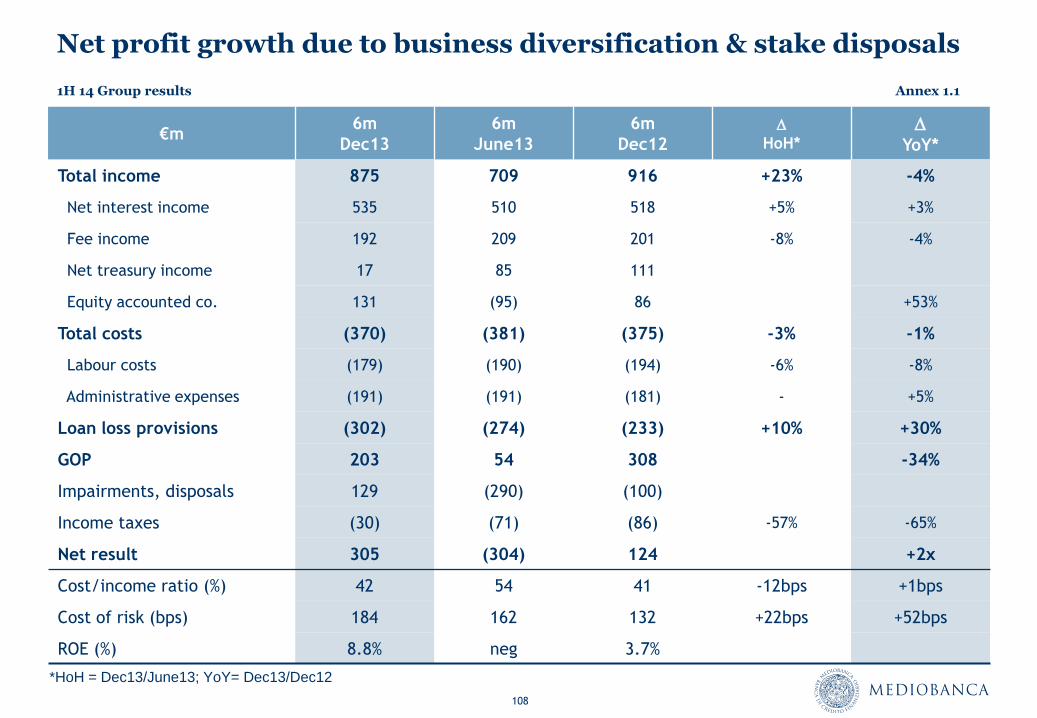
Net profit growth due to business diversification & stake disposals
€m 6m
Dec13
6m
June13
6m
Dec12 D
HoH* D
YoY*
Total income 875 709 916 +23% -4%
Net interest income 535 510 518 +5% +3%
Fee income 192 209 201 -8% -4%
Net treasury income 17 85 111
Equity accounted co. 131 (95) 86 +53%
Total costs (370) (381) (375) -3% -1%
Labour costs (179) (190) (194) -6% -8%
Administrative expenses (191) (191) (181) - +5%
Loan loss provisions (302) (274) (233) +10% +30%
GOP 203 54 308 -34%
Impairments, disposals 129 (290) (100)
Income taxes (30) (71) (86) -57% -65%
Net result 305 (304) 124 +2x
Cost/income ratio (%) 42 54 41 -12bps +1bps
Cost of risk (bps) 184 162 132 +22bps +52bps
ROE (%) 8.8% neg 3.7%
*HoH = Dec13/June13; YoY= Dec13/Dec12
1H 14 Group results Annex 1.1
109
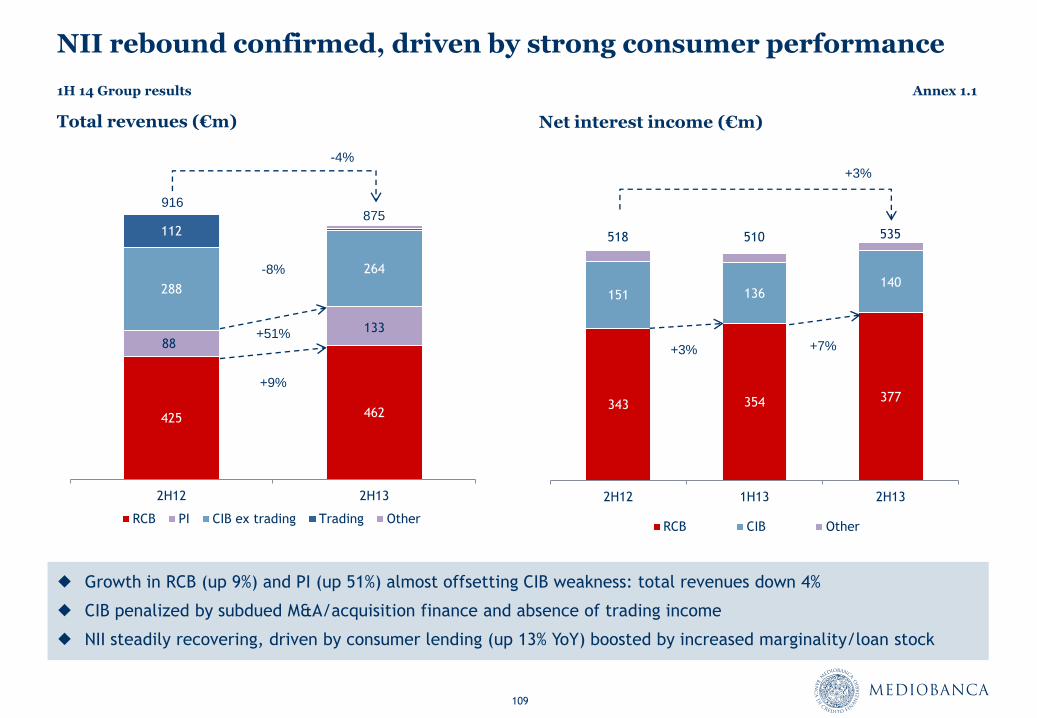
343 354 377
151 136 140
2H12 1H13 2H13
RCB CIB Other
510 535 518
425 462
88
133
288
264
112
2H12 2H13
RCB PI CIB ex trading Trading Other
NII rebound confirmed, driven by strong consumer performance
Growth in RCB (up 9%) and PI (up 51%) almost offsetting CIB weakness: total revenues down 4%
CIB penalized by subdued M&A/acquisition finance and absence of trading income
NII steadily recovering, driven by consumer lending (up 13% YoY) boosted by increased marginality/loan stock
916
+9%
875
-8%
Net interest income (€m)
-4%
1H 14 Group results Annex 1.1
+51%
Total revenues (€m)
+7% +3%
+3%
110
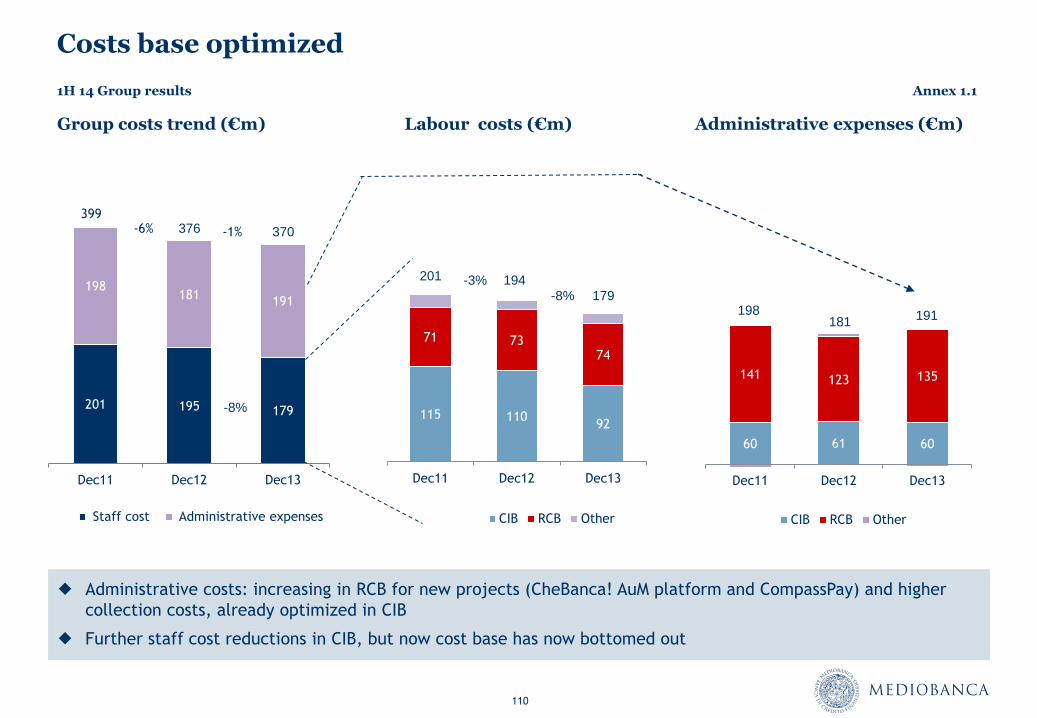
Administrative expenses (€m) Group costs trend (€m)
Costs base optimized
Labour costs (€m)
Administrative costs: increasing in RCB for new projects (CheBanca! AuM platform and CompassPay) and higher
collection costs, already optimized in CIB
Further staff cost reductions in CIB, but now cost base has now bottomed out
201 195 179
198 181
191
Dec11 Dec12 Dec13
Staff cost Administrative expenses
399 -6%
115 110 92
71 73 74
Dec11 Dec12 Dec13
CIB RCB Other
201 194 -8%
198
60 61 60
141 123 135
Dec11 Dec12 Dec13
CIB RCB Other
181
376 -1%
1H 14 Group results Annex 1.1
370
179
191
-8%
-3%
111
Also due to different business mix MB asset quality substantially better than Italian commercial banks
Net NPL/loans ratio* Net NPLS coverage by categories¹
1H 14 Group results Annex 1.1
¹Source: MB Securities, largest six Italian banks; data as at Dec13 for Mediobanca, Sept13 for Italian banks
NPLs to loans: MB 3%, substantially lower than Italian banks (10%) also due to different business mix
Coverage ratios: MB 46%, higher than Italian banks (41%)
287
1,013
471
56
199
Bad loans (sofferenze)
Sub-standard loans
(incagli)
Restructured Overdue (scaduti)
Total NPLs
46%
Coverage ratio (Cofactor excluded)
24% 46% 38% 67%
41% 10% 25% 24% 55% Italian banks
Mediobanca
Italian banks Mediobanca Group
10%
3%
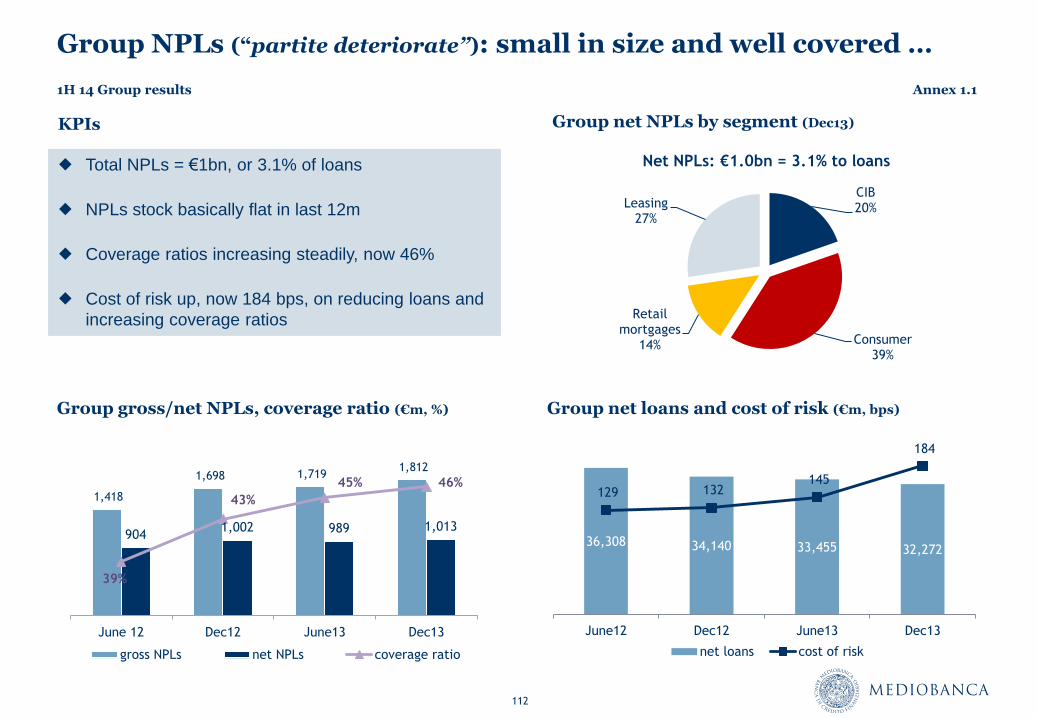
112
Group NPLs (“partite deteriorate”): small in size and well covered …
Group net NPLs by segment (Dec13)
Group gross/net NPLs, coverage ratio (€m, %)
Group net loans and cost of risk (€m, bps)
1,418
1,698 1,719 1,812
904 1,002 989 1,013
39%
43%
45% 46%
June 12 Dec12 June13 Dec13
gross NPLs net NPLs coverage ratio
CIB 20%
Consumer 39%
Retail mortgages
14%
Leasing 27%
Net NPLs: €1.0bn = 3.1% to loans
36,308 34,140 33,455 32,272
129 132 145
184
June12 Dec12 June13 Dec13
net loans cost of risk
1H 14 Group results Annex 1.1
Total NPLs = €1bn, or 3.1% of loans
NPLs stock basically flat in last 12m
Coverage ratios increasing steadily, now 46%
Cost of risk up, now 184 bps, on reducing loans and
increasing coverage ratios
KPIs
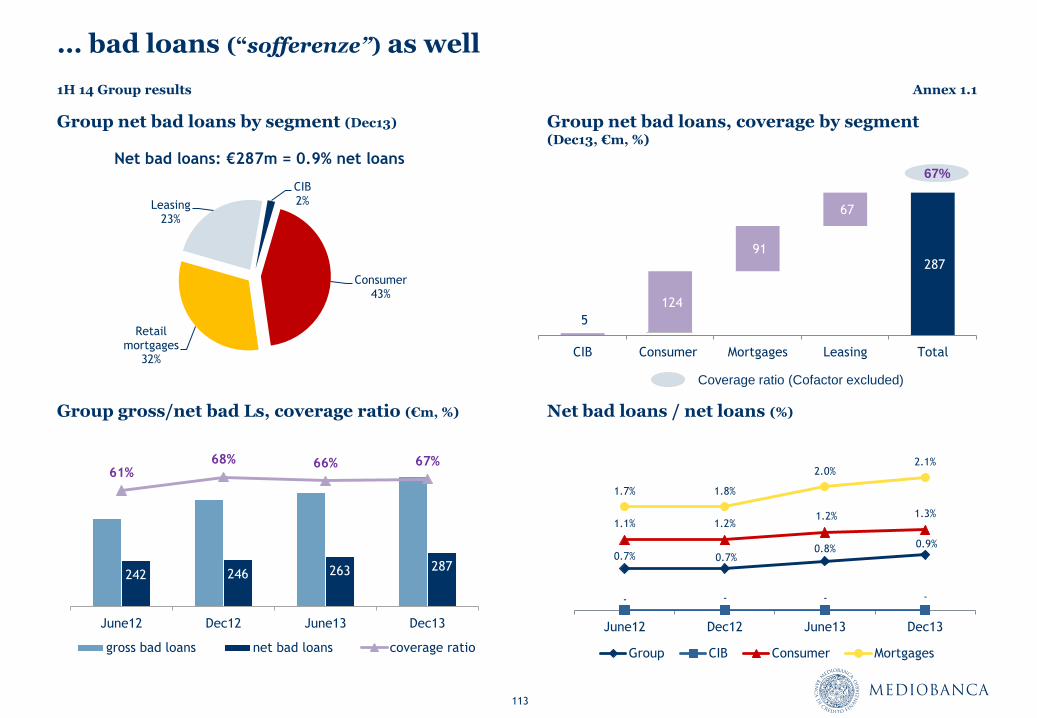
113
… bad loans (“sofferenze”) as well
Group net bad loans by segment (Dec13) Group net bad loans, coverage by segment (Dec13, €m, %)
Group gross/net bad Ls, coverage ratio (€m, %)
Net bad loans / net loans (%)
242 246 263 287
61% 68% 66% 67%
June12 Dec12 June13 Dec13
gross bad loans net bad loans coverage ratio
CIB 2%
Consumer 43%
Retail mortgages
32%
Leasing 23%
Net bad loans: €287m = 0.9% net loans
5
287
124
91
67
CIB Consumer Mortgages Leasing Total
0.7% 0.7% 0.8% 0.9%
- - - -
1.1% 1.2% 1.2% 1.3%
1.7% 1.8%
2.0% 2.1%
June12 Dec12 June13 Dec13
Group CIB Consumer Mortgages
1H 14 Group results Annex 1.1
67%
Coverage ratio (Cofactor excluded)
Segmental reporting
Annex 1.2
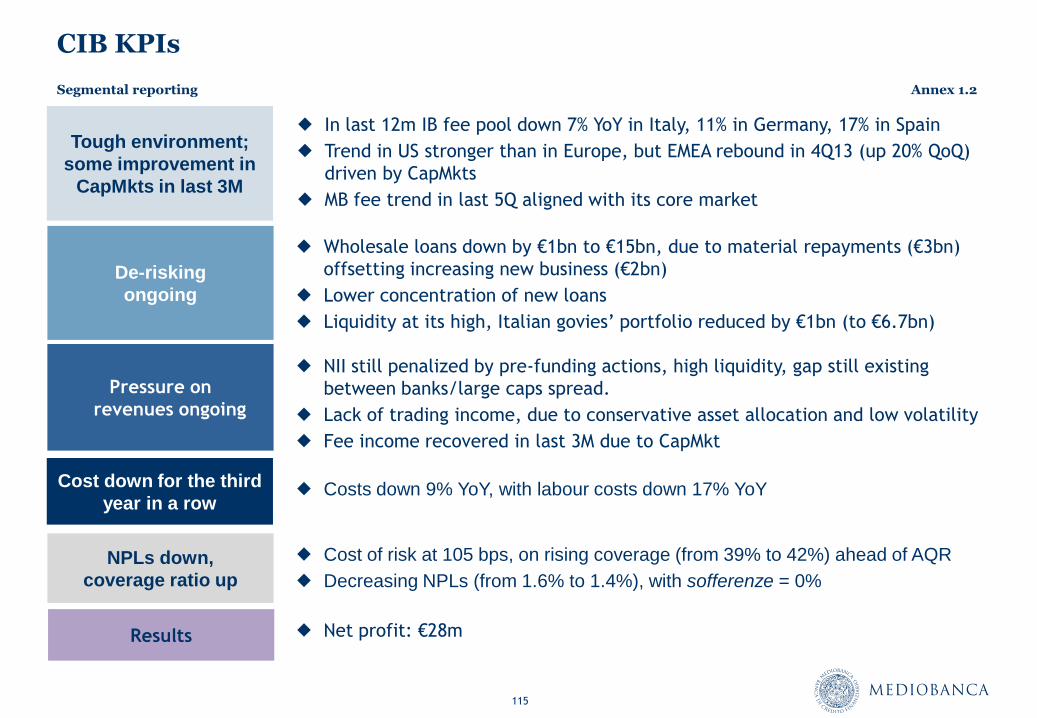
115
CIB KPIs
Results
Pressure on
revenues ongoing
Net profit: €28m
Cost down for the third
year in a row
Cost of risk at 105 bps, on rising coverage (from 39% to 42%) ahead of AQR
Decreasing NPLs (from 1.6% to 1.4%), with sofferenze = 0%
NII still penalized by pre-funding actions, high liquidity, gap still existing
between banks/large caps spread.
Lack of trading income, due to conservative asset allocation and low volatility
Fee income recovered in last 3M due to CapMkt
Tough environment;
some improvement in
CapMkts in last 3M
Wholesale loans down by €1bn to €15bn, due to material repayments (€3bn)
offsetting increasing new business (€2bn)
Lower concentration of new loans
Liquidity at its high, Italian govies’ portfolio reduced by €1bn (to €6.7bn)
NPLs down,
coverage ratio up
Costs down 9% YoY, with labour costs down 17% YoY
De-risking
ongoing
In last 12m IB fee pool down 7% YoY in Italy, 11% in Germany, 17% in Spain
Trend in US stronger than in Europe, but EMEA rebound in 4Q13 (up 20% QoQ)
driven by CapMkts
MB fee trend in last 5Q aligned with its core market
Segmental reporting Annex 1.2
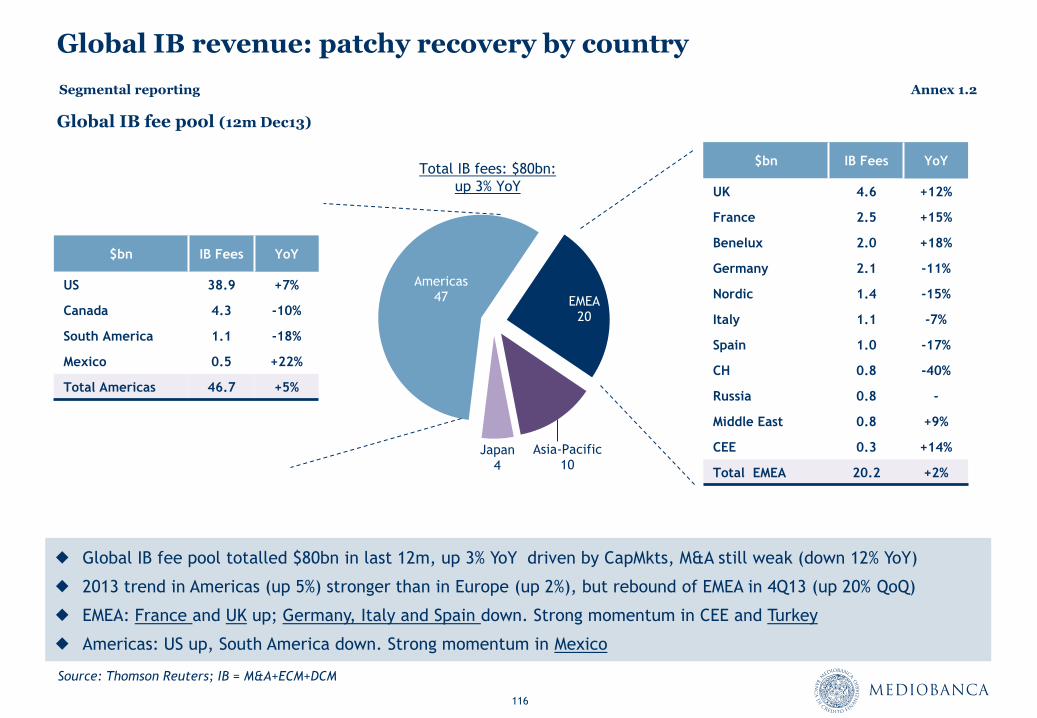
116
Global IB revenue: patchy recovery by country
Global IB fee pool (12m Dec13)
Global IB fee pool totalled $80bn in last 12m, up 3% YoY driven by CapMkts, M&A still weak (down 12% YoY)
2013 trend in Americas (up 5%) stronger than in Europe (up 2%), but rebound of EMEA in 4Q13 (up 20% QoQ)
EMEA: France and UK up; Germany, Italy and Spain down. Strong momentum in CEE and Turkey
Americas: US up, South America down. Strong momentum in Mexico
Americas 47 EMEA
20
Asia-Pacific 10
Japan 4
Total IB fees: $80bn:
up 3% YoY
Source: Thomson Reuters; IB = M&A+ECM+DCM
$bn IB Fees YoY
US 38.9 +7%
Canada 4.3 -10%
South America 1.1 -18%
Mexico 0.5 +22%
Total Americas 46.7 +5%
$bn IB Fees YoY
UK 4.6 +12%
France 2.5 +15%
Benelux 2.0 +18%
Germany 2.1 -11%
Nordic 1.4 -15%
Italy 1.1 -7%
Spain 1.0 -17%
CH 0.8 -40%
Russia 0.8 -
Middle East 0.8 +9%
CEE 0.3 +14%
Total EMEA 20.2 +2%
Segmental reporting Annex 1.2
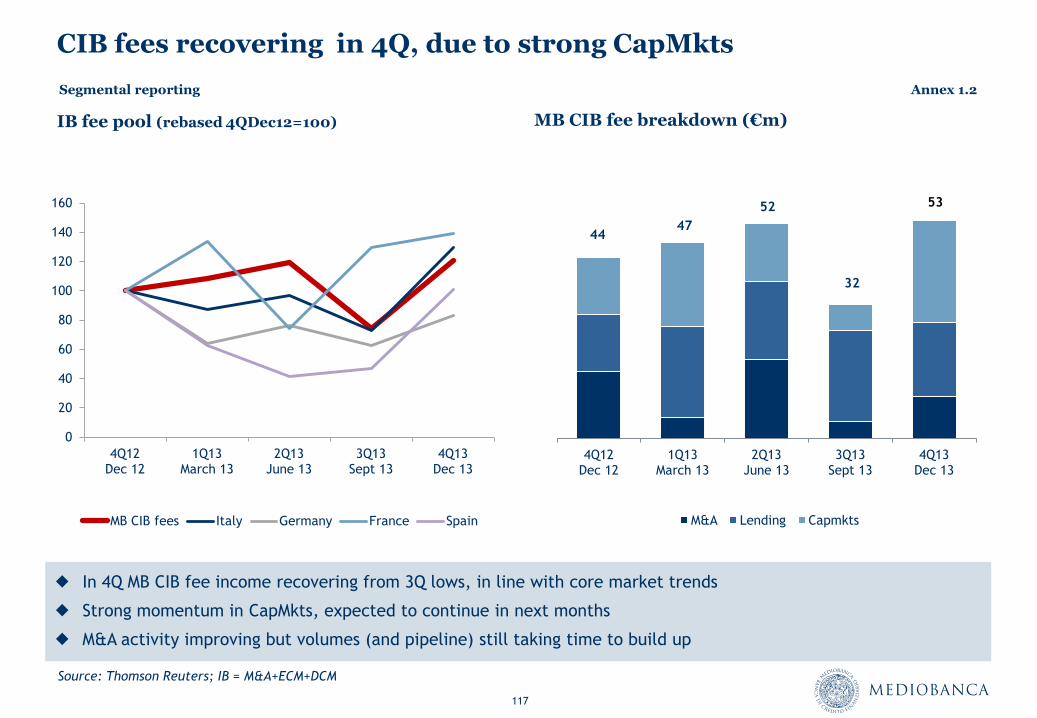
117
CIB fees recovering in 4Q, due to strong CapMkts
IB fee pool (rebased 4QDec12=100)
In 4Q MB CIB fee income recovering from 3Q lows, in line with core market trends
Strong momentum in CapMkts, expected to continue in next months
M&A activity improving but volumes (and pipeline) still taking time to build up
Source: Thomson Reuters; IB = M&A+ECM+DCM
Segmental reporting Annex 1.2
0
20
40
60
80
100
120
140
160
4Q12 Dec 12
1Q13 March 13
2Q13 June 13
3Q13 Sept 13
4Q13 Dec 13
MB CIB fees Italy Germany France Spain
4Q12 Dec 12
1Q13 March 13
2Q13 June 13
3Q13 Sept 13
4Q13 Dec 13
M&A Lending Capmkts
32
53
MB CIB fee breakdown (€m)
44 47
52
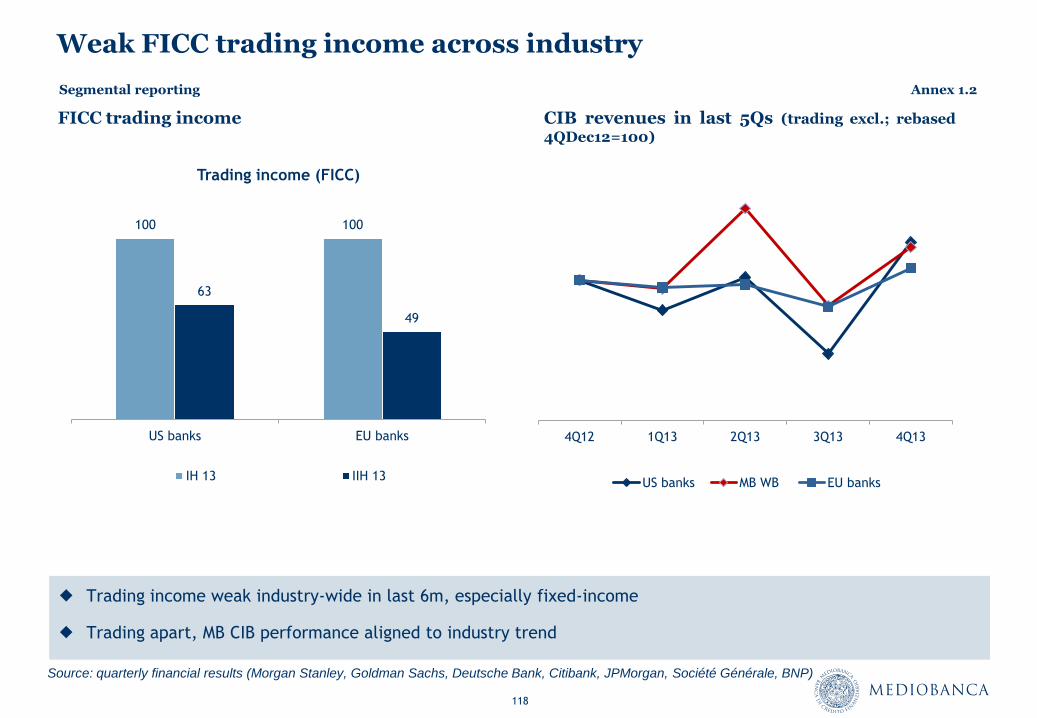
118
Weak FICC trading income across industry
FICC trading income
Source: quarterly financial results (Morgan Stanley, Goldman Sachs, Deutsche Bank, Citibank, JPMorgan, Société Générale, BNP)
CIB revenues in last 5Qs (trading excl.; rebased
4QDec12=100)
Trading income weak industry-wide in last 6m, especially fixed-income
Trading apart, MB CIB performance aligned to industry trend
4Q12 1Q13 2Q13 3Q13 4Q13
US banks MB WB EU banks
Segmental reporting Annex 1.2
100 100
63
49
US banks EU banks
Trading income (FICC)
IH 13 IIH 13
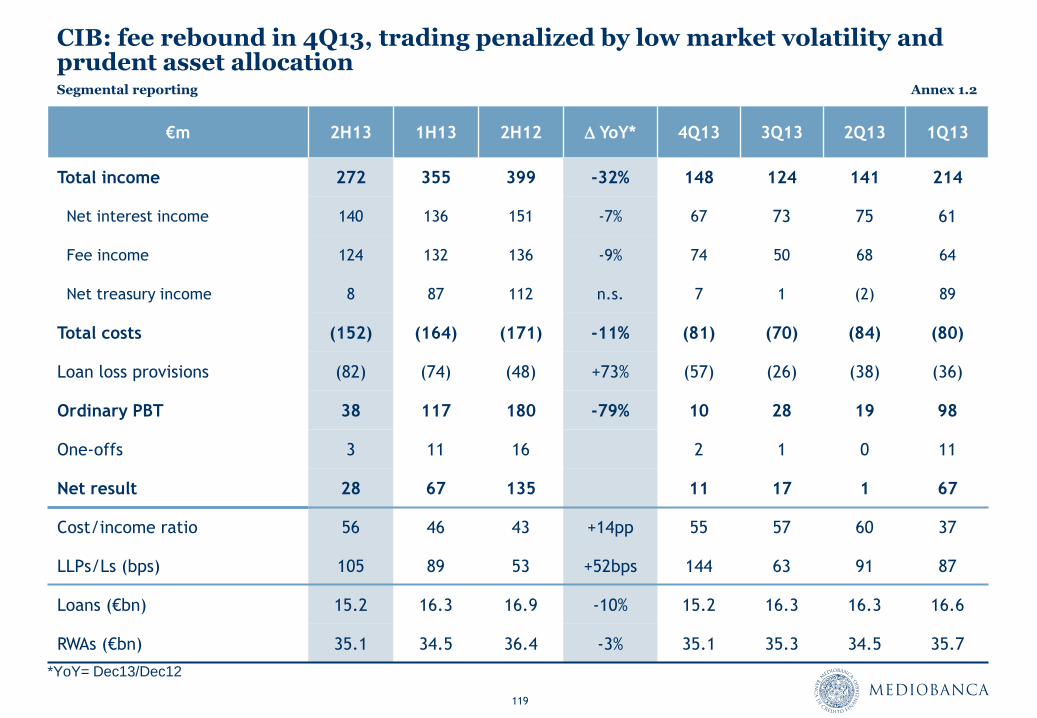
119
CIB: fee rebound in 4Q13, trading penalized by low market volatility and prudent asset allocation
€m 2H13 1H13 2H12 D YoY* 4Q13 3Q13 2Q13 1Q13
Total income 272 355 399 -32% 148 124 141 214
Net interest income 140 136 151 -7% 67 73 75 61
Fee income 124 132 136 -9% 74 50 68 64
Net treasury income 8 87 112 n.s. 7 1 (2) 89
Total costs (152) (164) (171) -11% (81) (70) (84) (80)
Loan loss provisions (82) (74) (48) +73% (57) (26) (38) (36)
Ordinary PBT 38 117 180 -79% 10 28 19 98
One-offs 3 11 16 2 1 0 11
Net result 28 67 135 11 17 1 67
Cost/income ratio 56 46 43 +14pp 55 57 60 37
LLPs/Ls (bps) 105 89 53 +52bps 144 63 91 87
Loans (€bn) 15.2 16.3 16.9 -10% 15.2 16.3 16.3 16.6
RWAs (€bn) 35.1 34.5 36.4 -3% 35.1 35.3 34.5 35.7
*YoY= Dec13/Dec12
Segmental reporting Annex 1.2
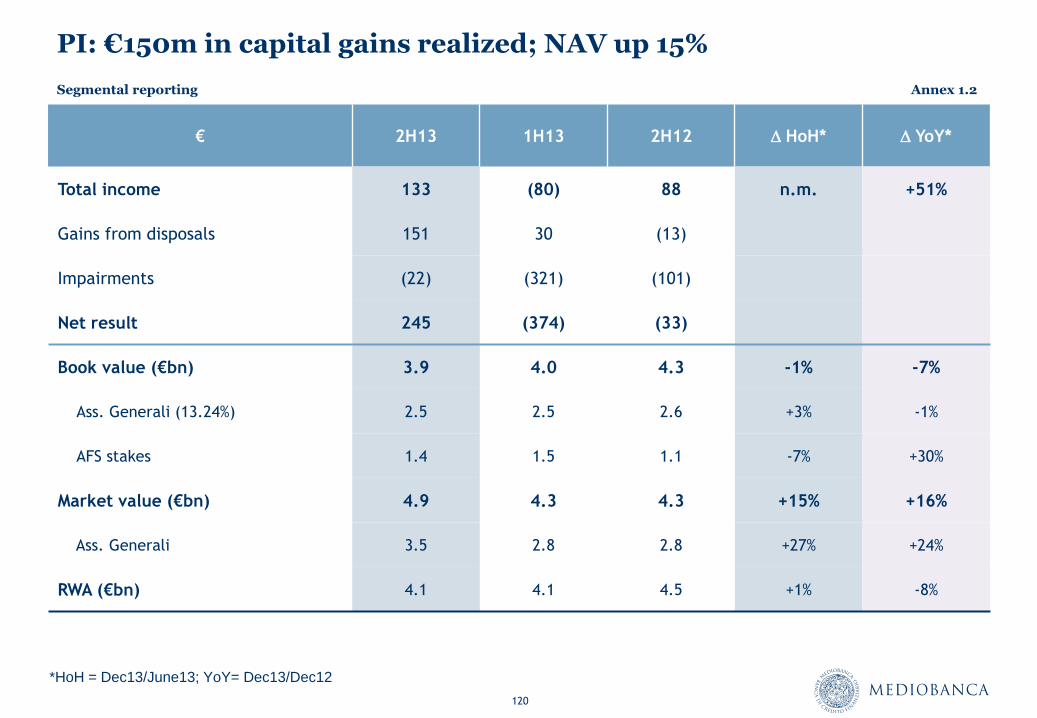
120
PI: €150m in capital gains realized; NAV up 15%
€ 2H13 1H13 2H12 D HoH* D YoY*
Total income 133 (80) 88 n.m. +51%
Gains from disposals 151 30 (13)
Impairments (22) (321) (101)
Net result 245 (374) (33)
Book value (€bn) 3.9 4.0 4.3 -1% -7%
Ass. Generali (13.24%) 2.5 2.5 2.6 +3% -1%
AFS stakes 1.4 1.5 1.1 -7% +30%
Market value (€bn) 4.9 4.3 4.3 +15% +16%
Ass. Generali 3.5 2.8 2.8 +27% +24%
RWA (€bn) 4.1 4.1 4.5 +1% -8%
*HoH = Dec13/June13; YoY= Dec13/Dec12
Segmental reporting Annex 1.2
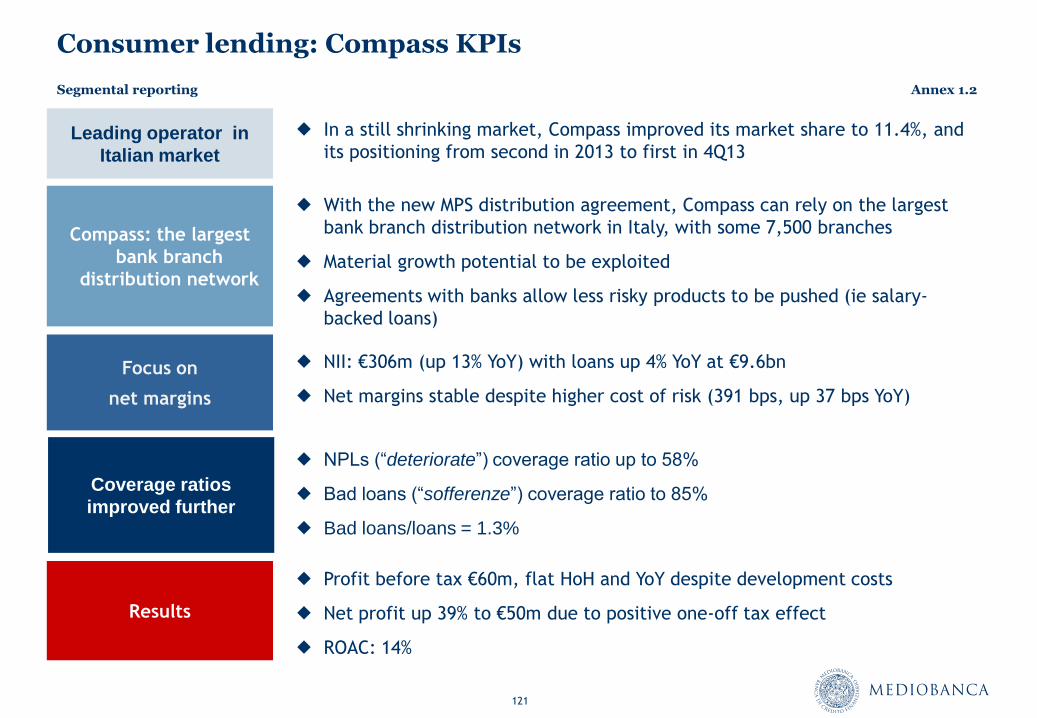
121
Consumer lending: Compass KPIs
Results
Compass: the largest
bank branch
distribution network
Focus on
net margins
Profit before tax €60m, flat HoH and YoY despite development costs
Net profit up 39% to €50m due to positive one-off tax effect
ROAC: 14%
Coverage ratios
improved further
NPLs (“deteriorate”) coverage ratio up to 58%
Bad loans (“sofferenze”) coverage ratio to 85%
Bad loans/loans = 1.3%
With the new MPS distribution agreement, Compass can rely on the largest
bank branch distribution network in Italy, with some 7,500 branches
Material growth potential to be exploited
Agreements with banks allow less risky products to be pushed (ie salary-
backed loans)
NII: €306m (up 13% YoY) with loans up 4% YoY at €9.6bn
Net margins stable despite higher cost of risk (391 bps, up 37 bps YoY)
In a still shrinking market, Compass improved its market share to 11.4%, and
its positioning from second in 2013 to first in 4Q13 Leading operator in
Italian market
Segmental reporting Annex 1.2
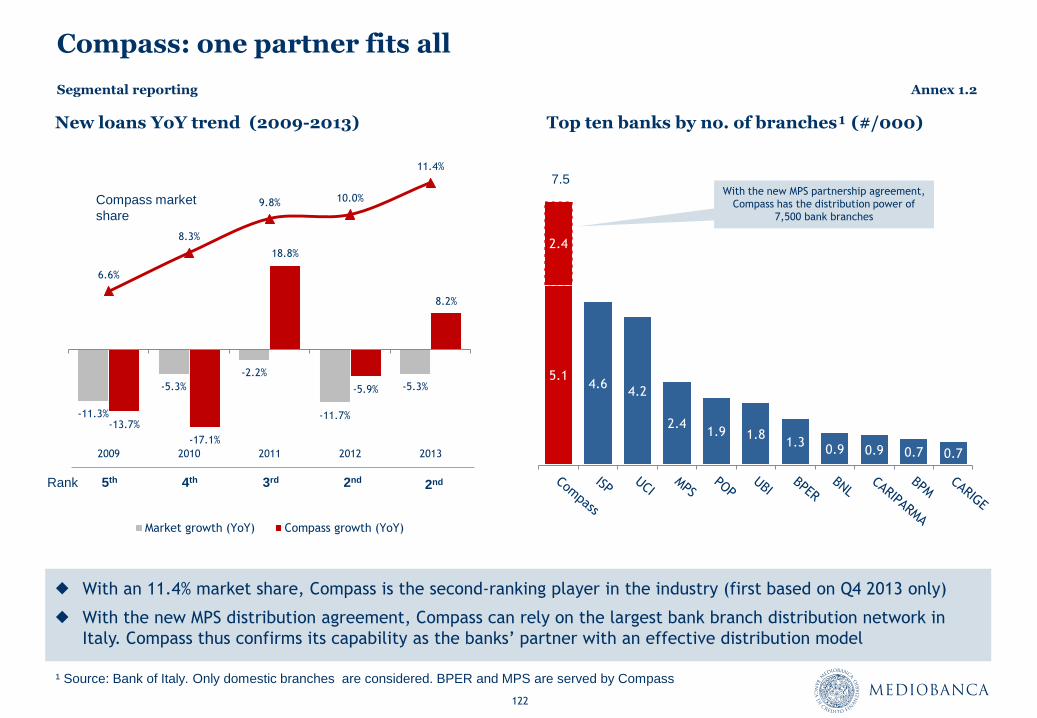
122
Compass: one partner fits all
Top ten banks by no. of branches¹ (#/000)
With an 11.4% market share, Compass is the second-ranking player in the industry (first based on Q4 2013 only)
With the new MPS distribution agreement, Compass can rely on the largest bank branch distribution network in
Italy. Compass thus confirms its capability as the banks’ partner with an effective distribution model
New loans YoY trend (2009-2013)
¹ Source: Bank of Italy. Only domestic branches are considered. BPER and MPS are served by Compass
5.1 4.6
4.2
2.4 1.9 1.8
1.3 0.9 0.9 0.7 0.7
2.4
With the new MPS partnership agreement,
Compass has the distribution power of
7,500 bank branches
7.5
-11.3%
-5.3%
-2.2%
-11.7%
-5.3%
-13.7%
-17.1%
18.8%
-5.9%
8.2%
6.6%
8.3%
9.8% 10.0%
11.4%
0.0%
2.0%
4.0%
6.0%
8.0%
10.0%
12.0%
-20.0%
-10.0%
0.0%
10.0%
20.0%
30.0%
40.0%
2009 2010 2011 2012 2013
Market growth (YoY) Compass growth (YoY)
Rank 2nd 5th 4th 3rd 2nd
Compass market
share
Segmental reporting Annex 1.2
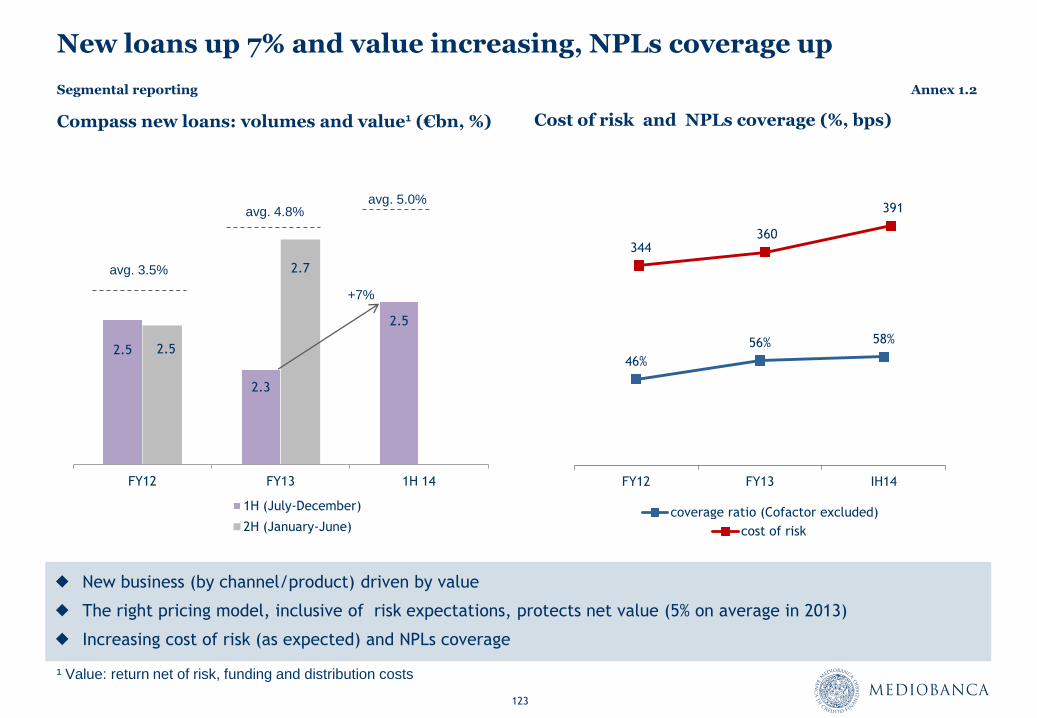
123
344 360
391
cost of risk
2.5
2.3
2.5
2.5
2.7
FY12 FY13 1H 14
1H (July-December)
2H (January-June)
New loans up 7% and value increasing, NPLs coverage up
Compass new loans: volumes and value¹ (€bn, %)
New business (by channel/product) driven by value
The right pricing model, inclusive of risk expectations, protects net value (5% on average in 2013)
Increasing cost of risk (as expected) and NPLs coverage
Cost of risk and NPLs coverage (%, bps)
¹ Value: return net of risk, funding and distribution costs
46%
56% 58%
FY12 FY13 IH14
coverage ratio (Cofactor excluded)
avg. 5.0% avg. 4.8%
avg. 3.5%
+7%
Segmental reporting Annex 1.2
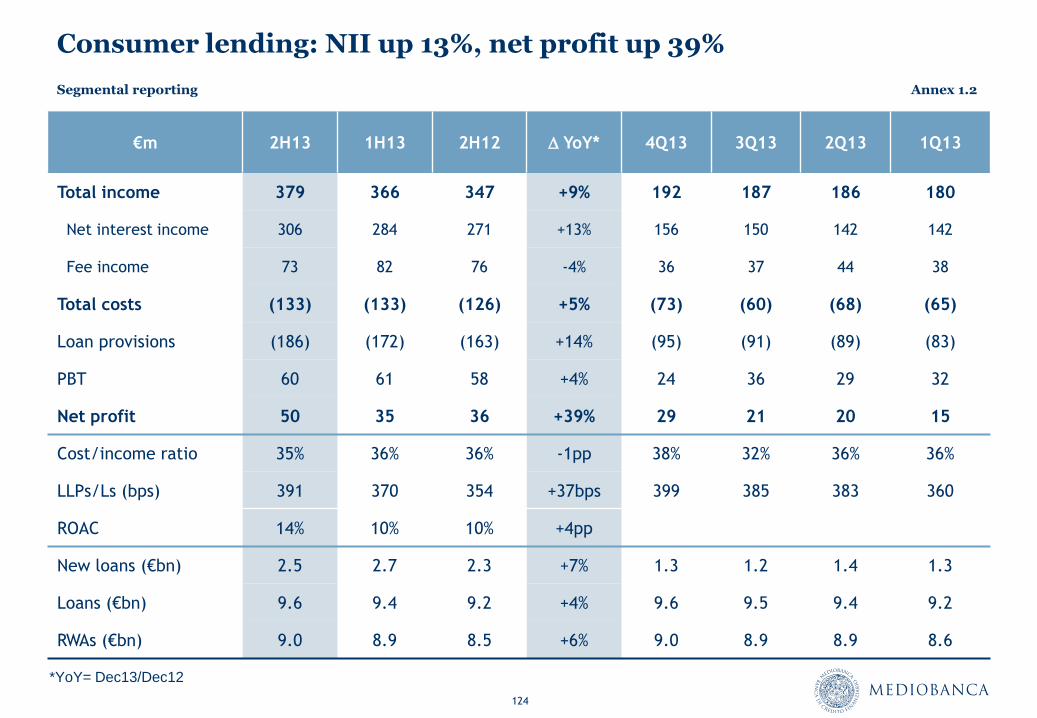
124
Consumer lending: NII up 13%, net profit up 39%
€m 2H13 1H13 2H12 D YoY* 4Q13 3Q13 2Q13 1Q13
Total income 379 366 347 +9% 192 187 186 180
Net interest income 306 284 271 +13% 156 150 142 142
Fee income 73 82 76 -4% 36 37 44 38
Total costs (133) (133) (126) +5% (73) (60) (68) (65)
Loan provisions (186) (172) (163) +14% (95) (91) (89) (83)
PBT 60 61 58 +4% 24 36 29 32
Net profit 50 35 36 +39% 29 21 20 15
Cost/income ratio 35% 36% 36% -1pp 38% 32% 36% 36%
LLPs/Ls (bps) 391 370 354 +37bps 399 385 383 360
ROAC 14% 10% 10% +4pp
New loans (€bn) 2.5 2.7 2.3 +7% 1.3 1.2 1.4 1.3
Loans (€bn) 9.6 9.4 9.2 +4% 9.6 9.5 9.4 9.2
RWAs (€bn) 9.0 8.9 8.5 +6% 9.0 8.9 8.9 8.6
*YoY= Dec13/Dec12
Segmental reporting Annex 1.2
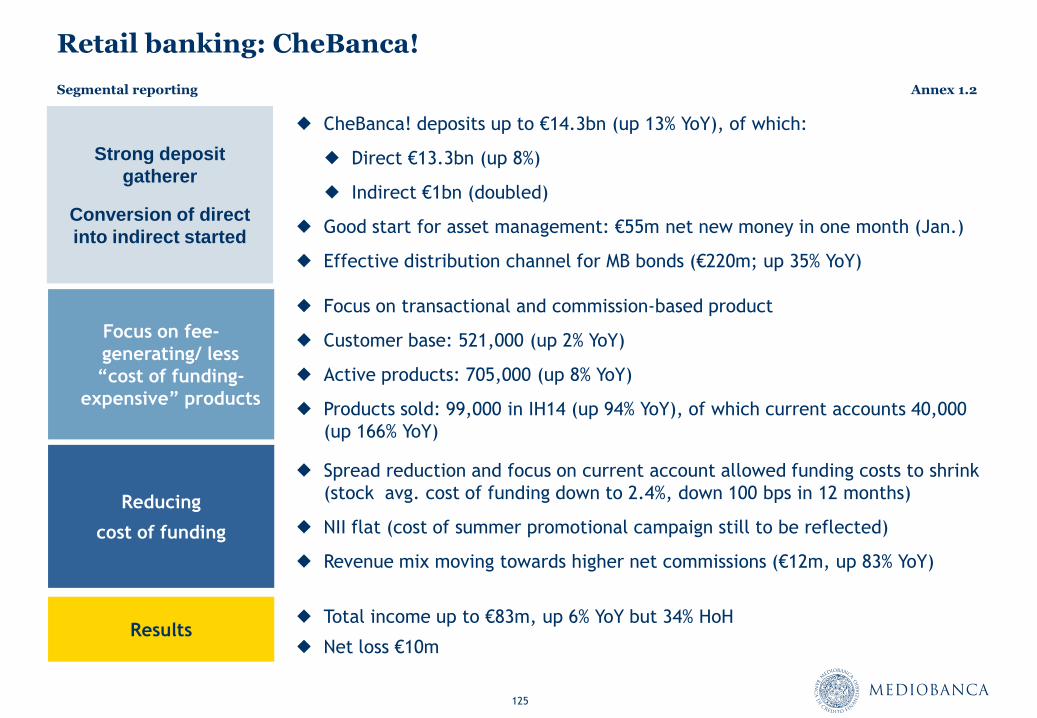
125
Retail banking: CheBanca!
Results
Focus on fee-
generating/ less
“cost of funding-
expensive” products
Reducing
cost of funding
Total income up to €83m, up 6% YoY but 34% HoH
Net loss €10m
Strong deposit
gatherer
Conversion of direct
into indirect started
Focus on transactional and commission-based product
Customer base: 521,000 (up 2% YoY)
Active products: 705,000 (up 8% YoY)
Products sold: 99,000 in IH14 (up 94% YoY), of which current accounts 40,000
(up 166% YoY)
Spread reduction and focus on current account allowed funding costs to shrink
(stock avg. cost of funding down to 2.4%, down 100 bps in 12 months)
NII flat (cost of summer promotional campaign still to be reflected)
Revenue mix moving towards higher net commissions (€12m, up 83% YoY)
CheBanca! deposits up to €14.3bn (up 13% YoY), of which:
Direct €13.3bn (up 8%)
Indirect €1bn (doubled)
Good start for asset management: €55m net new money in one month (Jan.)
Effective distribution channel for MB bonds (€220m; up 35% YoY)
Segmental reporting Annex 1.2
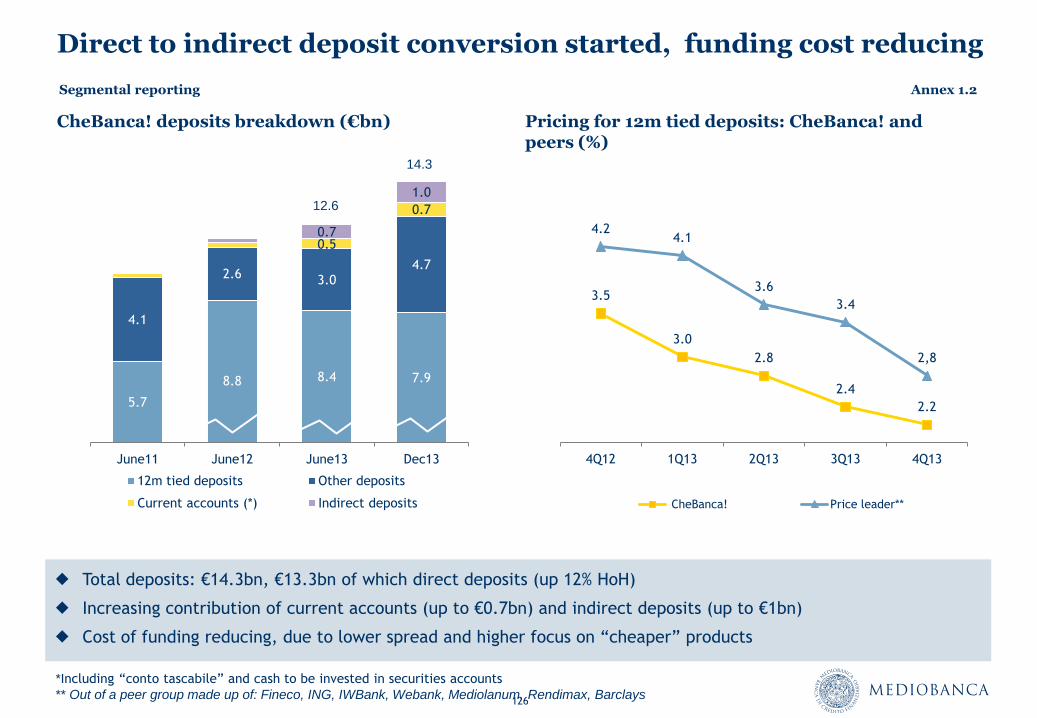
126
Direct to indirect deposit conversion started, funding cost reducing
CheBanca! deposits breakdown (€bn)
Total deposits: €14.3bn, €13.3bn of which direct deposits (up 12% HoH)
Increasing contribution of current accounts (up to €0.7bn) and indirect deposits (up to €1bn)
Cost of funding reducing, due to lower spread and higher focus on “cheaper” products
*Including “conto tascabile” and cash to be invested in securities accounts
** Out of a peer group made up of: Fineco, ING, IWBank, Webank, Mediolanum, Rendimax, Barclays
Pricing for 12m tied deposits: CheBanca! and peers (%)
3.5
3.0
2.8
2.4
2.2
4.2 4.1
3.6
3.4
2,8
4Q12 1Q13 2Q13 3Q13 4Q13
CheBanca! Price leader**
5.7
8.8 8.4 7.9
4.1
2.6 3.0 4.7
0.5
0.7
0.7
1.0
June11 June12 June13 Dec13
12m tied deposits Other deposits
Current accounts (*) Indirect deposits
14.3
12.6
Segmental reporting Annex 1.2
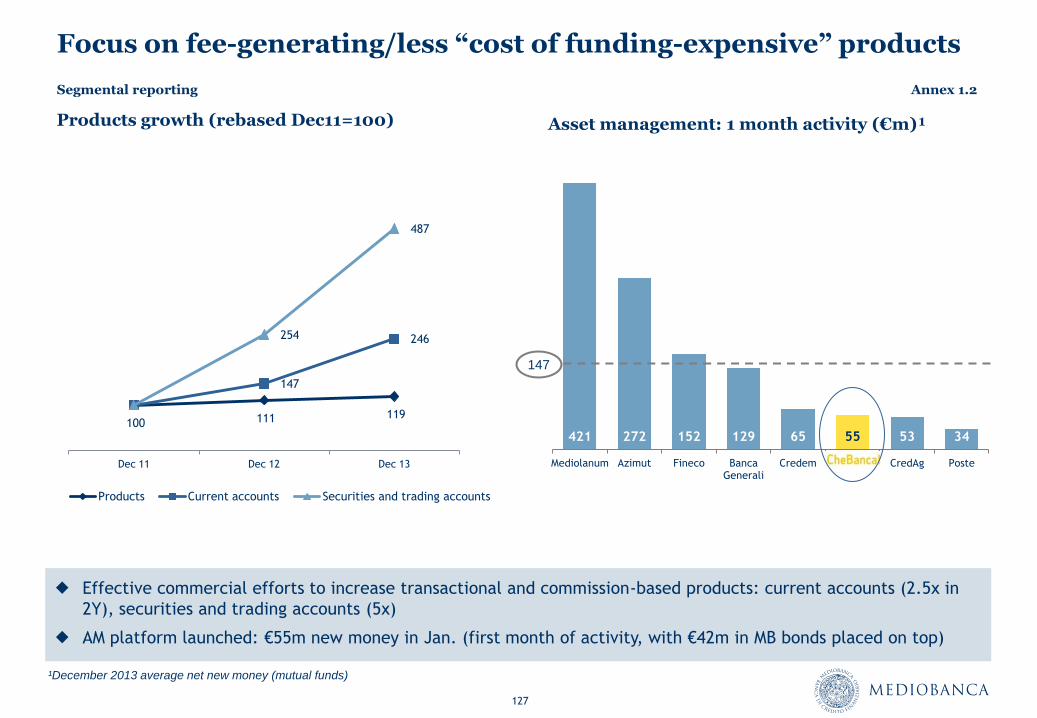
127
Focus on fee-generating/less “cost of funding-expensive” products
Effective commercial efforts to increase transactional and commission-based products: current accounts (2.5x in
2Y), securities and trading accounts (5x)
AM platform launched: €55m new money in Jan. (first month of activity, with €42m in MB bonds placed on top)
Products growth (rebased Dec11=100)
100 111 119
147
246 254
487
Dec 11 Dec 12 Dec 13
Products Current accounts Securities and trading accounts
Asset management: 1 month activity (€m)¹
421 272 152 129 65 55 53 34
Mediolanum Azimut Fineco Banca Generali
Credem CredAg Poste
147
¹December 2013 average net new money (mutual funds)
Segmental reporting Annex 1.2
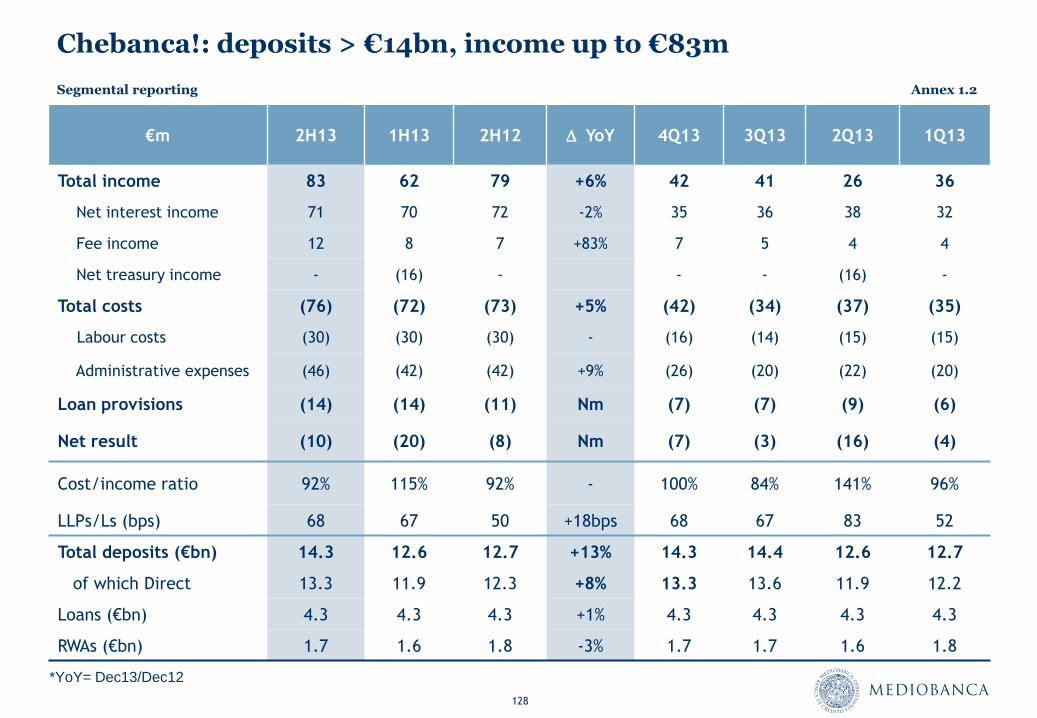
128
Chebanca!: deposits > €14bn, income up to €83m
€m 2H13 1H13 2H12 D YoY 4Q13 3Q13 2Q13 1Q13
Total income 83 62 79 +6% 42 41 26 36
Net interest income 71 70 72 -2% 35 36 38 32
Fee income 12 8 7 +83% 7 5 4 4
Net treasury income - (16) - - - (16) -
Total costs (76) (72) (73) +5% (42) (34) (37) (35)
Labour costs (30) (30) (30) - (16) (14) (15) (15)
Administrative expenses (46) (42) (42) +9% (26) (20) (22) (20)
Loan provisions (14) (14) (11) Nm (7) (7) (9) (6)
Net result (10) (20) (8) Nm (7) (3) (16) (4)
Cost/income ratio 92% 115% 92% - 100% 84% 141% 96%
LLPs/Ls (bps) 68 67 50 +18bps 68 67 83 52
Total deposits (€bn) 14.3 12.6 12.7 +13% 14.3 14.4 12.6 12.7
of which Direct 13.3 11.9 12.3 +8% 13.3 13.6 11.9 12.2
Loans (€bn) 4.3 4.3 4.3 +1% 4.3 4.3 4.3 4.3
RWAs (€bn) 1.7 1.6 1.8 -3% 1.7 1.7 1.6 1.8
*YoY= Dec13/Dec12
Segmental reporting Annex 1.2
Closing remarks
Annex 1.3
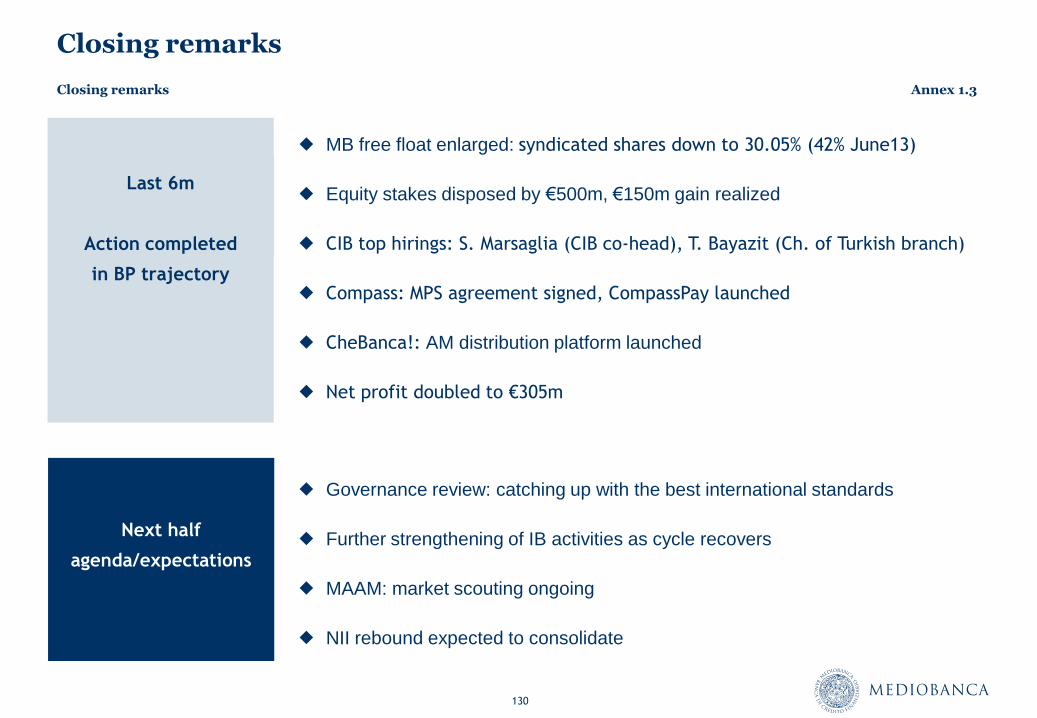
130
Next half
agenda/expectations
Governance review: catching up with the best international standards
Further strengthening of IB activities as cycle recovers
MAAM: market scouting ongoing
NII rebound expected to consolidate
Closing remarks
Solid
underlying
profitability
Last 6m
Action completed
in BP trajectory
MB free float enlarged: syndicated shares down to 30.05% (42% June13)
Equity stakes disposed by €500m, €150m gain realized
CIB top hirings: S. Marsaglia (CIB co-head), T. Bayazit (Ch. of Turkish branch)
Compass: MPS agreement signed, CompassPay launched
CheBanca!: AM distribution platform launched
Net profit doubled to €305m
Closing remarks Annex 1.3
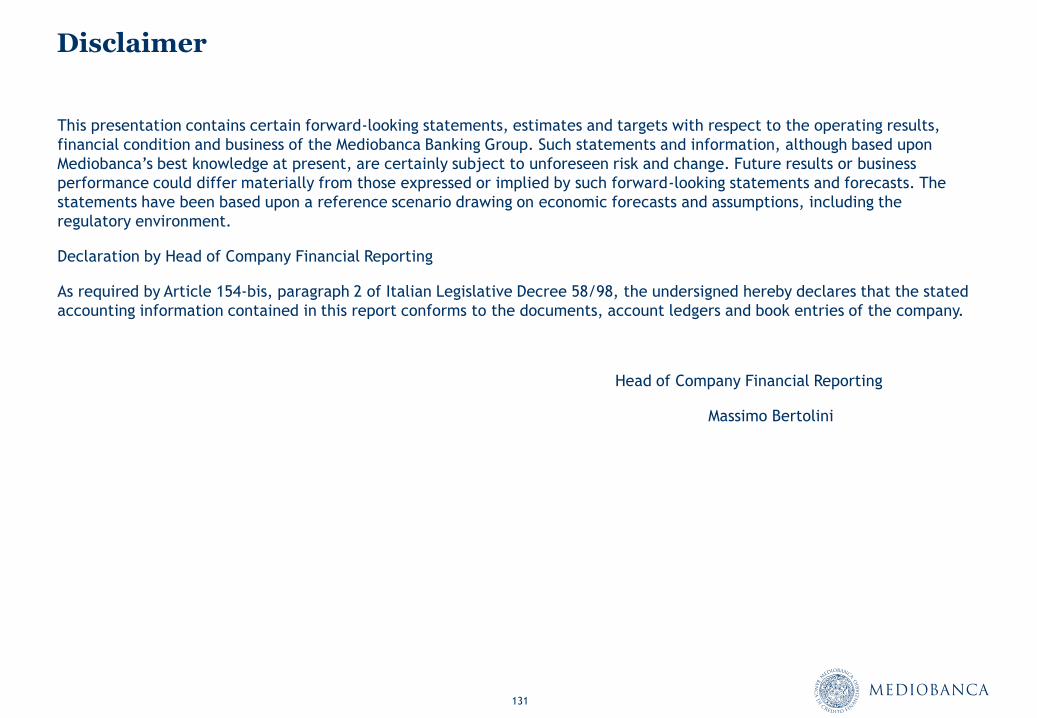
131
This presentation contains certain forward-looking statements, estimates and targets with respect to the operating results,
financial condition and business of the Mediobanca Banking Group. Such statements and information, although based upon
Mediobanca’s best knowledge at present, are certainly subject to unforeseen risk and change. Future results or business
performance could differ materially from those expressed or implied by such forward-looking statements and forecasts. The
statements have been based upon a reference scenario drawing on economic forecasts and assumptions, including the
regulatory environment.
Declaration by Head of Company Financial Reporting
As required by Article 154-bis, paragraph 2 of Italian Legislative Decree 58/98, the undersigned hereby declares that the stated
accounting information contained in this report conforms to the documents, account ledgers and book entries of the company.
Head of Company Financial Reporting
Massimo Bertolini
Disclaimer
132
Investor contacts
Mediobanca Group
Investor Relations
Piazzetta Cuccia 1, 20121 Milan, Italy
Jessica Spina Tel. no. (0039) 02-8829.860
Luisa Demaria Tel. no. (0039) 02-8829.647
Email: [email protected]
http://www.mediobanca.com