Embed Size (px)
Citation preview
Prime-Age EPOP by State
Oregon Office of Economic AnalysisMay 2017

Oregon Office ofEconomic Analysis
2
Healthy State Labor Markets
43
26
20
15
2
05
101520253035404550
Total NonfarmEmployment
UnemploymentRate
ParticipationGap
Wants Full-TimeJob
Prime-AgeEPOP
U.S. States at Full EmploymentNumber of States Regaining Pre-Great Recession Labor Markets
Calculations Total Nonfarm: SA 3MMA, Apr '17 vs pre-recession peak. Discrepencies: AK, ND count as no, MI, OK, RI count as yes. Unemp Rate: if state rate in Apr '17 was lower than or within 0.1% from pre-recession low. Participation Gap: Apr '17 LFPR relative to demographically adjusted full employment LFPR. Wants Full-Time Job: if 2017q1 share of LF that is part-time for economic reasons is below the state's 2005-07 average share. Prime-Age EPOP: 12 MMA, if Mar '17 prime-age EPOP above pre-recession peak prime-age EPOP | Sources: BLS, Census, IPUMS-CPS, Oregon Office of Economic Analysis
Oregon Office ofEconomic Analysis
3
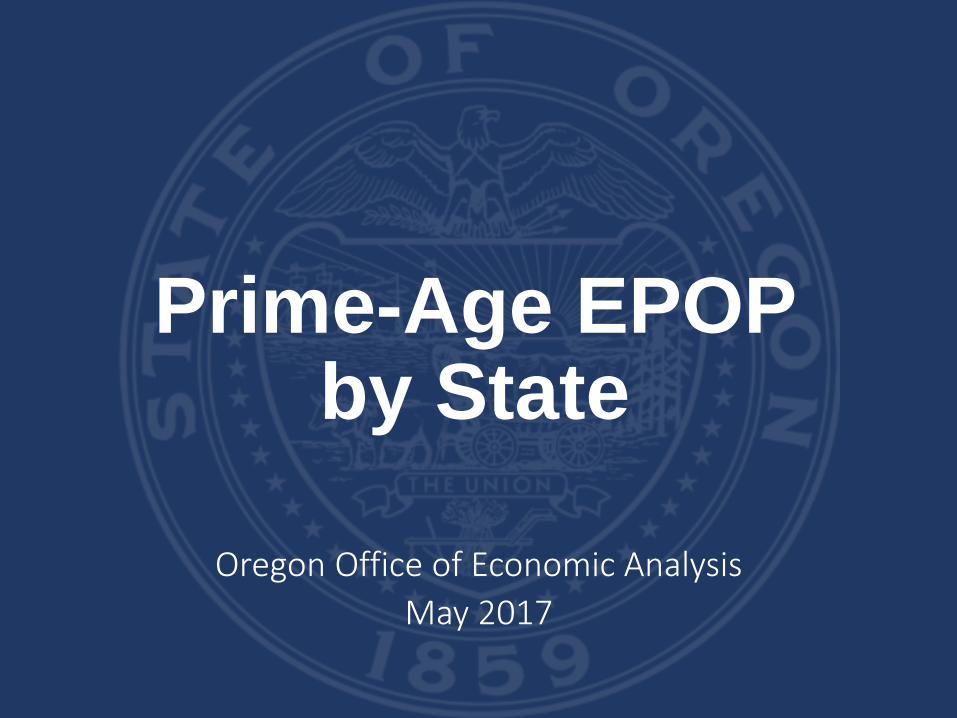
Share of Prime Working-Age Population with a JobMarch 2017 Relative to Pre-Great Recession Peak for Share of 25-54 Year Olds with a Job
Data: 12 MMA | Source: IPUMS-CPS, Oregon Office of Economic Analysis
> 0%
< -3%
-1% to 0%-2% to -1%
-3% to -2%
Percentage Point Difference
U.S.A. -2%

Oregon Office ofEconomic Analysis
4
Pacific Northwest EPOP
OR has recovered across all age cohorts. Except teenagers
ID has recovered across most age groups. EPOP for middle-aged Idahoans is low. OR looked exactly like this in 2015.
MT generally lower across all age groups, with noisy data.
WA low across most age groups. Larger share of 60+ working, as seen in nearly all states.
Oregon Office ofEconomic Analysis
5
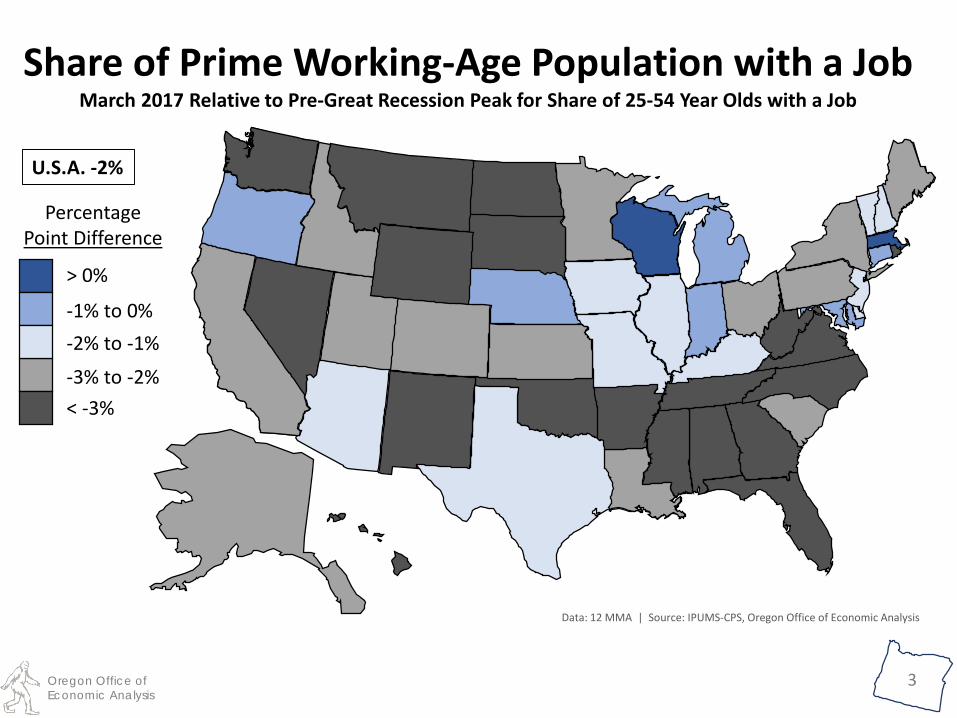
Pacific Northwest EPOP
Data is noisy and based on relatively small sample sizes.
Oregon: Same general trends as U.S., however strong rebound in past two years.
Idaho: Largest decline among PNW states. Strong recovery thus far, but still room to go.
Montana: Started to see a recovery until the oil crash hit energy states starting in late 2014
Washington: Not much recovery in prime-age EPOP to date

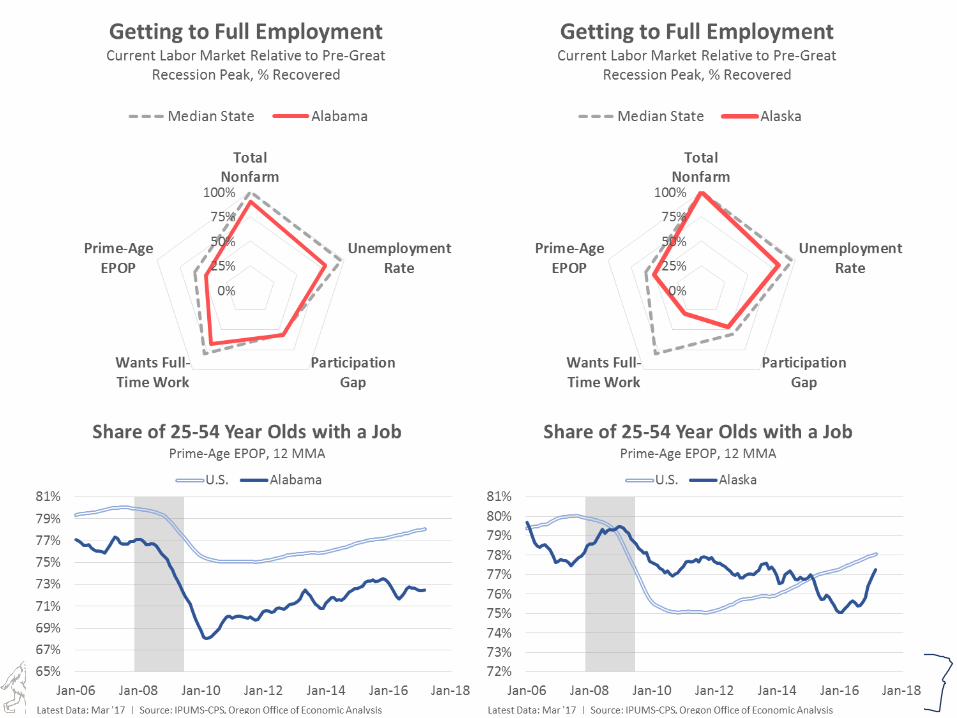
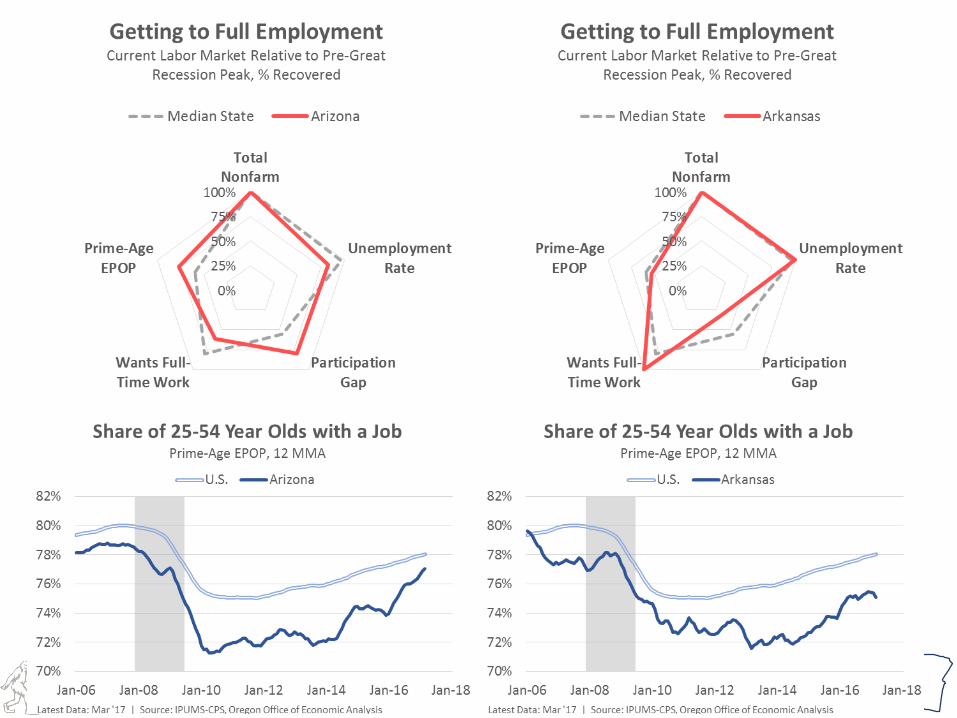
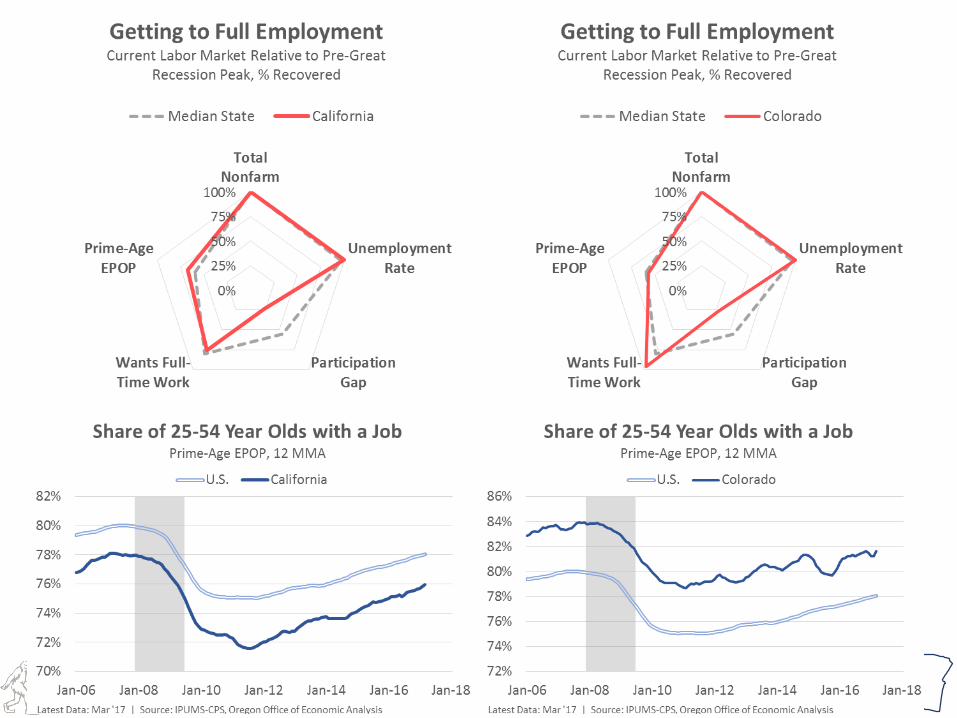
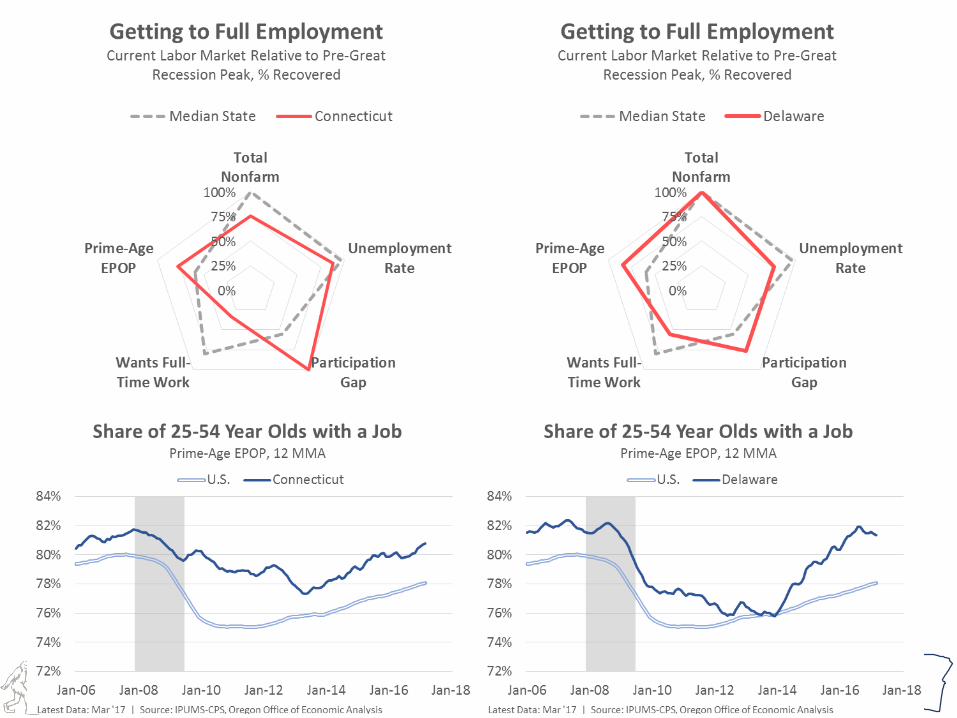
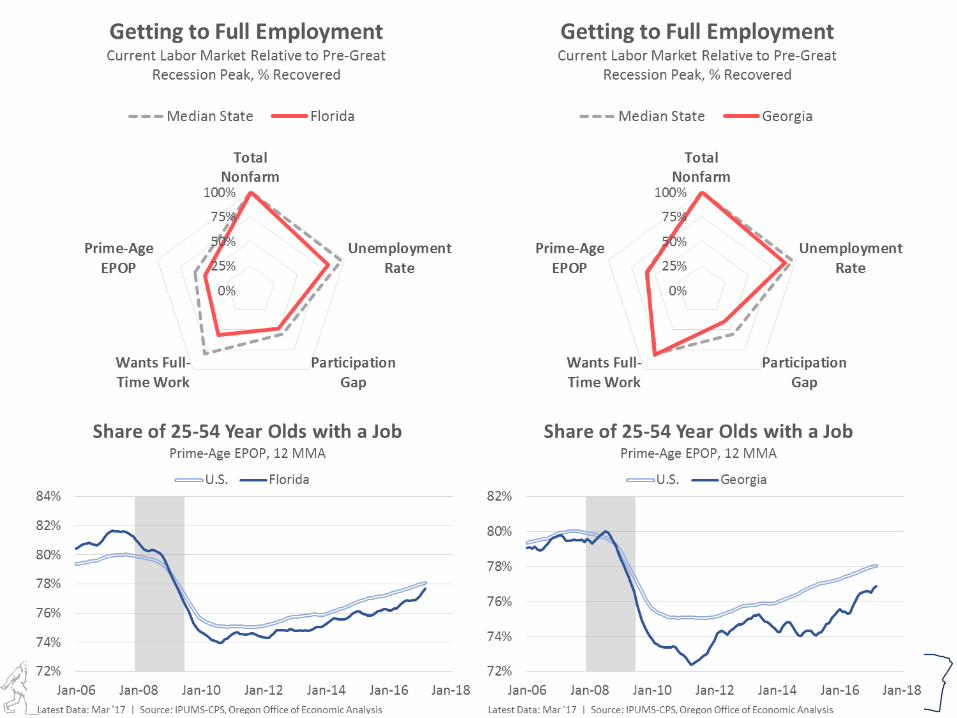
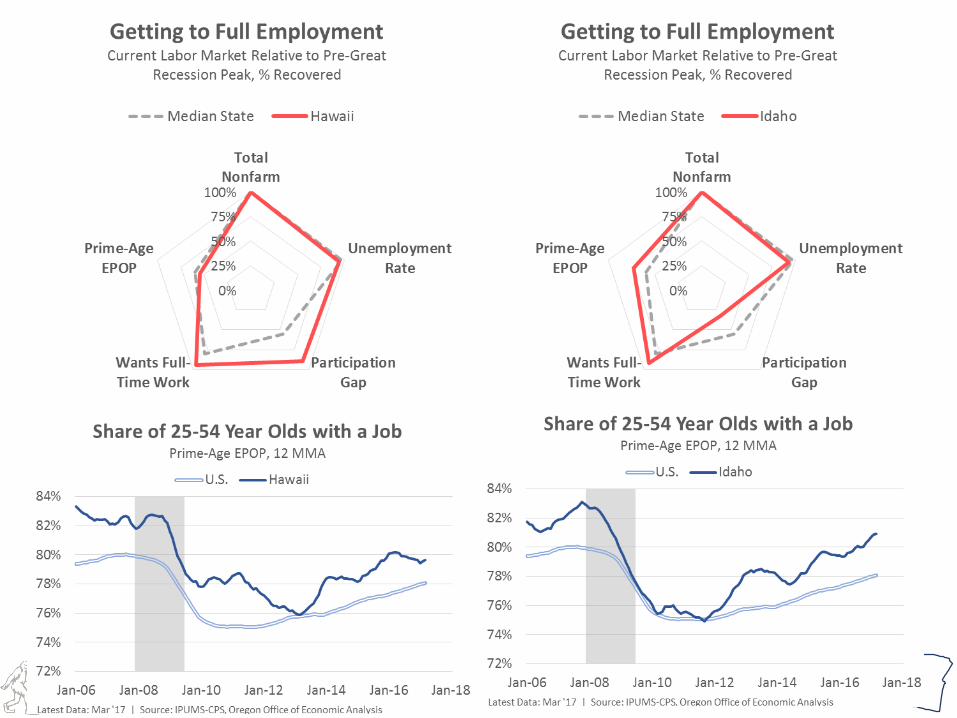
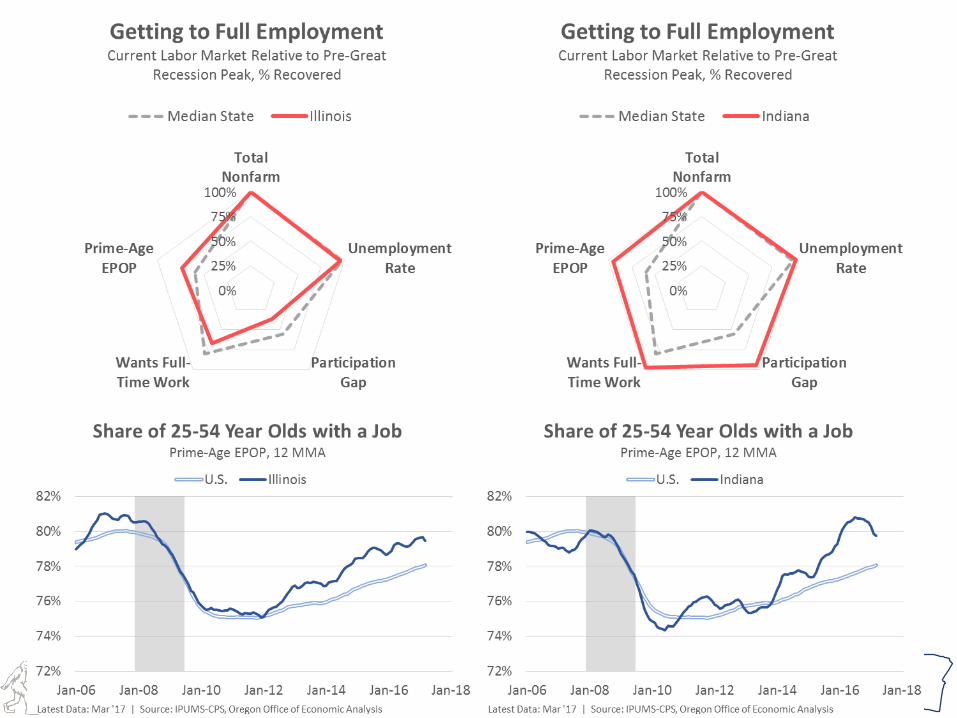
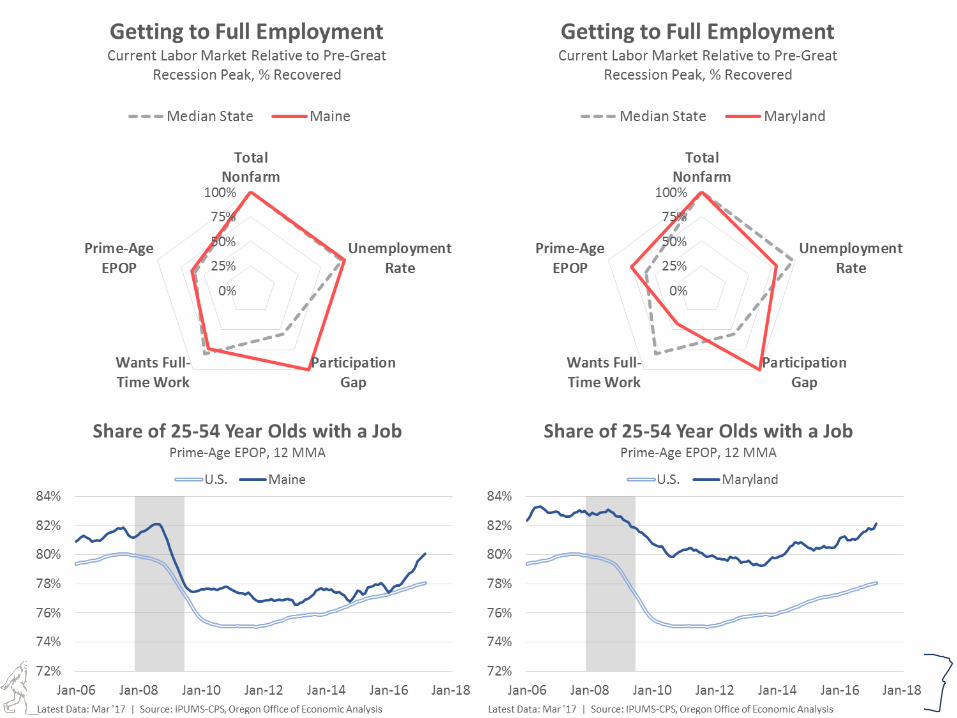
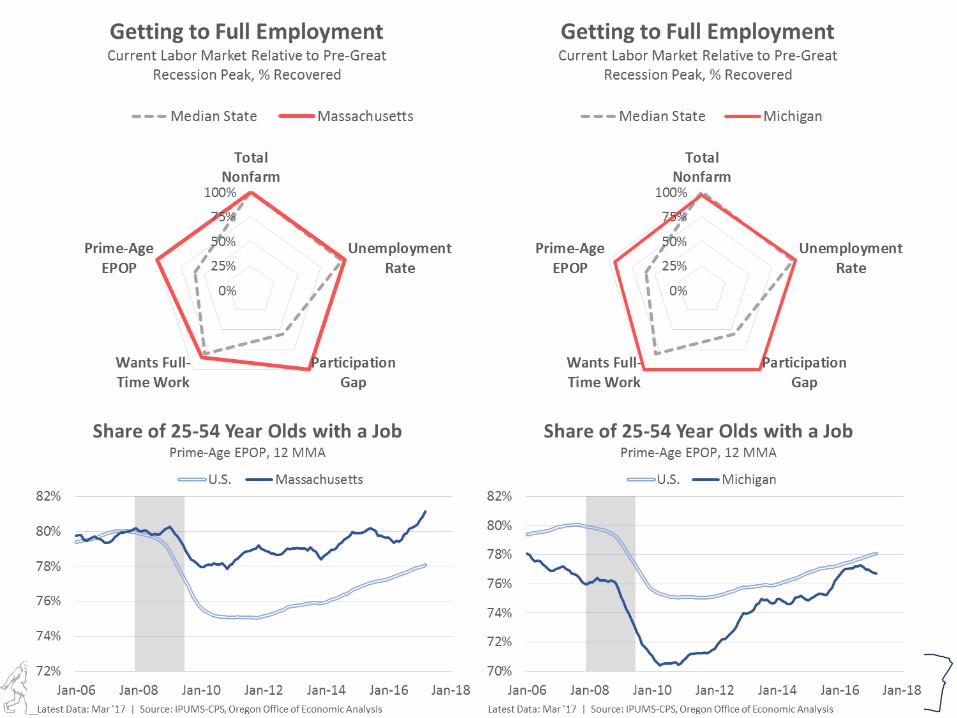
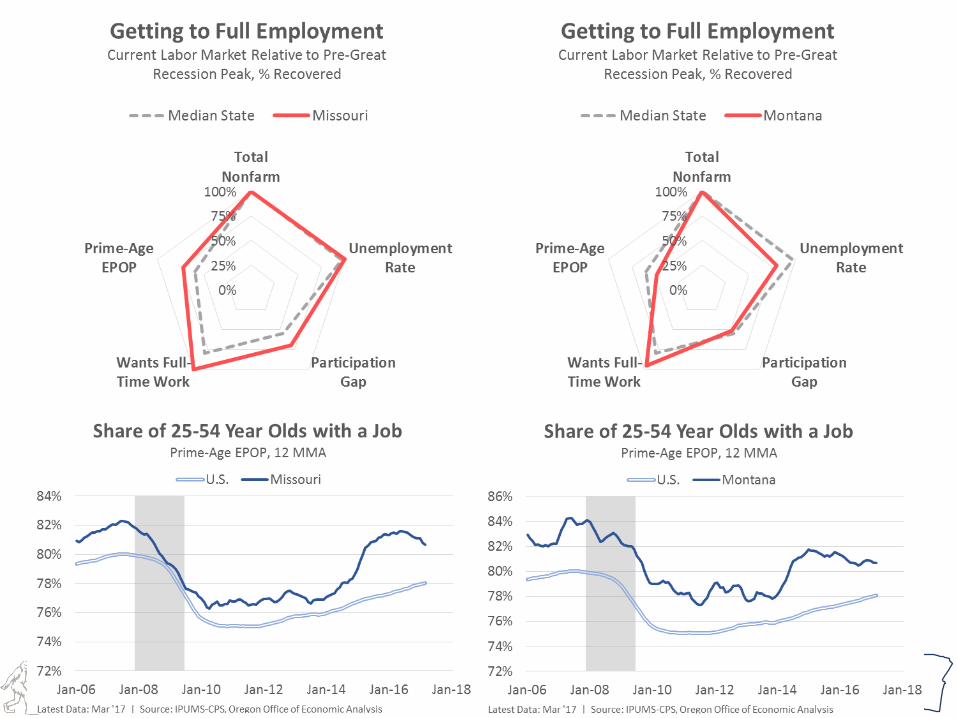
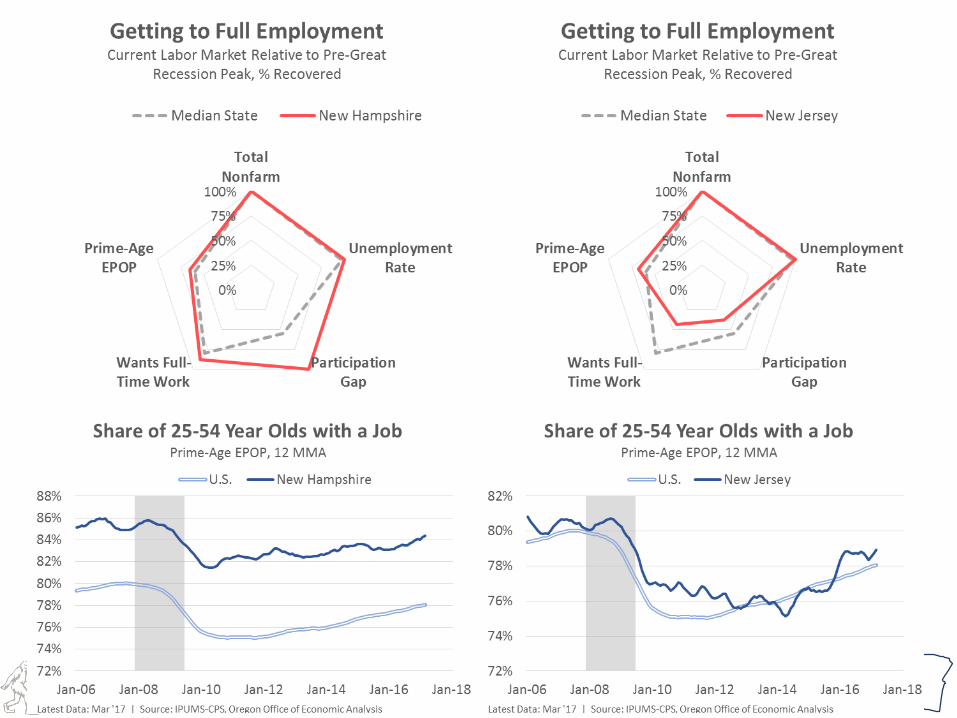
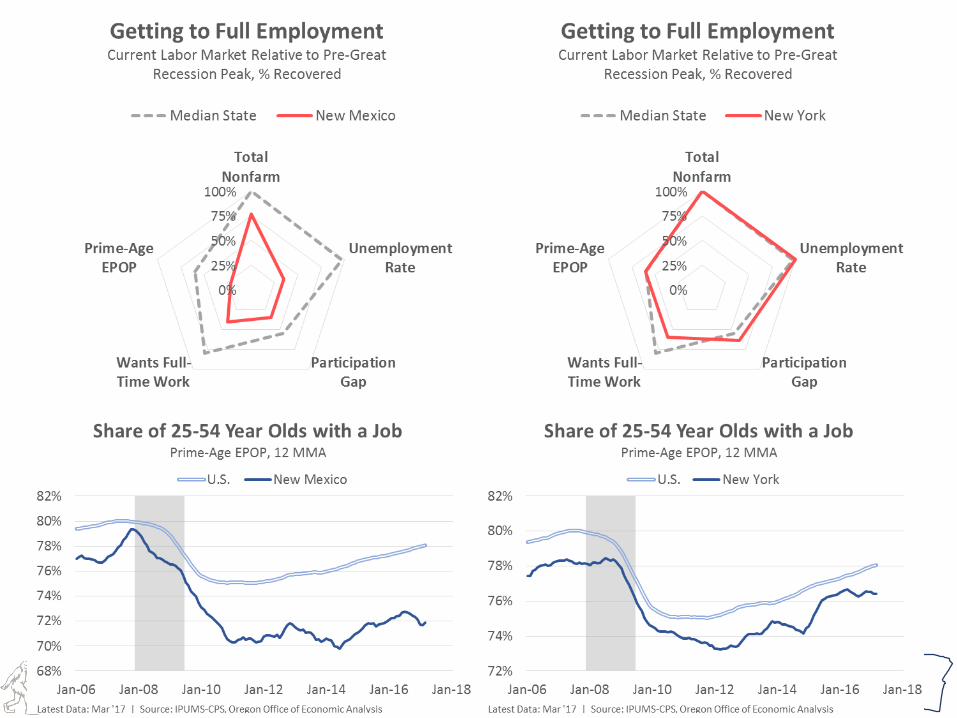
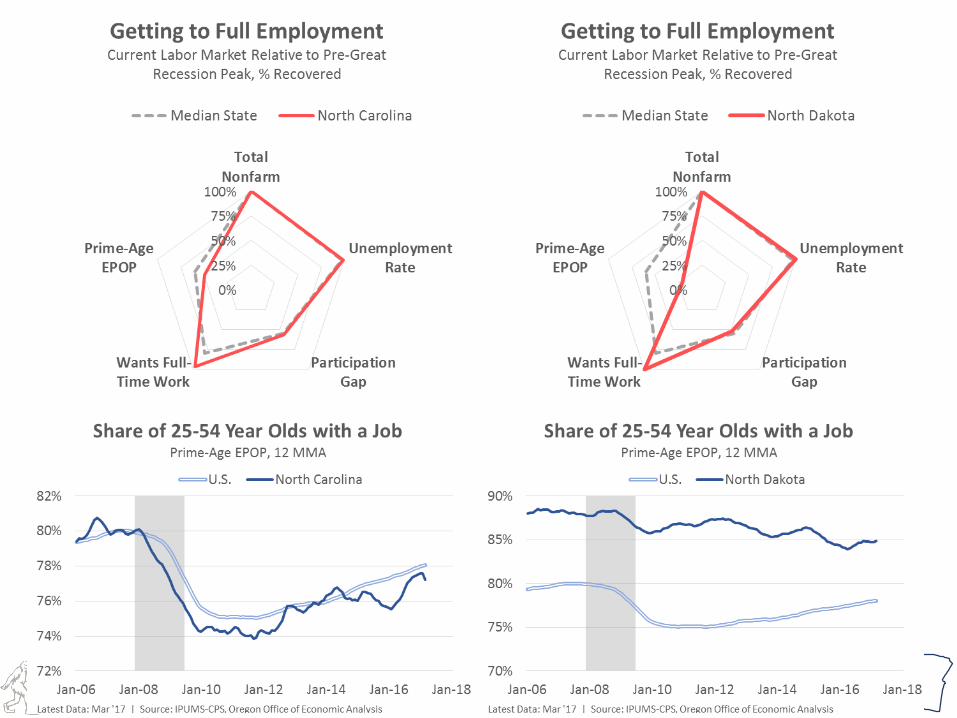
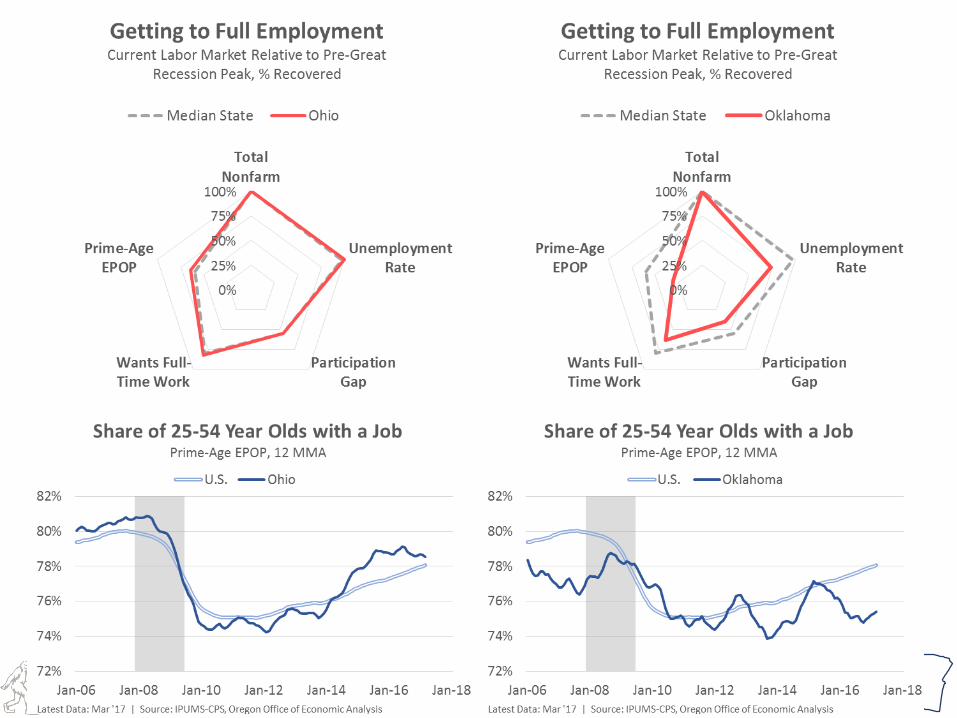
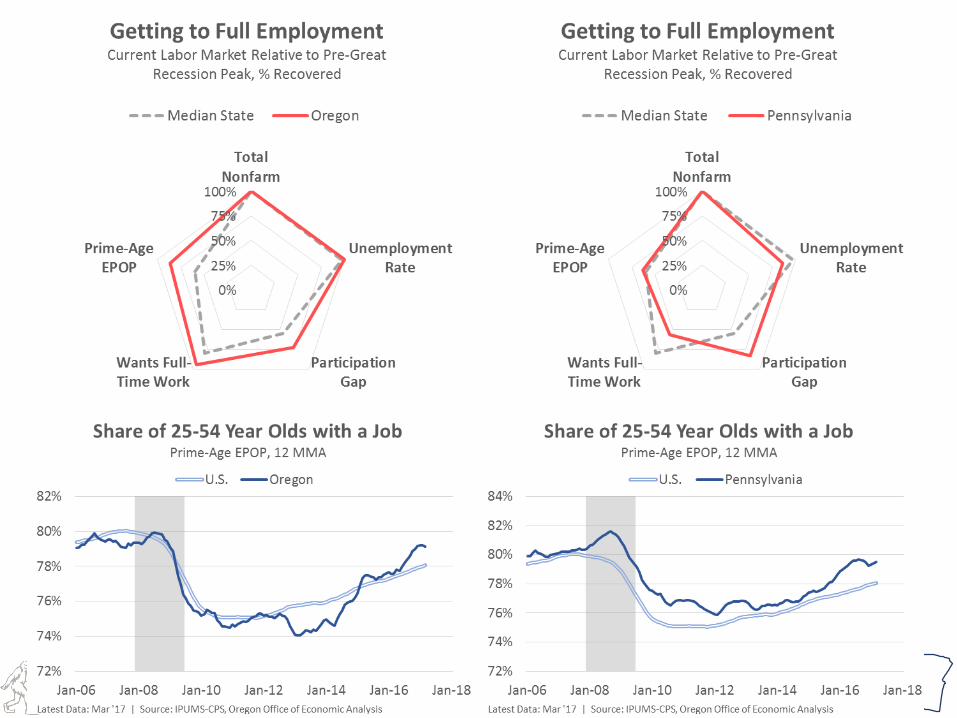
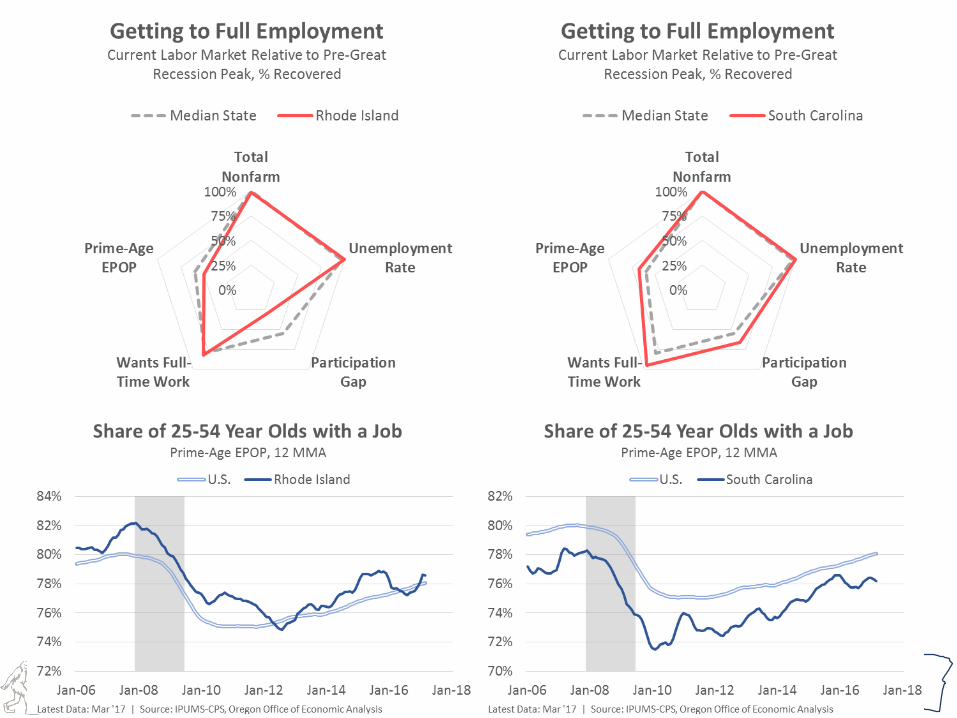
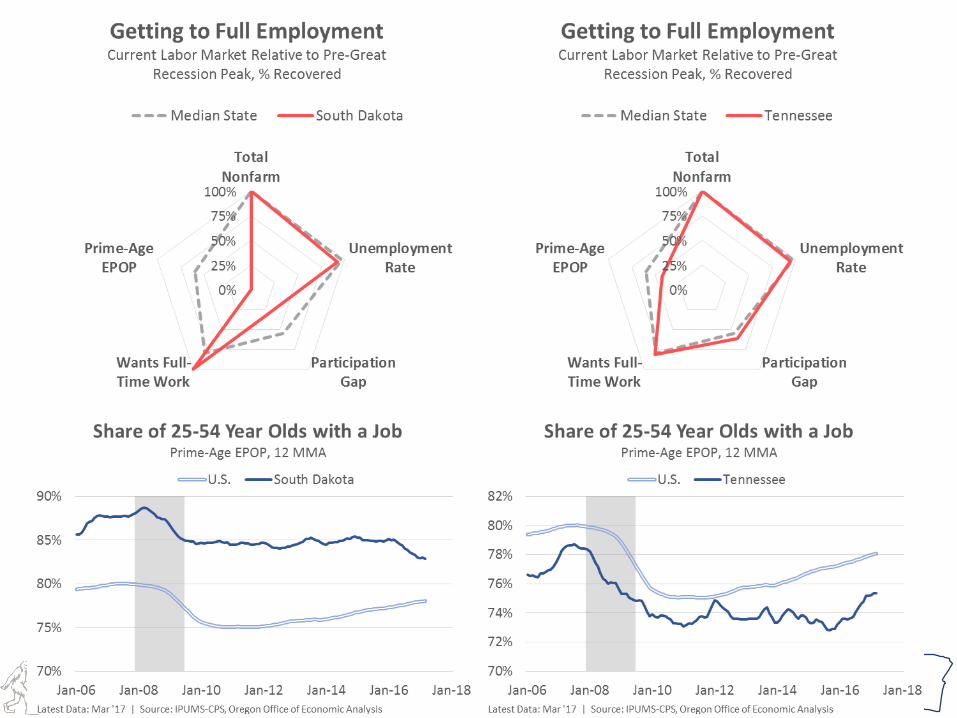
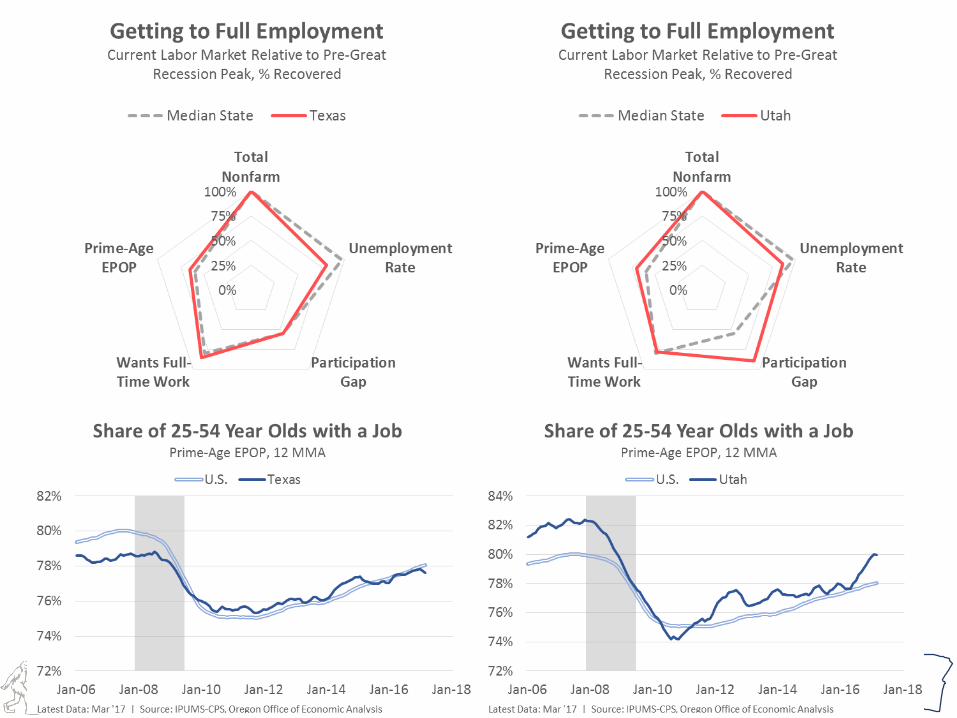
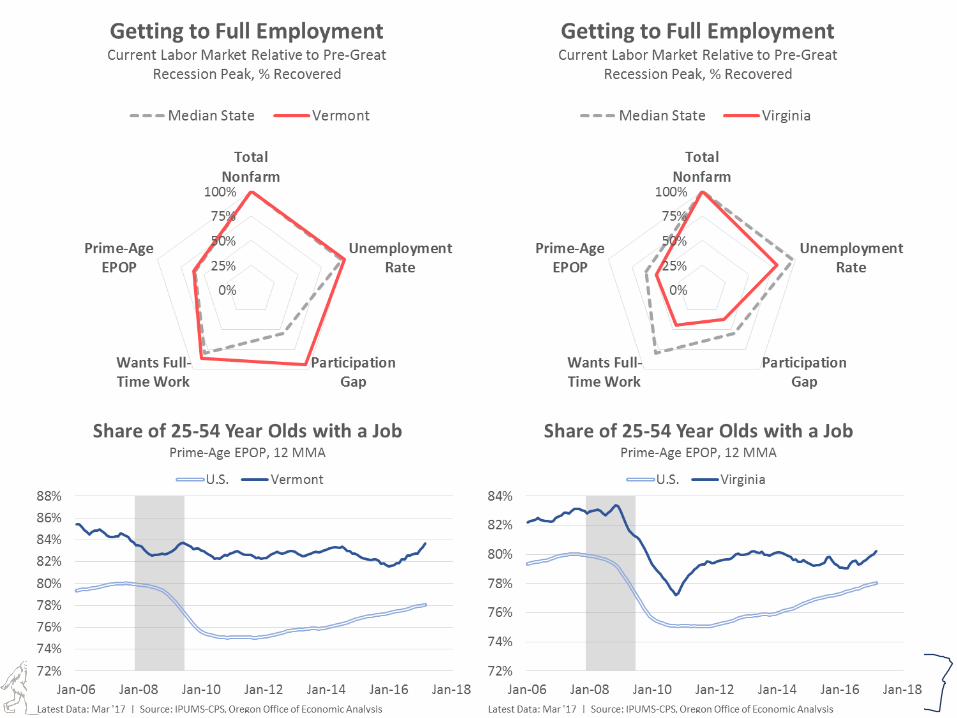
Individual States
Oregon Office ofEconomic Analysis
7
Oregon Office ofEconomic Analysis
8
Oregon Office ofEconomic Analysis
9
Oregon Office ofEconomic Analysis
10
Oregon Office ofEconomic Analysis
11
Oregon Office ofEconomic Analysis
12
Oregon Office ofEconomic Analysis
13

Oregon Office ofEconomic Analysis
14

Oregon Office ofEconomic Analysis
15
Oregon Office ofEconomic Analysis
16
Oregon Office ofEconomic Analysis
17

Oregon Office ofEconomic Analysis
18
Oregon Office ofEconomic Analysis
19

Oregon Office ofEconomic Analysis
20
Oregon Office ofEconomic Analysis
21
Oregon Office ofEconomic Analysis
22
Oregon Office ofEconomic Analysis
23
Oregon Office ofEconomic Analysis
24
Oregon Office ofEconomic Analysis
25
Oregon Office ofEconomic Analysis
26
Oregon Office ofEconomic Analysis
27
Oregon Office ofEconomic Analysis
28
Oregon Office ofEconomic Analysis
29

Oregon Office ofEconomic Analysis
30

Oregon Office ofEconomic Analysis
31

Oregon Office ofEconomic Analysis
32
[email protected](503) 378-4052
www.OregonEconomicAnalysis.com@OR_EconAnalysis
Questions and Contact