Embed Size (px)
Citation preview
European Investment Bank Page 1
TBLI NORDIC June 2015 Conference
Peter MUNRO, Head of Investor Relations, EIB
© BEWAG
Green Bonds – market & energy transition
European Investment Bank Page 2
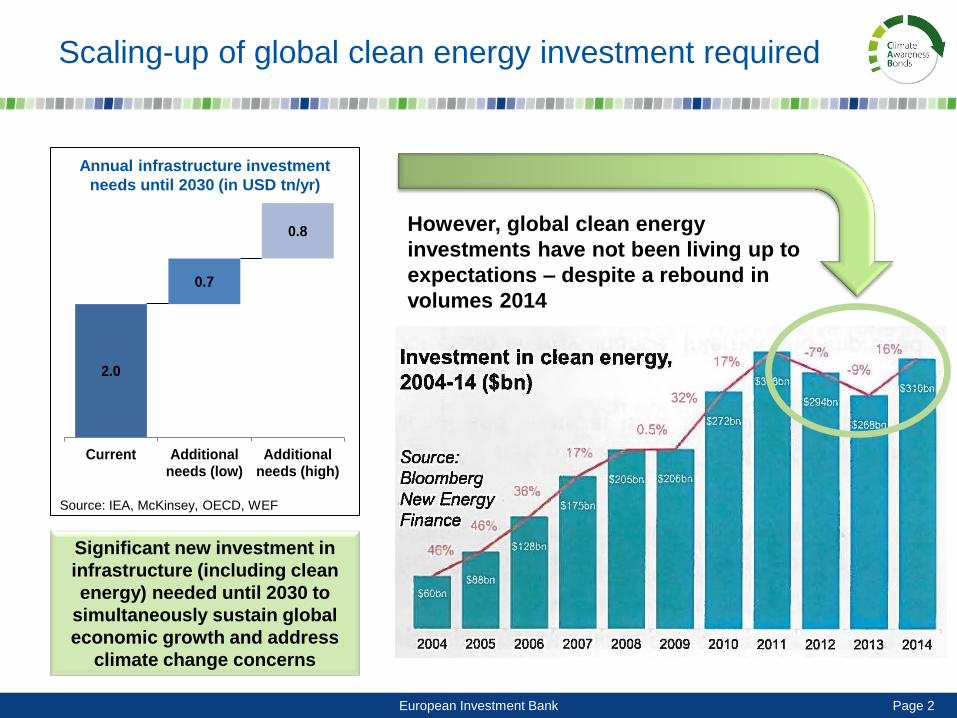
Scaling-up of global clean energy investment required
2.0
0.7
0.8
Current Additionalneeds (low)
Additionalneeds (high)
Source: IEA, McKinsey, OECD, WEF
Annual infrastructure investment
needs until 2030 (in USD tn/yr)
However, global clean energy
investments have not been living up to
expectations – despite a rebound in
volumes 2014
Significant new investment in
infrastructure (including clean
energy) needed until 2030 to
simultaneously sustain global
economic growth and address
climate change concerns
European Investment Bank Page 3
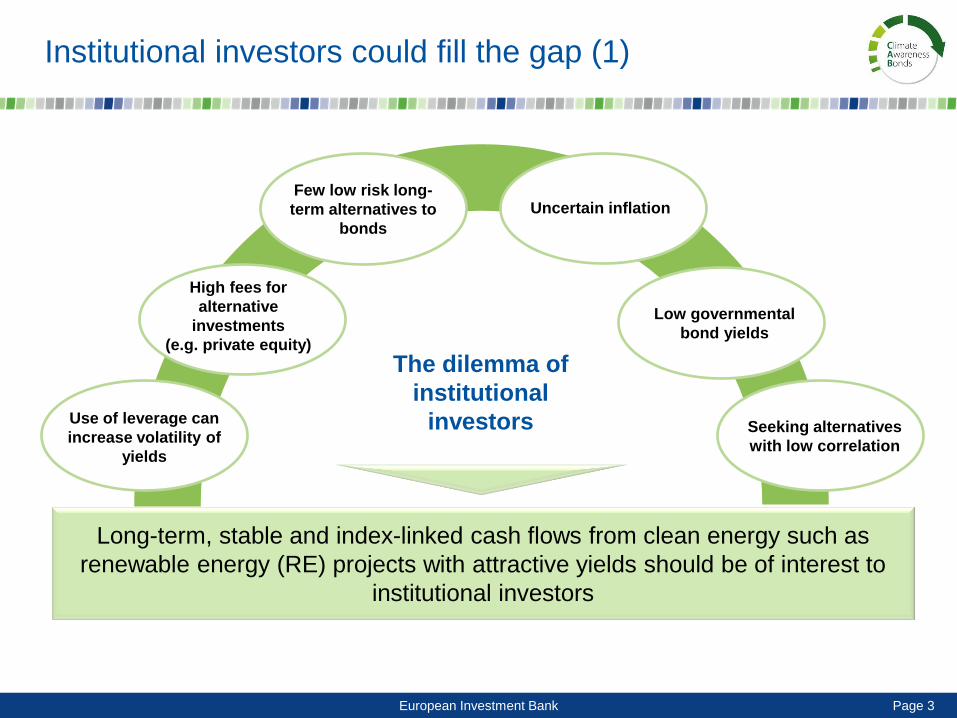
Institutional investors could fill the gap (1)
3
Few low risk long-
term alternatives to
bonds
High fees for
alternative
investments
(e.g. private equity)
The dilemma of
institutional
investors
Uncertain inflation
Low governmental
bond yields
Use of leverage can
increase volatility of
yields
Seeking alternatives
with low correlation
Long-term, stable and index-linked cash flows from clean energy such as
renewable energy (RE) projects with attractive yields should be of interest to
institutional investors
European Investment Bank Page 4
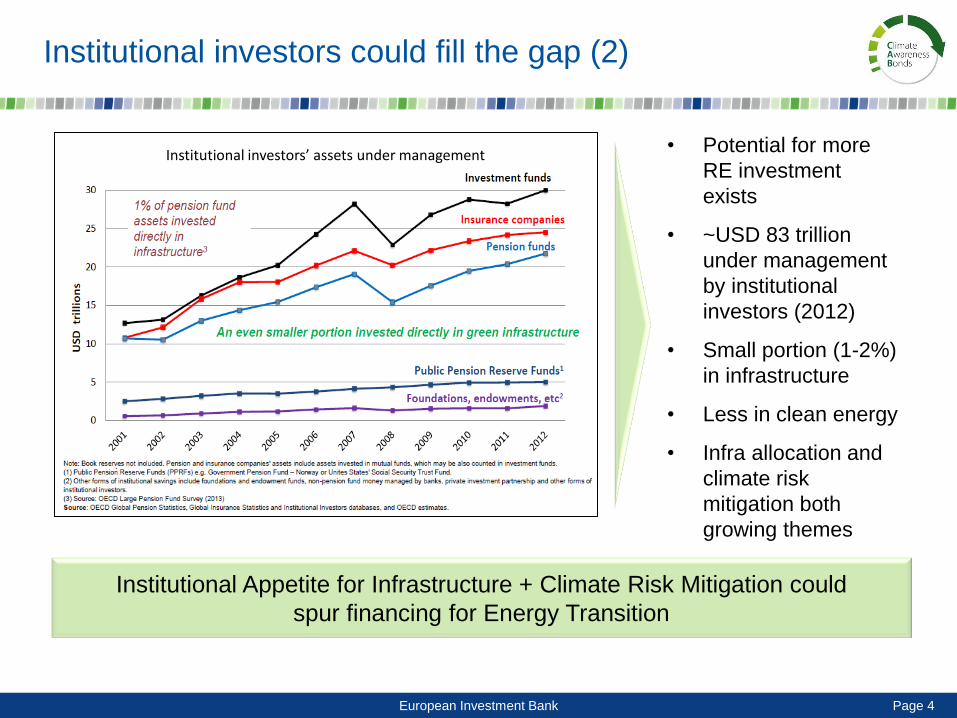
Institutional investors could fill the gap (2)
4
Institutional Appetite for Infrastructure + Climate Risk Mitigation could
spur financing for Energy Transition
Institutional investors’ assets under management • Potential for more
RE investment
exists
• ~USD 83 trillion
under management
by institutional
investors (2012)
• Small portion (1-2%)
in infrastructure
• Less in clean energy
• Infra allocation and
climate risk
mitigation both
growing themes
European Investment Bank Page 5
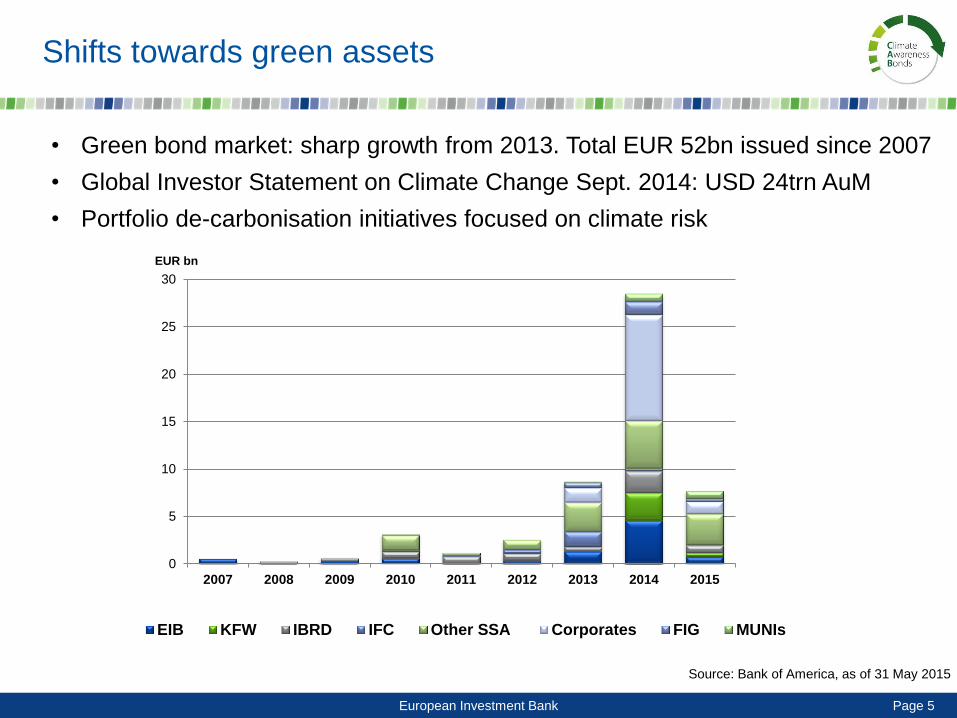
Shifts towards green assets
• Green bond market: sharp growth from 2013. Total EUR 52bn issued since 2007
• Global Investor Statement on Climate Change Sept. 2014: USD 24trn AuM
• Portfolio de-carbonisation initiatives focused on climate risk
Source: Bank of America, as of 31 May 2015
0
5
10
15
20
25
30
2007 2008 2009 2010 2011 2012 2013 2014 2015
EIB KFW IBRD IFC Other SSA Corporates FIG MUNIs
EUR bn
European Investment Bank Page 6
0% 20% 40% 60% 80% 100%
2007
2008
2009
2010
2011
2012
2013
2014
2015
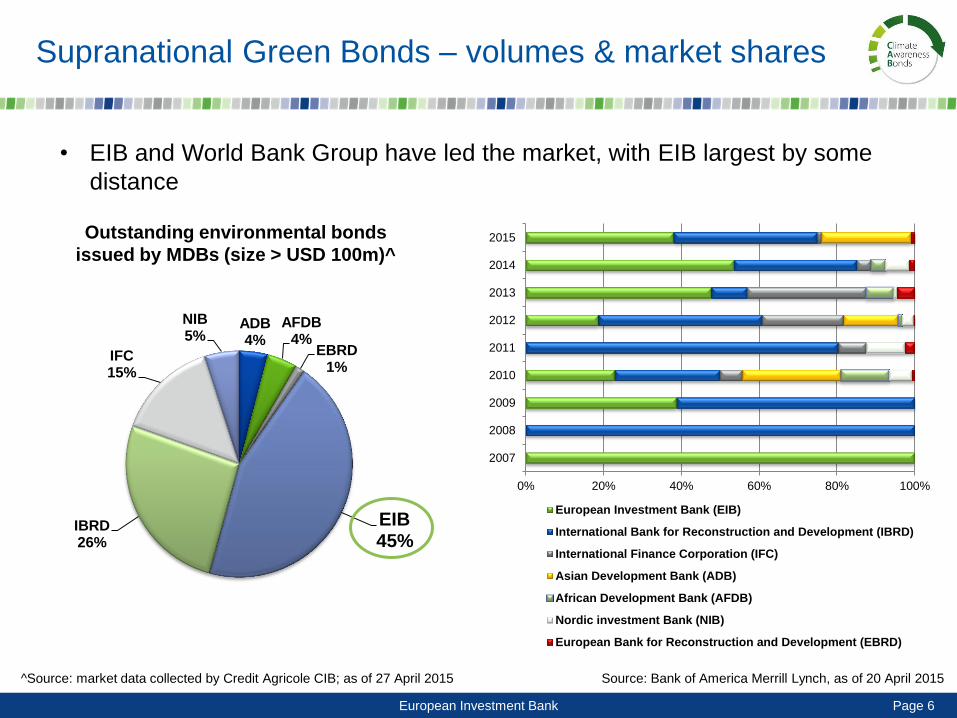
European Investment Bank (EIB)
International Bank for Reconstruction and Development (IBRD)
International Finance Corporation (IFC)
Asian Development Bank (ADB)
African Development Bank (AFDB)
Nordic investment Bank (NIB)
European Bank for Reconstruction and Development (EBRD)
Source: Bank of America Merrill Lynch, as of 20 April 2015
Supranational Green Bonds – volumes & market shares
ADB 4%
AFDB 4%
EBRD 1%
EIB 45%
IBRD 26%
IFC 15%
NIB 5%
Outstanding environmental bonds
issued by MDBs (size > USD 100m)^
^Source: market data collected by Credit Agricole CIB; as of 27 April 2015
• EIB and World Bank Group have led the market, with EIB largest by some
distance
European Investment Bank Page 7
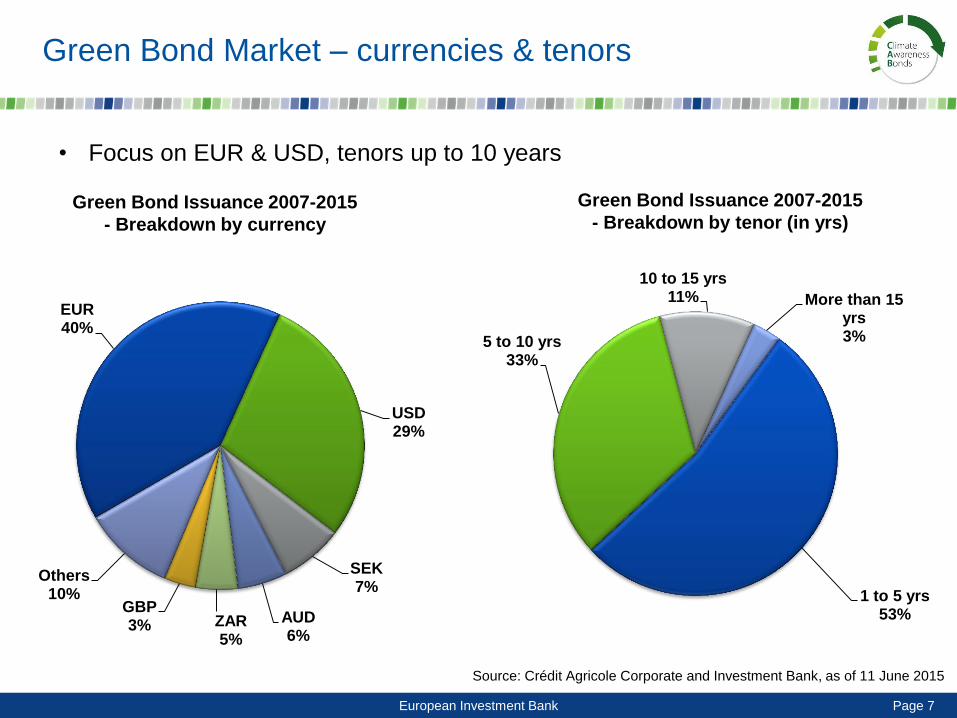
Green Bond Issuance 2007-2015
- Breakdown by currency
Source: Crédit Agricole Corporate and Investment Bank, as of 11 June 2015
Green Bond Issuance 2007-2015
- Breakdown by tenor (in yrs)
Green Bond Market – currencies & tenors
• Focus on EUR & USD, tenors up to 10 years
EUR 40%
USD 29%
SEK 7%
AUD 6%
ZAR 5%
GBP 3%
Others 10% 1 to 5 yrs
53%
5 to 10 yrs 33%
10 to 15 yrs 11% More than 15
yrs 3%
European Investment Bank Page 8
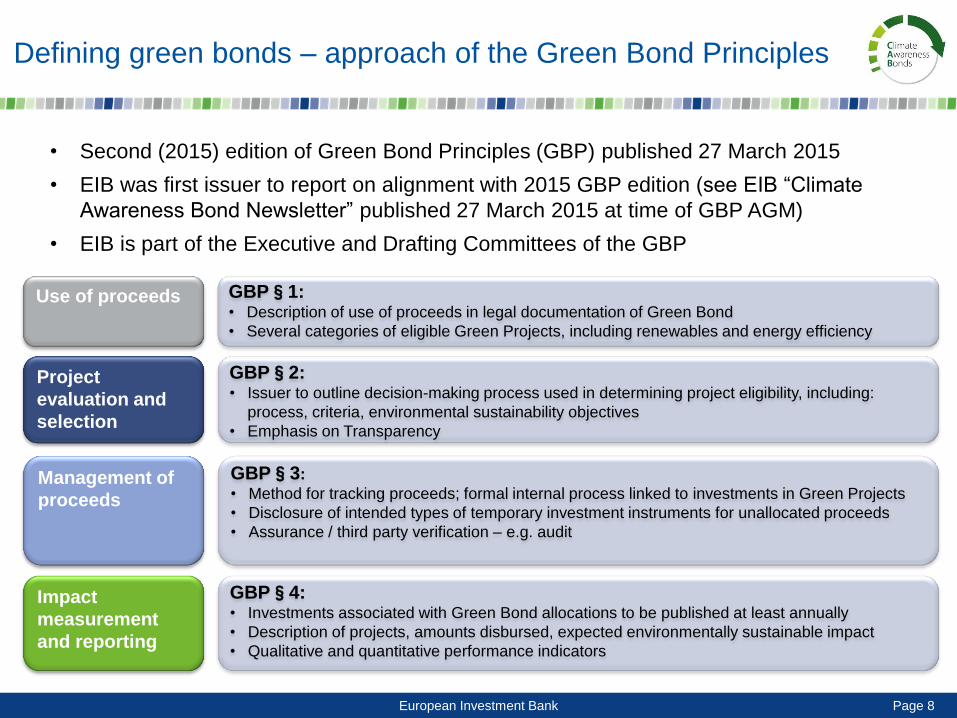
Defining green bonds – approach of the Green Bond Principles
Project evaluation
and selection
Management of
proceeds
• Second (2015) edition of Green Bond Principles (GBP) published 27 March 2015
• EIB was first issuer to report on alignment with 2015 GBP edition (see EIB “Climate
Awareness Bond Newsletter” published 27 March 2015 at time of GBP AGM)
• EIB is part of the Executive and Drafting Committees of the GBP
GBP§1: • Description of use of proceeds in legal documentation of Green Bond
• Several categories of eligible Green Projects, including renewables and energy efficiency
GBP§2: • Issuer to outline decision-making process used in determining project eligibility, including:
process, criteria, environmental sustainability objectives
• Emphasis on Transparency
GBP§3:
• Method for tracking proceeds; formal internal process linked to investments in Green Projects
• Disclosure of intended types of temporary investment instruments for unallocated proceeds
• Assurance / third party verification – e.g. audit
GBP§4: • Investments associated with Green Bond allocations to be published at least annually
• Description of projects, amounts disbursed, expected environmentally sustainable impact
• Qualitative and quantitative performance indicators
Use of proceeds
Project
evaluation and
selection
Management of
proceeds
Impact
measurement
and reporting
European Investment Bank Page 9
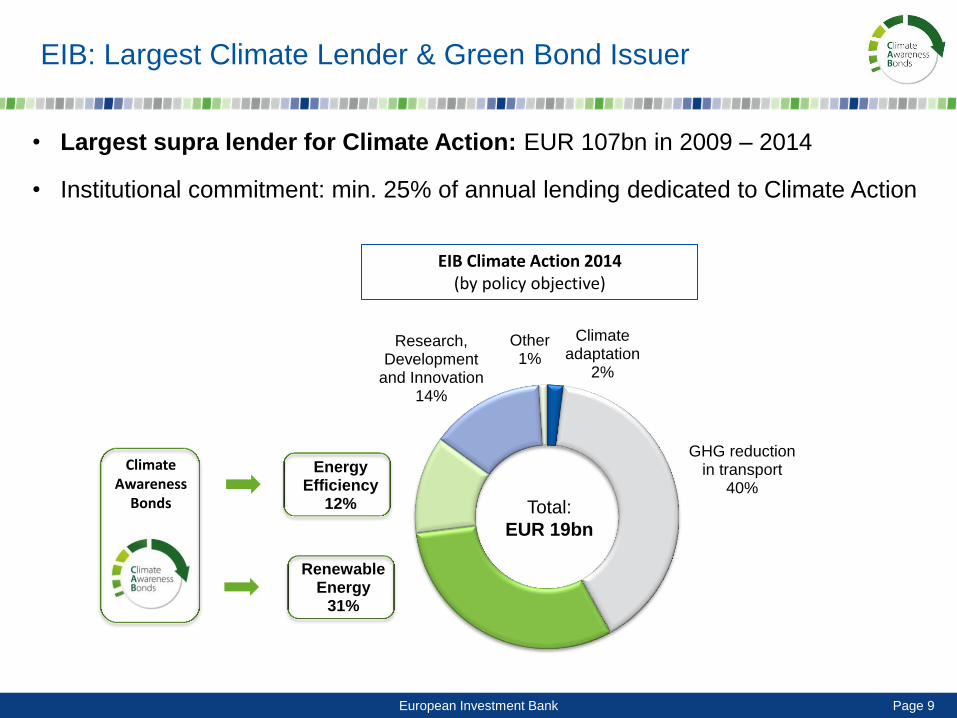
• Largest supra lender for Climate Action: EUR 107bn in 2009 – 2014
• Institutional commitment: min. 25% of annual lending dedicated to Climate Action
EIB: Largest Climate Lender & Green Bond Issuer
Climate Awareness
Bonds
EIB Climate Action 2014 (by policy objective)
Climate adaptation
2%
GHG reduction in transport
40%
Renewable Energy
31%
Energy Efficiency
12%
Research, Development
and Innovation 14%
Other 1%
Total:
EUR 19bn
European Investment Bank Page 10
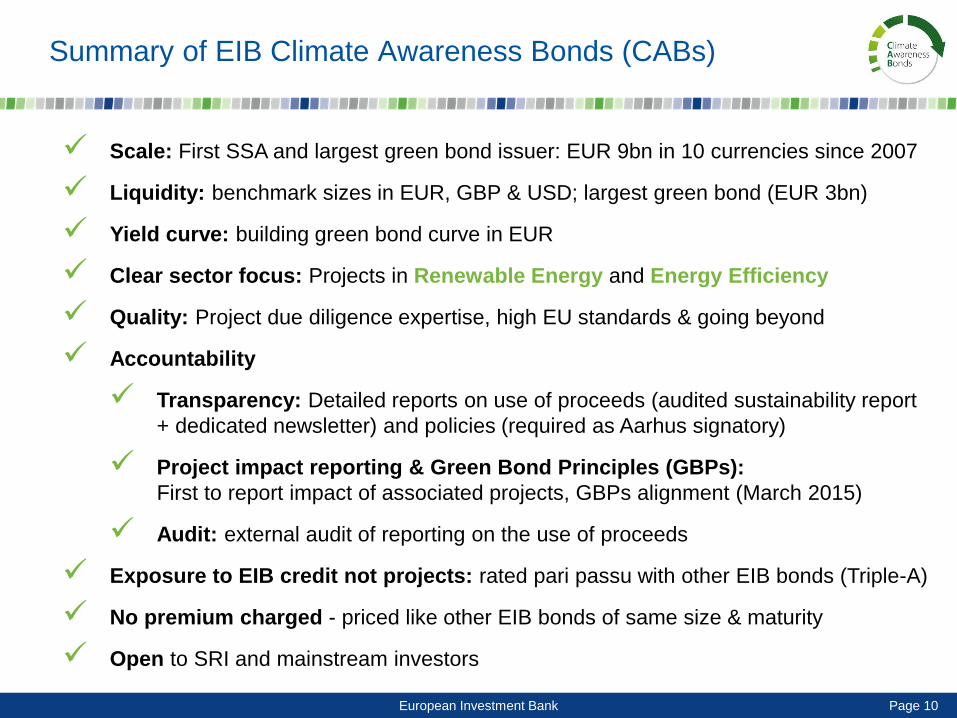
Summary of EIB Climate Awareness Bonds (CABs)
Scale: First SSA and largest green bond issuer: EUR 9bn in 10 currencies since 2007
Liquidity: benchmark sizes in EUR, GBP & USD; largest green bond (EUR 3bn)
Yield curve: building green bond curve in EUR
Clear sector focus: Projects in Renewable Energy and Energy Efficiency
Quality: Project due diligence expertise, high EU standards & going beyond
Accountability
Transparency: Detailed reports on use of proceeds (audited sustainability report
+ dedicated newsletter) and policies (required as Aarhus signatory)
Project impact reporting & Green Bond Principles (GBPs):
First to report impact of associated projects, GBPs alignment (March 2015)
Audit: external audit of reporting on the use of proceeds
Exposure to EIB credit not projects: rated pari passu with other EIB bonds (Triple-A)
No premium charged - priced like other EIB bonds of same size & maturity
Open to SRI and mainstream investors
European Investment Bank Page 11
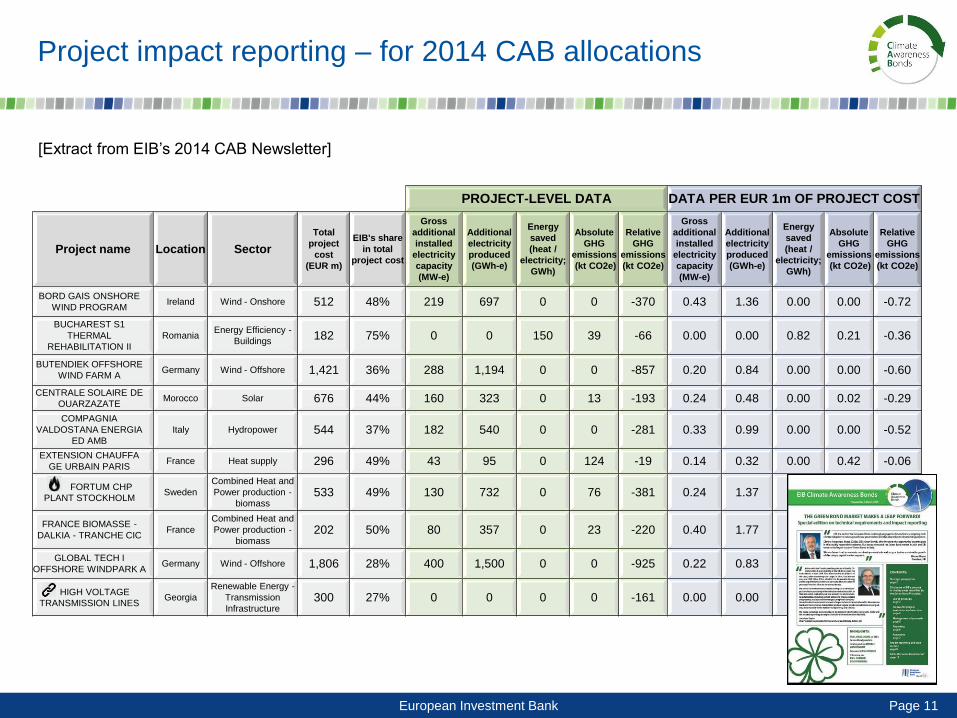
Project impact reporting – for 2014 CAB allocations
PROJECT-LEVEL DATA DATA PER EUR 1m OF PROJECT COST
Project name Location Sector
Total
project
cost
(EUR m)
EIB's share
in total
project cost
Gross
additional
installed
electricity
capacity
(MW-e)
Additional
electricity
produced
(GWh-e)
Energy
saved
(heat /
electricity;
GWh)
Absolute
GHG
emissions
(kt CO2e)
Relative
GHG
emissions
(kt CO2e)
Gross
additional
installed
electricity
capacity
(MW-e)
Additional
electricity
produced
(GWh-e)
Energy
saved
(heat /
electricity;
GWh)
Absolute
GHG
emissions
(kt CO2e)
Relative
GHG
emissions
(kt CO2e)
BORD GAIS ONSHORE
WIND PROGRAM Ireland Wind - Onshore 512 48% 219 697 0 0 -370 0.43 1.36 0.00 0.00 -0.72
BUCHAREST S1
THERMAL
REHABILITATION II
Romania Energy Efficiency -
Buildings 182 75% 0 0 150 39 -66 0.00 0.00 0.82 0.21 -0.36
BUTENDIEK OFFSHORE
WIND FARM A Germany Wind - Offshore 1,421 36% 288 1,194 0 0 -857 0.20 0.84 0.00 0.00 -0.60
CENTRALE SOLAIRE DE
OUARZAZATE Morocco Solar 676 44% 160 323 0 13 -193 0.24 0.48 0.00 0.02 -0.29
COMPAGNIA
VALDOSTANA ENERGIA
ED AMB
Italy Hydropower 544 37% 182 540 0 0 -281 0.33 0.99 0.00 0.00 -0.52
EXTENSION CHAUFFA
GE URBAIN PARIS France Heat supply 296 49% 43 95 0 124 -19 0.14 0.32 0.00 0.42 -0.06
FORTUM CHP
PLANT STOCKHOLM Sweden
Combined Heat and
Power production -
biomass 533 49% 130 732 0 76 -381 0.24 1.37 0.00 0.14 -0.71
FRANCE BIOMASSE -
DALKIA - TRANCHE CIC France
Combined Heat and
Power production -
biomass 202 50% 80 357 0 23 -220 0.40 1.77 0.00 0.11 -1.09
GLOBAL TECH I
OFFSHORE WINDPARK A Germany Wind - Offshore 1,806 28% 400 1,500 0 0 -925 0.22 0.83 0.00 0.00 -0.51
HIGH VOLTAGE
TRANSMISSION LINES Georgia
Renewable Energy -
Transmission
Infrastructure 300 27% 0 0 0 0 -161 0.00 0.00 0.00 0.00 -0.54
[Extract from EIB’s 2014 CAB Newsletter]
European Investment Bank Page 12
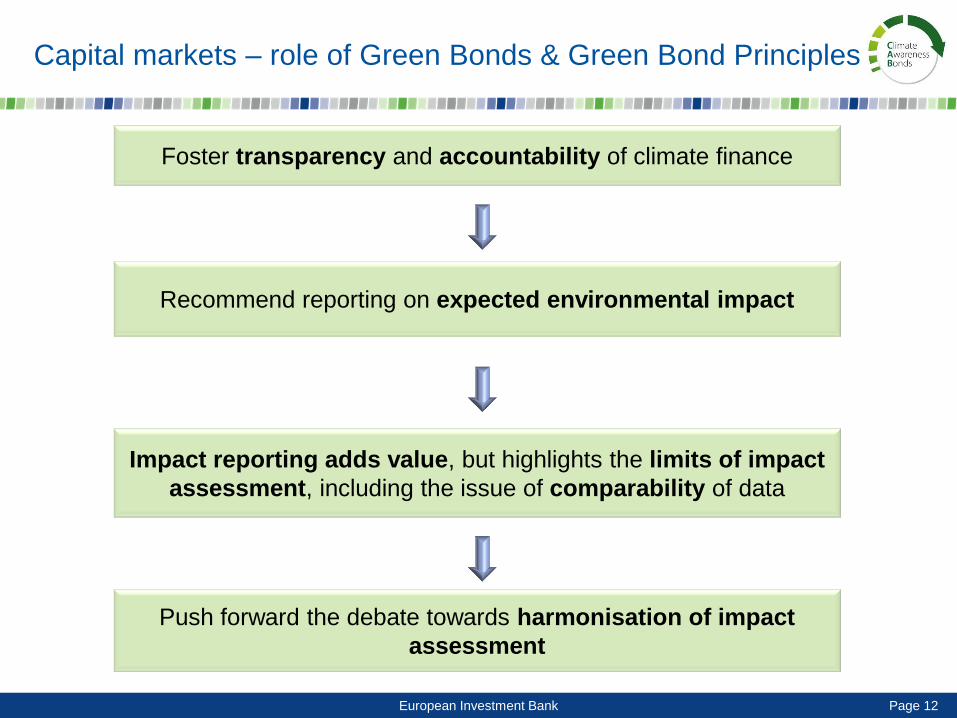
Capital markets – role of Green Bonds & Green Bond Principles
Foster transparency and accountability of climate finance
Recommend reporting on expected environmental impact
Impact reporting adds value, but highlights the limits of impact
assessment, including the issue of comparability of data
Push forward the debate towards harmonisation of impact
assessment
European Investment Bank Page 13
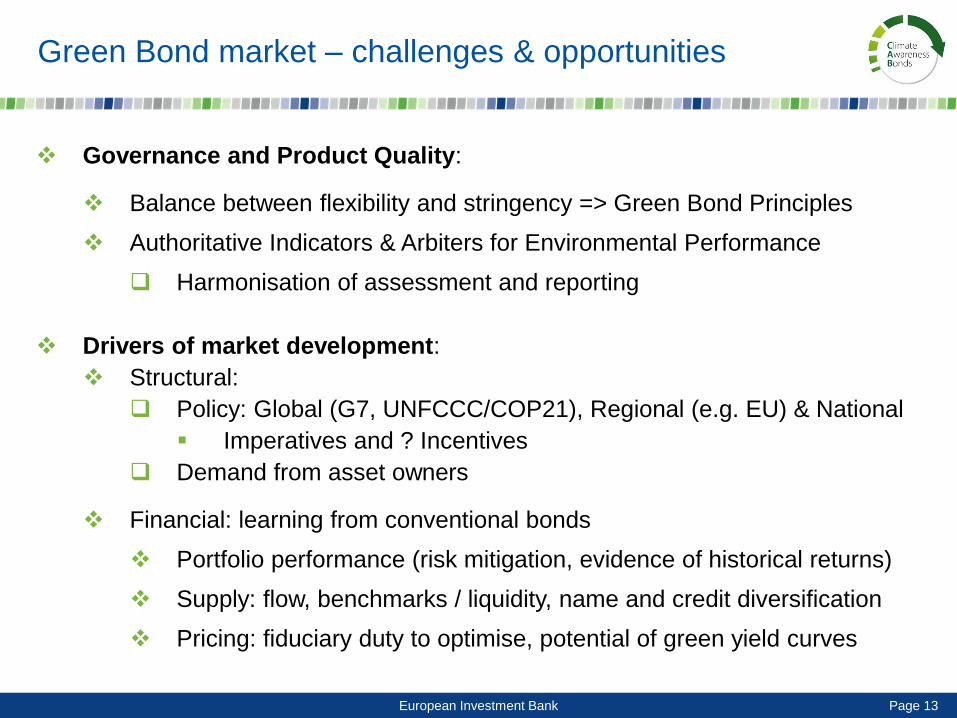
Green Bond market – challenges & opportunities
Governance and Product Quality:
Balance between flexibility and stringency => Green Bond Principles
Authoritative Indicators & Arbiters for Environmental Performance
Harmonisation of assessment and reporting
Drivers of market development:
Structural:
Policy: Global (G7, UNFCCC/COP21), Regional (e.g. EU) & National
Imperatives and ? Incentives
Demand from asset owners
Financial: learning from conventional bonds
Portfolio performance (risk mitigation, evidence of historical returns)
Supply: flow, benchmarks / liquidity, name and credit diversification
Pricing: fiduciary duty to optimise, potential of green yield curves
European Investment Bank Page 14
European Investment Bank
100, bd. Konrad Adenauer L-2950 Luxembourg
www.eib.org
Contacts
General enquiries on EIB bonds:
Peter Munro
Head of Investor Relations
Tel: +352 4379 88457