Embed Size (px)
Citation preview

Stockholm Institute of Transition Economics (SITE) ⋅ Stockholm School of Economics ⋅ Box 6501 ⋅ SE-113 83 Stockholm ⋅ Sweden
Stockholm Institute of Transition Economics
WORKING PAPER
March 2016
No. 35
The Nature of Swedish-Russian Capital Flows
Torbjörn Becker
Working papers from Stockholm Institute of Transition Economics (SITE) are preliminary by nature, and are circulated to promote discussion and critical comment. The views expressed here are the authors’ own and not necessarily those of the Institute or any other organization or institution.

The Nature of Swedish-‐Russian Capital Flows Torbjörn Becker*Ê
Abstract This paper provides a detailed investigation of the investment flows between Russia and Sweden in the last decade and a half. The bilateral data consists of both aggregate macro data and company level greenfield and M&A FDI. The relatively large flows from Sweden to Russia and insignificant flows in the other direction support the hypotheses that investments tend to go from higher income countries to lower income countries and from smaller markets to larger. Investment flows have grown in line with trade, consistent with the idea that international investments and exports often are compliments rather than substitutes. The investments from Sweden to Russia also show that FDI has been a more stable source of foreign funding than portfolio flows as has been argued both in the theoretical and empirical literature; Whereas portfolio flows have declined significantly since the global crisis in 2008, the stock of FDI has continued to increase. The paper also argues that it is hard to predict aggregate bilateral flows with great precision, in particular for such a large economy as the Russian, and empirical models tend to generate expected flows from Sweden to Russia that are larger than the ones observed. In terms of reasons for FDI between the two countries, horizontal FDI seem to dominate by a wide margin. However, there are a few examples of vertical FDI in resource intensive sectors in Russia, and limited amounts of complex FDI in Sweden by Russian companies. In the challenging environment Russia is currently facing due to low international oil prices and sanctions it will be hard to attract new FDI. Although it may be tempting to use short-‐term tax exemptions or barriers to trade to induce FDI, sustainable long-‐run policies should focus on fundamental reforms of the institutions that reduce corruption, contribute to the rule of law and limit excess bureaucratic burdens. This will not only make Russia attractive to foreign investors but also encourage domestic innovators and entrepreneurs to help modernize and diversify the economy. Keywords: FDI, Capital flows, Gravity model, Sweden, Russia JEL codes: F21, F23, F41 * Director of the Stockholm Institute of Transition Economics (SITE) at the Stockholm School of Economics. Email: [email protected]. Ê The author would like to thank Kari Liuhto and Sergei Sutyrin for many useful comments and Roman Bobilevs for help with data. Special thanks to Magnus Runnbeck and Jens Wernborg at Business Sweden for help with company level data.
2
Introduction Sweden and Russia have a long history of trade and investment but over time the nature and level of investments have shifted as the political and economic circumstances have changed. Kragh (2014a) provides a very long-‐term perspective on trade and investments between the two countries dating back to the Vikings, as well as an overview of the Swedish companies that were exporting to and investing in Russia from the middle of the 19th century and over the Swedish manufacturing boom in the early 20th century. A striking fact is that in 1915, Russia accounted for 30 percent of Swedish exports of engineering products, equivalent to the exports to Norway, Germany, and Great Britain combined. Many Swedish firms were at the time also investing in Russia, including ASEA, (Electro)Lux, LM Ericsson, Nordiska Kompaniet (NK), the Nobel brothers, and Svenska Kullager Fabriken (SKF). All of this, of course, came to an abrupt end in 1917 when the Bolsheviks came to power and private assets were confiscated. According to estimates reported in Kragh (2014b), the assets seized from (at least) 148 Swedish companies and 401 households amounted to around 6 percent of Swedish GDP at the time. Fast forward to the next significant boom of Swedish FDI in the 1980s, when Swedish investments abroad increased by 500 percent in real terms between 1980 and 1987. Swedenborg, Johansson-‐Grahn, and Kinnwall (1988) provide a detailed account of survey data from the Research Institute of Industrial Economics between 1965 and 1986. The top three Swedish multinationals in terms of employment were at the time Electrolux, SKF and Ericsson; well-‐known investors in Russia at the beginning of the 20th century as described above. The FDI boom continued through the 1990s as is shown in Hakkala and Zimmermann (2005), where the above data is extended to 2003. In the mid-‐2000s, Finland overtook the USA as the largest recipient of Swedish FDI. At the same time, Russia did not enter the top-‐20 list of countries in terms of affiliate turnover and employment, but entered in 15th place in terms of exports by Swedish MNEs. By the early 2000s, Swedish FDI starts to flow to Russia again at a significant rate, and by the end of 2014, Russia accounted for around 2 percent of the stock of Swedish FDI. Investments from Russia to Sweden have not been significant although Russia’s global investments have increased substantially. In 2014, Russia ranked in 6th place in OFDI flows and 17th in terms of FDI stocks according to UNCTAD data reported in Liuhto (2015). A comprehensive survey of Russian OFDI and discussion of how Russia became a significant investor abroad is provided in Liuhto and Majuri (2014). In a study of outward FDI from the Russian steel industry, Fortescue and Hanson (2015) argue that the driving forces behind these investments have been both psychological and political in addition to the more regular business-‐related factors. They also conclude that the OFDI strategies in the steel sector have not been very successful due to poor timing and debt dependence. None of the investments by Russian firms studied in their article went to Sweden, consistent with the overall picture of limited investment flows from Russia to Sweden.

3
This chapter will contrast the investment relations of the past with the more recent experience of the last decade and a half. More specifically, it will provide a detailed analysis of bilateral investment data between Sweden and Russia, and discuss some of the difficulties we face with data on bilateral economic links in an era of globalization, movable multinationals and tax havens. Several hypotheses regarding bilateral capital flows from a growing academic literature will then be compared to the actual data on investments between Sweden and Russia before some policy related comments are made to conclude the article.
Theoretical and Methodological Framework The academic literature on the determinants of capital flows goes back a long time to the early models of trade and factor mobility and has since developed both in macro and micro models. This article will not provide an overview of this large and growing literature but Lizondo (1990) presents an extensive overview of the early models of FDI. Markusen and Maskus (2001) give a more detailed exposé of general equilibrium models of MNEs, while Dunning (2001) presents a detailed history of how his OLI (ownership, location, and internationalization) framework has developed over time. The empirical investigations are to a large extent based on extensions of the gravity model that has been used to explain trade (see Anderson 2010) and has later received theoretical underpinnings also for studies of FDI (see e.g., Bergstrand & Egger 2007; Kleinert & Toubal 2010). A number of key hypotheses from this literature will guide the investigation of investments between Sweden and Russia. In particular, this study will address the following questions: • Has FDI been moving in line with standard macro and finance variables as
suggested by risk/return arguments regarding international capital flows?1 • Do investment flows follow trade flows or has FDI replaced exports over
time?2 • Are FDI flows more stable than portfolio investments, and does FDI provide
more of international risk sharing in this sense?3 1 For a discussion of theories that assume perfect markets, see Lizondo (1990). Froot and Stein 1991 discuss the importance of exchange rate movements, while Portes and Rey (2005) look at capital flows with frictions that generate predictions in line with gravity models. 2 This question has a very long history in the trade and factor mobility literature. In a more recent contribution, Helpman, Melitz and Yeaple (2004) develop a model with heterogeneous firms to explain how MNEs chose to serve foreign markets, while Helpman (2006) provides a good overview of the topic more generally. 3 Albuquerque (2003) argue that FDI is preferred over portfolio investments when there is a high risk of expropriation and that FDI is more stable and better for risk sharing. Daude and Fratzscher (2008) focus on how FDI and portfolio investments respond differently on frictions and institutional factors, while

4
• What type of FDI (horizontal, vertical, export-‐platform, complex) dominates investments between Sweden and Russia and do investments come in the form of greenfield investments or M&A?4
• Are the observed flows and levels of FDI between Sweden and Russia consistent with predictions from previous empirical studies?5
In addition to answering these research questions regarding investment flows, the answers can also be relevant to policy makers considering various strategies to influence trade and investment as part of a more extensive growth strategy.
Swedish-‐Russian data Macro level data To put the discussion of investment flows in perspective, Figure 1 shows some basic statistics on the relative size and importance of the two countries in 2014. The left panel takes a Swedish perspective and relates trade and investment to and from Russia to total Swedish trade and investment. The highest bar in the chart, at around 5 percent, is the share of Swedish imports that come from Russia. At around 2 percent we have the bars representing Swedish exports and FDI to Russia, as well as Russia’s share of world GDP. The share of Swedish portfolio investment going to Russia is less than half a percent; in line with the Russian stock market’s weight in the financial markets index provider MSCI’s All Country World Index (ACWI). On the other hand, Russian investments in Sweden account for a negligible share of foreign investments in Sweden. The right panel shows the corresponding data from a Russian perspective. Sweden accounts for around 1 percent of total Russian trade, with a higher share in terms of Russian exports than imports. On the investment side, Swedish Fratzscher and Imbs (2009) discuss how institutions in the host country can increase the transaction costs for FDI and reduce diversification benefits of the home country. 4 The early focus on horizontal versus vertical FDI has been expended more recently by export-‐platform investments (Ekholm, Forslid & Markusen 2007) and more complex patterns of trade and investment when more countries and types of capital are included in the standard models (Baltagi, Egger & Pfaffermayr 2007). Nocke and Yeaple (2007) show that the nature of firm heterogeneity determines what type of FDI is chosen. 5 There is a growing number of articles that estimate empirical models of bilateral FDI that can be used to generate predictions of investments between Sweden and Russia. One empirical issue is that the list of explanatory variables keeps growing with each new study. There are two recent articles (Eicher, Helfman & Lenkoski 2012; Blonigen & Piger 2014) that use Bayesian techniques to see what variables are statistically robust, and one general conclusion is that standard gravity variables such as GDP and distance always do well.

5
investments in Russia is around 2 percent of foreign investments in the country, with a slight overweight on FDI compared to portfolio investments. Although Sweden is not a large country in terms of world GDP, its share in the MSCI AWCI of around 1 percent is higher than Russia’s share. Nevertheless, there is little investment coming in any form from Russia to Sweden.
Figure 1. The relative importance of Sweden and Russia for each other
Swedish perspective Russian perspective
Source: Author’s calculations based on SCB and CBR data Investment flows in both directions have increased since the end of the 1990s, but exactly by how much depends on what data source we look at. In general, international investment flows are part of the balance of payments statistics, which is included in the regular official statistics. In Sweden, the central bank (the Riksbank) has commissioned Statistics Sweden (SCB) to produce and publish the statistics, while in Russia, the data is available from the Central Bank of Russia’s (CBR’s) website. Bilateral FDI data is also available from, among others, the OECD and the UNCTAD. In general, the OECD reports the data coming from the country that receives investment inflows, while the UNCTAD country pages take both inflows and outflows from the respective countries official data. The IMF is also leading the Coordinated Direct Investment Survey (CDIS) to improve quality of direct investment data, but the data starts only in 2009. Here we will only compare the official SCB and CBR data but a full comparison is available in the Annex. Another important twist regarding international capital flows is that they are on a regular basis routed through tax havens. This is less of a problem when we look at aggregate inflows and outflows from a country that is not a tax haven but can lead to a very skewed picture when we want to understand bilateral flows between, e.g., Sweden and Russia. For example, according to the IMF’s CDIS for 2014, the top-‐five list of countries making direct investment in Russia are all tax havens, bar Germany in 5th place, while Cyprus leads both this ranking and is the top country in terms of receiving direct investments from Russia. The two countries making most direct investments in Sweden are the Netherlands and Luxemburg. The Netherlands also tops the list of countries in the world receiving direct investment, well ahead of the USA in second spot. It is not a very brave assumption that this is a result of tax and other regulatory concerns. The only
0.0#
1.0#
2.0#
3.0#
4.0#
5.0#
6.0#
Swe#exp#to#Rus#
Swe#imp#from#Rus#
Swe#por8olio#in#Rus#
Rus#por8olio#in#Swe#
Swe#FDI#in#Rus#
Rus#FDI#in#Swe#
Rus#share#of#world#GDP#
Rus#share#of#MSCI#AWCI#
Share&in&percent&of&S
wed
ish&totals&
0.0#
1.0#
2.0#
3.0#
4.0#
5.0#
6.0#
Rus#exp#to#Swe#
Rus#imp#from#Swe#
Rus#por8olio#in#Swe#
Swe#por8olio#in#Rus#
Rus#FDI#in#Swe#
Swe#FDI#in#Rus#
Swe#share#of#world#GDP#
Swe#share#of#MSCI#AWCI#
Share&in&percent&of&R
ussian
&totals&
6
comfort in looking at investment flows between Sweden and Russia is that the observed flows are most likely real and not part of a tax haven story since neither country is known as a haven. However, some of the bilateral flows may still be routed through tax havens, which means that the official macro data on flows can be viewed as lower bounds.
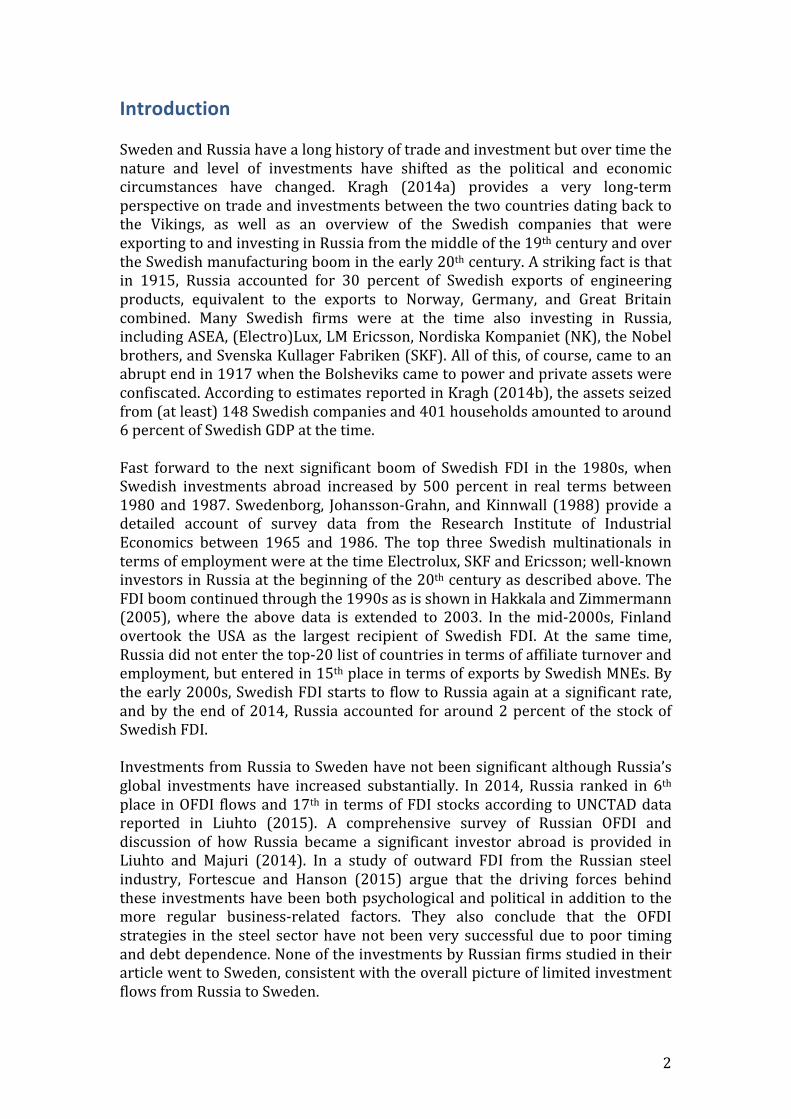
Figure 2. FDI flows from Sweden to Russia
Source: SCB and CBR The bilateral data on FDI from Sweden to Russia from SCB shows very little action until 2004, when there is a recorded flow of around $500 million and after that flows come and go with a record year in 2013 of around $1.5 billion (Figure 2). The data from CBR starts a few years later but in general shows flows that are at least two to three times larger than the Swedish data between 2008 and 2012. Then in 2013, when the Swedish data records a record year, the Russian data shows a very significant net outflow of Swedish FDI. Looking at the CBR data on stocks of FDI in Russia, the data for flows in 2013 is not easier to understand. However, the stock data shows a massive decline of Swedish FDI in 2014, at a scale that does not seem realistic, so it is unclear if the flow or stock data from the CBR is more reliable. FDI flows from Russia to Sweden were virtually non-‐existent according to official statistics until around 2008, and even after that, the flows in the peak year 2011 only amount to around $500 million (Figure 3). Again, the data sources are very inconsistent, and the Swedish data show net outflows in almost all of the years. The Russian data also has a large negative net flow in 2013, similar to what was recorded for Swedish flows to Russia.
!1500%
!1000%
!500%
0%
500%
1000%
1500%
2000%
2500%
2000% 2001% 2002% 2003% 2004% 2005% 2006% 2007% 2008% 2009% 2010% 2011% 2012% 2013% 2014%
USD
$million$
SCB% CBR%

7
Figure 3. FDI flows from Russia to Sweden
Source: SCB and CBR In addition to the official balance of payments data, there are company level data on greenfield FDI as well as M&As from private sources (fDi Intelligence from FT for FDI data and MergerMarket on M&As). This data has the benefit of being collected by the same institution for both countries, and Figure 4 shows the country aggregates. The dominant type of flow by a wide margin is greenfield investments from Sweden to Russia (“Swe inv Rus”). There are also smaller but non-‐trivial M&A flows going in the same direction (“Swe buy Rus”), while flows from Russia to Sweden are virtually non-‐existent until 2015. We will have a closer look at the details of the company level data below.
Figure 4. Investment flows based on company data
Source: fDi Markets and MergerMarkets
!800$
!600$
!400$
!200$
0$
200$
400$
600$
2000$ 2001$ 2002$ 2003$ 2004$ 2005$ 2006$ 2007$ 2008$ 2009$ 2010$ 2011$ 2012$ 2013$ 2014$
USD
$million$
SCB$ CBR$
0"
500"
1000"
1500"
2000"
2500"
2001" 2002" 2003" 2004" 2005" 2006" 2007" 2008" 2009" 2010" 2011" 2012" 2013" 2014" 2015"
USD
$mn$
Swe"buy"Rus" Swe"inv"Rus" Rus"buy"Swed" Rus"inv"Swe"

8
The annual average flows for the years 2007-‐2014 are shown in Figure 5 to compare the macro data and the company level data. The data are not fully compatible since the company data is gross investment flows whereas the balance of payments data are net flows (“net” in the sense that money sent back to the home country from the affiliate in the foreign country is deducted from any new investments done in the foreign country).
Figure 5. Annual average FDI flows from different sources
Source: Author’s calculations based on SCB, CBR, fDi Markets and MergerMarkets data. Given the discrepancy that arises because of net versus gross flows, it is not surprising that (gross) company flow data is higher than the (net) balance of payments data for Sweden. However, the difference between CBR and SCB is even larger than between company data and CBR data. The reported average annual FDI flows from Sweden to Russia vary from SCB’s $522 million in net flows to the company data on gross flows of close to $1.2 billion. Russian flows to Sweden are small in comparison to the flows in the other direction and the different data sources do not even have the same sign on the flows. There are also significant portfolio investments from Sweden to Russia, but the bilateral portfolio data is only available in terms of stocks and not flows (Figure 6) and flows cannot be derived simply by taking changes in stocks due to valuation effects. The stock of Swedish portfolio investments in Russia is almost exclusively made up of equity investments. After a very rapid increase in portfolio investments until 2006, there was a trend break in 2007 and then a dramatic decline in 2008 at the time of the global financial crisis. Much of this is most likely related to valuation effects since the stock market in Russia as in other places fell significantly that year, but Russia also suffered significant capital outflows in 2008 after the military intervention in Georgia. The fact that the share of Swedish portfolio equity invested in Russia went down from over three
!400$
!200$
0$
200$
400$
600$
800$
1000$
1200$
1400$
Swe$to$Rus$2007!2014$ Rus$to$Swe$2007!2014$
USD
$million$
SCB$ CBR$ Company$gross$investment$data$

9
percent to around one and a half percent in 2008, when almost all stock markets around the globe fell, suggests that it was more to the decline in Russia than valuation effects. However, the rebound in 2009 still points to a significant valuation effect, while the downward trend since 2010 is a combination of portfolio outflows and a relatively poor performing stock market in Russia. In 2014, Russian equity investments were back at around one percent of total Swedish portfolio equity abroad, similar to its share in 2002 before the rapid increase and still above Russia’s 0.4 percent share of the MSCI AWCI. However, the total share of Swedish portfolio investments in Russia is just above 0.4 percent since debt instruments and funds are over half of Swedish portfolio investments in other countries but virtually non-‐existent in Russia.
Figure 6. Swedish portfolio investments in Russia
Source: Author’s calculations based on SCB data Company level data Now we will have a more detailed look at the company level data. There are issues also here with the labels “Swedish” or “Russian” companies. Many companies can have their main operation in one country but legally be incorporated in a different country, or started in one country but then over time the majority shareholdings are with investors in another country. Most of the companies included here seem to receive a reasonable country label, but one significant data point on M&A (close to $1 billion in 2012) has been excluded from the study that was classified as Swedish by Mergermarket since the acquiring company making the investment in Russia was a Swedish subsidiary of the Danish brewery Carlsberg. At the same time, IKEA is a company founded in Sweden and with major activity in Sweden, and a major investor in Russia, as we will see, and left in the dataset despite being legally a foundation based in the Netherlands since 1982. This is somewhat arbitrary but most people when asked would call IKEA a Swedish company. In short, there is no perfect way of giving
0%#
1%#
2%#
3%#
4%#
0#
1000#
2000#
3000#
4000#
5000#
6000#
7000#
8000#
2001# 2002# 2003# 2004# 2005# 2006# 2007# 2008# 2009# 2010# 2011# 2012# 2013# 2014#Share&of&to
tal&Swed
ish&ou
tward&po
rfolio&investmen
t&
Stocks&in&USD
&million&
Equity# Funds# Debt# Share#of#Russia#equity#

10
multinational companies a country label in a globalized economy, although scholars often use the location of a company’s headquarters to determine its nationality.
Table 1. Company data on FDI
Source: Author’s calculations based on data from fDi Markets and MergerMarkets The data reported in this section cover the period January 2001 to August 2015, or half a year longer than the macro data reported earlier. The first years have few investments recorded but in 2003 there was a significant increase in flows from Sweden to Russia, with recorded flows going from $85 million in 2002 to $1.3 billion. For most of the years, and consistent with the macro data, Russian flows to Sweden are small and only a fraction of the flows in the other direction until 2015 when there is one significant Russian investment at the same time as flows from Sweden to Russia are at its lowest since 2002. During this period, 67 Swedish companies made greenfield FDI in Russia and 22 did M&As (Table 1). A full list of companies making greenfield FDI and M&As is available in the Annex. The greenfield investments covered 202 transactions worth together close to $15 billion. IKEA was the single largest investor with 59 investments worth $6.5 billion, which were almost six times the recorded investments of Tele2 in second place. Comparing the list of companies doing greenfield investment with those on the M&A list, only Tele2 enters close to the top on both lists. 13 of the M&A transactions do not report the amount involved and these amounts are missing in the table below. For example, the total value of Nordea’s investments is higher than the €246 million shown in the table since one of their two M&As has no recorded deal value. For the aggregate numbers on
#"firms #"transactions total"amount avg"amount #"firms #"transactions total"amount avg"amount(USD"mn) (USD"mn) (USD"mn) (USD"mn)
Total 67 202 14801 73 Total 8 9 767 85
Top"10"companies: All"8"companies:IKEA 59 6507 110 Lukoil 1 431 431Tele2 28 1072 38 Golden"Telecom 1 124 124CastorX"Capital 1 1000 1000 Planet"Fitness 1 76 76Volvo 12 971 81 Kaspersky"Lab 1 73 73Svenska"Cellulosa"Aktiebolaget"(SCA) 4 708 177 Rosatom 1 31 31Scania 3 688 229 PlayFon 2 17 8Petrosibir"(Shelton"Petroleum) 1 401 401 ABBYY 1 11 11Oriflame 6 375 63 Reksoft 1 4 4Baltic"Construction"Company"(BCC) 1 375 375NCC"(Nordic"Construction"Company) 2 200 100
#"firms #"transactions total"amount avg"amount #"firms #"transactions total"amount avg"amount(Euro"mn) (Euro"mn) (Euro"mn) (Euro"mn)
Total 22 28 698 39 Total 5 5 85 28
Top"10"companies: All"5"companies:Nordea AB 2 246 246 Steenord Corp 1 63 63Tele2 AB 5 173 35 International Marketing & Sales Group Plc1 14 14Lundin Mining AB 1 97 97 VSMPO Avisma Corporation Public Stock Company1 8 8Hilding Anders International AB 1 52 52 Baltic Reefers Ltd. 1 na naAuriant Mining AB 2 43 43 Simeos Mediacom, LLC 1 na naTeleca AB 1 18 18Orkla Svenska AB (Procordia Food AB) 1 15 15Kontakt East Holding AB 1 13 13Scancem AB 1 11 11Seco Tools AB 1 10 10
Gross%company%level%FDI%from%Russia%to%Sweden
Greenfield%FDI
M&A
Gross%company%level%FDI%from%Sweden%to%Russia
Greenfield%FDI
M&A

11
M&A displayed in the previous section, missing values are estimated (guessed) by using the average value of the transactions that do have recorded deal values. For individual companies with few investments, this type of estimate (guess) makes less sense and is therefore not presented here. Russian companies were not very active investors in Sweden, with a total eight companies making nine greenfield investments and five additional companies each making one M&A transaction during this time period. The total amounts were $767 million of greenfield investments and $85 million of M&A deals. A single investment by Lukoil accounts for half of all the recorded investments. In short, and in line with expectations, more Swedish MNEs have been interested in investing Russia than the other way around.
Research Findings The data above has shown that investments going from Sweden to Russia dominate the flows going in the other direction by a very significant margin. This is in line with the hypothesis that capital moves from countries with higher income levels to countries with lower income levels, as well as the hypotheses that flows go to larger markets with many potential customers and to markets with natural resources that are important inputs to certain MNEs. In additions to these general conclusions, this section will discuss the more specific research questions outlined above. Capital Flows and Standard Macro Indicators of Risk and Return The first question to address is if investments from Sweden to Russia have been moving in line with standard macro and finance variables as suggested by risk/return arguments. In Figure 7, FDI stocks and gross flows are plotted with Russian GDP, oil prices and the RUB/SEK exchange rate, where all variables are expressed as an index set to 100 in 2005. It is clear that the stock of Swedish FDI in Russia has grown very much in line with the development of Russian GDP, which in turn has shown a very high correlation with international oil prices (see Becker 2014). Over the period, there has been a downward trend in the exchange rate that shows less of a correlation with the other variables. Note that these data end in 2014 since the investment data for 2015 is not yet available, but we know that in 2015, there was a sharp decline in both oil prices, the exchange rate and also in Russian GDP. Another observation here is that the stock of FDI follows GDP closely, while the flow of FDI experienced a downward break after the global financial crises that still remains. FDI flows are of course connected to the stock of FDI, but this chart shows quite clearly that it will matter which variables are used when running regressions between FDI and for example GDP and many gravity equations use GDP to explain FDI flows rather than stocks.

12
Figure 7. Russian macro data and Swedish FDI trends
Source: Author’s calculations based on SCB and IMF data Swedish investors make investments in many countries and Figure 8 shows the share of total Swedish FDI invested in some major emerging market countries (Russia, China and Brazil) as well as some of the markets closer to Sweden (Poland and the three Baltic countries, Estonia, Latvia and Lithuania) in order to get some perspective on the investments going to Russia. The first observation is that the shares of these countries have all grown quite rapidly between 2000 and 2014, with shares doubling or even tripling in this time period. What is also noteworthy is that although the three BRIC countries included here get a lot of attention in the general discussion, the three Baltic countries combined account for the largest share of Swedish investments in these countries by some margin, while the share invested in Poland is similar to Russia or Brazil.
Figure 8. Swedish FDI stocks in key emerging markets
Note: Baltic3 is sum of Estonia, Latvia and Lithuania Source: Author’s calculations based on SCB data
0"
50"
100"
150"
200"
250"
300"
350"
400"
2001" 2002" 2003" 2004" 2005" 2006" 2007" 2008" 2009" 2010" 2011" 2012" 2013" 2014"
Inde
x&2005=100&
Swe"gross"FDI"flows"to"Rus" Russia"GDP"in"USD" RUB/SEK" Oil"price" Swe"FDI"stock"in"Rus"
0.0#
0.5#
1.0#
1.5#
2.0#
2.5#
3.0#
3.5#
2000# 2001# 2002# 2003# 2004# 2005# 2006# 2007# 2008# 2009# 2010# 2011# 2012# 2013# 2014#
Share&of&to
tal&Swed
ish&OFD
I&
Bal0c3#
China#share#
Russia#share#
Poland#share#
Brazil#share#

13
There are also estimates of the returns on FDI from SCB, and in Table 2, the mean returns and standard deviations of returns are presented for the above set of countries as well as for the total stock of outstanding Swedish FDI. Although the numbers are likely relatively rough estimates of returns, they confirm the general view that emerging markets offers higher returns that are more volatile that the overall portfolio. When returns are normalized by the standard deviation, the total portfolio shows the highest risk adjusted return, despite the fact that the mean return in Russia is twice as high. This does not mean that investment in Russia is not of interest overall, and comparing the total portfolio with and without investments in Russia, the portfolio that includes Russia generates a slightly higher risk adjusted return. This data and calculations provide some indication of why investing in Russia and other emerging markets is of interest to Swedish investors.
Table 2. Returns in percent on Swedish FDI 2005-2014
Note: Baltic3 is the sum of returns in SEK of Estonia, Latvia and Lithuania
divided by the sum of the FDI stock in SEK of the three countries Source: Author’s calculations based on data from SCB
Portfolio investments from Sweden to Russia also seem closely correlated with returns in Russia. This is seen in Figure 9, which displays the Russian RTS index and the stock of Swedish portfolio investments in Russia, where again both variables are normalized to 100 in 2005. As discussed above, Swedish portfolio investments in Russia are almost exclusively in equity, so the close correlation with the RTS index is in line with both investors going to markets with a rising stock market and the fact that the stock of portfolio will automatically move in line with the stock market due to the valuation effect. However, there are clear signs in the chart that portfolio investments have been reduced in the last couple of years, since the investment stock also declined in 2012-‐2013 when the RTS index was stable.
Mean St'dev Mean/St.dev.
Total 10.2 2.2 4.7Total'ex'Russia 10.0 2.2 4.6Russia 22.6 6.8 3.3China 18.9 6.7 2.4Brazil 26.1 12.2 1.9Poland 9.9 6.2 1.1Baltic3 16.7 7.3 1.9

14
Figure 9. Swedish portfolio investments and the Russian stock market
Source: SCB and Moscow Exchange (moex.com) FDI vs. Portfolio Investments The above analysis of FDI and portfolio flows is also relevant for the academic literature on different types of capital flows and in particular how FDI and portfolio flows differ in terms of volatility and from an international risk sharing perspective. A first hypothesis that has been forwarded in different models and forms is that FDI is more stable than portfolio flows and provides more risk sharing and would therefore be preferable for emerging market countries. In Figure 10, both stocks and shares of Swedish FDI and portfolio investments in Russia are shown. The trends all move in tandem until 2006; both stocks and Russia’s share of total Swedish investments all move up sharply with the shares of FDI and portfolio investments being at almost the same exact level in 2006. After that, the stock and share of portfolio investments fell sharply for two years before recovering temporarily in 2009-‐2010 but then continued on a downward path. FDI stocks show much less volatility over the time period, and in 2014 Russia accounted for 2 percent of the stock of Swedish OFDI. In the same year, the share of portfolio investments had fallen to less than 0.5 percent. Again, some of this is due to the fact that portfolio flows respond more strongly to valuation effects since shares are valued in the market all the time while this is not the case for FDI. However, the same valuation logic applies in all countries that receive investments from Sweden, so the decline in Russia’s share of total portfolio investments cannot be attributed to a general decline in stock markets around the globe but includes a significant Russia specific component as well. In short, the Swedish-‐Russia experience seem to support the hypothesis that FDI is a more stable form of international capital flows that is more likely to stay also in times of economic turbulence in the host country and provides more international risk sharing.
0"
50"
100"
150"
200"
250"
2001" 2002" 2003" 2004" 2005" 2006" 2007" 2008" 2009" 2010" 2011" 2012" 2013" 2014"
Inde
x&2005=100&
RTS"index" Swe"port"stock"in"Rus"

15
Figure 10. Swedish FDI vs. portfolio investments
Source: Author’s calculations based on SCB data Another argument that has been used to explain if investments tend to come as FDI or portfolio flows is the quality of institutions in the host country. As already discussed, both FDI and portfolio flows moved in line with the general macro economic development in the first five years in the figure before the trends diverge quite distinctly. If the hypothesis regarding the impact of institutions on the composition of capital flows is relevant here, we should be able to observe some institutional changes or other news that may affect the sentiment of portfolio investors at the time of the diverging flows. There were several political and security related events in 2006 and 2007 in Russia—increased tensions with Georgia; the death of former agent Litvinenko and related diplomatic disputes with the UK; democracy demonstrations in St. Petersburg and Moscow; and missile defense arguments with the USA—but it is not clear to what extent any particular event was key to the shift in investor sentiment and a trend break in portfolio flows. Some governance indicators measured by the World Bank, such as voice and accountability, regulatory quality, and control of corruption did deteriorate somewhat from 2005 to 2007. In terms of corruption, Russia went from 121 to 143 from 2006 to 2007 on Transparency International’s list, which is one deteriorating institutional factor that could lead to less portfolio flows according to both theoretical models and empirical estimations.
FDI vs. Trade A key issue in the early literature on FDI was whether capital flows would replace trade or be a complement and potentially even support more trade. For the case of Swedish investments to Russia, there is a strong positive correlation between trade and the stock of FDI (Figure 11). The significant drop in gross
0.0#
0.5#
1.0#
1.5#
2.0#
2.5#
3.0#
0#
2000#
4000#
6000#
8000#
10000#
12000#
2000# 2001# 2002# 2003# 2004# 2005# 2006# 2007# 2008# 2009# 2010# 2011# 2012# 2013# 2014#
Share&of&to
tal&Swed
ish&stocks&abroa
d&
USD
&million&
Russia#FDI#(MUSD)# Russia#por=olio#(MUSD)# Russia#FDI#share# Russia#por=olio#share#

16
investment flows in 2007 seem a bit off in terms of the trend in exports and is to a large extent a result of IKEA not making any recorded investments in that year, while making investments of well over $1 billion both in 2006 and 2008. The sharp decline in exports in 2009 at the peak of the global financial crisis and contraction of the Russian economy was associated with a decline in both the stock and gross flow of FDI. Although the gross FDI flows have been smaller since the 2009 crisis, the stock of FDI is still moving in parallel with exports and would support the general view that FDI is more likely a complement rather than a substitute for trade.
Figure 11. Swedish exports vs. FDI
Source: Author’s calculations based on SCB data
FDI vs. Trade in Different Sectors From Figure 12, it is clear that both exports and investments from Sweden to Russia are far more diversified than the flows in the other direction.6 The composition also suggests that investments and trade go hand-‐in-‐hand in many cases as also the Swedish macro numbers above suggested. This is also clear with the major flows from Russia to Sweden; the main exports to Sweden are oil and petrochemicals and the largest investment from Russia to Sweden is Lukoil’s investment in a warehouse in Gothenburg to get closer to its customers for marine lubricants. Although ships from many countries come to Gothenburg, so the country of the final customer in Gothenburg is not necessarily Swedish, this would fit the general idea of horizontal FDI. The other Russian investments in Sweden are focused on the ICT sector and gaining access to one of the world’s most dynamic environments for both development and consumer testing of ICT products and services. These investments have multiple purposes for the
6 Becker (2015) provides a more detailed analysis of bilateral trade flows.
0"
2000"
4000"
6000"
8000"
10000"
12000"
0"
500"
1000"
1500"
2000"
2500"
3000"
3500"
4000"
4500"
5000"
2000" 2001" 2002" 2003" 2004" 2005" 2006" 2007" 2008" 2009" 2010" 2011" 2012" 2013" 2014"
FDI$stock$USD
$million$
Expo
rts$a
nd$FDI$flow
s$USD
$million$
Gross"FDI"flows"company" Exports" Swe"FDI"stock"in"Rus"

17
investing companies and are more complex in nature than pure horizontal or vertical FDI as they exploit a market with both knowledge and customers that help the companies develop their international strategies. The exports and investments from Sweden to Russia are more diverse as shown by data and have the potential to include a wider range of classifications of FDI. However, a closer look seems to suggest that a large share of investments going to Russia is relatively straightforward horizontal FDI and most of the other investments fall rather squarely in the vertical class of FDI. IKEA is by a wide margin the largest Swedish investor in Russia and is basically investing in a retail infrastructure that makes it possible to sell its goods to Russian consumers. This does not mean that all of their investments fall in the category of consumer products since IKEA develops shopping malls (that are classified as real estate investments) and also has some manufacturing of goods in Russia. Despite these multifaceted investments, IKEA’s investments are basically about gaining access to the Russia market, and in line with the horizontal FDI hypothesis. Also investments by telecom companies in a wide sense and financial institutions fall in the category of horizontal FDI and gaining access to a large Russian market. There are also significant investments in the automotive sector that could potentially fall in different categories of FDI. However, tariffs and other trade obstacles suggest that this is again largely about gaining access to the Russian market rather than making Russia an integral part of international production chains. Finally, construction firms and real estate investors also fall in the horizontal FDI box. There are also Swedish firms that are in natural resource sectors that make significant investments in Russia to gain access to Russia’s enormous natural resources. However, the natural resource related vertical FDI only account for around ten percent of total investments by Swedish firms in Russia. This is likely due to a combination of the relatively small scale of this sector among Swedish MNEs and the regulatory and business environment in Russia in natural resource intensive industries. Overall, vertical, export-‐platform and more complex reasons for FDI seem to be far behind market seeking horizontal investments when it comes to FDI from Sweden to Russia.

18
Figure 12. The composition of trade vs. FDI
Swedish exports to Russia Swedish greenfield FDI to Russia
Russian exports to Sweden Russian greenfield FDI in Sweden
Note: Export shares are for 2014 while FDI shares are based on cumulative company flows from January 2003 to August 2015. Source: Author’s calculations based on SCB and fDi Markets data Predicted vs. Actual Investments between Sweden and Russia The final question to address is if observed FDI flows are in line with empirical models. Many different empirical models have been estimated in the recent past with the general structure of including some version of traditional gravity variables and then augmented the empirical model with a wide set of explanatory variables to study the effect of more specific factors. Many of the extra indicators turn out to have relatively modest effects on the level of investments even if they are statistically significant, and most of the variables are not robust in the sense of clearing the hurdle of a Bayesian selection process as discussed above. The empirical predictions presented here therefore focus on the most basic specifications from three recent studies that look at bilateral FDI from high income to lower income countries. Two articles, Bevan, Estrin and Meyer (2004) and Frenkel, Funke, and Stadtmann (2004), include Russia in the sample of countries while Bellak, Leibrecht, and Damijan (2007) do not but still focus on FDI to transition countries in Central and Eastern Europe (CEE). Both the articles that include Russia have a Russia dummy that is estimated to be
Other&machinery&24%&
Communica3on&equip.&20%&
Trucks,&heavy&transport&10%&
Mining&equip.&6%&
Generators&etc&5%&
Cars&etc&5%&
Manufactured&goods&9%&
Chemical&prod.&etc&
9%&
Finished&goods&6%& Other&
6%&
Consumer)Products)30%)
Real)Estate)21%)Automo8ve)
11%)
Communica8ons)8%)
Leisure)7%)
Paper)etc)7%)
Coal,)Oil)and)Natural)Gas)
3%)
Fin.)Serv.)3%)
Other)10%)
Crude&oil&75%&
Other&fuels&and&oils&11%&
Chemical&prod.&8%&
Manufactured&goods&3%&
Other&3%&
ICT$30%$
Petroleum$prod$56%$
Leisure$10%$
Fin$service$4%$

19
negative and significant from both a statistical and economic perspective (Table 3). By applying the estimated models on relevant Swedish and Russian data, we obtain predicted bilateral flows from Sweden to Russia that can be compared to the actual average FDI flow of $396 million. In short, all models predict much larger flows ($1.1, $1.5 and $8.1 billion respectively) than the observed net FDI flows from Sweden to Russia. However, the annual average gross FDI flow based on company data is $1.2 billion, which is right in the middle of the estimates generated by the empirical models that include Russia. One obvious problem with the estimate in the study that does not include Russia is that the coefficient on host country GDP is very large (and Russia has a very large GDP compared with the CEE countries included in the study) while there is no negative Russia dummy that reduces the impact of the predicted FDI flow.
Table 3. Predictions of FDI flows from Sweden to Russia
Source: Author’s calculations based on SCB, CBR and EBRD data In sum, the empirical models that include standard gravity model variables differ along many dimensions, including in what forms the models are estimated (levels, natural logs, or logs), what countries are included and what time period the data cover. Although the models are qualitatively similar, the quantitative estimates are quite divers and generate large differences in predicted values for bilateral flows between two specific countries. It is therefore difficult to answer with any precision if the bilateral flows from Sweden to Russia are “too small” or “too large”. However, it does seem that there is empirical support for Russia being different in a sense of receiving less FDI than standard gravity models would predict given the negative dummies and huge flow the empirical model without Russia generated here. If this is due to the simple fact that Russia is a country with a much larger GDP than most other countries included in empirical studies or if it depends on Russia-‐specific institutional factors that are not
Bevan&et&al&(2004) Frenkel&et&al&(2004) Bellak&et&al&(2007)Dep.%Var:%FDI Dep.var:%log(FDI) Dep.var:%ln(FDI)
Coeff. Coeff. Coeff.GDP%home 0.02449 log(GDPhome) 0.036 ln(GDPhome) 0.332GDP%host 1.20838 log(GDPhost) 0.021 ln(GDPhost) 1.2Distance E0.03643 log(Distance) E0.016 ln(GDP/cap%home) 3.133Relative%ULC 68.76288 Russia%dummy E0.068 ln(GDP/cap%host) E0.404Common%border 307.7798 Constant 8.606 ln(Distance) E0.922Russia%dummy E401.5899 Constant E55.893Constant E156.1672Transition%index 48.97338
Predicted&FDI 1058 Predicted&FDI 1451 Predicted&FDI 8127(USD%mn) (USD%mn) (USD%mn)
Actual%annual%average%FDI%flow%2001E2014%=%USD396%mn%

20
included here cannot be concluded with any greater certainty but could be a topic for closer empirical investigation.
Conclusions Swedish investments to Russia have to a large extent been motivated by gaining access to a market of over 140 million customers that for a relatively long time experienced very significant increases in real disposable incomes. Although Russia is still a large market with many customers, real incomes have fallen recently and the general macroeconomic outlook is not favorable in light of low international oil prices and continued sanctions and counter-‐sanctions. Russia thus faces the challenge of attracting foreign companies that can help diversify and modernize the economy at a time when the domestic environment is not very attractive to foreign companies. The companies that are already there may have too much to lose to move out of Russia, but it will be hard to convince new companies to enter the Russian market at this point in time. The policy options from a Russian perspective can be viewed as focusing on sticks or carrots to attract more foreign investments; sticks in the sense of sanctions and tariffs to make it harder to export to Russia so any company that want to have access to the Russia market is “forced” to move inside the (potentially expanded) sanctions and tariff barriers; carrots could instead be preferential tax treatments or major reforms of the institutional factors that are viewed as impediments to investments today (for example, corruption, rule of law, and government efficiency). Most economists would argue that the latter set of reforms would generate the largest long-‐term gains to the Russian economy, not only from foreign investments but also from potential Russian investors and entrepreneurs. However, these reforms are also the most complicated to implement without potentially rocking the whole power structure in Russia and are likely not first in line to be implemented by policy makers. Looking at flows from Russia to Sweden, it is probably less of an issue on the minds of Swedish policy makers. The Swedish economy is going relatively well; is already viewed as one of the world’s most competitive; and has a particularly high potential in the ICT sector that has already seen some Russian investments. It is also hard to change the fact that Sweden is a relatively small country with a relatively inflexible labor and housing market that makes investments in many sectors other than ICT rather unattractive. Dealing with these inflexibilities is high on the policy agenda in Sweden, but as in Russia, some of the most needed reforms are the ones that are hardest to actually implement for policy makers.

21
Bibliography Albuquerque, R 2003, ‘The composition of international capital flows: risk sharing through foreign direct investment’, Journal of International Economics, vol. 61, no. 2, pp. 353-‐83. Anderson, J 2010, The Gravity Model, Working Paper 16576, National Bureau of Economic Research, Cambridge, MA. Baltagi, BH, Egger, P & Pfaffermayr, M 2007, ‘Estimating models of complex FDI: Are there third-‐country effects?’, Journal of Econometrics, vol. 140, no. 1, pp. 260-‐81. Becker, T 2014, A Russian Sudden Stop or Just a Slippery Oil Slope to Stagnation?, BSR Policy Briefing 4/2014, Centrum Balticum, Turku. Becker, T 2015, Russia’s economic troubles – a perfect storm of falling oil prices, sanctions and lack of reforms, SIEPS, European Policy Analysis, 2015:9. Bellak, C, Leibrecht, M & Damijan, JP 2007, Infrastructure endowment and corporate income taxes as determinants of Foreign Direct Investment in Central-‐ and Eastern European Countries, KU Leuven LICOS Discussion Paper, No. 193. Bergstrand, JH & Egger, P 2007, ‘A knowledge-‐and-‐physical-‐capital model of international trade flows, foreign direct investment, and multinational enterprises’, Journal of International Economics, vol. 73, no. 2, pp. 278-‐308. Bevan, A, Estrin, S & Meyer, K 2004, ‘Foreign investment location and institutional development in transition economies’, International Business Review, vol. 13, no. 1, pp.43-‐64. Blonigen, BA & Piger, J 2014, ‘Determinants of foreign direct investment’, Canadian Journal of Economics, vol. 47, no. 3, pp. 775-‐812. Daude, C & Fratzscher, M 2008, ‘The pecking order of cross-‐border investment’, Journal of International Economics, vol. 74, no. 1, pp. 94-‐119. Dunning, JH 2001, ‘The eclectic (OLI) paradigm of international production: past, present and future’, International journal of the economics of business, vol. 8, no. 2, pp. 173-‐90. Eicher, TS, Helfman, L & Lenkoski, A 2012, ‘Robust FDI determinants: Bayesian Model Averaging in the presence of selection bias’, Journal of Macroeconomics, vol. 34, no. 3, pp. 637-‐51. Ekholm, K, Forslid, R & Markusen, JR 2007, ‘Export-‐Platform Foreign Direct Investment’, Journal of the European Economic Association, vol. 5, no. 4, pp. 776-‐95.

22
Fortescue, S & Hanson, P 2015, ‘What drives Russian outward foreign direct investment? Some observations on the steel industry’, Post-‐Communist Economies, vol. 27, no. 3, pp. 283-‐305. Fratzscher, M & Imbs, J 2009, ‘Risk sharing, finance, and institutions in international portfolios’, Journal of Financial Economics, vol. 94, no. 3, pp. 428-‐47. Frenkel, M, Funke, K & Stadtmann, G 2004, ‘A panel analysis of bilateral FDI flows to emerging economies’, Economic Systems, vol. 28, no. 3, pp. 281-‐300. Froot, KA & Stein, JC 1991, ‘Exchange rates and Foreign Direct Investment: An Imperfect Capital Markets Approach’, The Quarterly Journal of Economics, vol. 106, no. 4, pp. 1191-‐217. Hakkala, K & Zimmermann, D 2005, Foreign Operations of Swedish Manufacturing Firms-‐Evidence from the IUI Survey on Multinationals 2003, Working Paper Series 650, Research Institute of Industrial Economics, Stockholm. Helpman, E., 2006, ‘Trade, FDI, and the Organization of Firms’, Journal of Economic Literature, vol. 44, no. 3, pp. 589-‐630. Helpman, E, Melitz, M & Yeaple, S 2004, ‘Export versus FDI with Heterogeneous Firms’, American economic review, vol. 94, no. 1, pp. 300-‐16. Kleinert, J & Toubal, F 2010, ‘Gravity for FDI’, Review of International Economics, vol. 18, no. 1, pp. 1-‐13. Kragh, M 2014a, ’Doing Business in Russia? Swedish perspectives from the Varangians to Vladimir Lenin’, in A Husebye (ed.), Doing Business in Russia: Sources to Swedish business history in Russia, 1850-‐1920, Centre for Business History, Bromma. Kragh, M 2014b, ‘Patterns of Swedish-‐Russian Trade and Investments (1840s-‐1920s)’, in M. Kragh (ed.), Swedish Business History in Russia, 1850-‐1917, Centre for Business History, Bromma. Liuhto, KT 2015, ‘Motivations of Russian firms to invest abroad: How sanctions affect the Russian outward foreign direct investment?’, Baltic Region, vol. 26, no. 4, pp. 4-‐19. Liuhto, KT & Majuri, SS 2014, ‘Outward Foreign Direct Investment from Russia: A Literature Review’, Journal of East-‐West Business, vol. 20, no. 4, pp. 198-‐224. Lizondo, JS 1990, Foreign direct investment, IMF Working paper, WP 90/63, Washington. Markusen, JR & Maskus, KE 2001, General-‐Equilibrium Approaches to the Multinational Firm: A Review of Theory and Evidence, Working Paper No. 8334, National Bureau of Economic Research, Cambridge, MA.

23
Nocke, V & Yeaple, S 2007, ‘Cross-‐border mergers and acquisitions vs. greenfield foreign direct investment: The role of firm heterogeneity’, Journal of International Economics, vol. 72, no. 2, pp. 336-‐65. Portes, R & Rey, H 2005, ‘The determinants of cross-‐border equity flows’, Journal of International Economics, vol. 65, no. 2, pp. 269-‐96. Swedenborg, B, Johansson-‐Grahn, G & Kinnwall, M 1988, Den svenska industrins utlandsinvesteringar 1960-‐1986, Industriens Utredningsinstitut, Almqvist och Wiksell International, Stockholm.

24
Annex
Figure A1. Comparing domestic and international FDI data source (same scale for flows in both charts for comparability)
!1500%
!1000%
!500%
0%
500%
1000%
1500%
2000%
2500%
3000%
1998% 1999% 2000% 2001% 2002% 2003% 2004% 2005% 2006% 2007% 2008% 2009% 2010% 2011% 2012% 2013% 2014%
USD
$million$
FDI$from$Sweden$to$Russia,$various$data$sources$
SCB% CBR% OECD% UNCTAD%SWE% UNCTAD%RUS% Company%gross%investment%data%
!1500%
!1000%
!500%
0%
500%
1000%
1500%
2000%
2500%
3000%
1998% 1999% 2000% 2001% 2002% 2003% 2004% 2005% 2006% 2007% 2008% 2009% 2010% 2011% 2012% 2013% 2014%
USD
$million$
FDI$from$Russia$to$Sweden,$various$data$sources$
SCB% CBR% OECD% UNCTAD%SWE% UNCTAD%RUS% Company%gross%investment%data%

25
Table A1. Full list of companies included in gross FDI flows data 2001 to mid-‐2015
Swedish companies’ greenfield FDI in Russia
Source: Author’s calculations based on fDi Markets data
Investments((count)
Total(investments((USD(mn)
Avg.(investment((USD(mn)
IKEA 59 6507 110Tele2 28 1072 38CastorX(Capital 1 1000 1000Volvo 12 971 81Svenska(Cellulosa(Aktiebolaget((SCA) 4 708 177Scania 3 688 229Petrosibir((Shelton(Petroleum) 1 401 401Oriflame 6 375 63Baltic(Construction(Company((BCC) 1 375 375NCC((Nordic(Construction(Company) 2 200 100RM(Estate 1 178 178Nordea(Bank((Nordea) 5 168 34Cloetta(Fazer 1 154 154Kooperativa(Forbundet 1 150 150SKF 2 142 71Bong 1 137 137Intercellulosa 1 137 137Swedbank( 4 134 34Catella 2 127 64Finnveden(Group 1 122 122Lindab 3 110 37Hennes(&(Mauritz((H&M) 11 89 8Orbit(One 1 72 72Centrum(Group 2 70 35Skandinaviska(Enskilda(Banken((SEB) 2 67 34Svenska(Handelsbanken 2 67 34Malka(Oil 1 54 54Lantmannen 1 47 47Autoliv 1 41 41Trelleborg 1 41 41Skanska 1 31 31Sony(Mobile(Communications 2 27 14Scandinavian(Airlines(Systems 1 24 24Ericsson 1 23 23Nynas 1 22 22Lindstorm 1 21 21Finndomo 1 20 20Maxit(Group 1 17 17Cint 1 16 16Comsol(AB 1 16 16IFS 1 16 16Outpost24 1 16 16Vaderstad 2 15 8SystemSeparation 1 14 14Teliasonera 2 10 5Electrolux 1 9 9Human(Search 2 9 5Gas(Turbine(Efficiency((GTE) 1 9 9RayClinic 1 9 9Telemar(Scandinavia 1 9 9IMP/Cydonya(Group 1 8 8Bohmans 1 6 6Tbricks 1 6 6Axis(Communications 1 5 5MK(Electronics 1 5 5Modern(Times(Group((MTG) 1 5 5RusForest 1 5 5Karolin(Machin(Tool((KMT(Group) 1 3 3Sandvik 1 3 3G&L(Beijer 1 3 3A&R(Carton 1 3 3Holmen 1 2 2AB(Balticum 1 2 2BE(Group 1 2 2Dino(Nobel 1 2 2Bonnier 1 1 1

26
Swedish companies’ M&A deals in Russia
Source: Author’s calculations based on MergerMarkets data
Russian companies’ greenfield FDI in Sweden
Source: Author’s calculations based on fDi Markets data
Russian companies’ M&A deals in Sweden
Source: Author’s calculations based on MergerMarkets data
All dealsDeals with
recorded valueTotal recorded
value (euro mn)Avg deal value
(euro mn)Nordea AB 2 1 246 246Tele2 AB 5 5 173 34.6Lundin Mining AB 1 1 97 97Hilding Anders International AB 1 1 52 52Auriant Mining AB 2 1 43 43Teleca AB 1 1 18 18Orkla Svenska AB (trading as Procordia Food AB)1 1 15 15Kontakt East Holding AB 1 1 13 13Scancem AB 1 1 11 11Seco Tools AB 1 1 10 10RusForest AB 1 1 9 9AF Group 1 1 6 6Vostok Gas Ltd 1 1 5 5Bidder Company 1 0 0 naHammar Invest AB (publ) 1 0 0 naHexagon AB 1 0 0 naIf P&C Insurance 1 0 0 naModern Times Group MTG AB 1 0 0 naRoxtec AB 1 0 0 naSkandinaviska Enskilda Banken AB 1 0 0 naSweco AB 1 0 0 naSystemair AB 1 0 0 naZodiac Nordic 1 0 0 na
Investments((count)
Total(investments((USD(mn)
Avg.(investment((USD(mn)
Lukoil 1 430.7 430.7Golden(Telecom 1 123.8 123.8Planet(Fitness 1 76.2 76.2Kaspersky(Lab 1 73.3 73.3Rosatom 1 30.7 30.7PlayFon 2 16.9 8.45ABBYY 1 11.3 11.3Reksoft 1 4.4 4.4
All dealsDeals with
recorded valueTotal recorded
value (euro mn)Avg deal value
(euro mn)Steenord Corp 1 1 63 63International Marketing & Sales Group Plc 1 1 14 14VSMPO Avisma Corporation 1 1 8 8Baltic Reefers Ltd. 1 0 0 naSimeos Mediacom, LLC 1 0 0 na


![Riga. Attractiveness of Riga City German (West) interest [12 – 15 century] Russian (East) interest [18 - 20 century] Swedish (North) interest [17 century]](https://img.pdfslide.net/doc/110x75/56649e305503460f94b20f9e/riga-attractiveness-of-riga-city-german-west-interest-12-15-century.jpg)
![LANGUAGE PROGRAMS FRENCH IItalian Japanese Korean Lithuanian Ojibwe Polish Portuguese [Brazilian] Portuguese [Continental] Russian Spanish Swedish Swiss German Twi Ukranian Vietnamese](https://img.pdfslide.net/doc/110x75/5e2dc0ada2982604d70be93e/language-programs-french-i-italian-japanese-korean-lithuanian-ojibwe-polish-portuguese.jpg)