Embed Size (px)
Citation preview
29 Complex Renal Masses
CLINICAL IMAGAGINGAN ATLAS OF DIFFERENTIAL DAIGNOSIS
EISENBERG
DR. Muhammad Bin Zulfiqar PGR-FCPS III SIMS/SHL
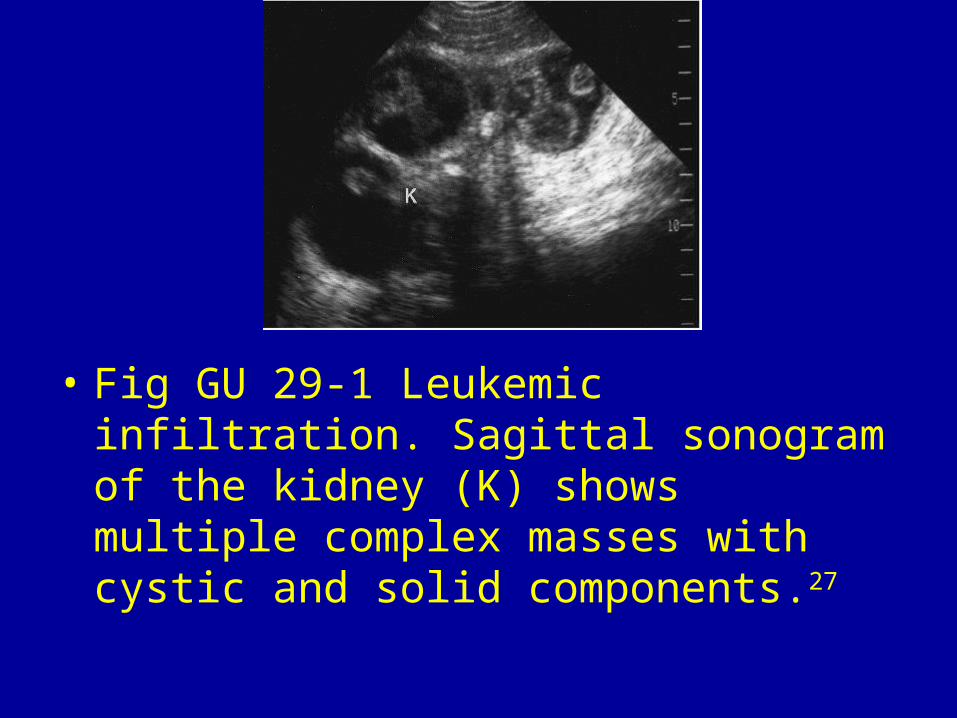
• Fig GU 29-1 Leukemic infiltration. Sagittal sonogram of the kidney (K) shows multiple complex masses with cystic and solid components.27
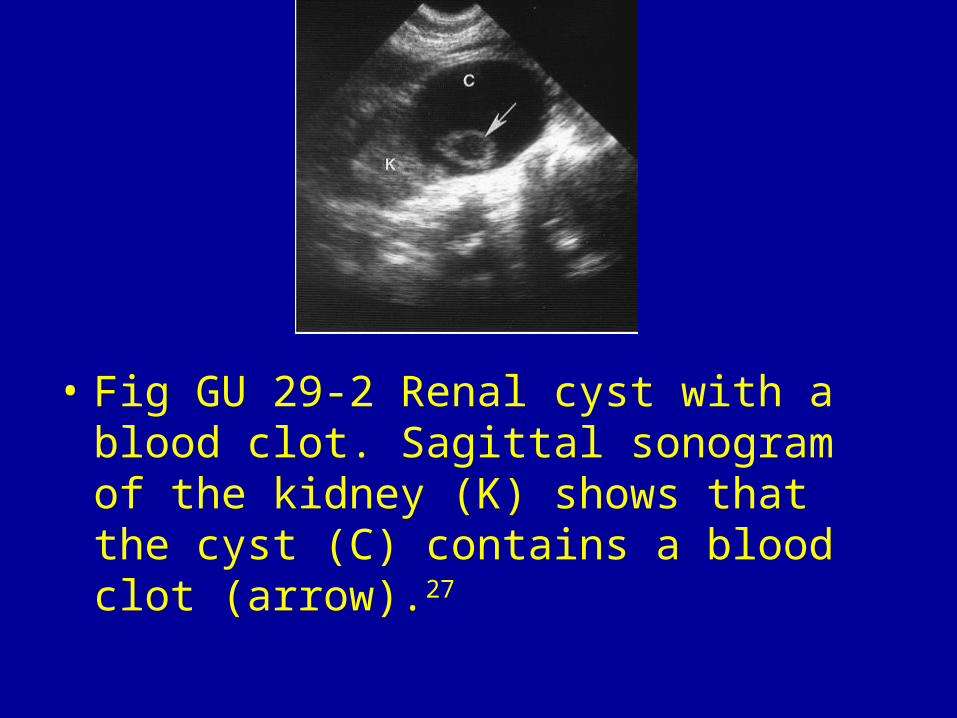
• Fig GU 29-2 Renal cyst with a blood clot. Sagittal sonogram of the kidney (K) shows that the cyst (C) contains a blood clot (arrow).27
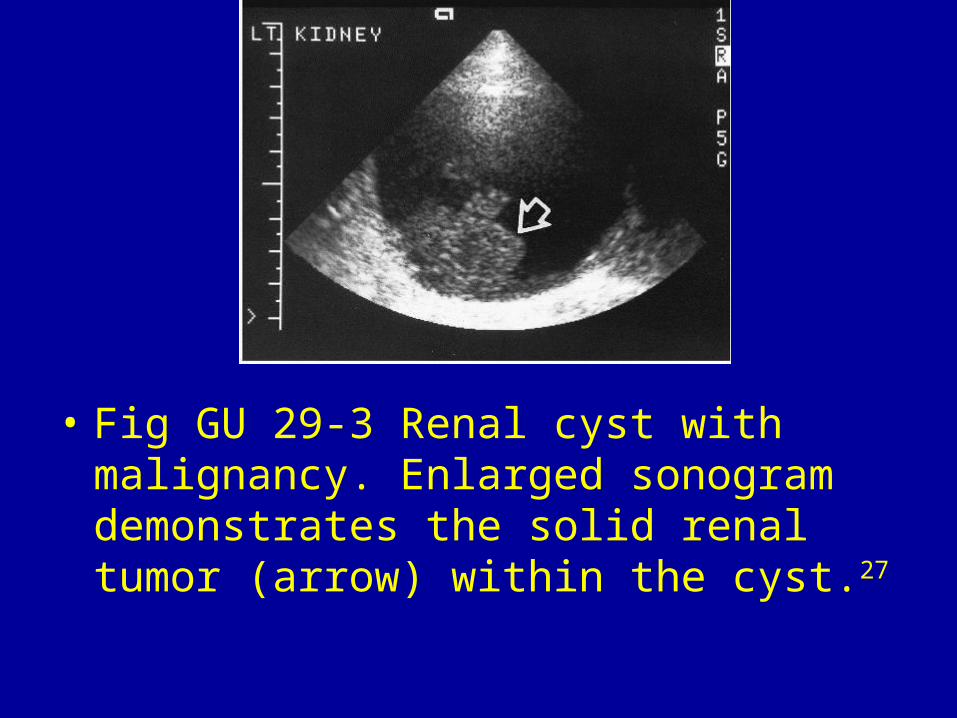
• Fig GU 29-3 Renal cyst with malignancy. Enlarged sonogram demonstrates the solid renal tumor (arrow) within the cyst.27
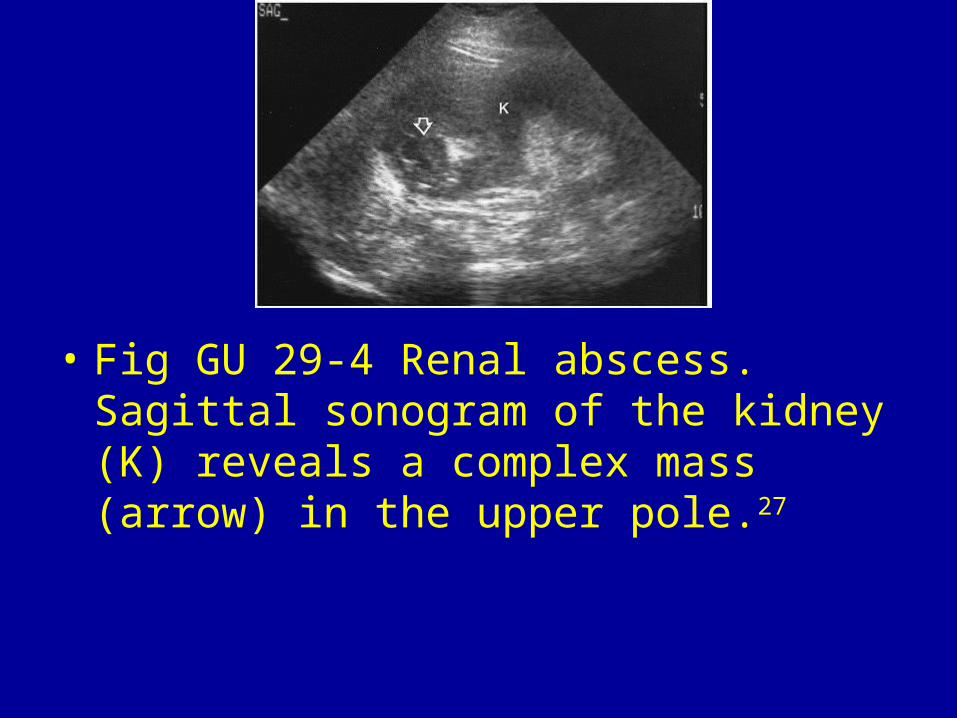
• Fig GU 29-4 Renal abscess. Sagittal sonogram of the kidney (K) reveals a complex mass (arrow) in the upper pole.27
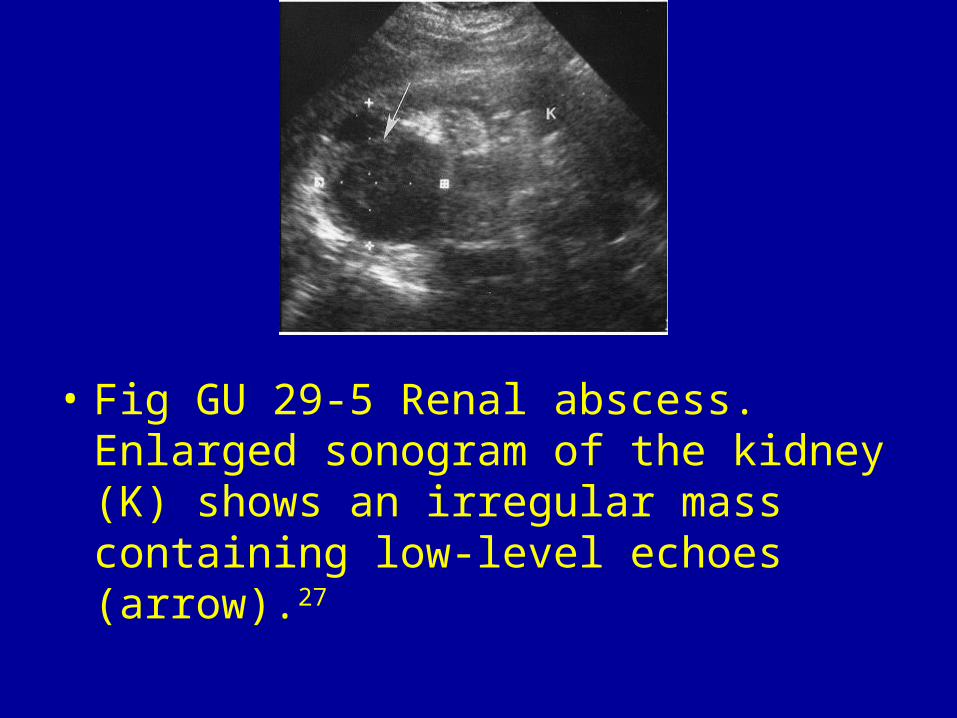
• Fig GU 29-5 Renal abscess. Enlarged sonogram of the kidney (K) shows an irregular mass containing low-level echoes (arrow).27
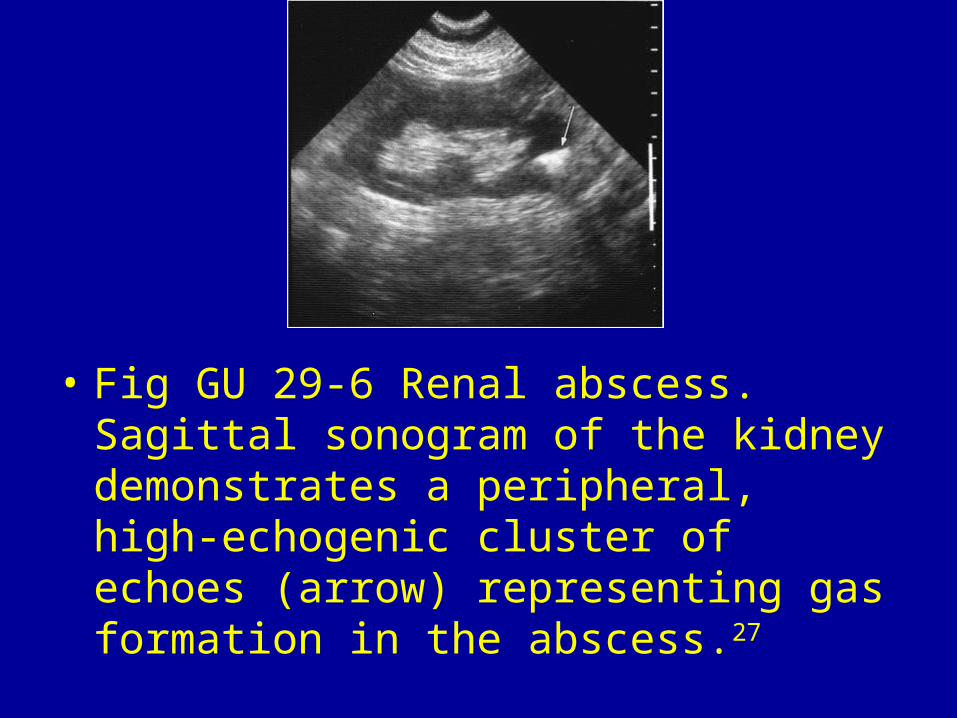
• Fig GU 29-6 Renal abscess. Sagittal sonogram of the kidney demonstrates a peripheral, high-echogenic cluster of echoes (arrow) representing gas formation in the abscess.27
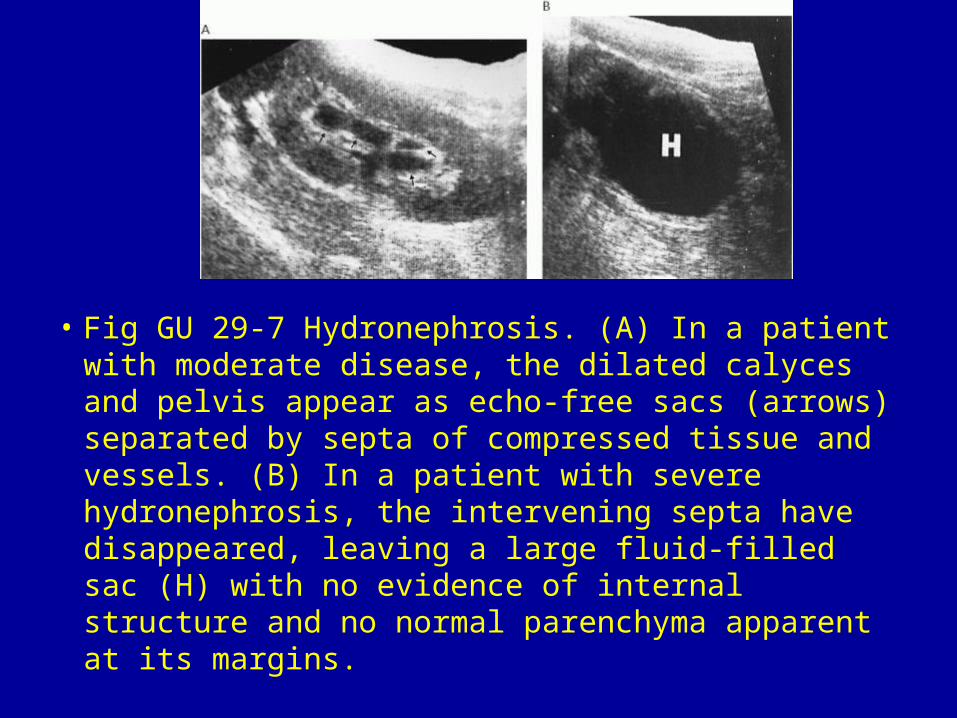
• Fig GU 29-7 Hydronephrosis. (A) In a patient with moderate disease, the dilated calyces and pelvis appear as echo-free sacs (arrows) separated by septa of compressed tissue and vessels. (B) In a patient with severe hydronephrosis, the intervening septa have disappeared, leaving a large fluid-filled sac (H) with no evidence of internal structure and no normal parenchyma apparent at its margins.
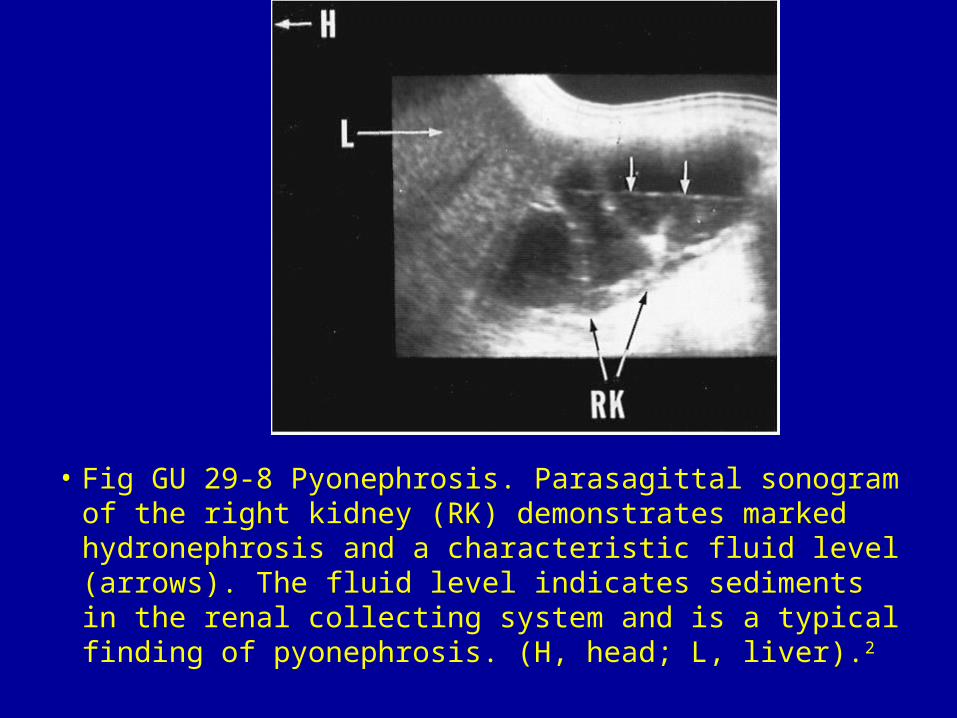
• Fig GU 29-8 Pyonephrosis. Parasagittal sonogram of the right kidney (RK) demonstrates marked hydronephrosis and a characteristic fluid level (arrows). The fluid level indicates sediments in the renal collecting system and is a typical finding of pyonephrosis. (H, head; L, liver).2