Embed Size (px)
Citation preview
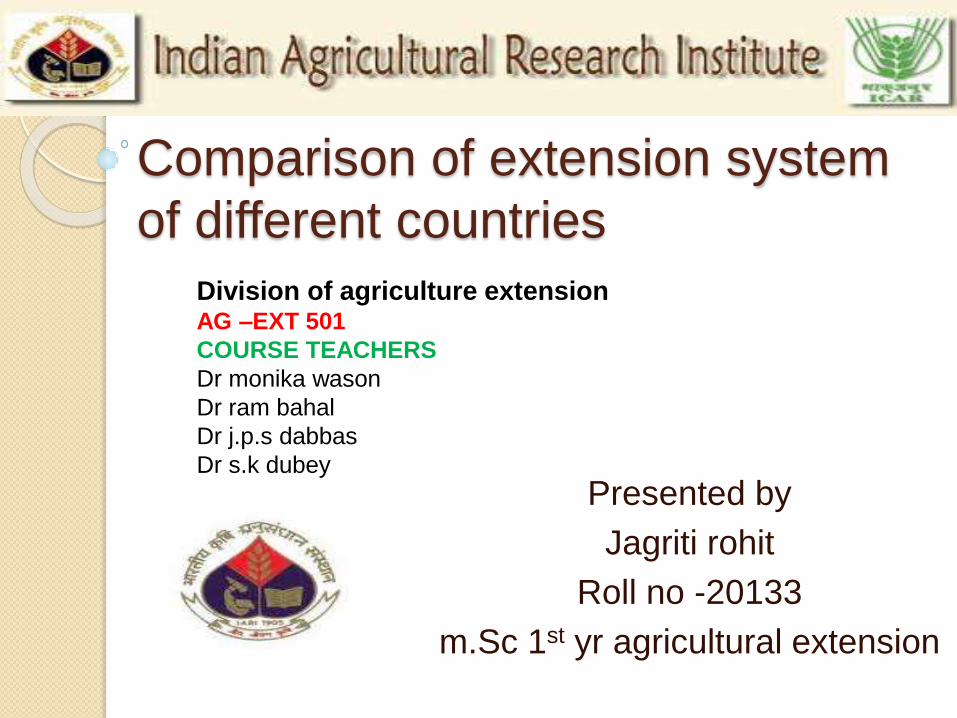
Comparison of extension system
of different countries
Presented by
Jagriti rohit
Roll no -20133
m.Sc 1st yr agricultural extension
Division of agriculture extension AG –EXT 501
COURSE TEACHERS
Dr monika wason
Dr ram bahal
Dr j.p.s dabbas
Dr s.k dubey

India Netherlands Indonesia

INTRODUCTION
Agricultural extensionwas once known as the application of scientific research and new knowledge to agricultural practices through farmer education. The field of extension now encompasses a wider range of communication and learning activities organised for rural people by professionals from different disciplines, including agriculture, agricultural marketing, health, and business studies.

INDIA
India is an agricultural country ,
with one third of its population
depending on agriculture directly
or indirectly.
Indian agriculture contribute nearly
14.6 to the gdp.
In the new millennium, the
challenges in Indian agricultural
sector are quite different from
those met in the previous decades.
The enormous pressure to produce
more food from less land with
shrinking natural resources is a
tough task for the farmers. To keep
up the momentum of growth a
careful economic evaluation of
inputs like seeds, fertilisers,
irrigation sources etc are of
considerable importance.

NETHERLANDS
More than 27% of the total land area of the Netherlands is under seasonal or permanent crop production. Grasslands account for about 54% of all agricultural lands. Most farms are effectively managed and worked intensively with mechanical equipment. The many cooperatives have added to the efficiency of production and distribution.
Although agricultural production has decreased in recent years, labor productivity in Dutch agricultural and horticultural industries has risen sharply. The number of holdings declined by over 17% from the mid–1970s to the mid–1980s; in 2000 there were 51,725 arable holdings. The agricultural labor force totaled 254,000 in 1999

INDONESIA
About 45% of Indonesian workers are engaged in agriculture, which accounts for 17% of GDP in 2001. Some 31 million ha (76.6 million acres) are under cultivation, with 35% to 40% of the cultivated land devoted to the production of export crops. Some 60% of the country's cultivated land is in Java.
There are three main types of farming: smallholder farming (mostly rice), smallholder cash cropping, and about 1,800 large foreign-owned or privately owned estates, the latter two producing export crops. Small-scale farming is usually carried out on modest plots—those in Java average about 0.8–1 ha (2–2.5 acres)—often without benefit of modern tools and methods, good seed, or fertilizer

particulars India Netherlands Indonesia
irrigated 622,860sq km 5650sq km 67,220sq km
Total area 3,287,590sq km 41,526sq km 1,919,440sq km
Arable land 157923.(1000ha) 1054.70 (1000ha) 2360 (1000ha)
Area under permanent crop
169623(1000ha) 42600(1000ha) 35.50(1000ha)
Area under forest 68289(1000ha) 95117.0(1000ha) 365(1000ha)
Area under pasture 103400(1000ha) 11000.0 827.20

Land area
0
500000
1000000
1500000
2000000
2500000
3000000
3500000irri
gate
d
tota
l a
rea
Ca
tegory
3
Ca
tegory
4
india
netherland
indonesia
0
20000
40000
60000
80000
100000
120000
140000
160000
180000
ara
ble
lan
d
Cate
gory
2
Cate
gory
3
Cate
gory
4
india
netherland
indonesia

india netherland indonesia
Date of independence
15th august 1947from England
23rd January 1579 17th august 1945
Border countries 1) Bangladesh2) Bhutan 3) Burma4) China5) Pakistan6) Nepal
1) Belgium 2) Germany
1) East Timor2) Papua3) New guinea4) Malaysia
Coast line 7000km 451km 54,716km
climate Temperate in north tropical in south
Temperate , marine Cool summer and mild winters
Tropical, hot , humid ,moderate in highland
Natural resources Coal, natural gas,Petroleum, iron ore ,manganese, mica, limestone, titanium, bauxite
Natural gasPetroleum Peat ,limestone and gravel., arable land
Natural gasPetroleum,,Timber,bauxite, gold ,silver, fertilesoil

TRANSPORTATION
india netherland indoensia
railways 63,221 km 2808 6,458 km
highways 3,383,344 km 391,009 km 134,000 km
waterways 14,500 km(Incl.
5,200 km on major
rivers & 485 km on
canals)
6,138km 21,579 km
pipelines Condensate- 9 km;
gas -7,488 km; LPG
-1,861 km; oil -7,883
km; refined products
-6,422 km
condensate 81 km; gas 7,229 km; oil 578 km; refined products 716 km (2006
condensate 963 km;
condensate/gas 81
km; gas 9,003 km;
oil 7,471 km;
oil/gas/water 77 km;
refined products
1,365 km
Ports and harbor 1.Chennai,2. Haldia, 3.Kandla,4. Kolkata, 5.Mumbai,6.Mangalore, 7.Vishakhapatnam
1.Banjarmasin,
2.Belawan,3.
Ciwandan,
4.Kotabaru, 5.Krueg
6.Geukueh,
7.Palembang,
1.Amsterdam, 2.Groningen, 3.IJmuiden, 4.Rotterdam, 5.Terneuzen, 6.Vlissingen,

CONT…
particulars india netherland indonesia
Merchant marines total: 493 ships, =
bulk carrier 104,
cargo 232, carrier
1, chemical tanker
19, container 12,
liquefied gas 19,
passenger 3,
passenger/cargo
11, petroleum
tanker 91. foreign-
owned: 12
total: 971 558
airports 352 27 494

BASE
India Netherlands Indonesia
agriculture 14.2% 1.6% 13.8%
Industry 31.7% 23.6% 46.7%
Animal husbandry 5.1% - -
fishery 1% - -
Others(services) 55.6% 74.9% 39.4%

india
netherland
indonesia
0
20
40
60
80
agriculture indudtryothers
india
netherland
indonesia

india netherland indonesia
Gdp purchasing power parity
$3.319 trillion $481.1 billion $827.4 billion
Gdp real growth rate
6.2% 1.2% ( 4.9% (2004 est.)
Gdp per capita purchasing powerparity
$3,100 $29,500 $3,500
Population below poverty line
`25%NA
27%
Household income or consumption by percentage basis
Lowest 10% 3.5% 2.8% 4%
Highest 10% 33.5% 25.1% 26.7%
Inflation rate 12% 1.4% 6.3%
labor force 516.4 million 7.53 million 109.9 million

Comparison
0
5000
10000
15000
20000
25000
30000
per capita purchasing power
india
netherland
indonesia

comparison
0
2
4
6
8
10
12
inflaton rate
india
netherland
indonesia
0
100
200
300
400
500
600
total labor force
india
netherland
Series 3
Inflation rate Total labor force

India Netherlands Indonesia
Labor force
agriculture 52% 4% 43%
industry 14% 23% 18%
others 34% 73% 39%
Unemployment rate 10.8% 6% 9.1%
Budget: revenue $185.4 billion $256.9 billion $79.56 billion
expenditures $269.8 billion $274.4 billion $84.87 billion

Labor force
india
agriculture
industry
others
netherland
agriculture
industry
others

indonesia
agriculture
industry
others
0
2
4
6
8
10
12
unemployement
india
netherland
indonesia

industriesparticulars India Netherlands Indonesia
industry 1. Textiles 2.
chemicals 3.
food processing
4. steel 5.
transportation
equipment
6.petroleum 7.
cement 8.mining
9.software
1.Agroindustries
2.metal and
engineering
products 3.
electrical
machinery and
products
4.chemicals 5.
petroleum 6.
construction
7.fishing
1.Petroleum and
natural gas,2.
textiles,3.
apparel,
4.footwear,5.
mining,6.
cement,
7.chemical
8.fertilizers,
9.plywood,10
rubber, 11.food,
12.tourism .
Industrial
production
growth rate
7.4%(2004) 0.8%(2004) 10.5%(2004)

india netherlands indonesia
Natural hazards droughts; flash
floods, as well
as widespread
and destructive
flooding from
monsoonal
rains; severe
thunderstorms;
earthquakes
flooding occasional
floods, severe
droughts,
tsunamis,earth
quakes,
volcanoes,
forest fire

Current issues
India Netherlands Indonesia
Current issue
related to
environment
Deforestation.
Soil erosion.
Desertification.
Air pollution from industrial effluents.
Water pollution from raw sewage and runoff of agri-cultural pesticides.
Huge and growing population is overstraining natural resources
deforestation; soil
erosion;
overgrazing;
desertification; air
pollution from
industrial effluents
and vehicle
emissions; water
pollution from raw
sewage and
runoff of
agricultural
pesticides; tap
water is not
potable
throughout the
country; huge and
growing
population is
deforestation;
water pollution
from industrial
wastes, sewage;
air pollution in
urban areas;
smoke and haze
from forest fires.

india netherland indonesia
Environmental international agreement
party to: Antarctic-Environmental Protocol, Antarctic-Marine Living Resources, Antarctic Treaty, Biodiversity, Climate Change, Climate Change-Kyoto Protocol, Desertification, Endangered Species, Environmental Modification, Hazardous Wastes, Law of the Sea, Ozone Layer Protection, Ship Pollution, Tropical Timber 83, Tropical Timber 94, Wetlands, Whalingsigned, but not ratified:none of the selected agreements
party to: Air Pollution, Air Pollution-Nitrogen Oxides, Air Pollution-Persistent Organic Pollutants, Air Pollution-Sulfur 85, Air Pollution-Sulfur 94, Air Pollution-Volatile Organic Compounds, Antarctic-Environmental Protocol, Antarctic-Marine Living Resources, Antarctic Treaty, Biodiversity, Climate Change, Climate Change-Kyoto Protocol, Desertification, Endangered Species, Environmental Modification, Hazardous Wastes, Kyoto Protocol, Law of the Sea, Marine Dumping, Marine Life Conservation, Ozone Layer Protection, Ship Pollution, Tropical Timber 83, Tropical Timber 94, Wetlands, Whaling
party to: Biodiversity, Climate Change, Climate Change-Kyoto Protocol, Desertification, Endangered Species, Hazardous Wastes, Law of the Sea, Ozone Layer Protection, Ship Pollution, Tropical Timber 83, Tropical Timber 94, Wetlands signed, but not ratified: Marine Life Conservation

india netherland indonesia
Geography note dominates South Asian subcontinent; near important Indian Ocean trade route
located at mouths of three major European rivers (Rhine, Maas or Meuse, and Schelde
archipelago of 17,508 islands (6,000 inhabited); straddles equator; strategic location astride or along major sea lanes from Indian Ocean to Pacific Ocea
Electricityproduction
547.2 billion kWh (2002)
90.61 billion kWh (2002)
110.2 billion kWh (2003)
Electricity consumption
510.1 billion kWh (2002)
100.7 billion kWh (2002)
92.35 billion kWh (2003)

Electricity
0
100
200
300
400
500
600
electricityproduction
electricityconsumption
india
netherland
indonesia

india netherland indonesia
Electricity production by sources: fossil fuels
81.7% 81.9% 86.9%
hydro 14.5% 0.1% 10.5%
nuclear 3.4% 4.3% 0
other 0.3% 5.7% 2.6%
Electricity export 350 million kWh (2002)
4.5 billion kWh (2002)
0 kWh (2002)
Electricity import 1.54 billion kWh (2002)
20.9 billion kWh (2002)
0 kWh (2002)

Comparison
india
fossil fuels
hydro
nuclear
other
netherland
fossil fuels
hydro
nuclear
other

COMPARISON
indonesia
fossilfuels
hydro
nuclear
other0
50
100
150
200
250
300
350
400
india
netherland
indonesia
india netherland indonesia
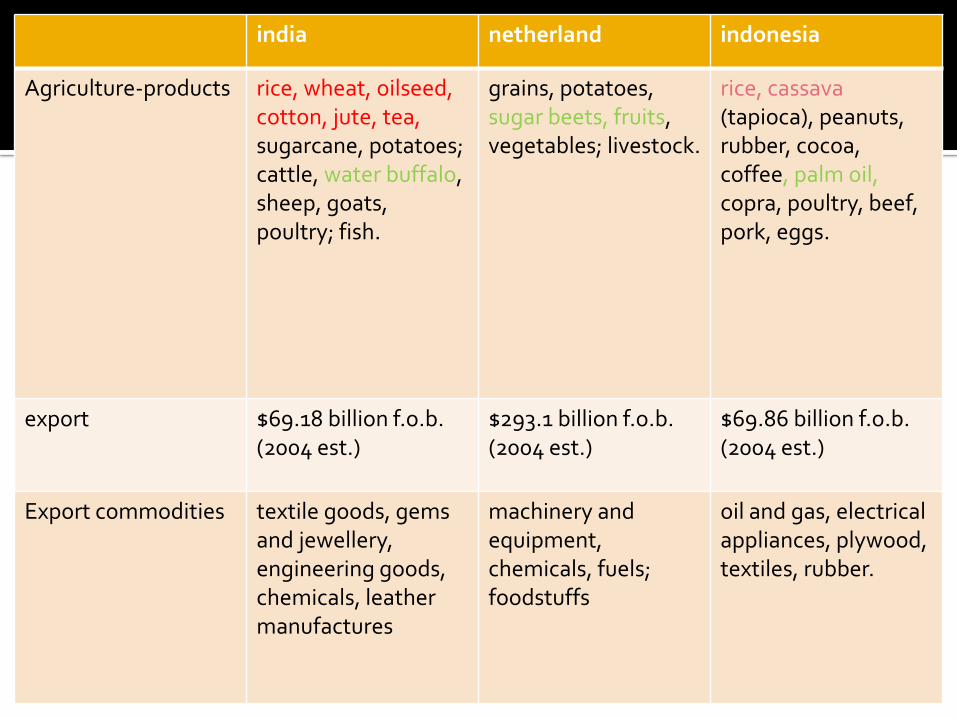
Agriculture-products rice, wheat, oilseed, cotton, jute, tea, sugarcane, potatoes; cattle, water buffalo, sheep, goats, poultry; fish.
grains, potatoes, sugar beets, fruits, vegetables; livestock.
rice, cassava (tapioca), peanuts, rubber, cocoa, coffee, palm oil, copra, poultry, beef, pork, eggs.
export $69.18 billion f.o.b. (2004 est.)
$293.1 billion f.o.b. (2004 est.)
$69.86 billion f.o.b. (2004 est.)
Export commodities textile goods, gems and jewellery, engineering goods, chemicals, leather manufactures
machinery and equipment, chemicals, fuels; foodstuffs
oil and gas, electrical appliances, plywood, textiles, rubber.

india netherland indonesia
Exports- partners US 17%, UAE 8.8%,
China 5.5%, Hong
Kong 4.7%, UK
4.5%, Singapore
4.5%
Germany 25%,
Belgium 12.4%, UK
10.1%, France
9.9%, Italy 6%, US
4.3%
Japan 22.3%, US
12.3%, Singapore
8.4%, South Korea
6.8%, China 6.4%,
Malaysia 4.2%
import $89.33 billion f.o.b. $252.7 billion f.o.b. $45.07 billion f.o.b. )
Import commodities crude oil, machinery,
gems, fertilizer,
chemicals
machinery and
transport equipment,
chemicals, fuels;
foodstuffs, clothing
machinery and
equipment,
chemicals, fuels,
foodstuffs
Import partners China 6.1%, US 6%,
Switzerland 5.2%,
Belgium 4.4%
Germany 17.9%,
Belgium 9.9%, US
7.9%, China 7.4%,
UK 6.4%, France
4.8%
Singapore 13.1%,
Japan 13.1%, China
8.8%, US 7%,
Thailand 6%,
Australia 4.8%,
Saudi Arabia 4.2%,
South Korea 4.2%

India netherland indonesia
Debt-external $117.2 billion (2004 est.)
$1.899 trillion (30 June 2006)
$141.5 billion (2004 est.)
Economics aid recepient
$2.9 billion (FY98/99) ODA, $4 billion (2003 est.)
$43 billion
currency Indian rupee (INR euro (EUR) Indonesian rupiah (IDR)
Exchange rates Indian rupees per US dollar - 45.317 (2004), 46.583 (2003), 48.61 (2002), 47.186 (2001), 44.942 (2000
euros per US dollar -0.8054 (2004), 0.886 (2003), 1.0626 (2002), 1.1175 (2001), 1.0854 (2000)
Indonesian rupiahs per US dollar - 8,938.9 (2004), 8,577.1 (2003), 9,311.2 (2002), 10,260.8 (2001), 8,421.8 (2000)
Fiscal year 1 April - 31 March calendar year calendar year; note - previously was 1 April - 31 March, but starting with 2001, has been changed to calendar year

india netherland indonesia
Total population 1,210,193,422 (1.21 billion)
16,407,491 (July 2005 est.)
241,973,879 (July 2005 est.)
Age structure 0-14 31.2% (male 173,634,432/female 163,932,475
18.1% (male 1,523,316/female 1,453,232
29.1% (male 35,823,456/female 34,590,631)
15-64 63.9% (male 356,932,082/female 333,283,590
67.8% (male 5,627,007/female 5,491,802)
65.7% (male 79,447,560/female 79,449,399)
65yrs n above 4.9% (male 26,542,025/female 25,939,784)
14.1% (male 974,037/female 1,338,097) (2005
5.2% (male 5,526,389/female 7,136,444) (2005
Population growth rate
1.4% (2005 est.) 0.53% (2005 est.) 1.45% (2005 est.)
Birth rate 22.32 births/1,000 population (2005 est.)
11.14 births/1,000 population (2005 est.)
20.71 births/1,000 population (2005 est.)
Death rate 8.28 deaths/1,000 population (2005 est
8.68 deaths/1,000 population (2005 est.)
6.25 deaths/1,000 population (2005 est.)
Net migration rate -0.07 migrant(s)/1,000 population (2005 est.)
2.8 migrant(s)/1,000 population (2005 est.)
0 migrant(s)/1,000 population (2005 est.)

india netherland indonesia
Sex ratio at birth 1.05 male(s)/female 1.05 male(s)/female 1.05 male(s)/female
Under 15 years 1.06 male(s)/female 1.05 male(s)/female 1 male(s)/female
15-64 years 1.07 male(s)/female 1.03 male(s)/female 1.04 male(s)/female
65 yrs n ovr 1.02 male(s)/female 0.73 male(s)/female 0.77 male(s)/female
Infant mortality 56.29 deaths/1,000 live births
5.04 deaths/1,000 live births
35.6 deaths/1,000 live births
Life expectancy at birth 64.35 years 78.81 years 69.57 years
male 63.57 years 76.25 years 67.13 years
female 65.16 years (2005 est.) 81.51 years (2005 est.) 72.13 years (2005 est.)
Total fertility rate 2.78 children born/woman (2005 est.)
1.66 children born/woman (2005 est.)
2.44 children born/woman (2005 est.)
Cereal yield kg/ha 2647.8 8307 4694.0

i
india netherland indonesia
nationality Indian(s Dutchman(men),
Dutchwoman(wo
men
Indonesian(s)
Ethnic group Indo-Aryan 72%,
Dravidian 25%,
Mongoloid and
other 3% (2000)
Dutch 83%, other
17% (of which 9%
are non-Western
origin mainly
Turks, Moroccans,
Antilleans,
Surinamese, and
Indonesians)
Javanese 45%,
Sundanese 14%,
Madurese 7.5%,
coastal Malays
7.5%, other 26%
religion Hindu 80.5%,
Muslim 13.4%,
Christian 2.3%,
Sikh 1.9%, other
1.8%, unspecified
0.1% (2001
census
Roman Catholic
31%, Dutch
Reformed 13%,
Calvinist 7%,
Muslim 5.5%,
other 2.5%, none
41% (2002)
Muslim 88%,
Protestant 5%,
Roman Catholic
3%, Hindu 2%,
Buddhist 1%,
other 1% (1998)
People living with
HIV/AIDS
5.1 million (2001
est.)
19,000 (2001 est) 110,000 (2003
est.)

india NETHERLAND INDONESIA
languages English, hindi,Bengali, Telugu, Marathi Tamil, Urdu, Gujarati, Malayalam, Kannada, Oriya, Punjabi, Assamese, Kashmiri, Sindhi, and Sanskrit;
Dutch (official), Frisian (official)
Bahasa Indonesia (official, modified form of Malay), English, Dutch, local dialects, the most widely spoken of which is Javanese
No. of radios 116 million (1997) 15.3 million (1996) 31.5 million (1997)
No. of television 63 million (1997) 8.1 million (1997) 13.75 million (1997)
literacy
Total population 65.38% 99% 87.9%
Male 75.96% 99% 92.5%
female 54.3% 99% 83.4%

INDIA NETHERLAND INDONESIA
Name of extension organization
Directorate of extension
Deinst landbonw voorlitiching agriculture extension system.
Bureau of agriculture extension
Year of establishment 1953 1898 1972
Legal status Governmental(ministry of agriculture, department of agriculture and cooperation)
governmentalchanging to non governmental from 1991
Governmental(ministry of agriculture)
Type of organization Governmental based regional programme utilizing T n V system
Ministry based agriculture extension
Ministry based
Clientele served Farmers, growing cereals ,pulses, oilseeds, subsistence farmer, small and commercial farmer and adult farmer
Large and small commercial farmers, young and women farmers.
Subsistence farmers , women farmers landless farmers, young farmers, farmers growing rice and food crops.


Extension agent in India
Extension
agent in
group
meeting

Extension agent in nether land
Here the extension agent is showing a new product to the people

Extension agent of Indonesia
Extension agent in Indonesia working with information technology

Human resources in indiaType of personnel Male female total
Extension specialist
Technical subject matter 1679 12 1691
Agriculture information 2490 2 2492
training
Field extension officers
agriculture 151 1 152
Home economics 221 3 234
Rural development
others 48545 267 48821
Total no of technical staff 11064 53 11117
No. of other supporting staff 65600 357 65957

Netherlands human resources
The Netherlands extension system employs
900 members in 25 different departments.

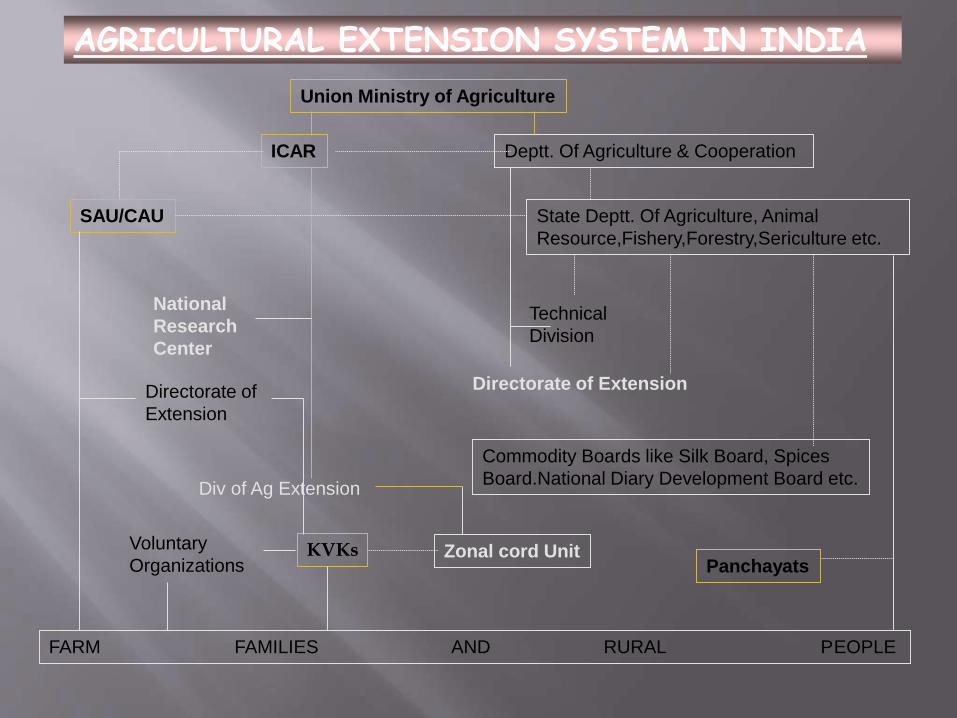
AGRICULTURAL EXTENSION SYSTEM IN INDIA
Union Ministry of Agriculture
ICAR Deptt. Of Agriculture & Cooperation
SAU/CAU State Deptt. Of Agriculture, Animal
Resource,Fishery,Forestry,Sericulture etc.
Commodity Boards like Silk Board, Spices
Board.National Diary Development Board etc.
Panchayats
Voluntary
OrganizationsKVKs
FARM FAMILIES AND RURAL PEOPLE
Directorate of Extension
Div of Ag Extension
Zonal cord Unit
Directorate of
Extension
National
Research
Center
Technical
Division

Extension System of Indonesia

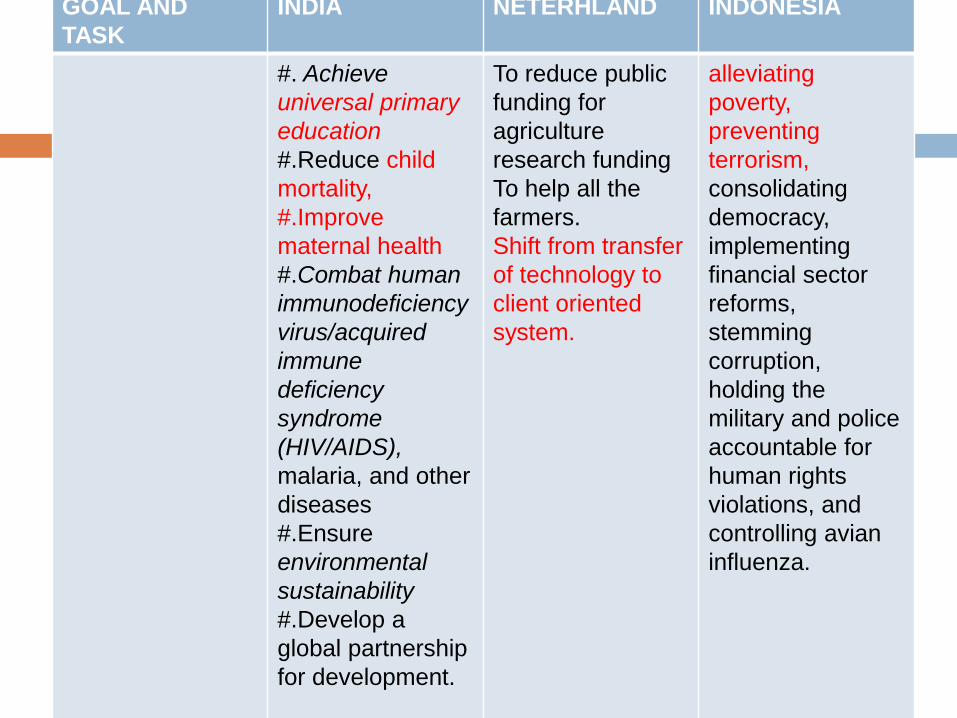
GOAL AND
TASK
INDIA NETERHLAND INDONESIA
#. Achieve
universal primary
education
#.Reduce child
mortality,
#.Improve
maternal health
#.Combat human
immunodeficiency
virus/acquired
immune
deficiency
syndrome
(HIV/AIDS),
malaria, and other
diseases
#.Ensure
environmental
sustainability
#.Develop a
global partnership
for development.
To reduce public
funding for
agriculture
research funding
To help all the
farmers.
Shift from transfer
of technology to
client oriented
system.
alleviating
poverty,
preventing
terrorism,
consolidating
democracy,
implementing
financial sector
reforms,
stemming
corruption,
holding the
military and police
accountable for
human rights
violations, and
controlling avian
influenza.

Comparison in extension
systemindia Netherland indonesia
Human resources VLW,AEO, SDEO,
DEO.
DLV , lTO VLW,AEO, SDEO,
DEO , AEC
Financial
resources
World bank, govt
of India
Subsidies from
Dutch govt.
World bank, govt
of Indonesia
Level of client
participation in
planning.
No participation,
sometimes clients
are asked for
advice.
Full participation No participation
models ATMA, TnV
SYSTEM, ICAR .
…….. AIAT
(Assessment
institute for
agriculture
technology.

Yes,
The farmer should be actively involved during the planning of any new programme so in this way people will consider these programmes as their own programmes.
People should be made aware about the different governmental schemes. They should be told about the benefits of kisan call centresand uses of other information technology
Extension system should be made more strong by making the input available to the extension agents and proper training should be given to these agents
Good and hard working extension agent should be rewarded.
due importance should be given to Knowledge of the farmers