Embed Size (px)
Citation preview
16 th sep 2013
Torbjörn Hortlund Center for Educational Management, Uppsala university

¡ Approaching the role of principals as key persons in connecting the process of generating and using data to the organizational learning activieties in school.
¡ A focus on collecting, analysing, making sense of data use to plan action.
¡ The specific school leader capacities for building a culture of data use and using data to improve instructional practice, school improvement and professional accountability.
Information that is collected and organized to represent some aspect of schools. Information such as -‐ How students perform on a test -‐ Observations of classroom teaching -‐ Surveys
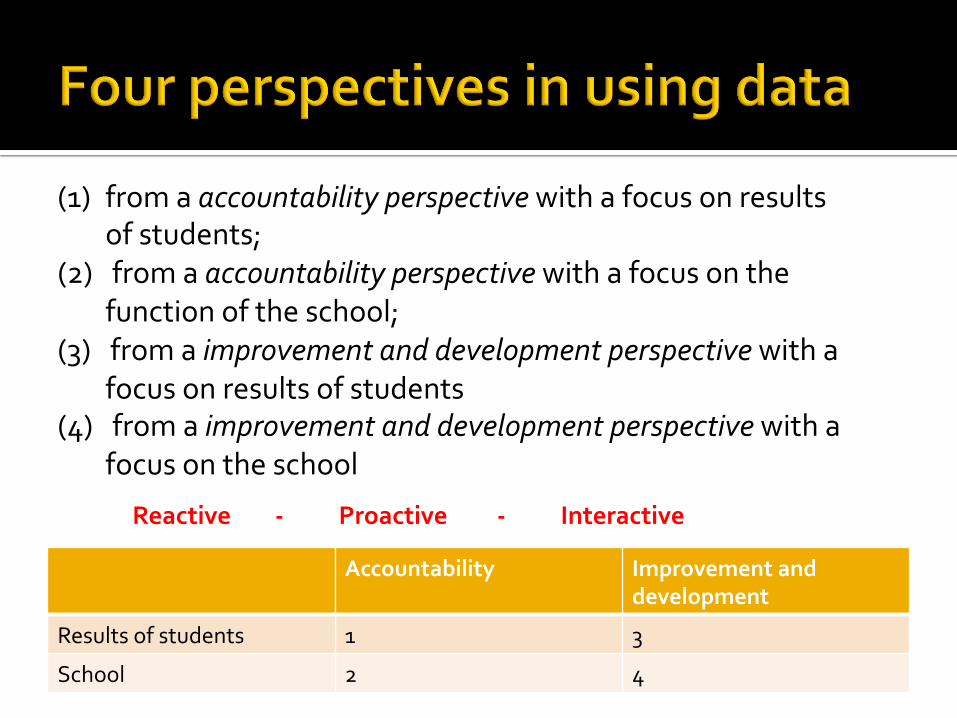
Accountability Improvement and development
Results of students 1 3
School 2 4
(1) from a accountability perspective with a focus on results of students;
(2) from a accountability perspective with a focus on the function of the school;
(3) from a improvement and development perspective with a focus on results of students
(4) from a improvement and development perspective with a focus on the school
Reactive -‐ Proactive -‐ Interactive
The growing request for schools´ accountability implies also that schools, increasingly, are expected to inform their external environment about many aspects of their operation, especially about the results of learners. Schools – accountable for the results of students – must deliver data about these results.
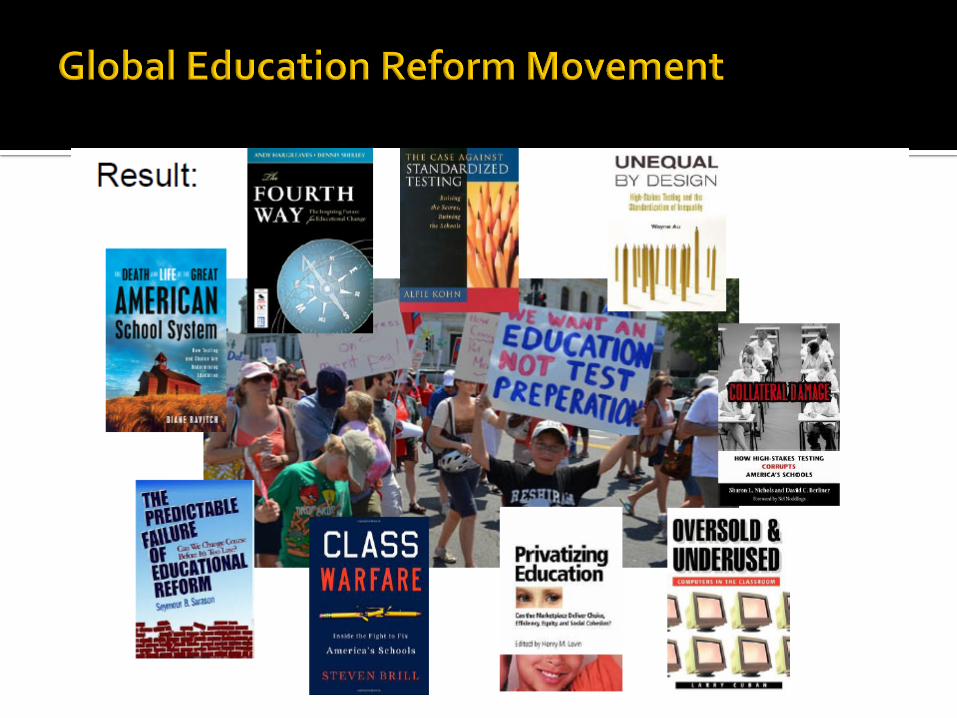
¡ In many countries one can see a movement towards result-‐orientation and accountability.
¡ New Public Management -‐ Counterproductive -‐ Competition -‐ Profit • Accountability • Audit society • Trust to standards • Trust in numbers
This movement, emphasizing results and accountability is subject to scientific critics such as: § narrowing the curriculum § de-‐professionalization § teaching to the test

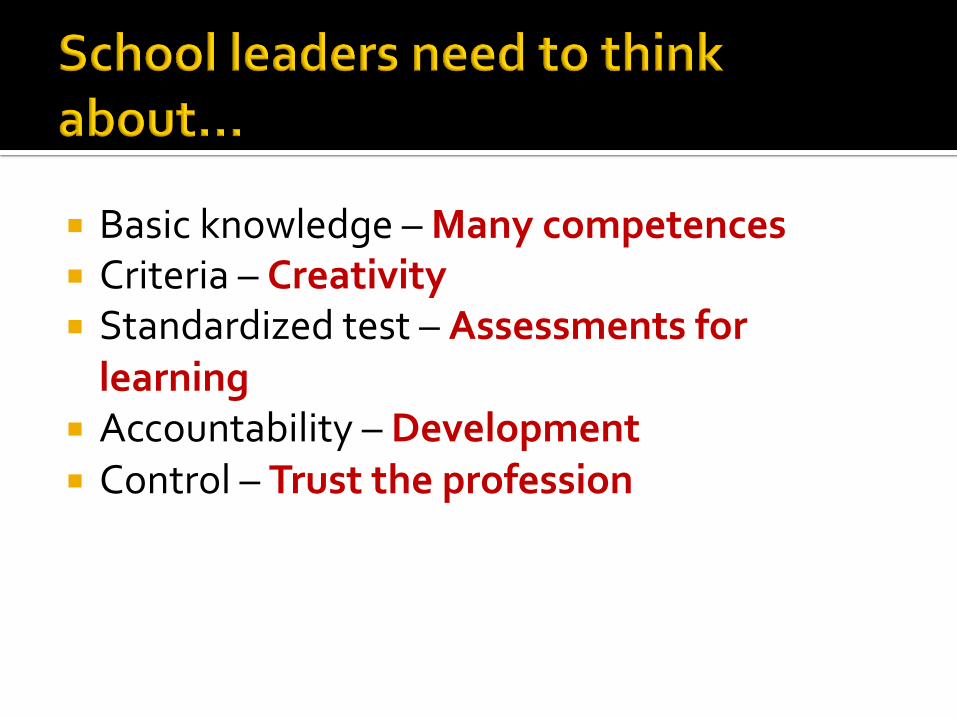
¡ Basic knowledge – Many competences ¡ Criteria – Creativity ¡ Standardized test – Assessments for learning
¡ Accountability – Development ¡ Control – Trust the profession
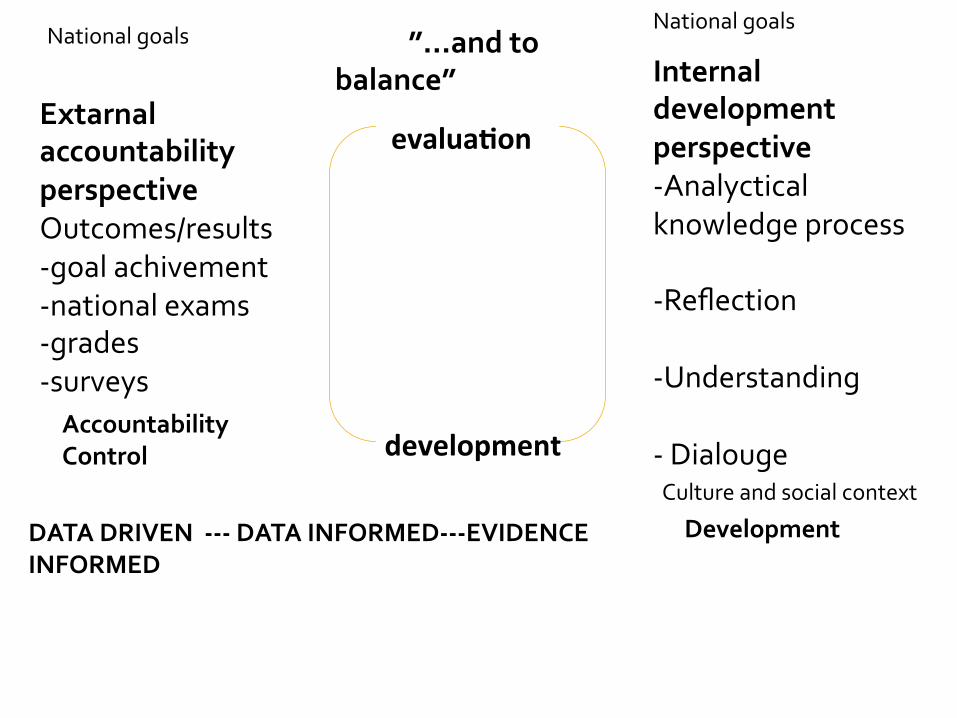
evalua&on
development
Extarnal accountability perspective Outcomes/results -‐goal achivement -‐national exams -‐grades -‐surveys
Internal development perspective -‐Analyctical knowledge process -‐Reflection -‐Understanding -‐ Dialouge
Accountability Control
Development
Culture and social context
National goals National goals
DATA DRIVEN -‐-‐-‐ DATA INFORMED-‐-‐-‐EVIDENCE INFORMED
”…and to balance”
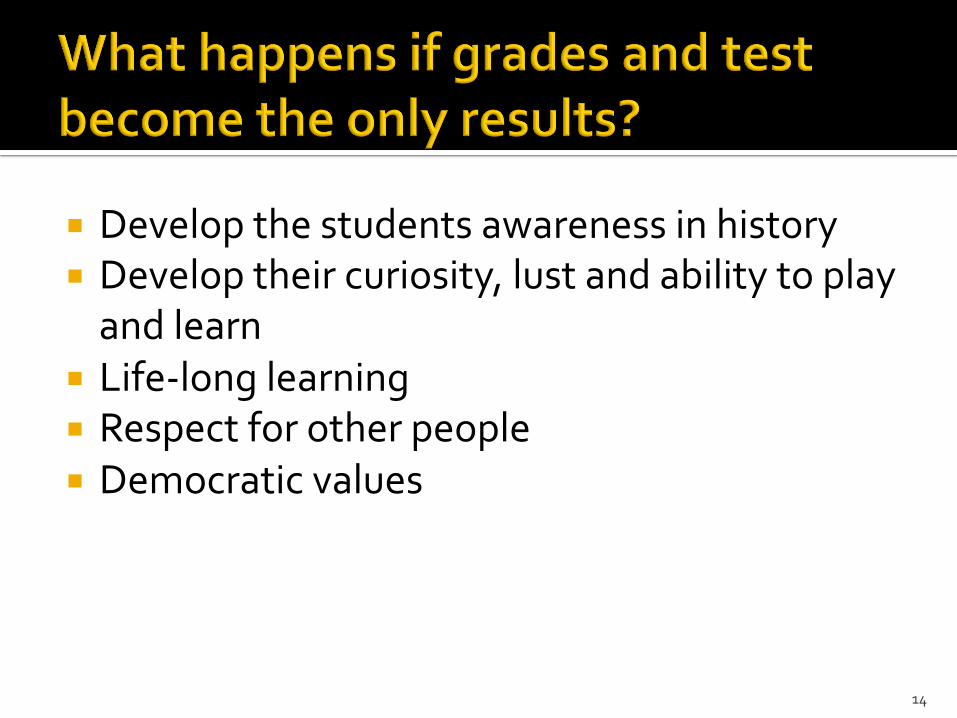
¡ Develop the students awareness in history ¡ Develop their curiosity, lust and ability to play and learn
¡ Life-‐long learning ¡ Respect for other people ¡ Democratic values
14

¡ What do I know about my school? ¡ How do I know that?
“Not everything that counts can be counted. And not everything that can be counted, counts.” -‐ Albert Einstein
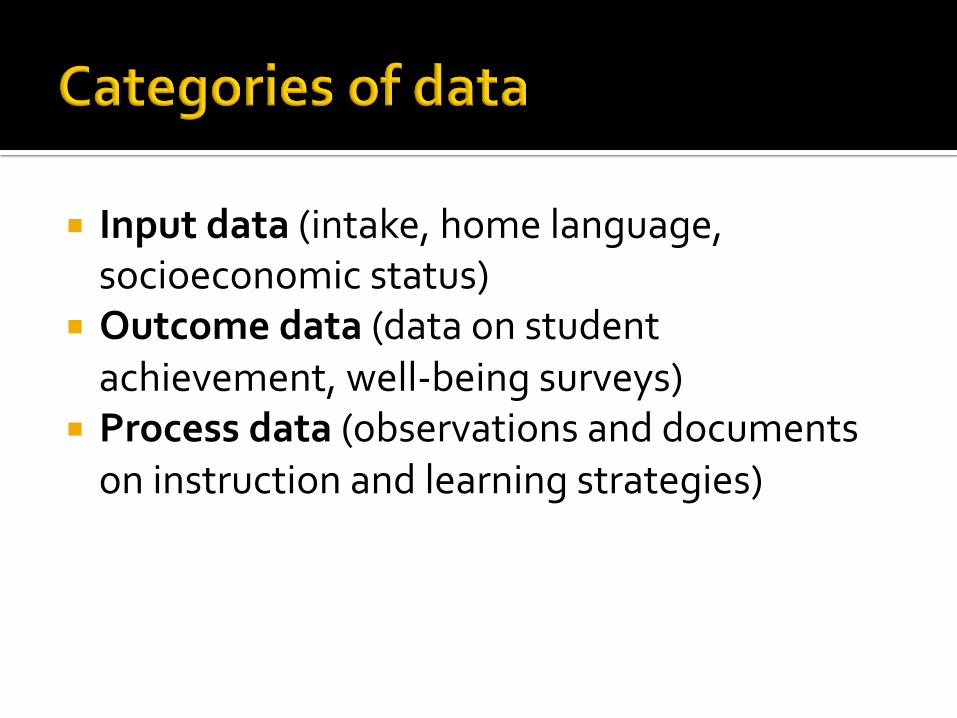
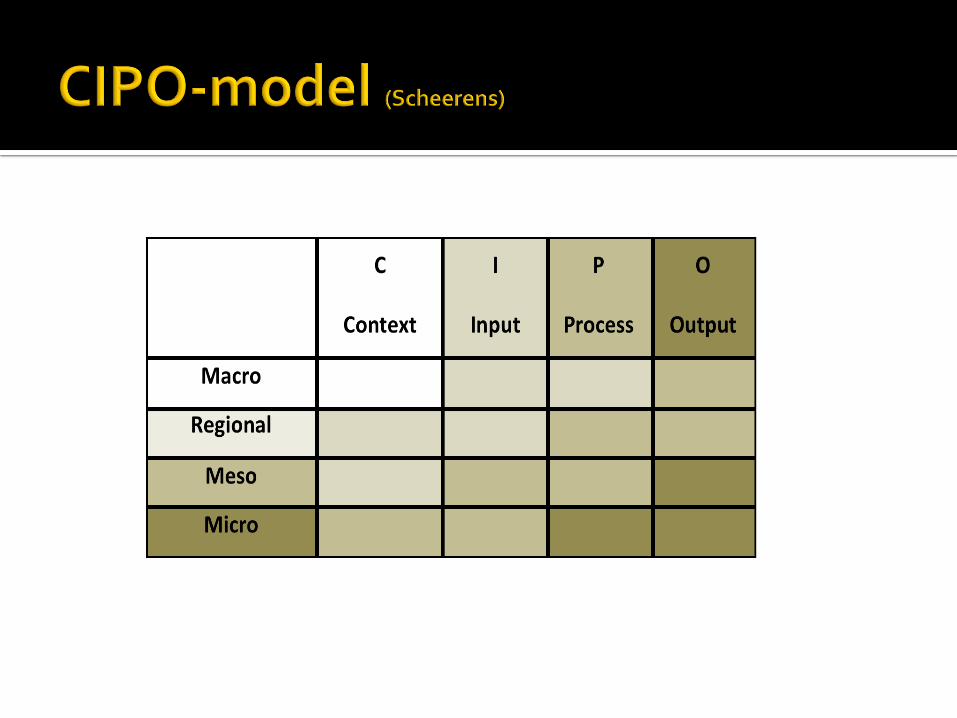
¡ Input data (intake, home language, socioeconomic status)
¡ Outcome data (data on student achievement, well-‐being surveys)
¡ Process data (observations and documents on instruction and learning strategies)
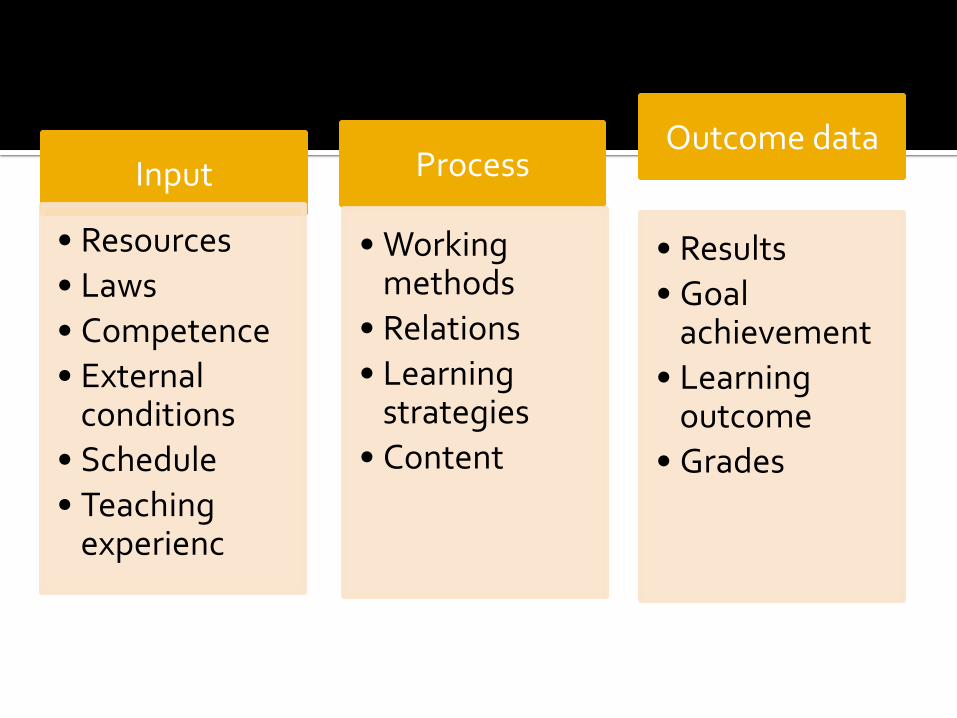
Input
• Resources • Laws • Competence • External conditions
• Schedule • Teaching experienc
Process
• Working methods
• Relations • Learning strategies
• Content
Outcome data
• Results • Goal achievement
• Learning outcome
• Grades
The pedagogical evaluation chain
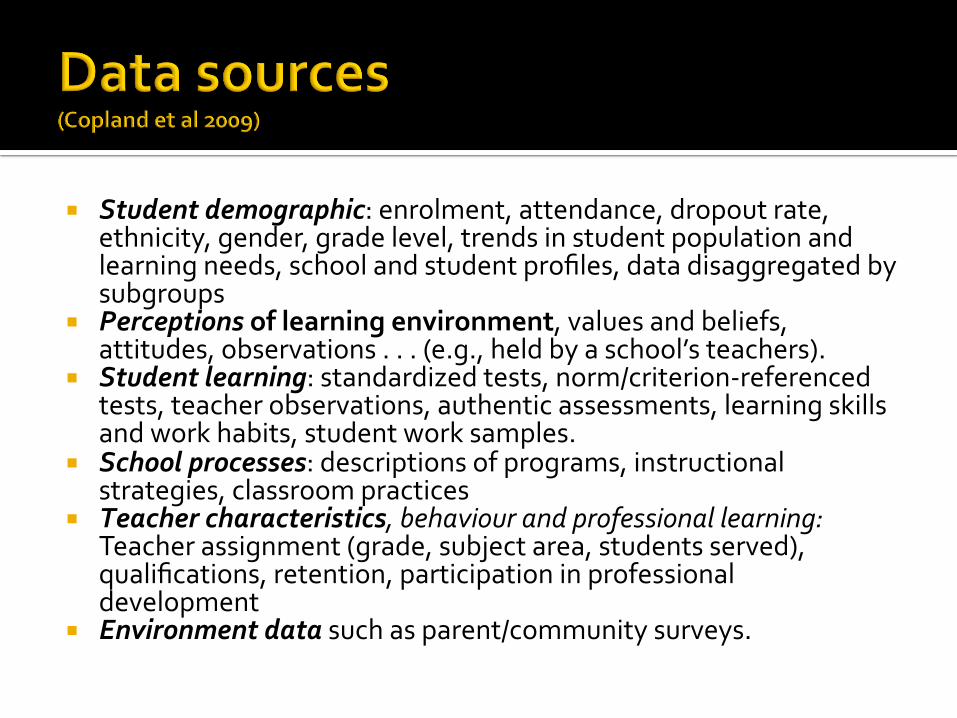
¡ Student demographic: enrolment, attendance, dropout rate, ethnicity, gender, grade level, trends in student population and learning needs, school and student profiles, data disaggregated by subgroups
¡ Perceptions of learning environment, values and beliefs, attitudes, observations . . . (e.g., held by a school’s teachers).
¡ Student learning: standardized tests, norm/criterion-‐referenced tests, teacher observations, authentic assessments, learning skills and work habits, student work samples.
¡ School processes: descriptions of programs, instructional strategies, classroom practices
¡ Teacher characteristics, behaviour and professional learning: Teacher assignment (grade, subject area, students served), qualifications, retention, participation in professional development
¡ Environment data such as parent/community surveys.
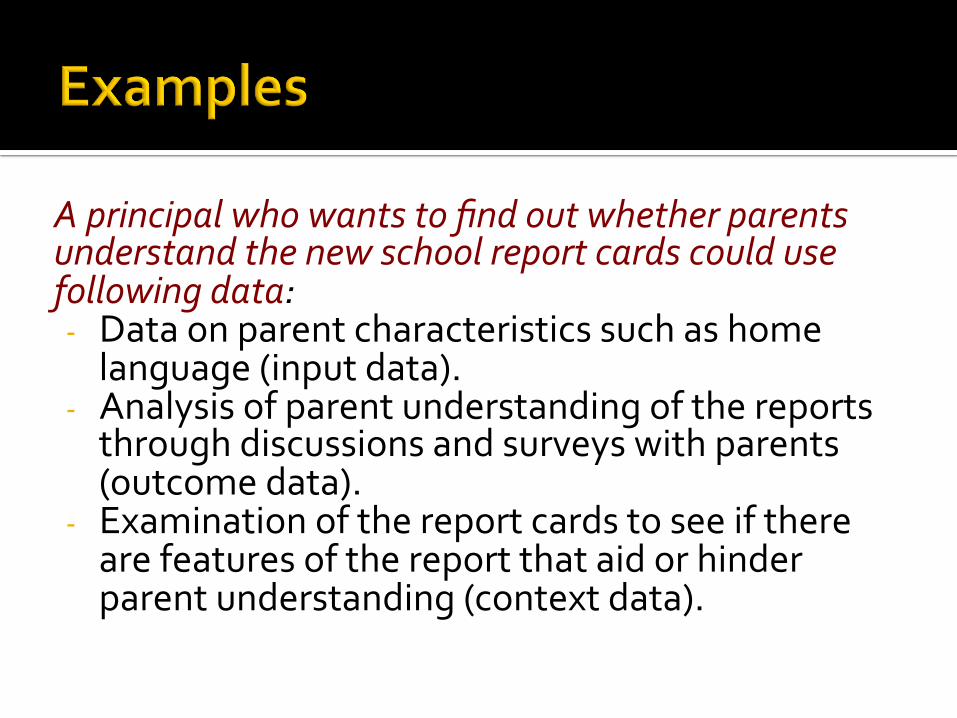
A principal who wants to find out whether parents understand the new school report cards could use following data: -‐ Data on parent characteristics such as home language (input data).
-‐ Analysis of parent understanding of the reports through discussions and surveys with parents (outcome data).
-‐ Examination of the report cards to see if there are features of the report that aid or hinder parent understanding (context data).
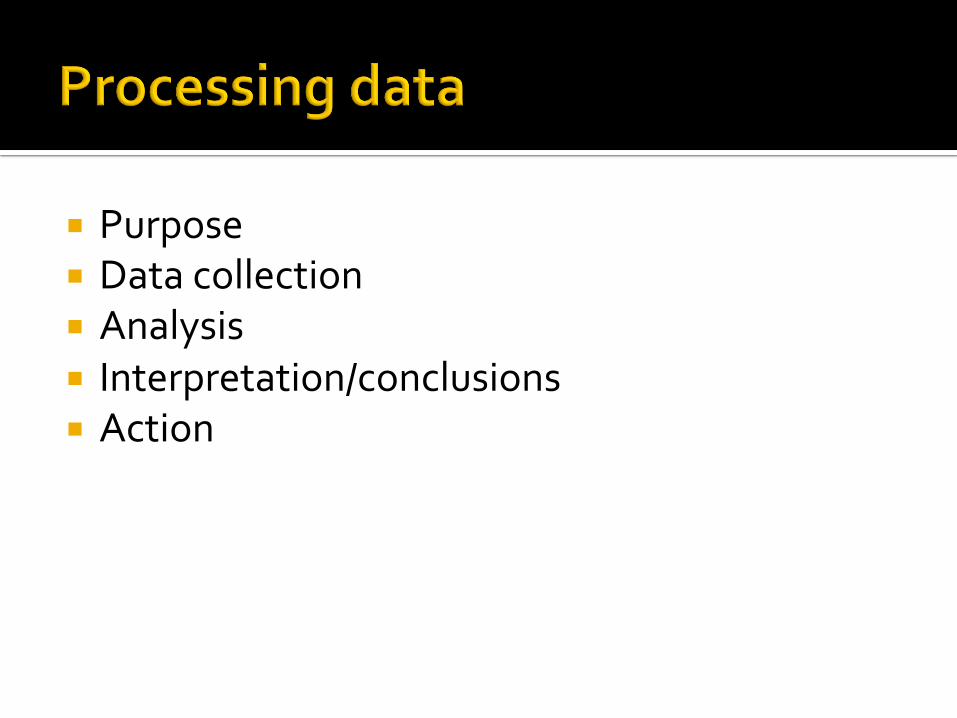
¡ Purpose ¡ Data collection ¡ Analysis ¡ Interpretation/conclusions ¡ Action
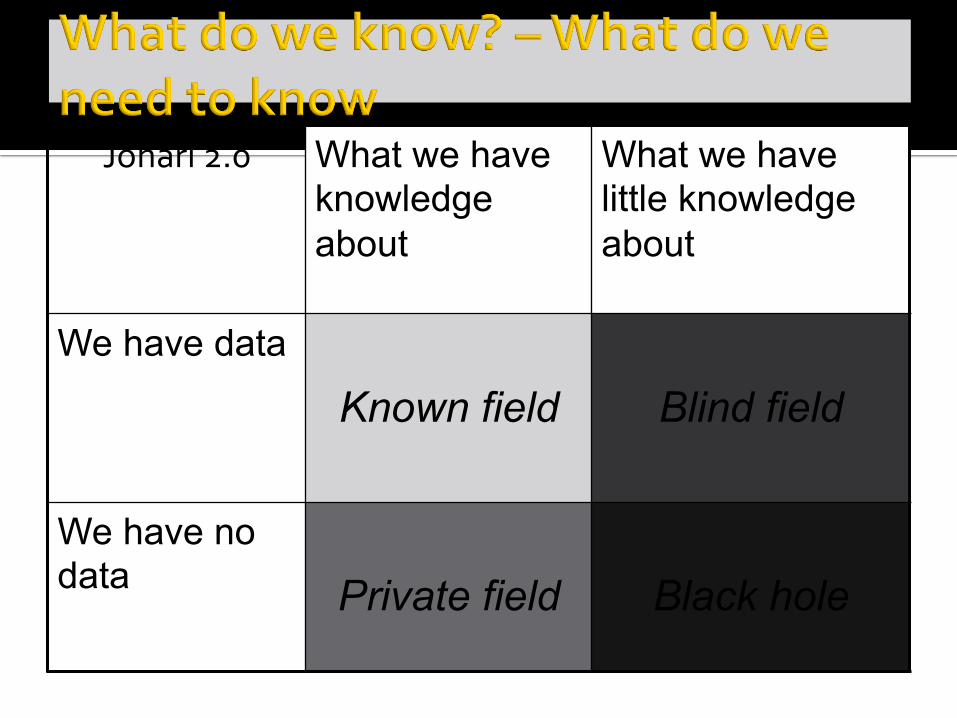
Johari 2.0 What we have knowledge about
What we have little knowledge about
We have data Known field
Blind field
We have no data
Private field
Black hole

¡ Data can be used as a tool for improvement ¡ Sceptism about data or a tool for improvement?
¡ Data is nothing ”out there”. Data can be an important part in ongoing process in analysis, insights, learning and improvements of the practice.
¡ How do I create a culture of responsibility outside the teacher´s classroom?
¡ How do I create good conditions for teachers´ learning?
¡ How do we create curiosity about what´s happening in the colleagues classrooms?
¡ How do we create a culture where teacher trust each other and encourage reflection on own practice by using data?

Categorie Definition EExamples
Teaching and learning What educatots do in their classrooms in instruction and assessment.
What teaching and assessment strategies are we using? How might we change out teaching and assessment practices to achieve the desired results?
Parent Opinion How parents feel about and interact with school.
How well are we connecting with the parent community?
School culture The assumptions, beliefs, and relationships that define the organisation´s view of itself and its environment.
What does the staff of this school believe about student learning? What is the nature of the professional relationships?
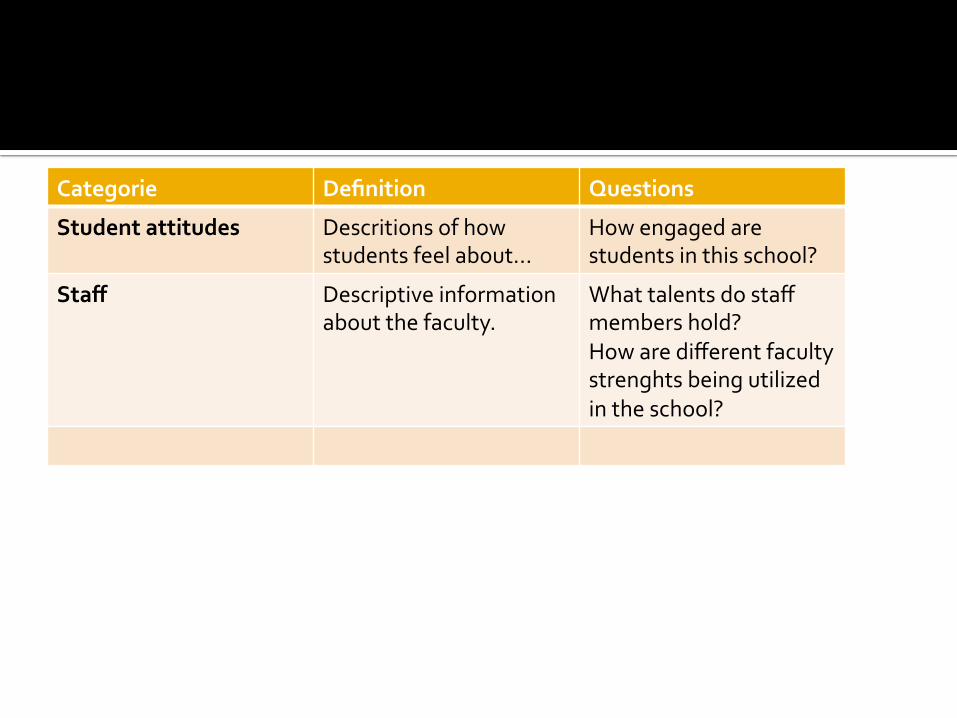
Categorie Definition Questions
Student attitudes Descritions of how students feel about…
How engaged are students in this school?
Staff Descriptive information about the faculty.
What talents do staff members hold? How are different faculty strenghts being utilized in the school?
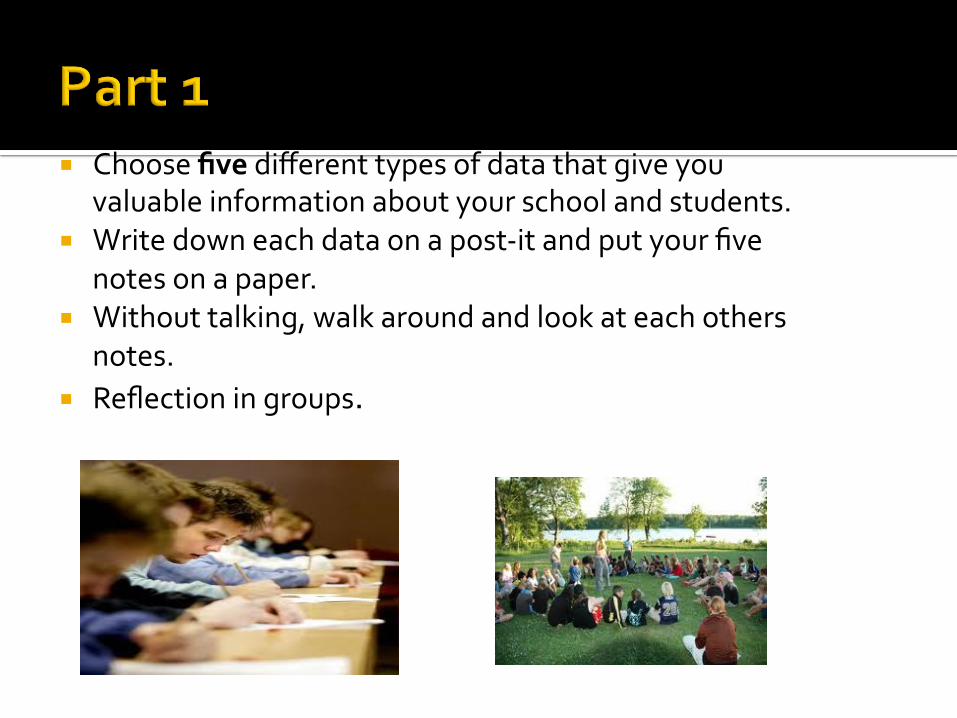
¡ Choose five different types of data that give you valuable information about your school and students.
¡ Write down each data on a post-‐it and put your five notes on a paper.
¡ Without talking, walk around and look at each others notes.
¡ Reflection in groups.
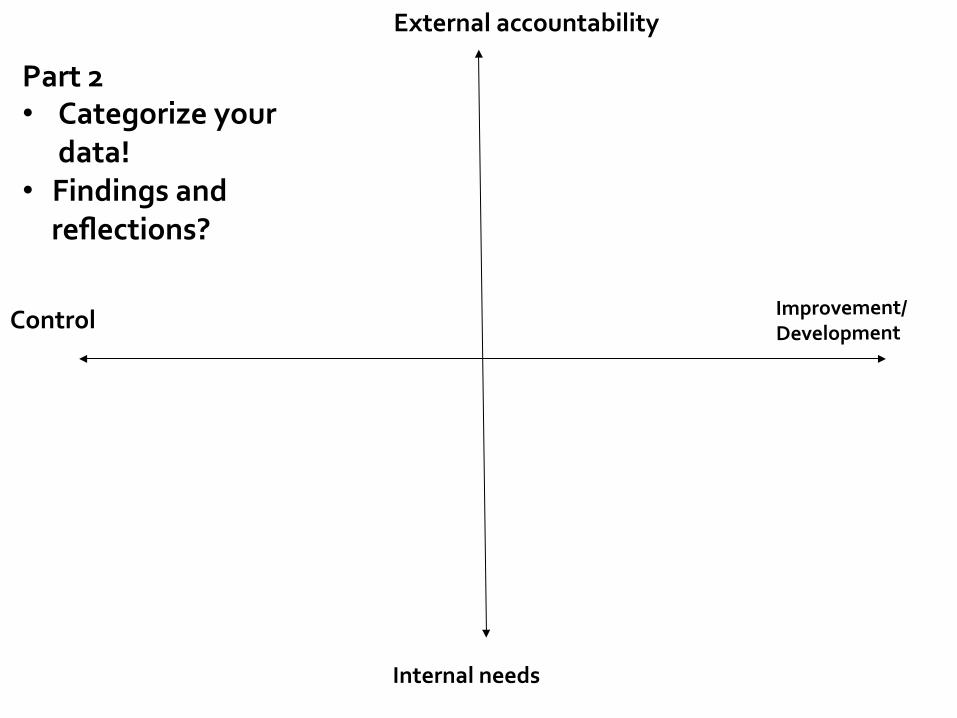
Control
Internal needs
External accountability
Improvement/Development
Part 2 • Categorize your
data! • Findings and reflections?

¡ What do you see? ¡ What do you not see? What do you want to know more about?
¡ What do think/feel? Speculate!
Individually and then in small groups
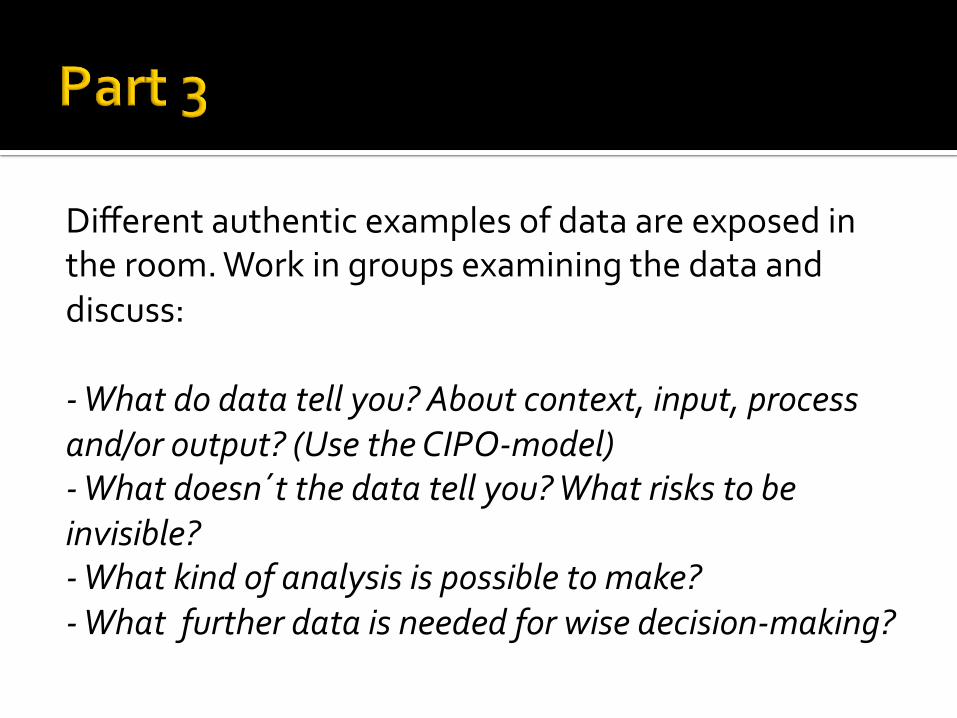
Different authentic examples of data are exposed in the room. Work in groups examining the data and discuss: -‐ What do data tell you? About context, input, process and/or output? (Use the CIPO-‐model) -‐ What doesn´t the data tell you? What risks to be invisible? -‐ What kind of analysis is possible to make? -‐ What further data is needed for wise decision-‐making?
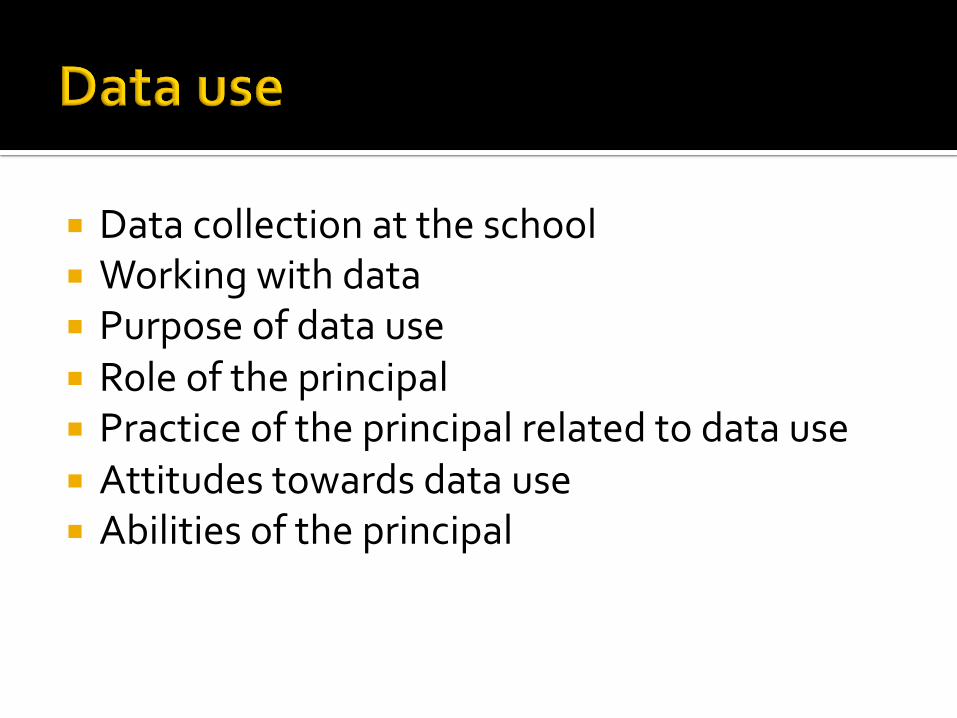
¡ Data collection at the school ¡ Working with data ¡ Purpose of data use ¡ Role of the principal ¡ Practice of the principal related to data use ¡ Attitudes towards data use ¡ Abilities of the principal
¡ setting directions: (building a shared vision; fostering the acceptance of group goals; high performance expectations);
¡ developing people: (providing individualized support/consideration; intellectual stimulation; providing an appropriate model);
¡ redesigning the organization: (building collaborative cultures; restructuring; building productive relationships with families and communities; connecting the school to its’ wider environment);
¡ managing the instructional (teaching and learning) program: (staffing the program; providing instructional (teaching and learning) support; monitoring school activity; buffering staff from distractions to their work).
¡ Practice -‐ Katharina and Anette -‐ Mia and Karin
¡ Theory – theoretical framework
¡ Learning communities ¡ Learning and improvement by using data
¡ Calman (2010) found that school effectiveness is strongly associated with the effective use of data at both the classroom and school levels. At the classroom level, in effective schools, teachers monitor student progress on a regular and on-‐going basis in order to provide both differentiated learning experiences and appropriate support to meet the needs of students. Assessing and tracking of progress are undertaken with rigour, and data are analysed with considerable care to identify students or groups of students who need specific help.
At the school level, effective leaders ensure that both outcome and process data are made available for use by school staff and that assessment data are integral to monitoring the attainment of school goals. When data are being used effectively, decisions about the focus of instructional programs and practices, professional learning needs, resource requirements, intensity of support for students’ needs and placement of support staff are grounded in data analysis.
SER – skills in using, handling and understanding data (Calman, 2010 & Robinson, 2006) -‐ Involving data in the ongoing process to improve the instruction.
-‐ Teaching students to examine their own data. -‐ Formulating a vision for using data. -‐ Create a structure for a data-‐informed culture.
Hamilton et al (2009)
It means not an exclusive appeal on scientific evidence in the process of educational decision-‐making, but the integration of evidence with the judgement and expertise of the practitioner. It means also an emphasis on professional conversations: the collectively identifying of the relevance and meaning of the evidence through cyclical processes of questioning, interpretation and review by the professionals, involved in the practice of making education better. Dixon ( 1999 ), Nonaka & Tackeuchi (1996), Crossan, Lane & White (1999) Hord (1997) and Verbiest (2004, 2012).
¡ Develop an inquiry habit of mind. ¡ Become data literate. ¡ Create a culture of inquiry.
¡ Values deep understanding ¡ Reserves judgement and has a tolerance for ambiguity
¡ Takes a range of perspectives and systematically poses increasingly focused questions

¡ Why is this issue an important area to pay attention to?
¡ What is prompting this decision? ¡ Who will be influenced by it? ¡ Who needs to be involved? ¡ What is our role in this decision? ¡ Where are we now? ¡ What do we think we know? ¡ Where do we want to go?
¡ Thinks about purpose(s) ¡ Recognizes sound and unsound data ¡ Is knowledgeable about statistical and measurement concepts
¡ Recognizes other kinds of data ¡ Makes interpretation paramount ¡ Pays attention to reporting
¡ What are we trying to understand better? ¡ What is the focus of this picture? ¡ What do we need to know to capture the complexity?
¡ What data do we need?
¡ How do we make sense of these data? ¡ What help do we need to analyze and interpret the data?
¡ How much confidence do we have in these data?
¡ What are the limitations of the data? ¡ What can we learn from the data? ¡ What other data do we need?
¡ Involves others in interpreting and engaging with the data
¡ Stimulates an internal sense of ”urgency” ¡ Makes time ¡ Uses ”critical friends”
¡ How will we engage the audience? ¡ How will we share what we have learned? ¡ How do we keep the appeal to data as a routine part of our planning and improvement process?
¡ Leadership that focuses attention and effort on improving student learning
¡ Leadership that guide the learning of individual professionals
¡ Leadership that guides what has been called ”system learning”
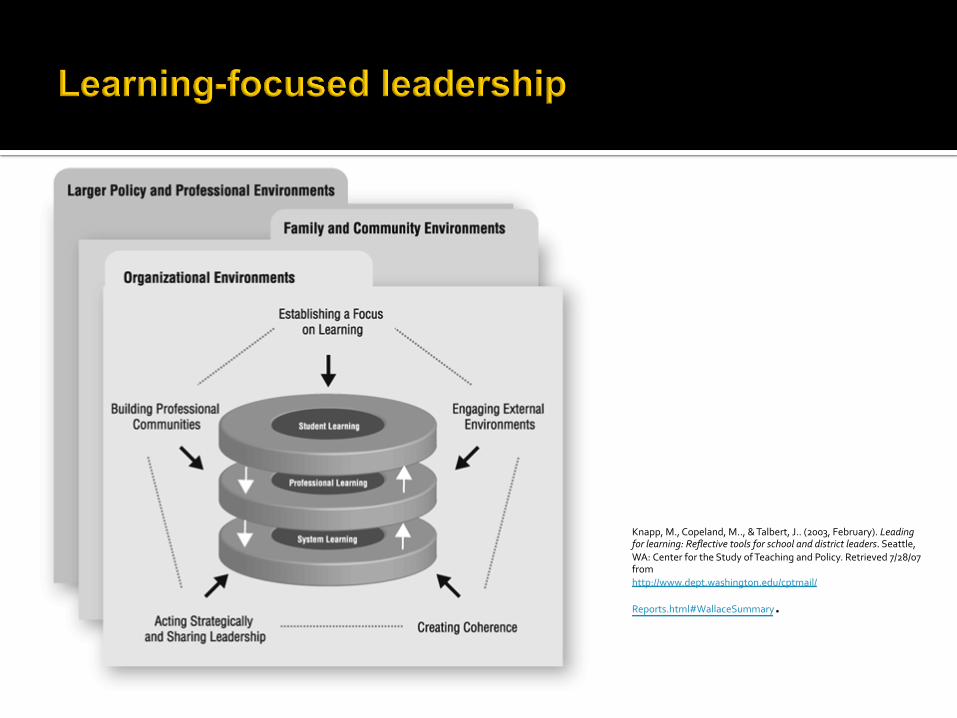
Knapp, M., Copeland, M.., & Talbert, J.. (2003, February). Leading for learning: Reflective tools for school and district leaders. Seattle, WA: Center for the Study of Teaching and Policy. Retrieved 7/28/07 from http://www.dept.washington.edu/cptmail/
Reports.html#WallaceSummary.
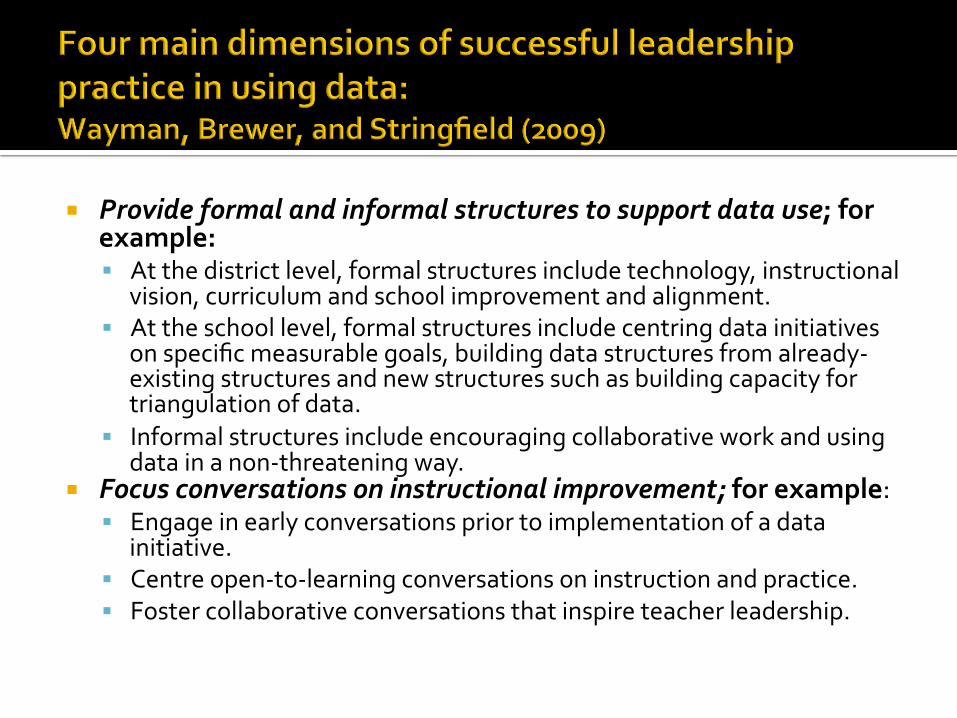
¡ Provide formal and informal structures to support data use; for example: § At the district level, formal structures include technology, instructional
vision, curriculum and school improvement and alignment. § At the school level, formal structures include centring data initiatives
on specific measurable goals, building data structures from already-‐existing structures and new structures such as building capacity for triangulation of data.
§ Informal structures include encouraging collaborative work and using data in a non-‐threatening way.
¡ Focus conversations on instructional improvement; for example: § Engage in early conversations prior to implementation of a data
initiative. § Centre open-‐to-‐learning conversations on instruction and practice. § Foster collaborative conversations that inspire teacher leadership.
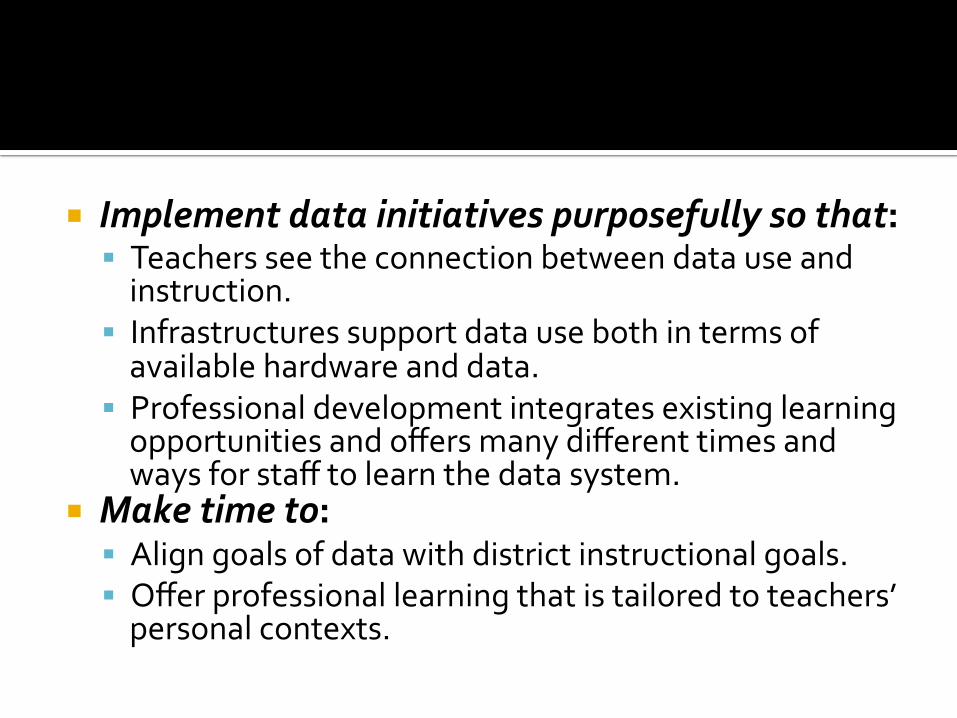
¡ Implement data initiatives purposefully so that: § Teachers see the connection between data use and instruction.
§ Infrastructures support data use both in terms of available hardware and data.
§ Professional development integrates existing learning opportunities and offers many different times and ways for staff to learn the data system.
¡ Make time to: § Align goals of data with district instructional goals. § Offer professional learning that is tailored to teachers’ personal contexts.
How do I create a culture of inquiry? Actions to support a culture of inquiry Each group talk about what you want to know more about – talk about concepts, perspectives and context. Formulate two questions you want to know more about by getting input from other groups in the room. Select two persons who will leave the group as knowledge hunters.

The knowledge hunters leave the group and bring one of the two questions. The rest of the group are experts and will share their knowledge to new knowledge hunters.
The knowledge hunters go back to their original group.
The original groups are sharing new knowledge and experiences. Make a summary on a poster: Write down your question and a short summary (concepts, signs, pictures).
Repeat step 2-‐4 with the second question.


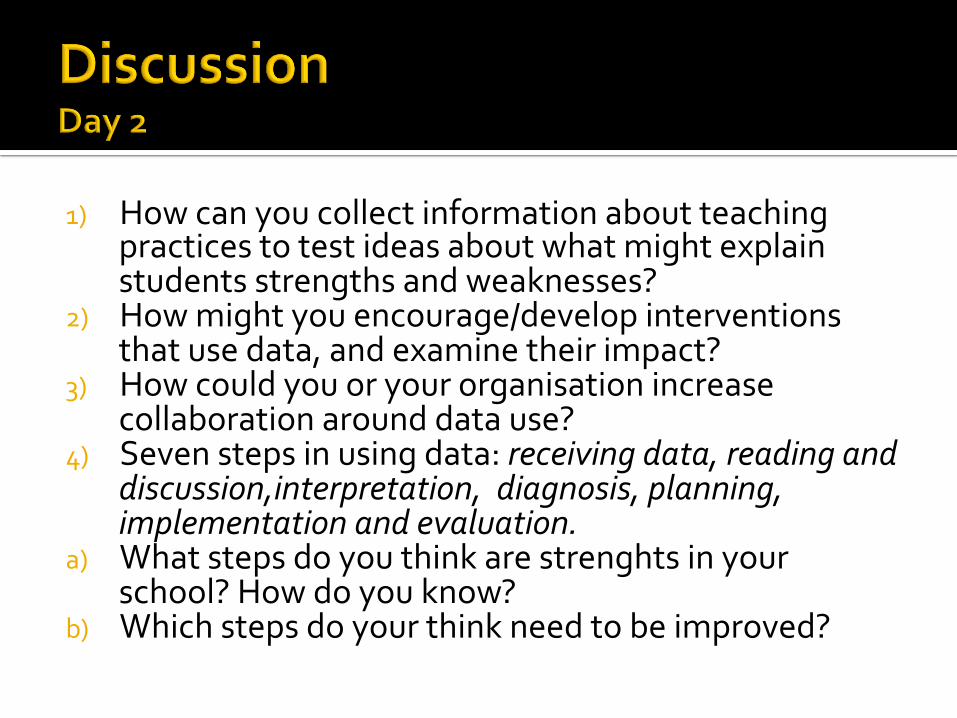
1) How can you collect information about teaching practices to test ideas about what might explain students strengths and weaknesses?
2) How might you encourage/develop interventions that use data, and examine their impact?
3) How could you or your organisation increase collaboration around data use?
4) Seven steps in using data: receiving data, reading and discussion,interpretation, diagnosis, planning, implementation and evaluation.
a) What steps do you think are strenghts in your school? How do you know?
b) Which steps do your think need to be improved?
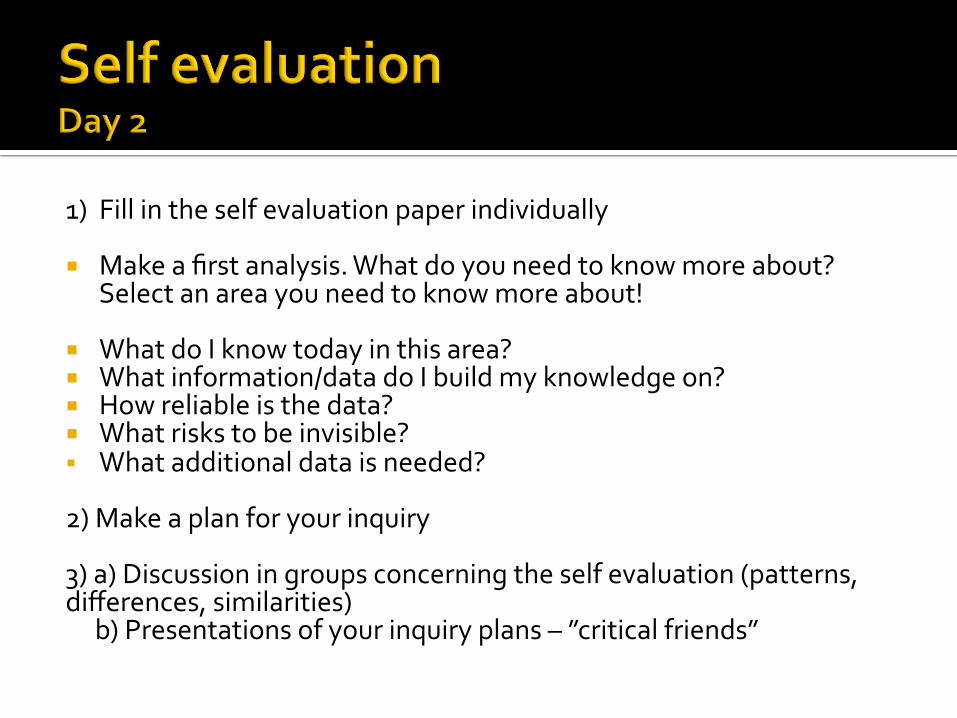
1) Fill in the self evaluation paper individually
¡ Make a first analysis. What do you need to know more about? Select an area you need to know more about!
¡ What do I know today in this area? ¡ What information/data do I build my knowledge on? ¡ How reliable is the data? ¡ What risks to be invisible? § What additional data is needed? 2) Make a plan for your inquiry 3) a) Discussion in groups concerning the self evaluation (patterns, differences, similarities) b) Presentations of your inquiry plans – ”critical friends”
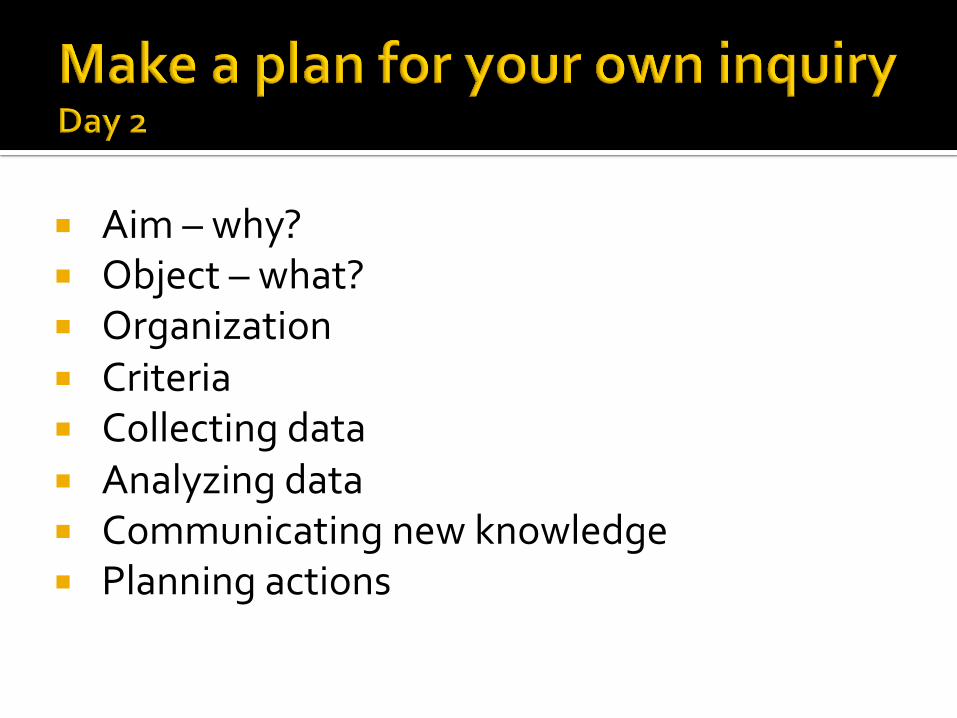
¡ Aim – why? ¡ Object – what? ¡ Organization ¡ Criteria ¡ Collecting data ¡ Analyzing data ¡ Communicating new knowledge ¡ Planning actions