Embed Size (px)
Citation preview
Daisy CastroExcel Lesson 8 & Student Survey
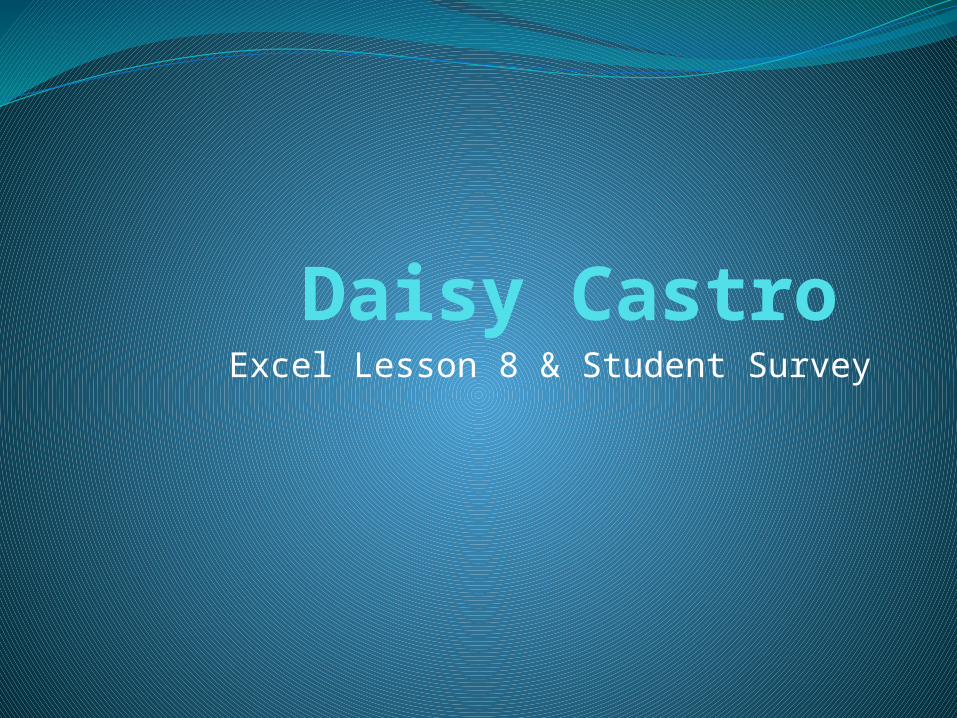
My Sports Survey(:Best thing ever!! (: 8 28%I hate them!! -.- 2 7%I love them!! <3 11 38%Not my thing :l 7 24%Waste of time!!! >.< 1 3%
Best thing ever!!
(:28%
I hate them!!
-.-7%
I love them!! <338%
Not my thing :l
24%
Waste of time!!! >.<3%
What do you think about sports?
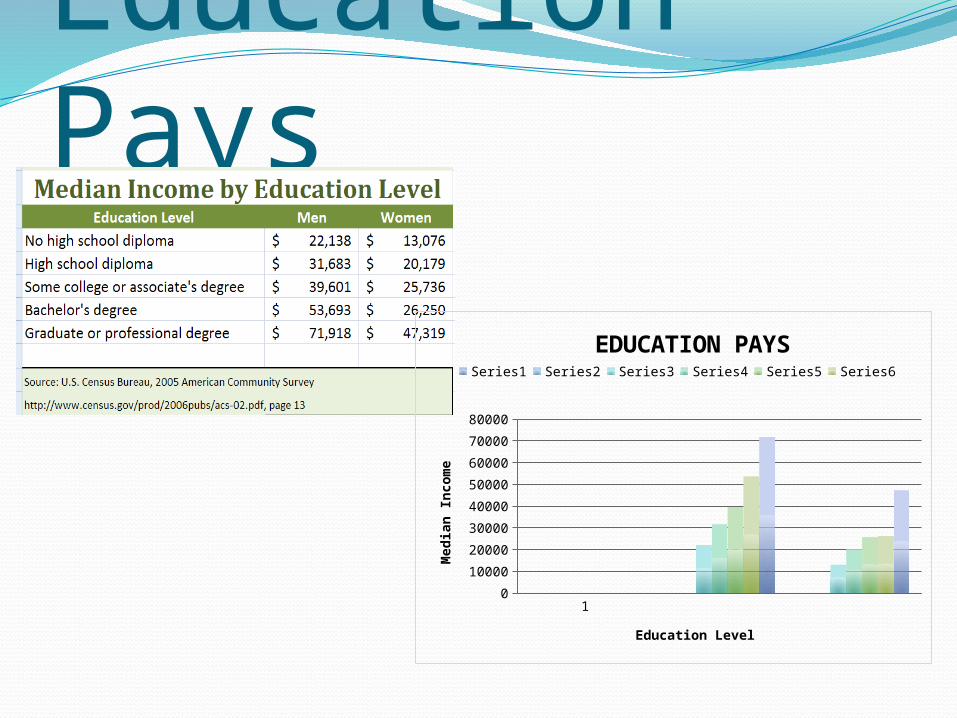
Education Pays
10
10000
20000
30000
40000
50000
60000
70000
80000
EDUCATION PAYS Series1 Series2 Series3 Series4 Series5 Series6 Series7
Education Level
Media
n I
ncom
e
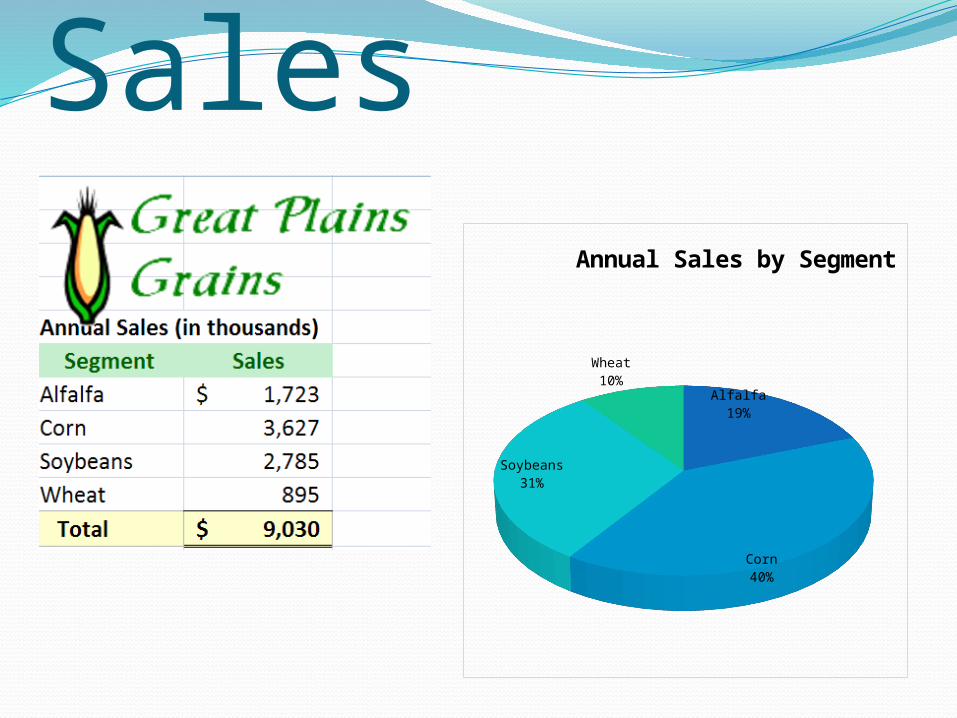
Grains Sales
Alfalfa19%
Corn40%
Soybeans31%
Wheat10%
Annual Sales by Segment
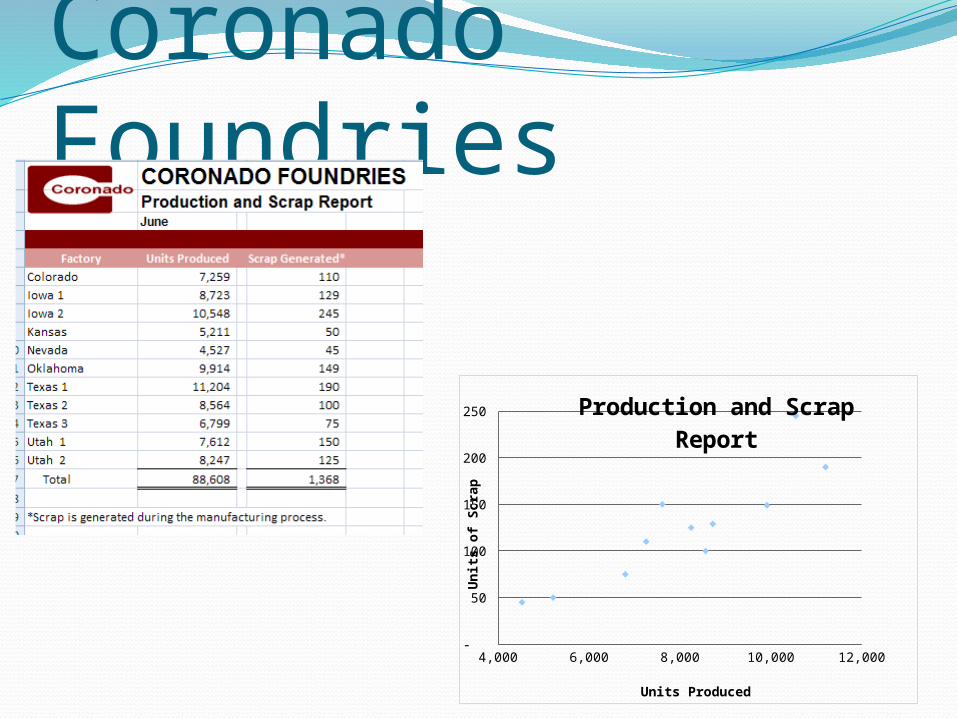
Coronado Foundries
-
50
100
150
200
250 Production and Scrap Report
Units Produced
Unit
s of
Scra
p
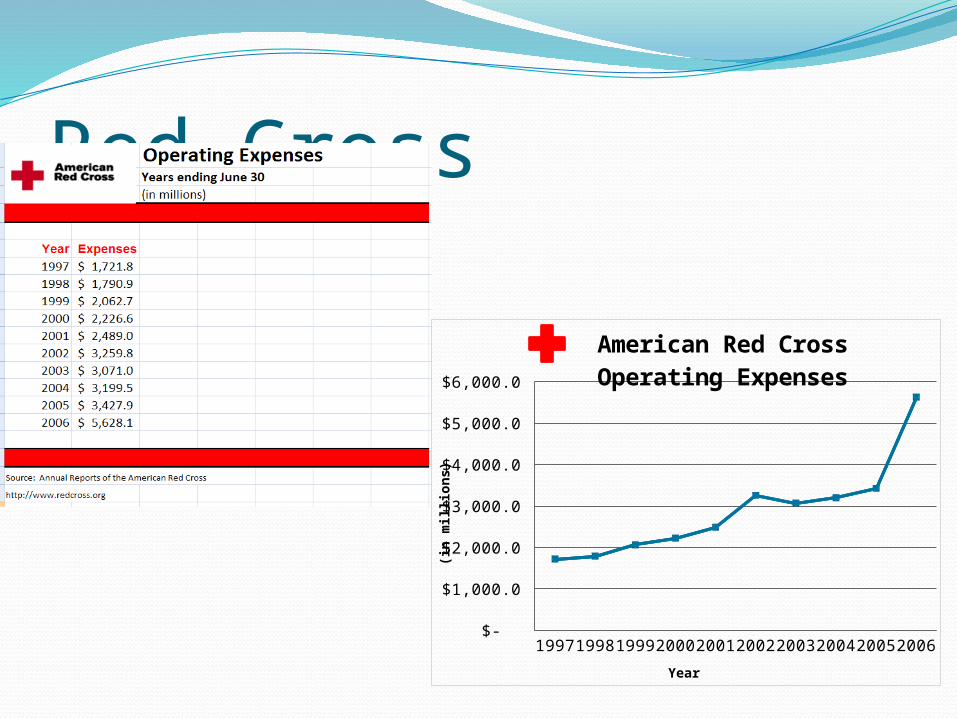
Red Cross
1997199819992000200120022003200420052006 $-
$1,000.0
$2,000.0
$3,000.0
$4,000.0
$5,000.0
$6,000.0
American Red Cross Operating Expenses
Year
(in m
illi
ons)
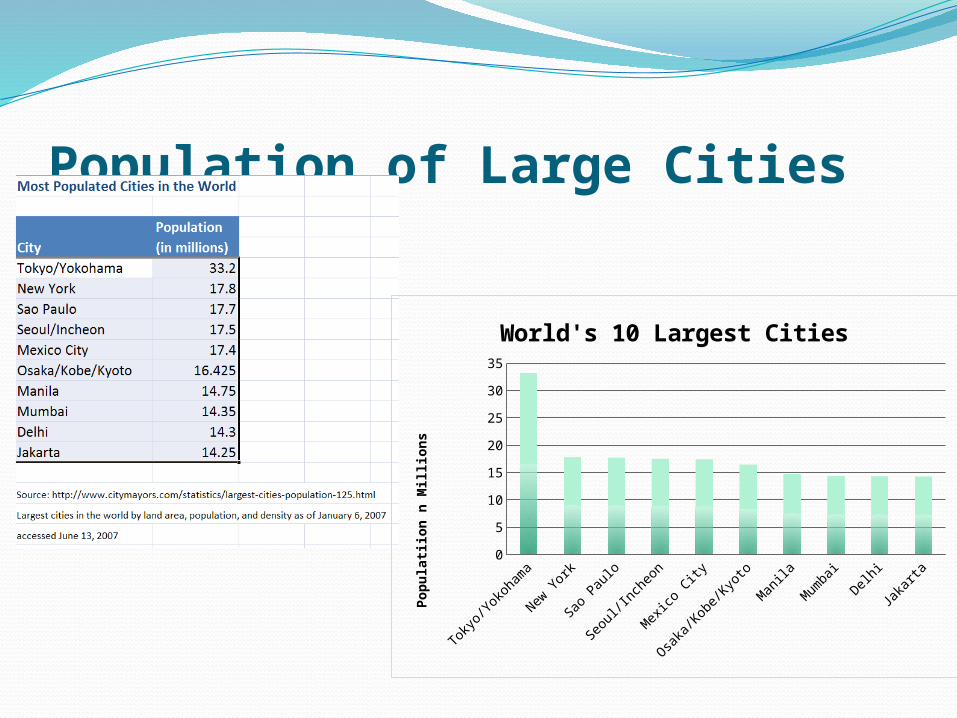
Population of Large Cities
Tokyo
/Yok
oham
a
New Y
ork
Sao P
aulo
Seoul
/Inch
eon
Mex
ico C
ity
Osaka
/Kob
e/Kyo
to
Man
ila
Mum
bai
Delhi
Jaka
rta
0
5
10
15
20
25
30
35
World's 10 Largest Cities
Popula
tiio
n n
Mil
lions
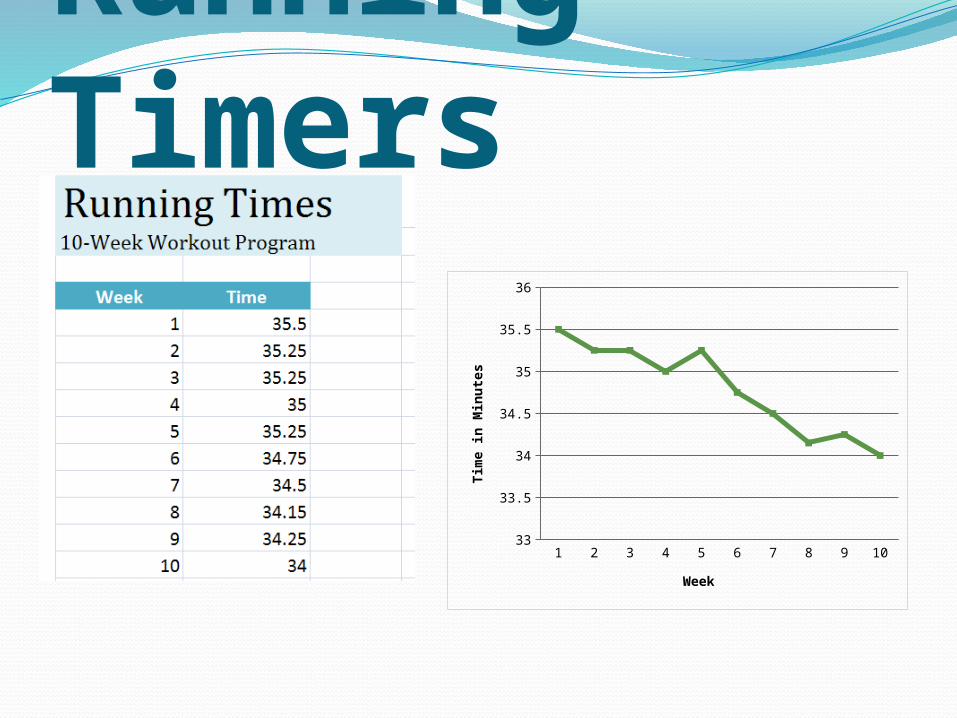
Running Timers
1 2 3 4 5 6 7 8 9 1033
33.5
34
34.5
35
35.5
36
Week
Tim
e i
n M
inute
s
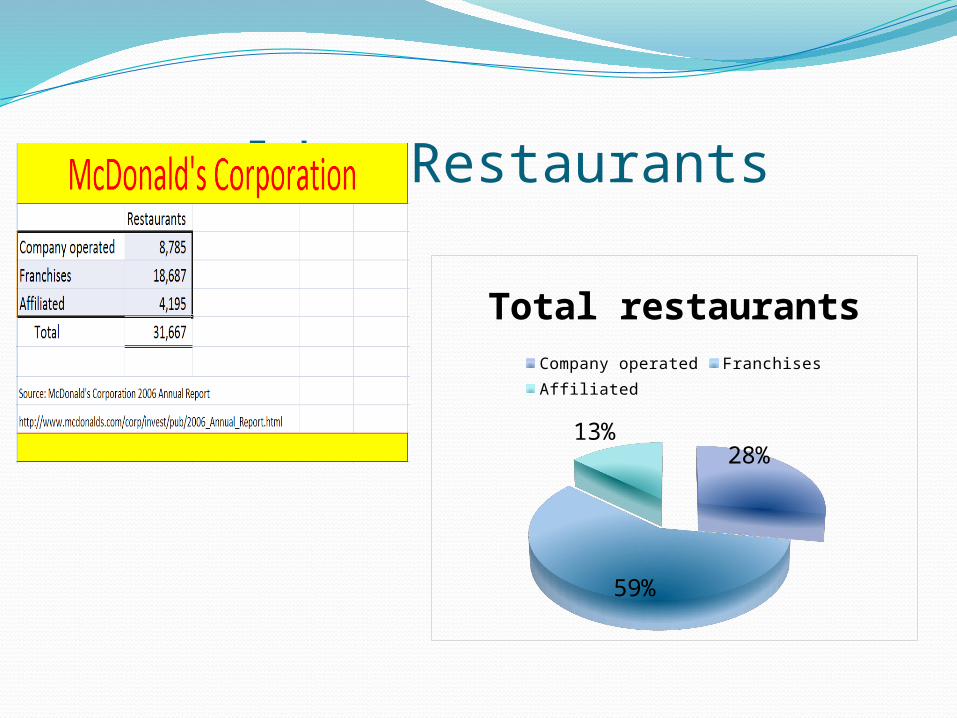
McDonald’s Restaurants
28%
59%
13%
Total restaurants Company operated FranchisesAffiliated
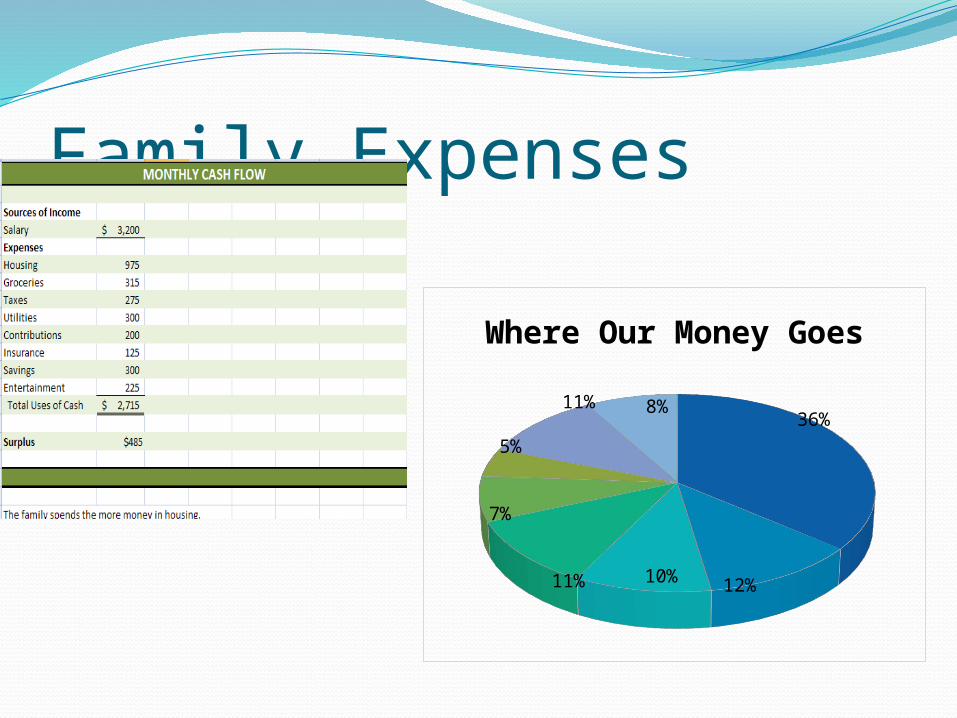
Family Expenses
36%
12%
10%
11%
7%
5%
11%8%
Where Our Money Goes
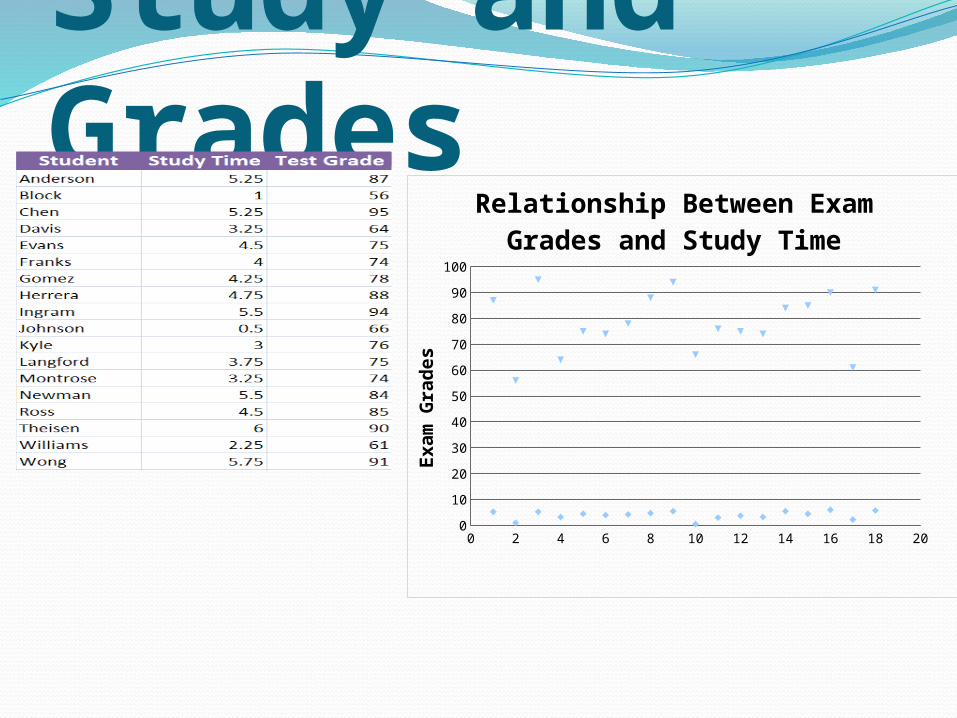
Study and Grades
0 2 4 6 8 10 12 14 16 18 200
10
20
30
40
50
60
70
80
90
100
Relationship Between Exam Grades and Study Time
Exam
Gra
des
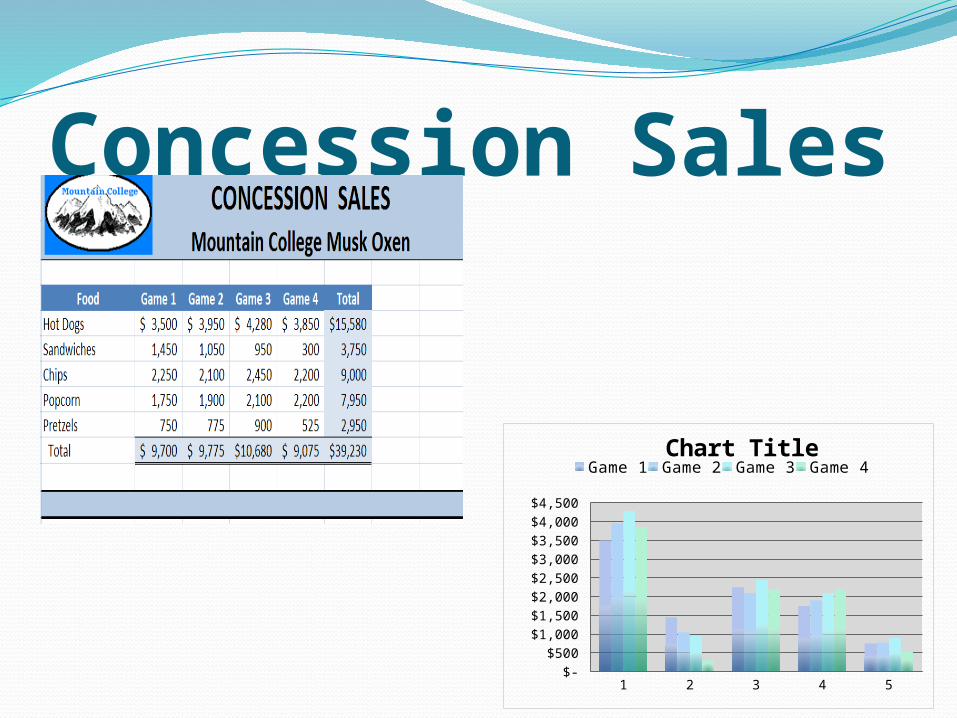
Concession Sales
1 2 3 4 5 $-
$500 $1,000 $1,500 $2,000 $2,500 $3,000 $3,500 $4,000 $4,500
Chart TitleGame 1 Game 2 Game 3