Embed Size (px)
Citation preview
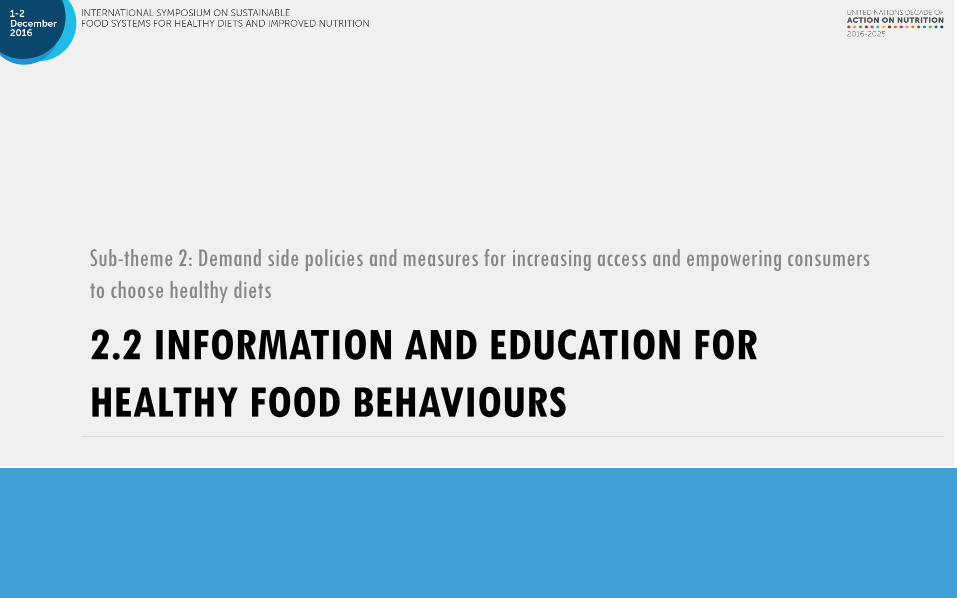
2.2 INFORMATION AND EDUCATION FOR HEALTHY FOOD BEHAVIOURS
Sub-theme 2: Demand side policies and measures for increasing access and empowering consumers to choose healthy diets

Putting Dietary Guidelines for Americans to Work! Multifactorial Approaches for Positive Health Outcomes
United States Department of Agriculture
FAO/WHO International Symposium Sustainable Food Systems for Healthy Diets & Improved Nutrition 1 – 2 December 2016, Rome
Angie Tagtow, MS, RD, LD EXECUTIVE DIRECTOR CENTER FOR NUTRITION POLICY & PROMOTION
SETTING THE STAGE
DEVELOPMENT TRANSLATION APPLICATION
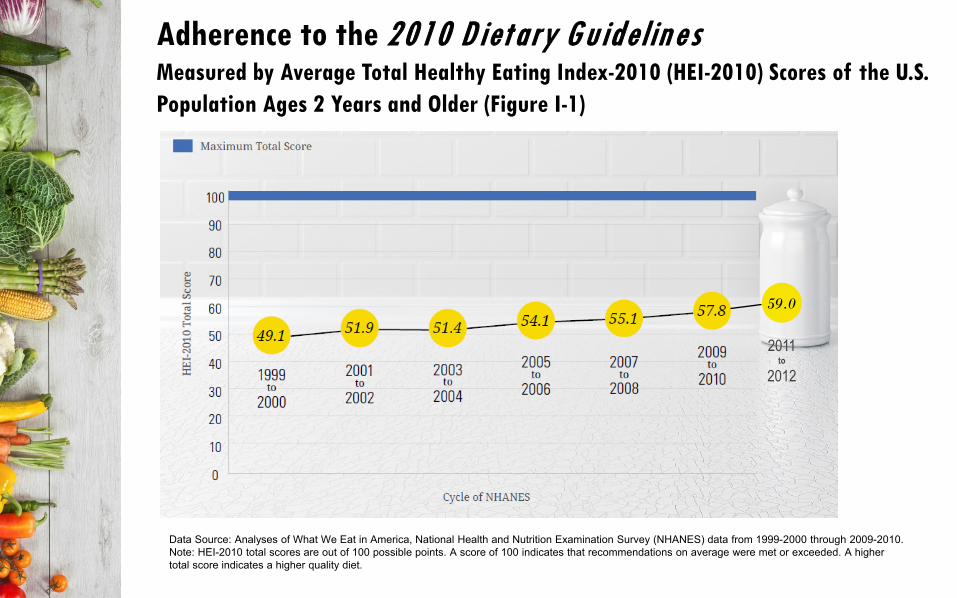
Adherence to the 2010 D ietary G uidelines Measured by Average Total Healthy Eating Index-2010 (HEI-2010) Scores of the U.S. Population Ages 2 Years and Older (Figure I-1)
Data Source: Analyses of What We Eat in America, National Health and Nutrition Examination Survey (NHANES) data from 1999-2000 through 2009-2010. Note: HEI-2010 total scores are out of 100 possible points. A score of 100 indicates that recommendations on average were met or exceeded. A higher total score indicates a higher quality diet.
59.0
2011 to
2012
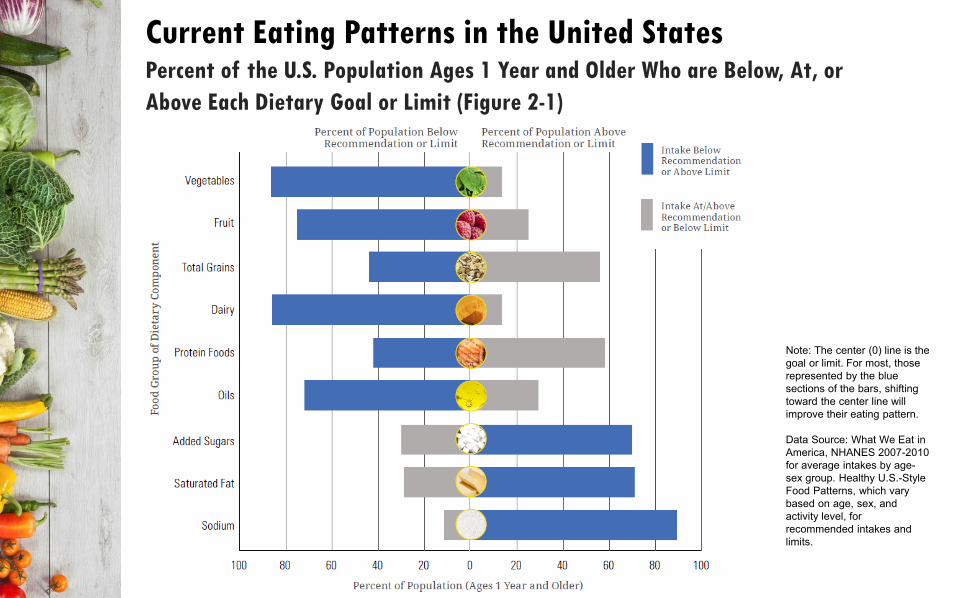
Current Eating Patterns in the United States Percent of the U.S. Population Ages 1 Year and Older Who are Below, At, or Above Each Dietary Goal or Limit (Figure 2-1)
Note: The center (0) line is the goal or limit. For most, those represented by the blue sections of the bars, shifting toward the center line will improve their eating pattern. Data Source: What We Eat in America, NHANES 2007-2010 for average intakes by age-sex group. Healthy U.S.-Style Food Patterns, which vary based on age, sex, and activity level, for recommended intakes and limits.

2015-2020 DIETARY GUIDELINES FOR AMERICANS Guidelines & Key Recommendations
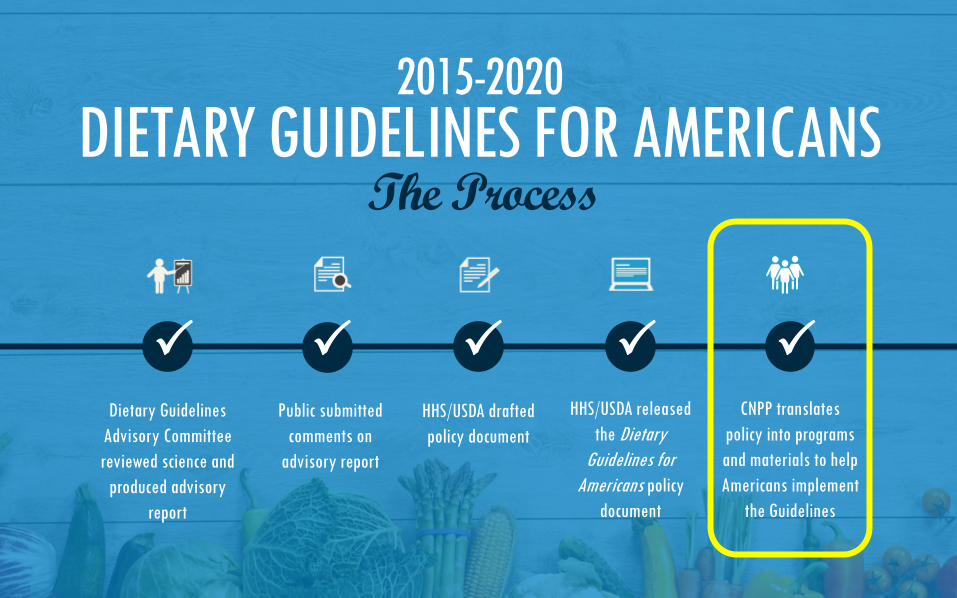
Dietary Guidelines Advisory Committee reviewed science and
produced advisory report
Public submitted comments on
advisory report
HHS/USDA drafted policy document
HHS/USDA released the Dietary
Guidelines for Americans policy
document
CNPP translates policy into programs and materials to help Americans implement
the Guidelines
2015-2020 DIETARY GUIDELINES FOR AMERICANS
The Process
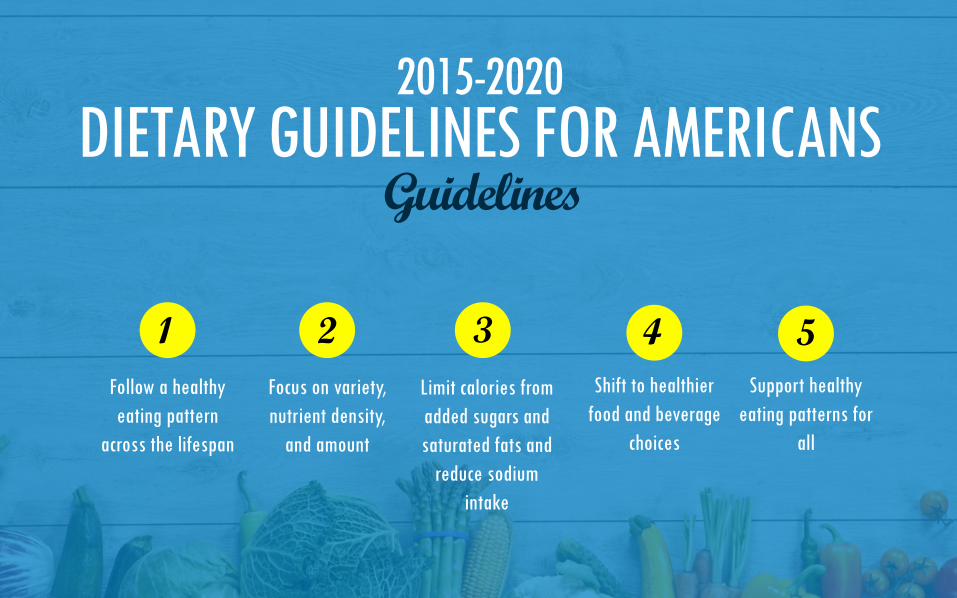
2015-2020 DIETARY GUIDELINES FOR AMERICANS
Guidelines
Follow a healthy eating pattern
across the lifespan
Focus on variety, nutrient density,
and amount
Limit calories from added sugars and saturated fats and
reduce sodium intake
Shift to healthier food and beverage
choices
Support healthy eating patterns for
all
1 2 3 4 5
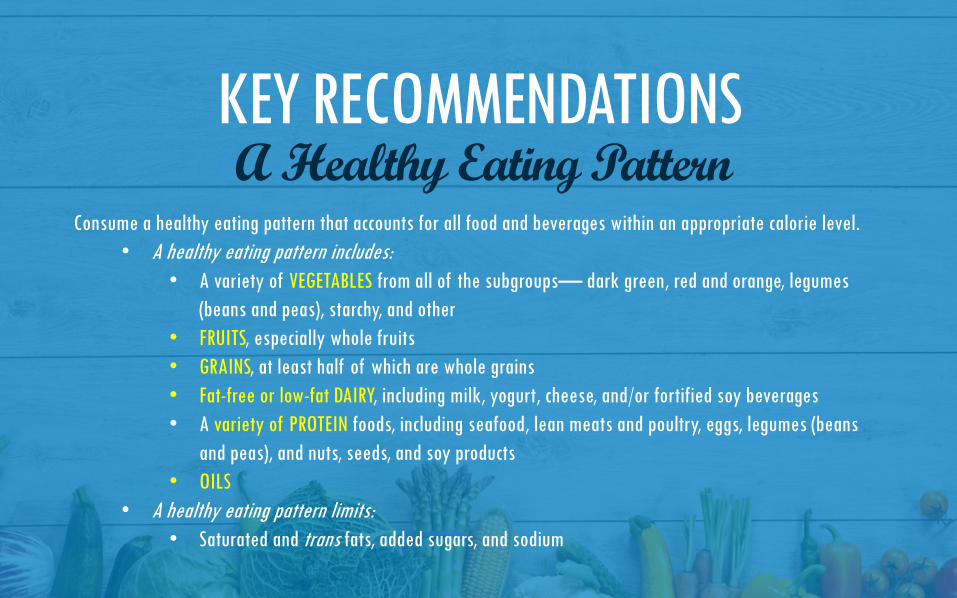
Consume a healthy eating pattern that accounts for all food and beverages within an appropriate calorie level. • A healthy eating pattern includes:
• A variety of VEGETABLES from all of the subgroups— dark green, red and orange, legumes (beans and peas), starchy, and other
• FRUITS, especially whole fruits • GRAINS, at least half of which are whole grains • Fat-free or low-fat DAIRY, including milk, yogurt, cheese, and/or fortified soy beverages • A variety of PROTEIN foods, including seafood, lean meats and poultry, eggs, legumes (beans
and peas), and nuts, seeds, and soy products • OILS
• A healthy eating pattern limits: • Saturated and trans fats, added sugars, and sodium
KEY RECOMMENDATIONS
A Healthy Eating Pattern
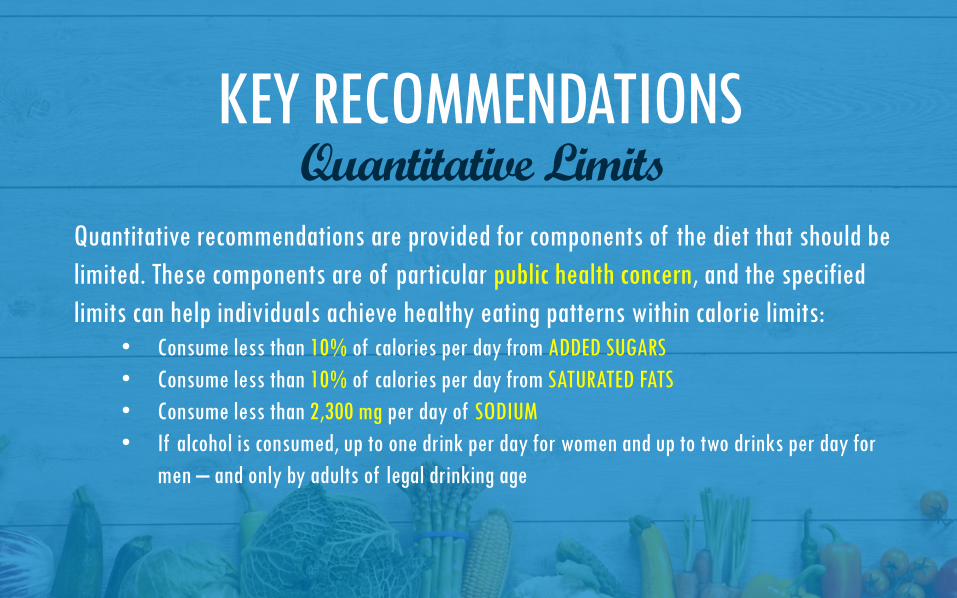
Quantitative recommendations are provided for components of the diet that should be limited. These components are of particular public health concern, and the specified limits can help individuals achieve healthy eating patterns within calorie limits:
• Consume less than 10% of calories per day from ADDED SUGARS • Consume less than 10% of calories per day from SATURATED FATS • Consume less than 2,300 mg per day of SODIUM • If alcohol is consumed, up to one drink per day for women and up to two drinks per day for
men – and only by adults of legal drinking age
KEY RECOMMENDATIONS
Quantitative Limits
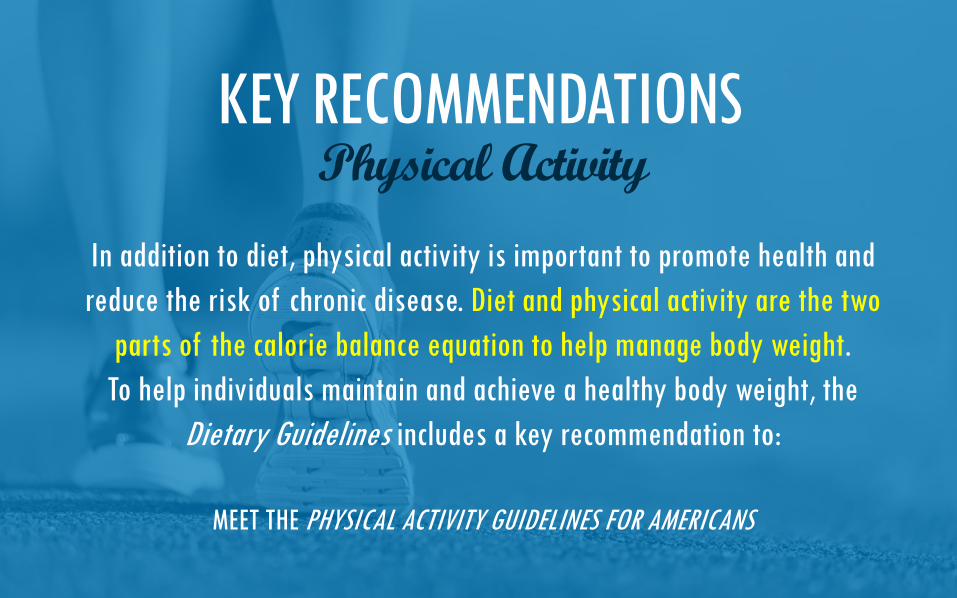
In addition to diet, physical activity is important to promote health and reduce the risk of chronic disease. Diet and physical activity are the two
parts of the calorie balance equation to help manage body weight. To help individuals maintain and achieve a healthy body weight, the
Dietary Guidelines includes a key recommendation to:
MEET THE PHYSICAL ACTIVITY GUIDELINES FOR AMERICANS
KEY RECOMMENDATIONS
Physical Activity
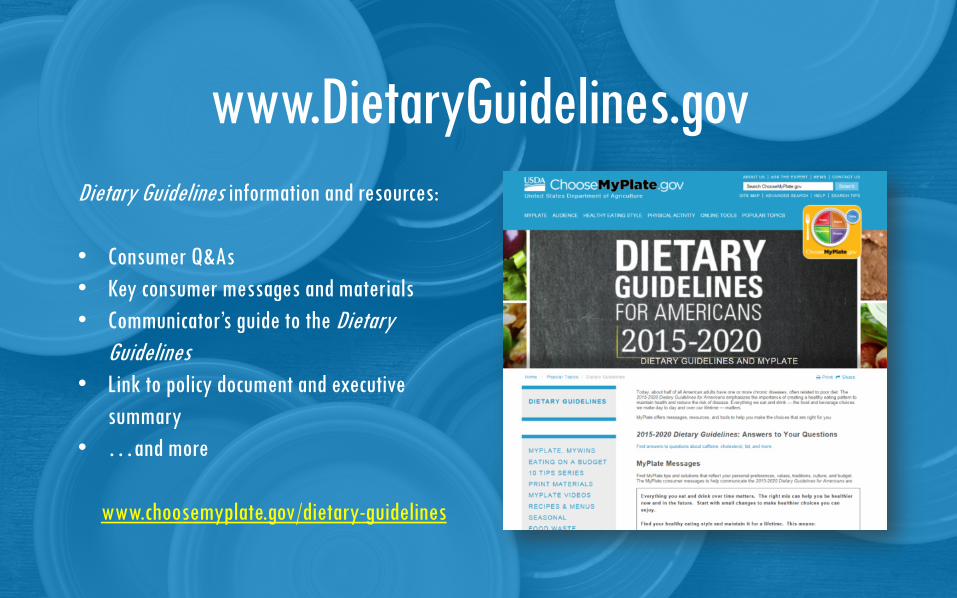
Dietary Guidelines information and resources: • Consumer Q&As • Key consumer messages and materials • Communicator’s guide to the Dietary
Guidelines • Link to policy document and executive
summary • …and more
www.choosemyplate.gov/dietary-guidelines
www.DietaryGuidelines.gov

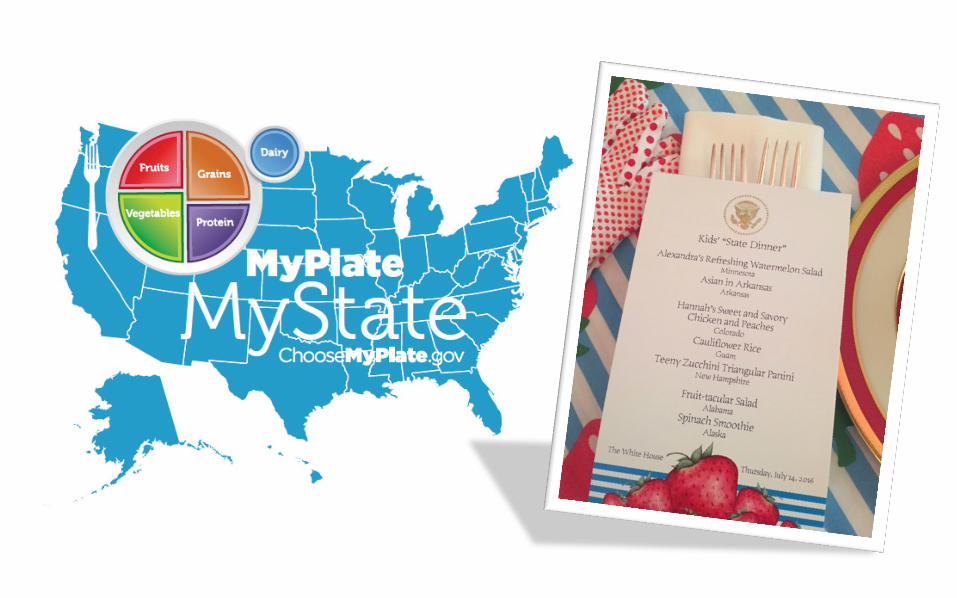
TRANSLATING THE DIETARY GUIDELINES TO MYPLATE Healthy Eating Solutions for Consumers
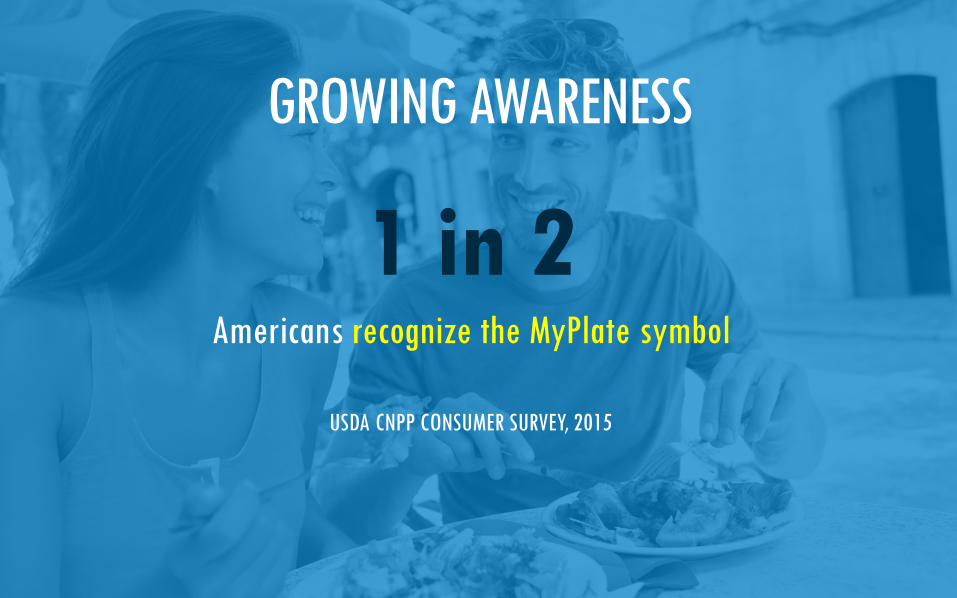
1 in 2 Americans recognize the MyPlate symbol
USDA CNPP CONSUMER SURVEY, 2015
GROWING AWARENESS

Introducing…
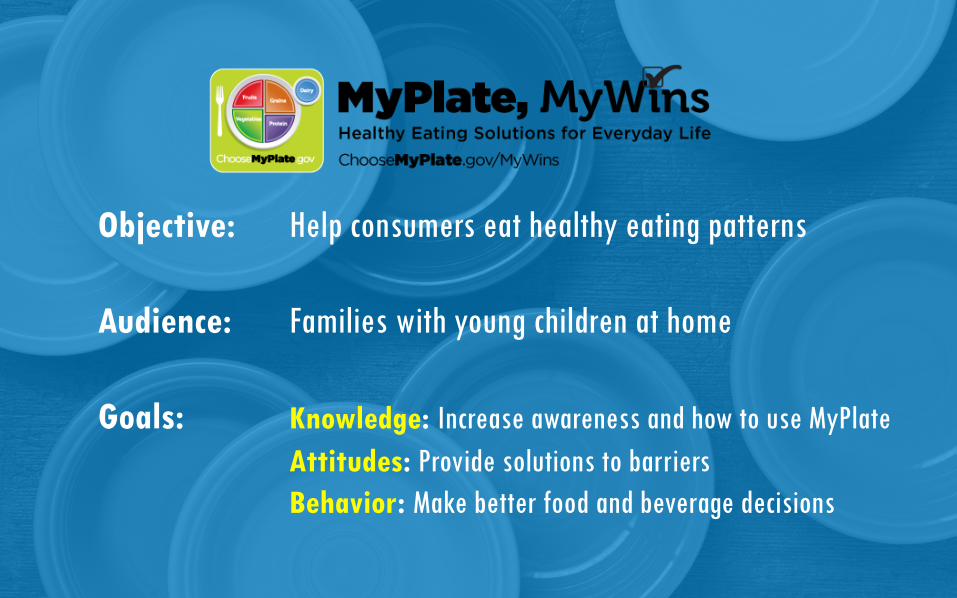
Objective: Help consumers eat healthy eating patterns Audience: Families with young children at home Goals: Knowledge: Increase awareness and how to use MyPlate Attitudes: Provide solutions to barriers Behavior: Make better food and beverage decisions
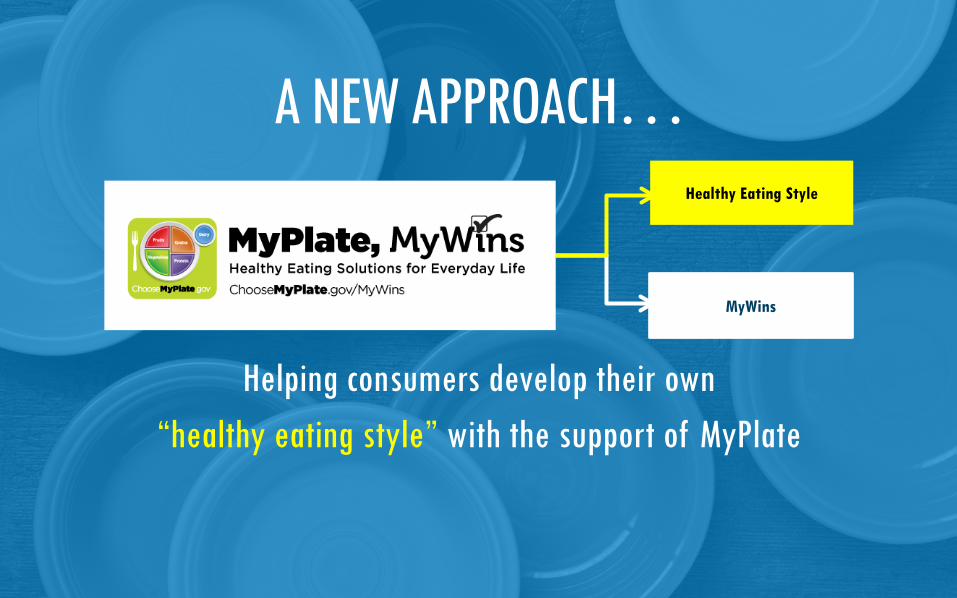
Helping consumers develop their own “healthy eating style” with the support of MyPlate
A NEW APPROACH… Healthy Eating Style
MyWins
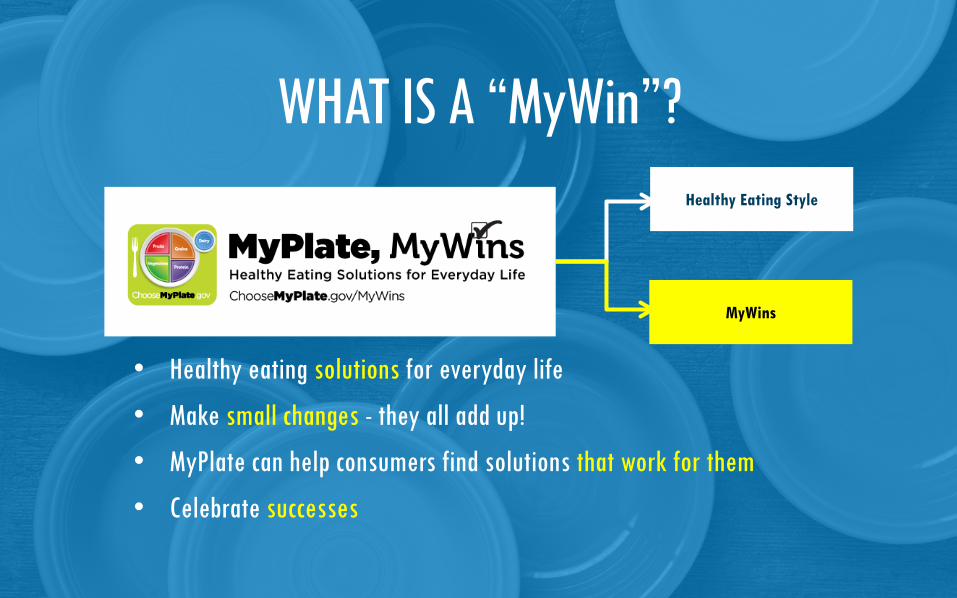
• Healthy eating solutions for everyday life
• Make small changes - they all add up!
• MyPlate can help consumers find solutions that work for them
• Celebrate successes
WHAT IS A “MyWin”? Healthy Eating Style
MyWins

Empowers families and individuals to help one another
Emphasizes social support, inspirational content, and personalized tools for success
New campaign resources to help consumers find their “wins,” including:
• “Day-in-the-life” videos with real families
• Healthy eating tips
• Interactive challenges
• MyPlate educational materials and tools
• Opportunities to share successes with others
INSPIRING CONSUMERS TO FIND THEIR “WINS”

WWW.CHOOSEMYPLATE.GOV/MYWINS

MyPlate, MyWins TIPSHEET

• Graphics and MyPlate Style Guide at: www.choosemyplate.gov/graphics
• Buttons for each food group
• Button for limiting sodium, saturated fats, and added sugars
• MyWins graphic
• Dietary Guidelines Communicator’s Guide
• New consumer messages
• Shareable tweets
RESOURCES FOR PROFESSIONALS
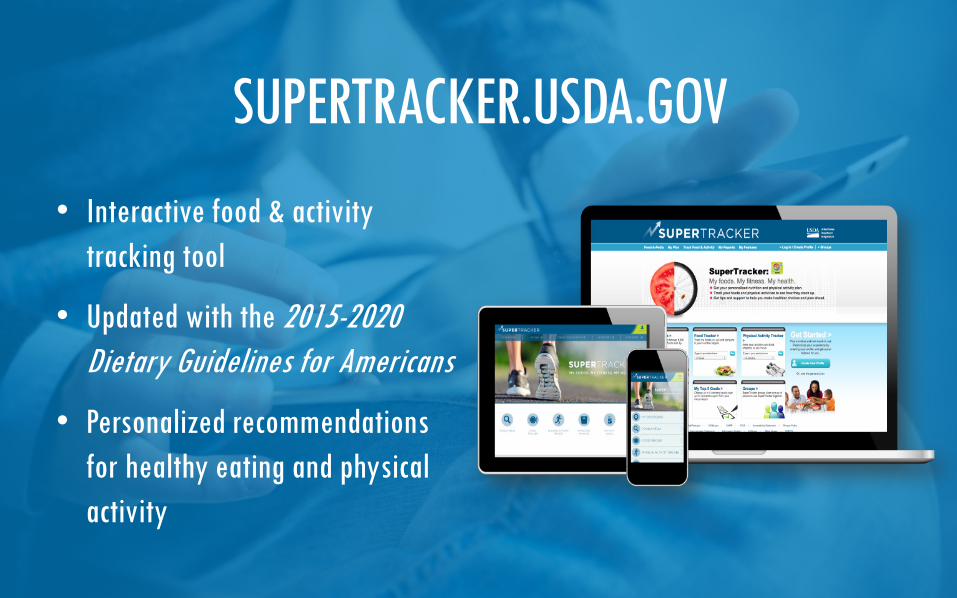
• Interactive food & activity tracking tool
• Updated with the 2015-2020 Dietary Guidelines for Americans
• Personalized recommendations for healthy eating and physical activity
SUPERTRACKER.USDA.GOV

Like MyPlate at www.facebook.com/MyPlate
Follow @MyPlate on Twitter
CONNECT WITH MyPlate Social Media

#MYPLATEMYWINS

Exploring Dynamic Frameworks
APPLYING THE DIETARY GUIDELINES
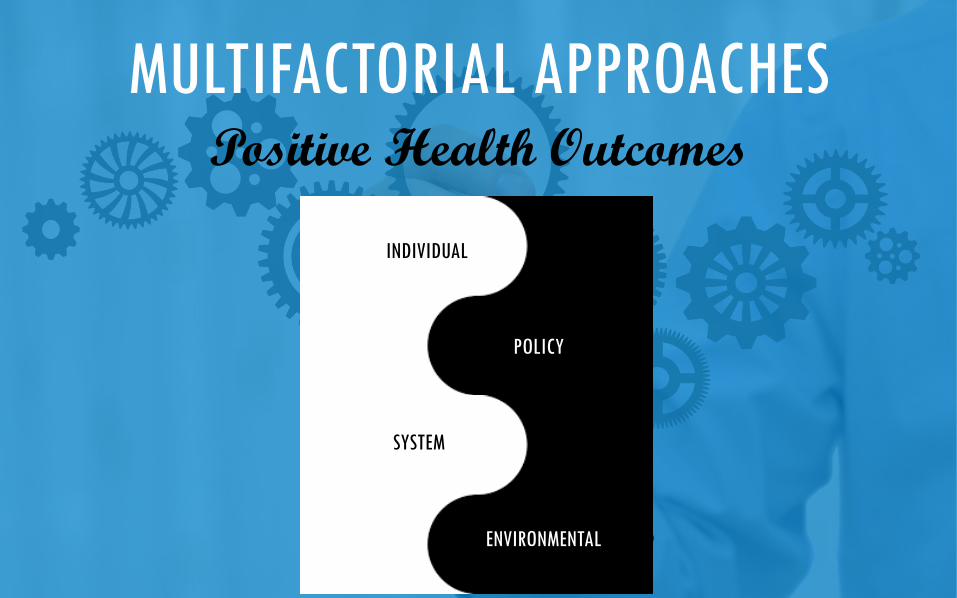
MULTIFACTORIAL APPROACHES Positive Health Outcomes
INDIVIDUAL
SYSTEM
POLICY
ENVIRONMENTAL
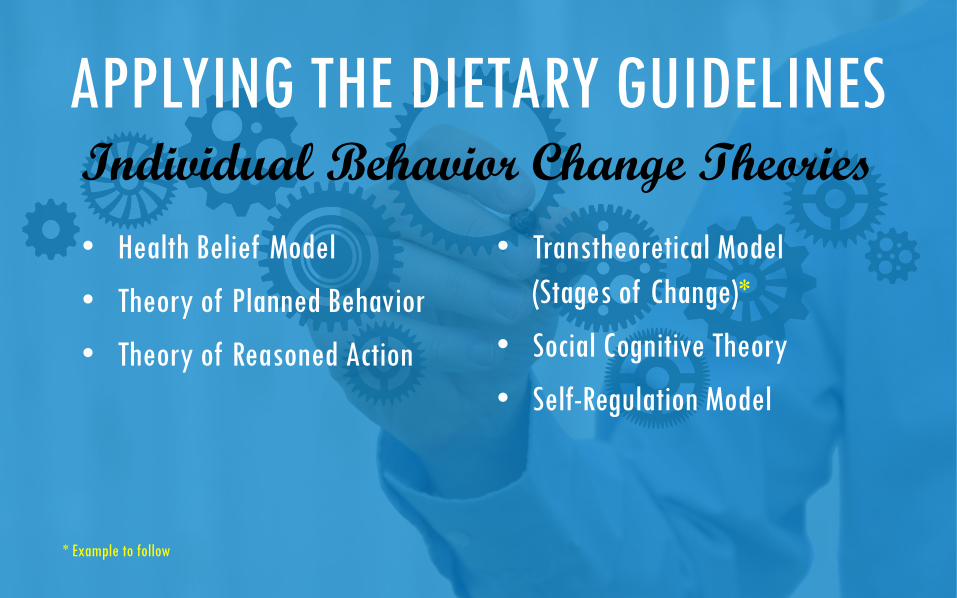
APPLYING THE DIETARY GUIDELINES Individual Behavior Change Theories • Health Belief Model • Theory of Planned Behavior • Theory of Reasoned Action
• Transtheoretical Model (Stages of Change)*
• Social Cognitive Theory • Self-Regulation Model
* Example to follow
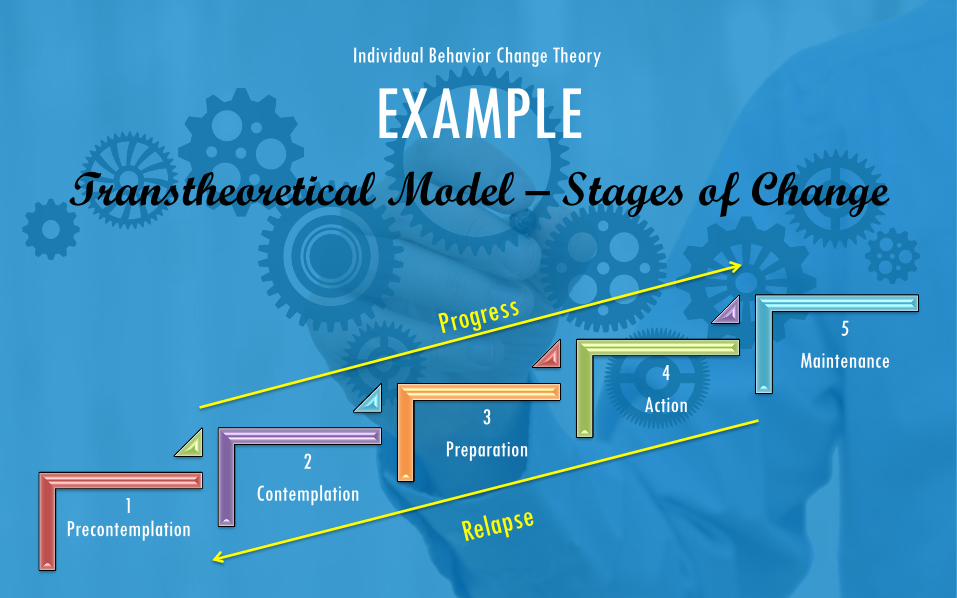
EXAMPLE Transtheoretical Model – Stages of Change
1 Precontemplation
2 Contemplation
3 Preparation
4 Action
5 Maintenance
Individual Behavior Change Theory
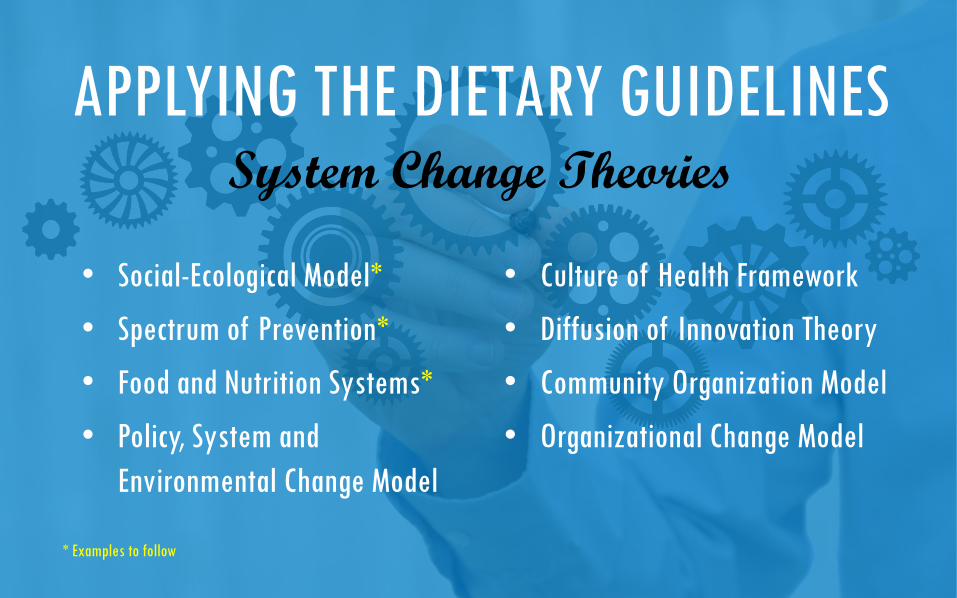
• Social-Ecological Model* • Spectrum of Prevention* • Food and Nutrition Systems* • Policy, System and
Environmental Change Model
• Culture of Health Framework • Diffusion of Innovation Theory • Community Organization Model • Organizational Change Model
* Examples to follow
APPLYING THE DIETARY GUIDELINES System Change Theories
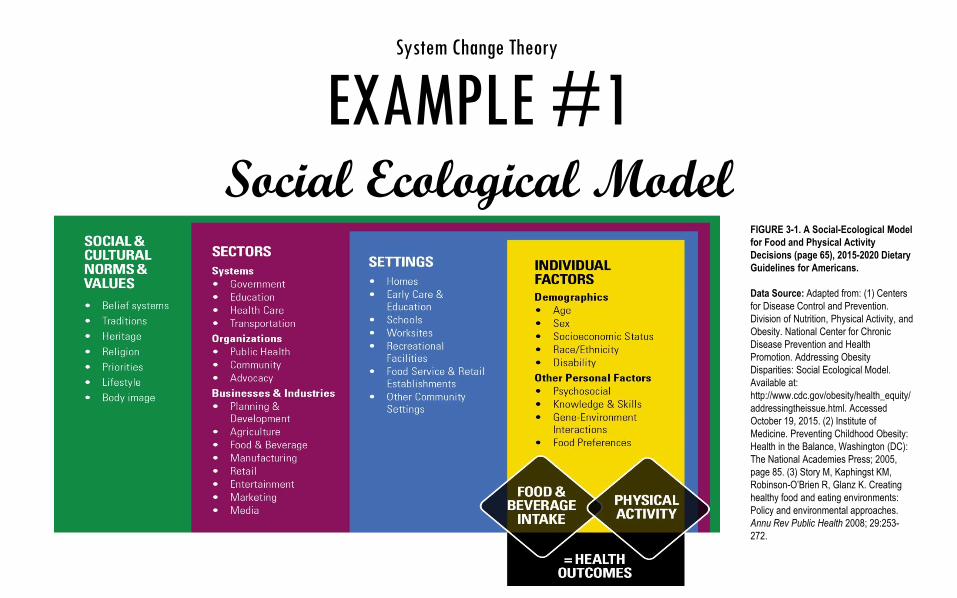
EXAMPLE #1 Social Ecological Model
FIGURE 3-1. A Social-Ecological Model for Food and Physical Activity Decisions (page 65), 2015-2020 Dietary Guidelines for Americans. Data Source: Adapted from: (1) Centers for Disease Control and Prevention. Division of Nutrition, Physical Activity, and Obesity. National Center for Chronic Disease Prevention and Health Promotion. Addressing Obesity Disparities: Social Ecological Model. Available at: http://www.cdc.gov/obesity/health_equity/addressingtheissue.html. Accessed October 19, 2015. (2) Institute of Medicine. Preventing Childhood Obesity: Health in the Balance, Washington (DC): The National Academies Press; 2005, page 85. (3) Story M, Kaphingst KM, Robinson-O’Brien R, Glanz K. Creating healthy food and eating environments: Policy and environmental approaches. Annu Rev Public Health 2008; 29:253-272.
System Change Theory
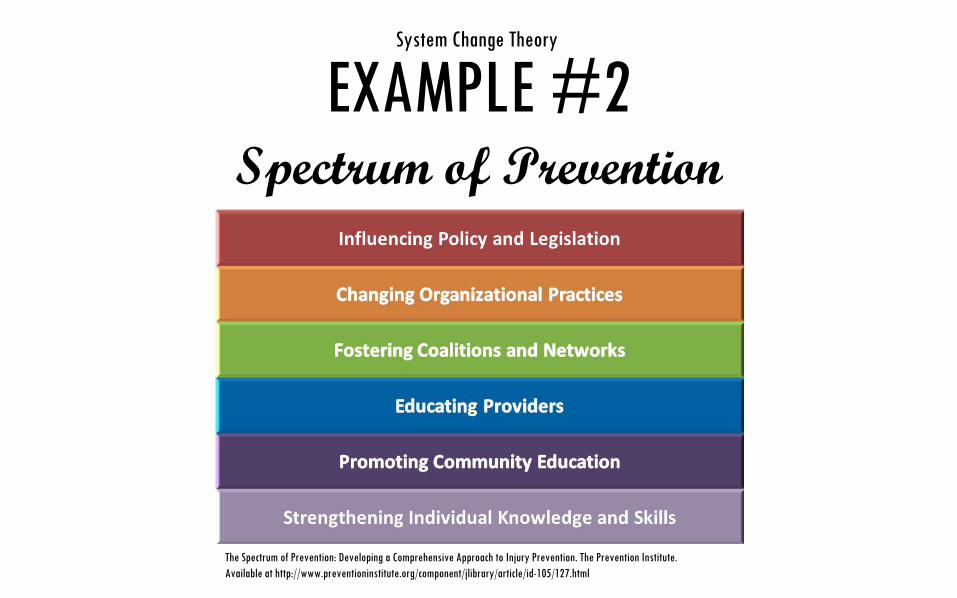
EXAMPLE #2 Spectrum of Prevention
The Spectrum of Prevention: Developing a Comprehensive Approach to Injury Prevention. The Prevention Institute. Available at http://www.preventioninstitute.org/component/jlibrary/article/id-105/127.html
System Change Theory
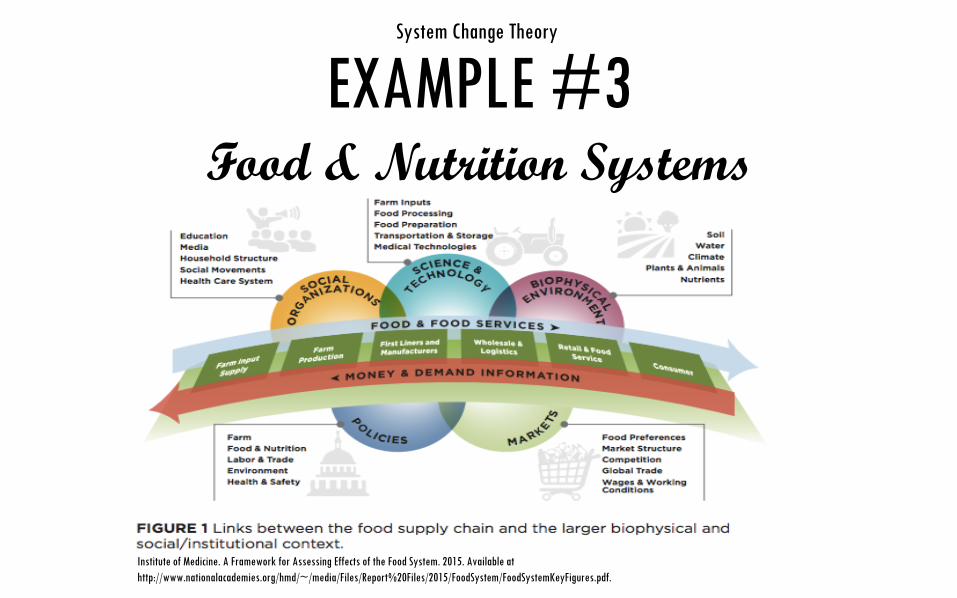
EXAMPLE #3 Food & Nutrition Systems
Institute of Medicine. A Framework for Assessing Effects of the Food System. 2015. Available at http://www.nationalacademies.org/hmd/~/media/Files/Report%20Files/2015/FoodSystem/FoodSystemKeyFigures.pdf.
System Change Theory

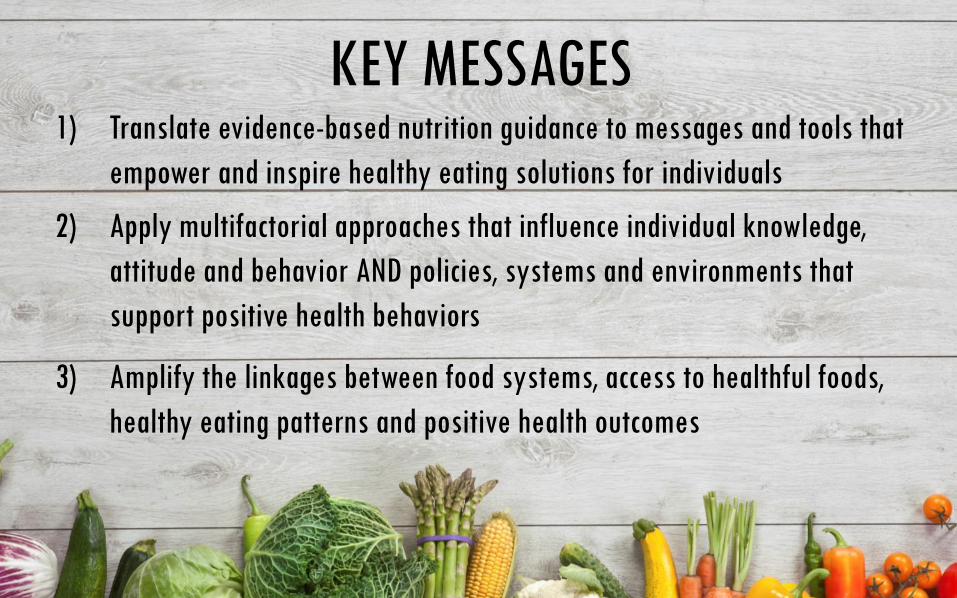
KEY MESSAGES 1) Translate evidence-based nutrition guidance to messages and tools that
empower and inspire healthy eating solutions for individuals 2) Apply multifactorial approaches that influence individual knowledge,
attitude and behavior AND policies, systems and environments that support positive health behaviors
3) Amplify the linkages between food systems, access to healthful foods, healthy eating patterns and positive health outcomes
THANK YOU! USDA Center for Nutrition Policy and Promotion
www.cnpp.usda.gov www.DietaryGuidelines.gov
www.ChooseMyPlate.gov www.SuperTracker.usda.gov
December 2016