Embed Size (px)
Citation preview
A SYSTEMS APPROACH TO TRANSPORT PLANNING
FOR
REVITALIZING CONGESTED CITIES:
A CASE STUDY FROM SRI LANKA
AMAL S. KUMARAGE
ENDEAVOUR EXECUTIVE FELLOW 2014
UNIVERSITY OF MORATUWA, SRI LANKA
25th Nov 2014
HOW DO WE PLAN TRANSPORT FOR CONGESTED CITIES?
CONNECT: SMART SEMINAR SERIES
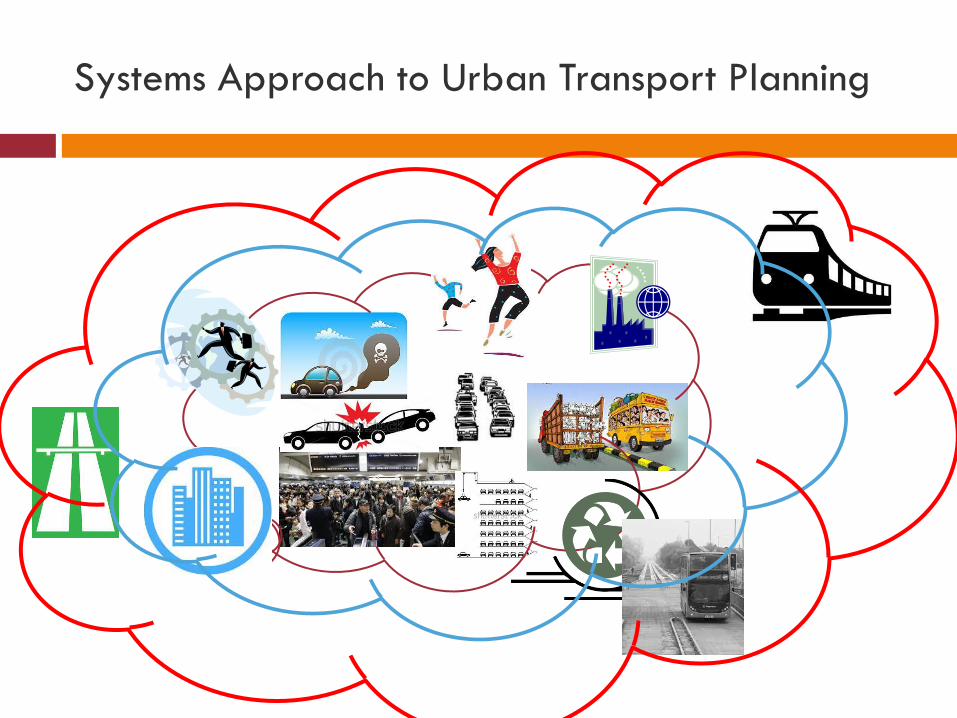
Systems Approach to Urban Transport Planning
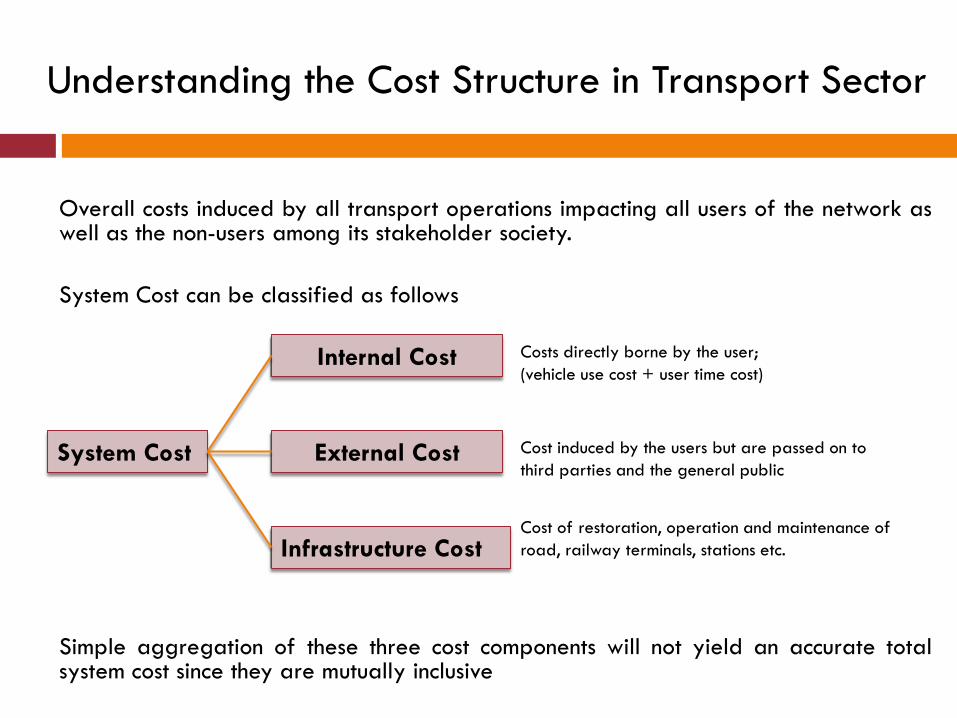
Overall costs induced by all transport operations impacting all users of the network as well as the non-users among its stakeholder society.
System Cost can be classified as follows
Simple aggregation of these three cost components will not yield an accurate total system cost since they are mutually inclusive
System Cost
Internal Cost
External Cost
Infrastructure Cost
Costs directly borne by the user;
(vehicle use cost + user time cost)
Cost induced by the users but are passed on to
third parties and the general public
Cost of restoration, operation and maintenance of
road, railway terminals, stations etc.
Understanding the Cost Structure in Transport Sector
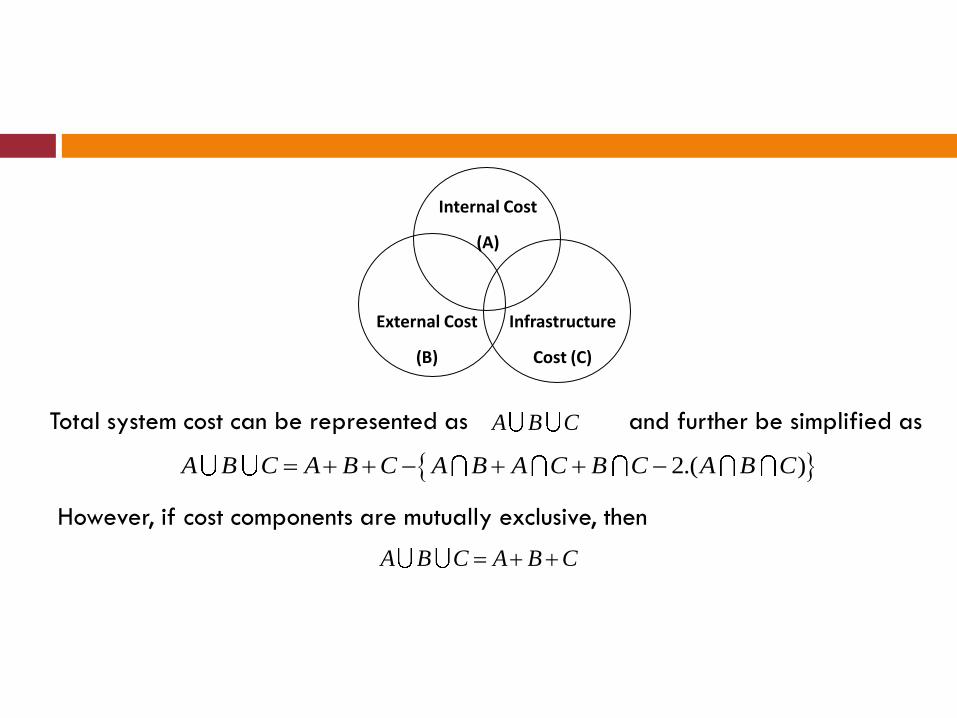
Internal Cost
(A)
External Cost
(B)
Infrastructure
Cost (C)
A B C
2.( )A B C A B C A B A C B C A B C
A B C A B C
Total system cost can be represented as and further be simplified as
However, if cost components are mutually exclusive, then
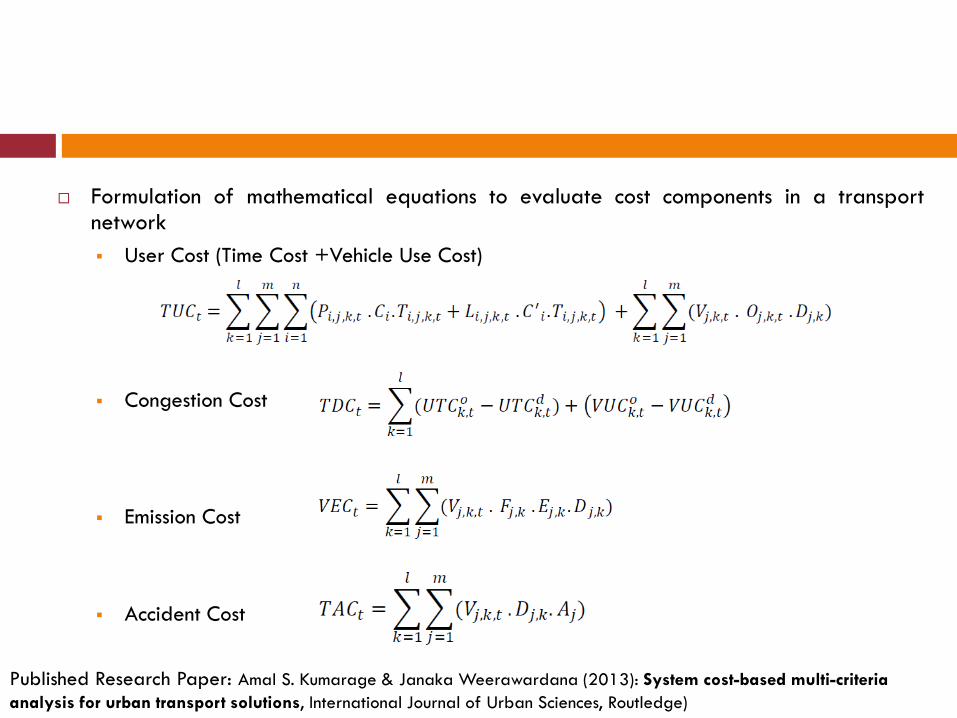
Formulation of mathematical equations to evaluate cost components in a transport network
User Cost (Time Cost +Vehicle Use Cost)
Congestion Cost
Emission Cost
Accident Cost
Published Research Paper: Amal S. Kumarage & Janaka Weerawardana (2013): System cost-based multi-criteria
analysis for urban transport solutions, International Journal of Urban Sciences, Routledge)
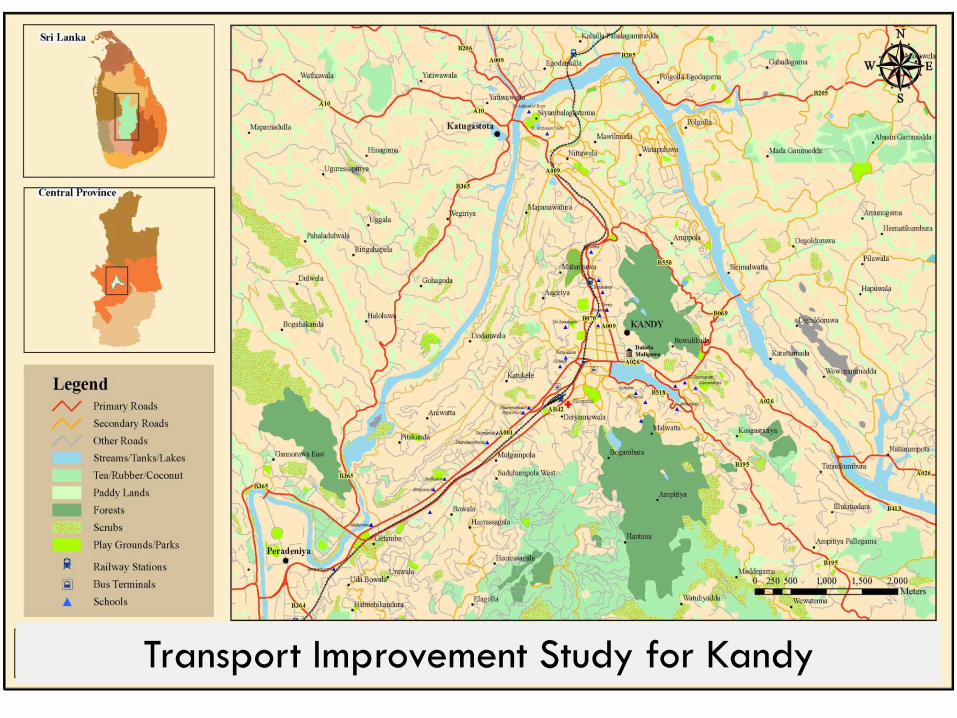
Map 2-1 of Kandy City,
Transport Improvement Study for Kandy
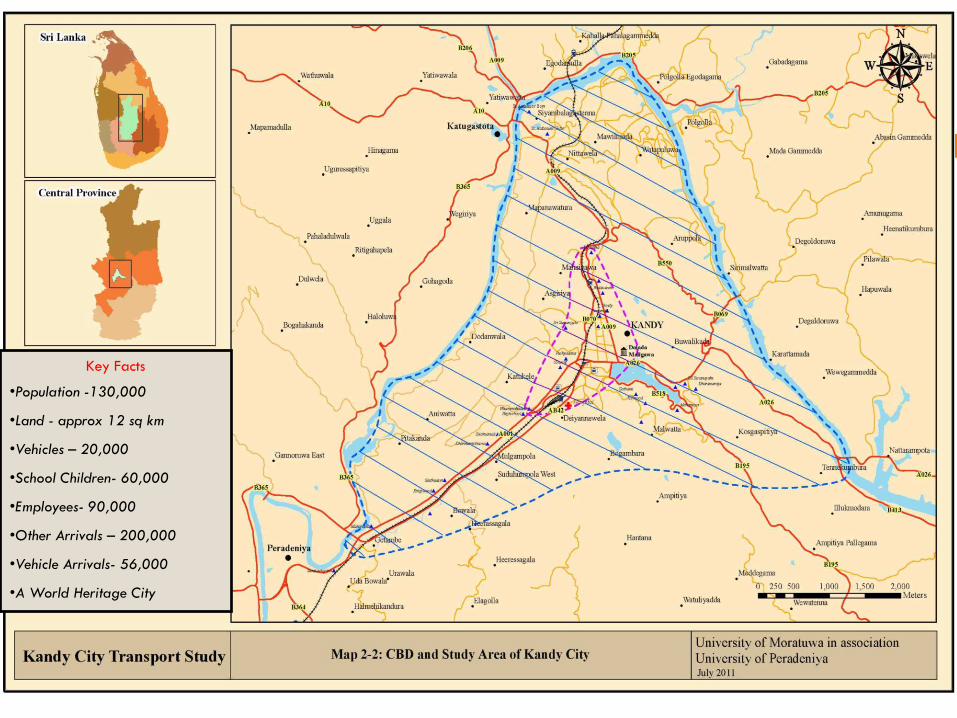
Map 2-2 CBD to same scale and position so that it
will look like an animation
Key Facts
•Population -130,000
•Land - approx 12 sq km
•Vehicles – 20,000
•School Children- 60,000
•Employees- 90,000
•Other Arrivals – 200,000
•Vehicle Arrivals- 56,000
•A World Heritage City
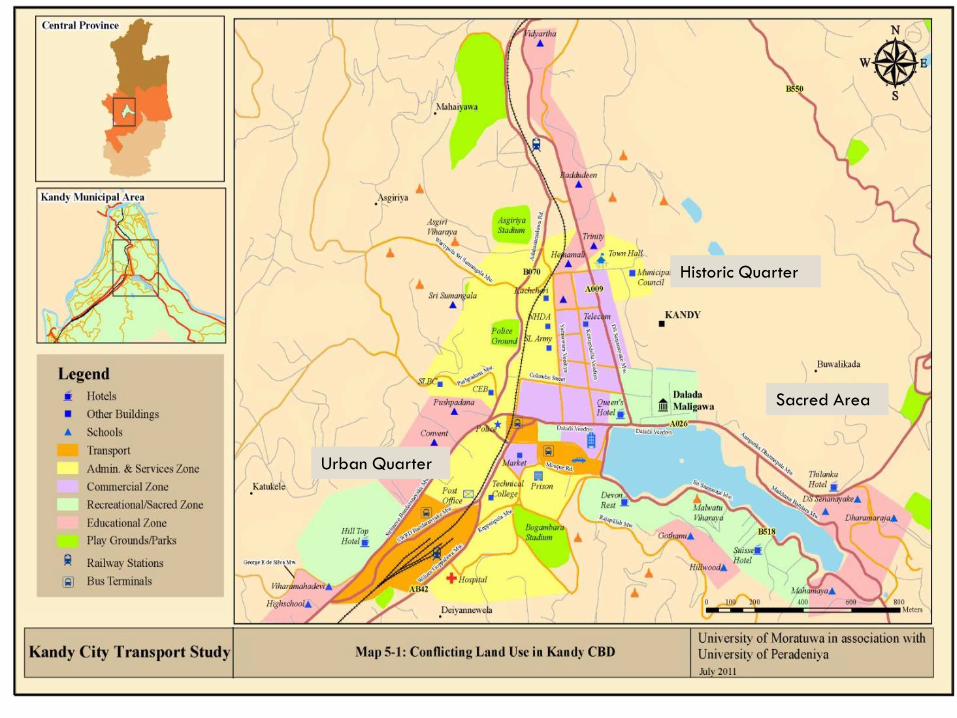
Sacred Area
Historic Quarter
Urban Quarter
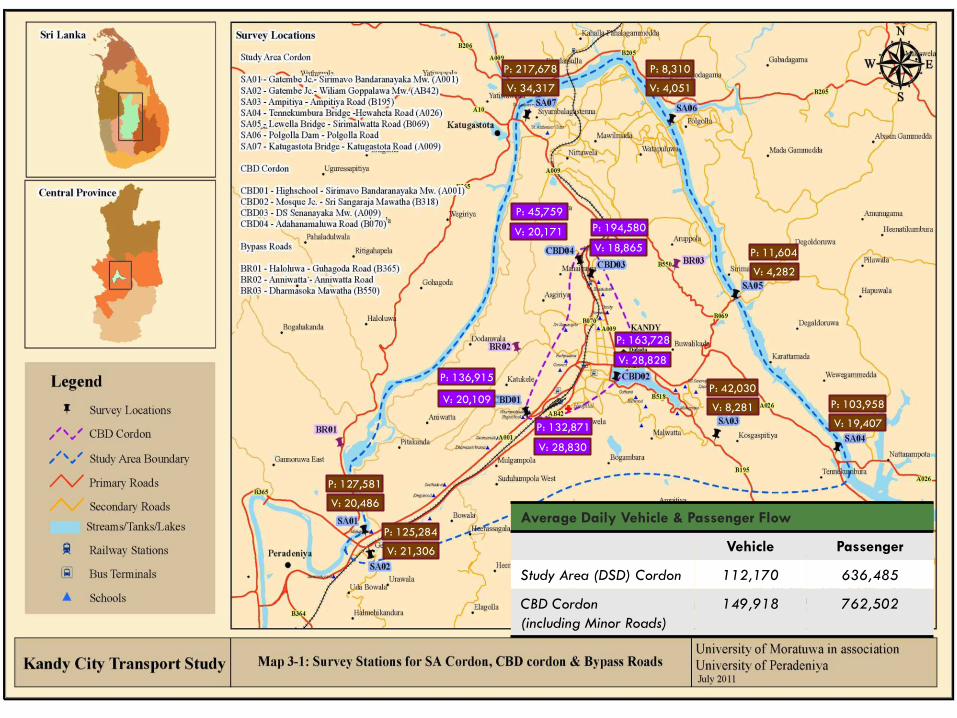
Map 3-1 Survey Locations add animations showing
the traffic flows at both boundaries and then
another animation showing passenger flows at both
boundaries in thousands in one direction, growth
from 2002 (Jayatileke)
V: 21,306
V: 20,486
V: 19,407
V: 4,282
V: 4,051 V: 34,317
V: 20,109 V: 8,281
V: 18,865
V: 20,171
V: 28,828
V: 28,830
P: 125,284
P: 127,581
P: 103,958
P: 11,604
P: 8,310 P: 217,678
P: 42,030 P: 136,915
P: 194,580
P: 45,759
P: 163,728
P: 132,871
Average Daily Vehicle & Passenger Flow
Vehicle Passenger
Study Area (DSD) Cordon 112,170 636,485
CBD Cordon
(including Minor Roads)
149,918 762,502
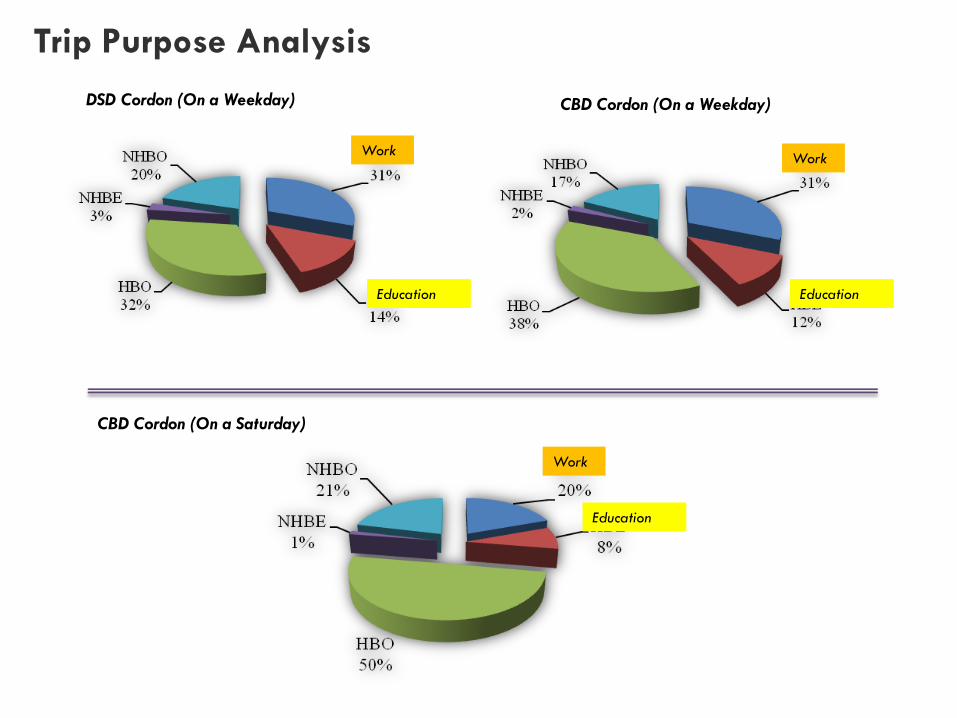
Trip Purpose Analysis
DSD Cordon (On a Weekday) CBD Cordon (On a Weekday)
CBD Cordon (On a Saturday)
Work Work
Work
Education
Education Education
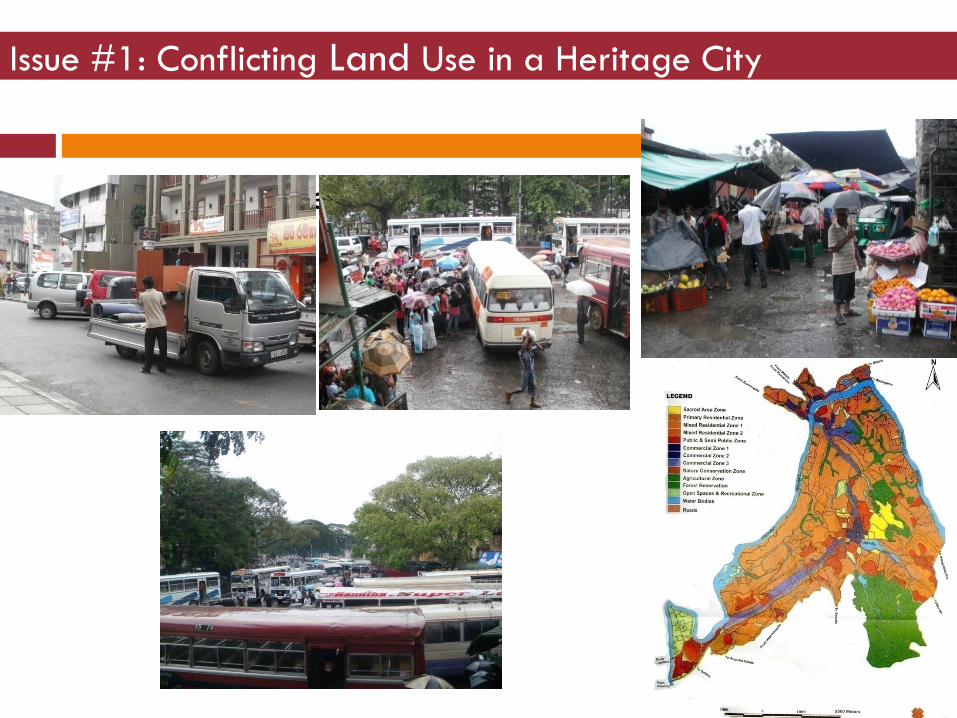
Issue #1: Conflicting Land Use in a Heritage City
Land Use Issues
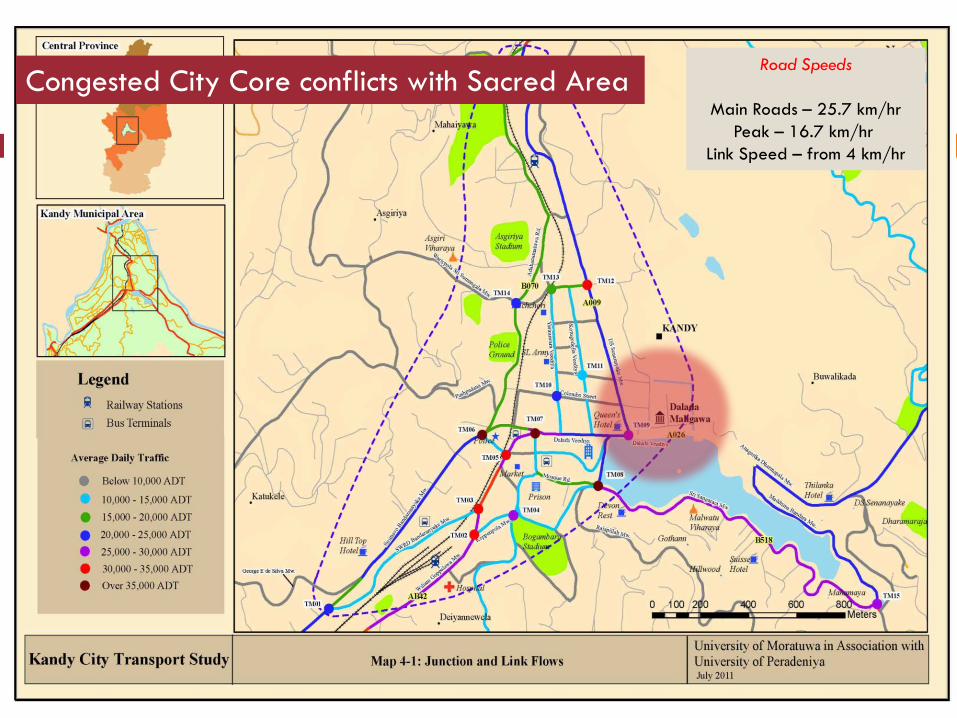
Map 4-1 superimposed to same position
Road Speeds
Main Roads – 25.7 km/hr
Peak – 16.7 km/hr
Link Speed – from 4 km/hr
Congested City Core conflicts with Sacred Area
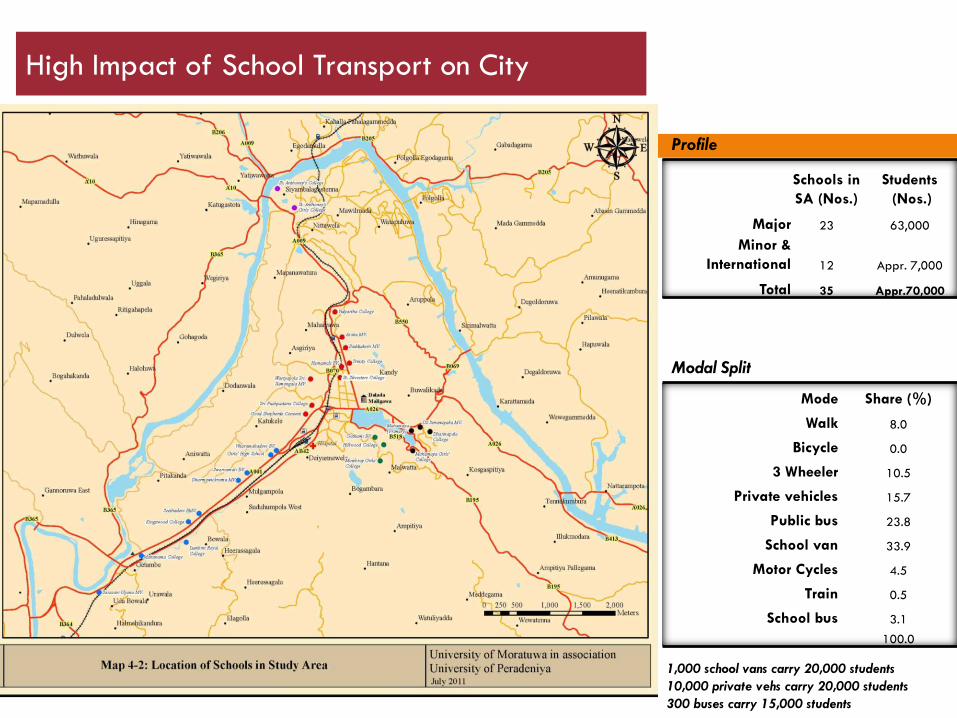
High Impact of School Transport on City
Mode Share (%)
Walk 8.0
Bicycle 0.0
3 Wheeler 10.5
Private vehicles 15.7
Public bus 23.8
School van 33.9
Motor Cycles 4.5
Train 0.5
School bus 3.1
100.0
Modal Split
Schools in
SA (Nos.)
Students
(Nos.)
Major 23 63,000
Minor &
International 12 Appr. 7,000
Total 35 Appr.70,000
Profile
1,000 school vans carry 20,000 students
10,000 private vehs carry 20,000 students
300 buses carry 15,000 students
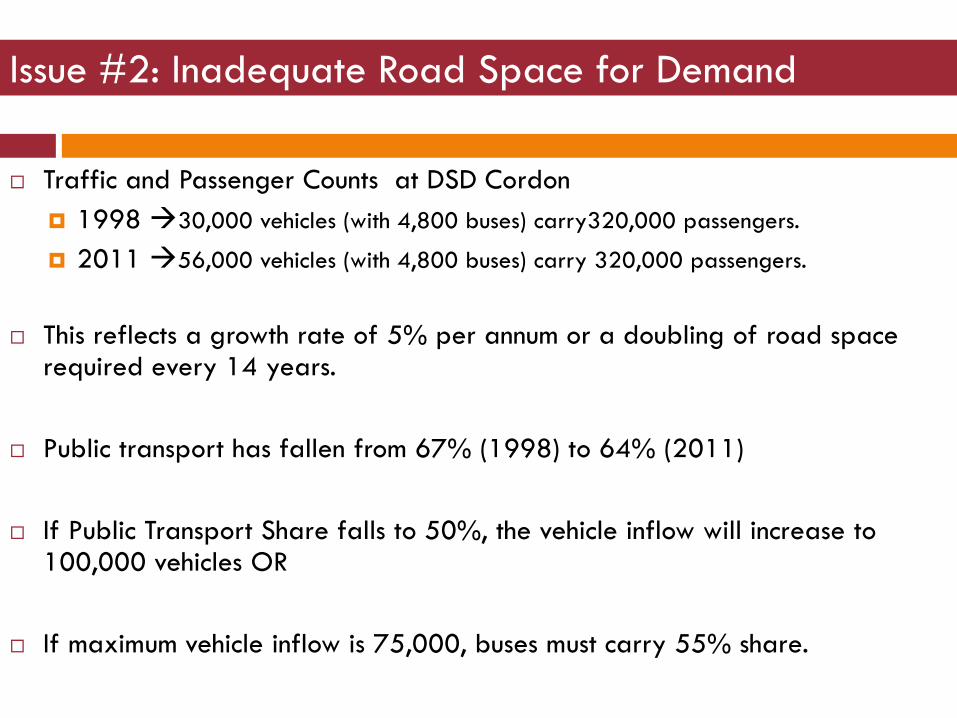
Issue #2: Inadequate Road Space for Demand
Traffic and Passenger Counts at DSD Cordon
1998 30,000 vehicles (with 4,800 buses) carry320,000 passengers.
2011 56,000 vehicles (with 4,800 buses) carry 320,000 passengers.
This reflects a growth rate of 5% per annum or a doubling of road space required every 14 years.
Public transport has fallen from 67% (1998) to 64% (2011)
If Public Transport Share falls to 50%, the vehicle inflow will increase to 100,000 vehicles OR
If maximum vehicle inflow is 75,000, buses must carry 55% share.
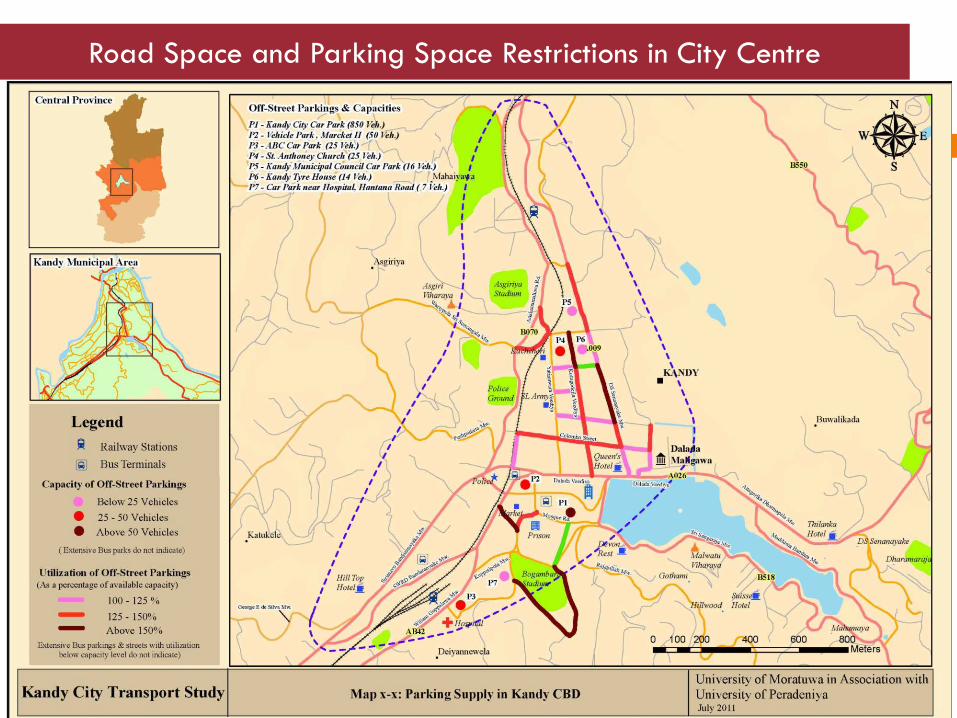
Road Space and Parking Space Restrictions in City Centre
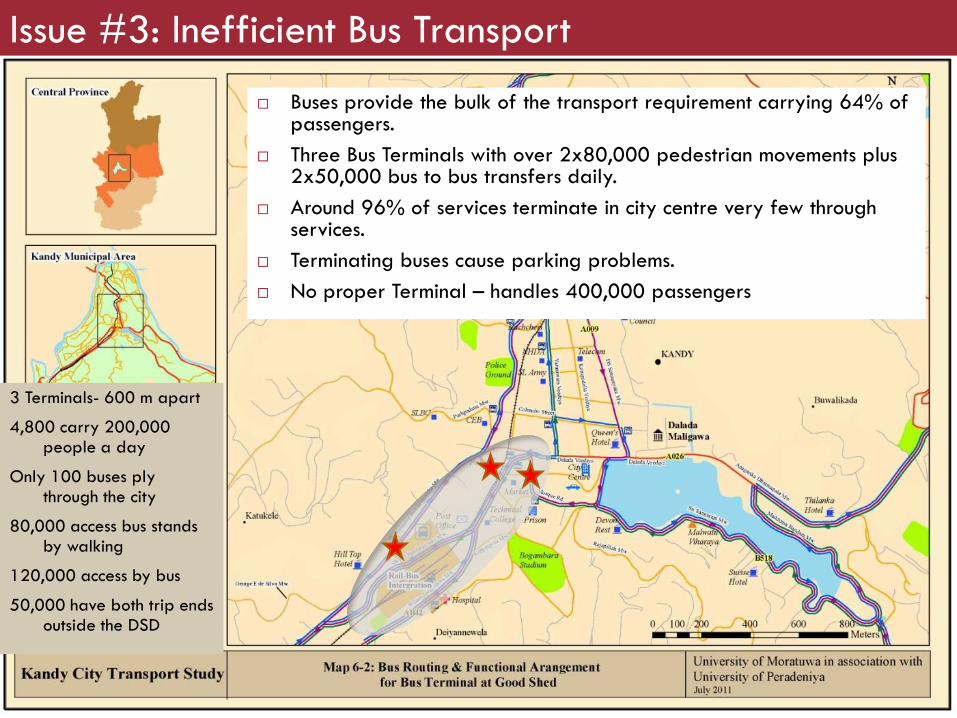
Issue #3: Inefficient Bus Transport
3 Terminals- 600 m apart
4,800 carry 200,000 people a day
Only 100 buses ply through the city
80,000 access bus stands by walking
120,000 access by bus
50,000 have both trip ends outside the DSD
Buses provide the bulk of the transport requirement carrying 64% of passengers.
Three Bus Terminals with over 2x80,000 pedestrian movements plus 2x50,000 bus to bus transfers daily.
Around 96% of services terminate in city centre very few through services.
Terminating buses cause parking problems.
No proper Terminal – handles 400,000 passengers
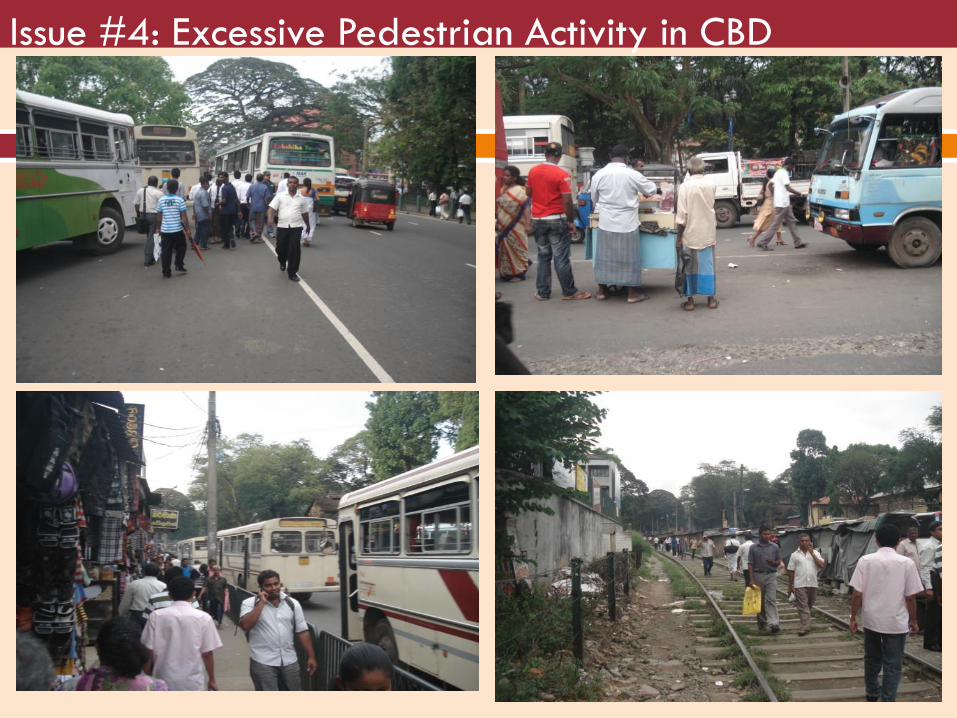
Issue #4: Excessive Pedestrian Activity in CBD
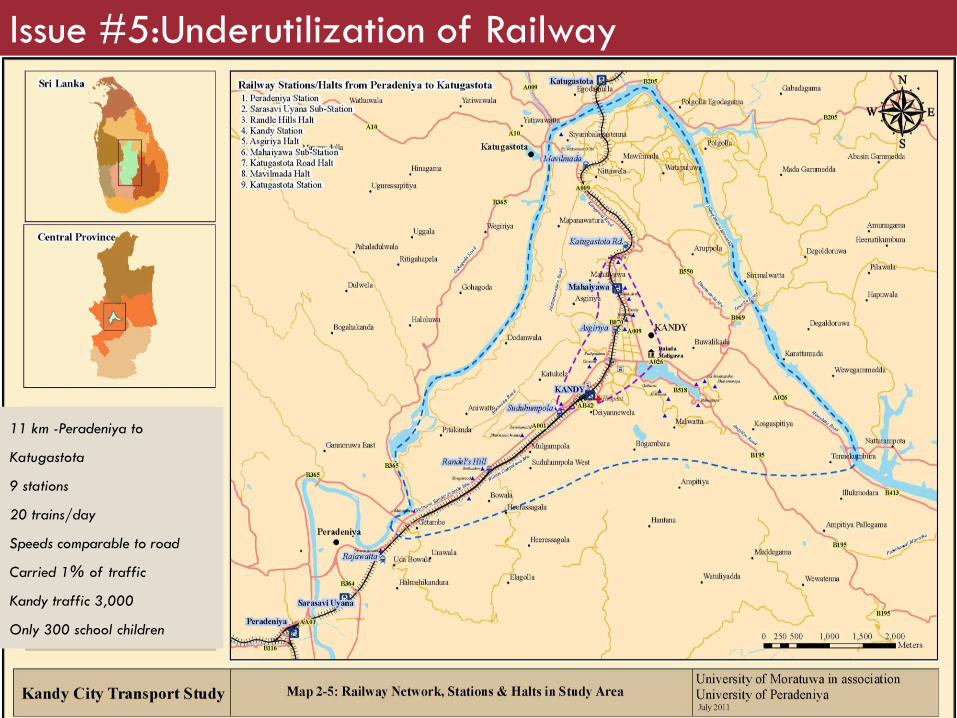
Railway
Peradeniya to Katugastota is 11 km with
11 km -Peradeniya to
Katugastota
9 stations
20 trains/day
Speeds comparable to road
Carried 1% of traffic
Kandy traffic 3,000
Only 300 school children
Issue #5:Underutilization of Railway
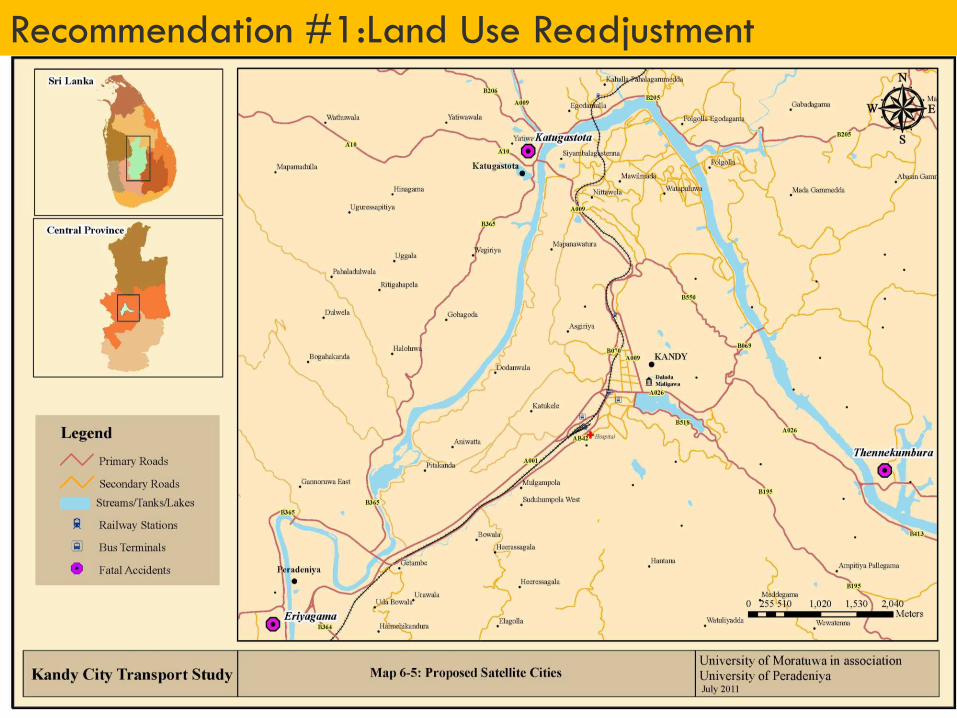
Recommendation #1:Land Use Readjustment
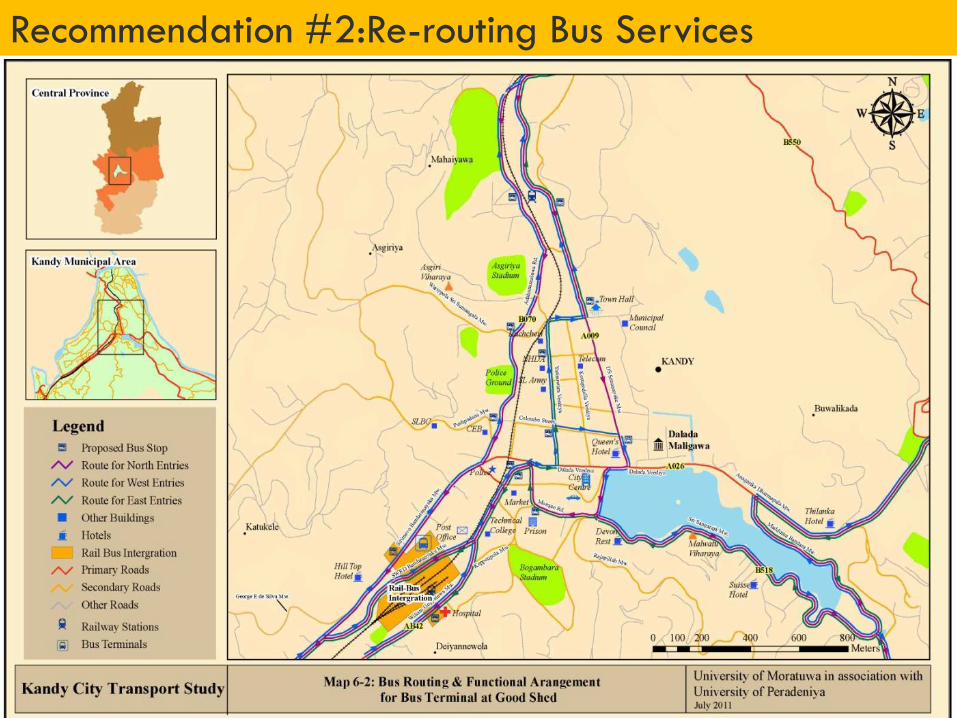
Recommendation #2:Re-routing Bus Services
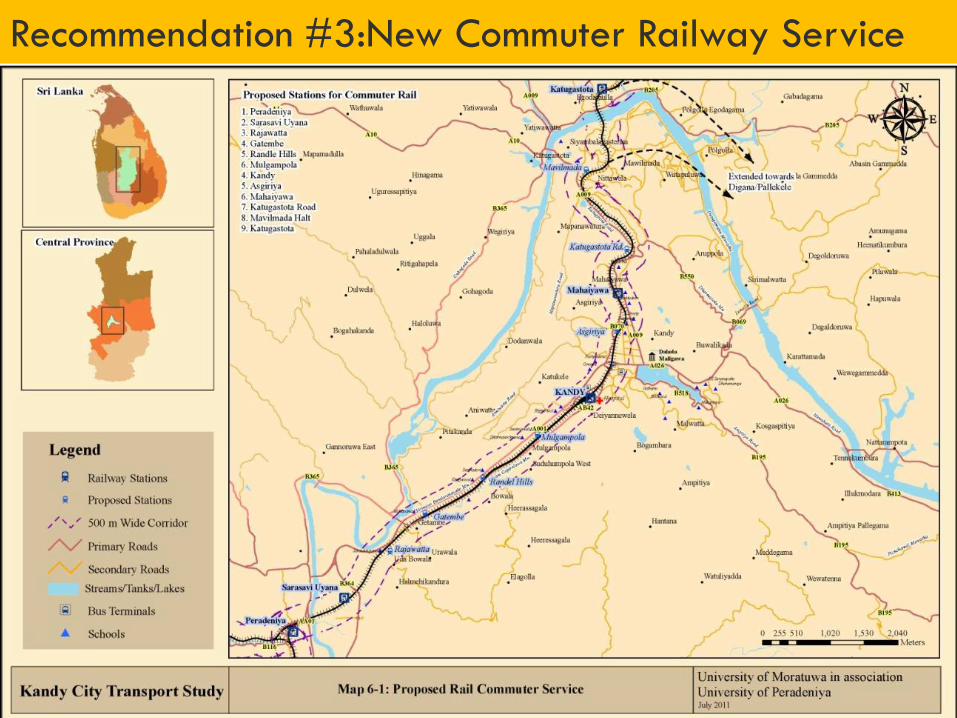
Recommendation #3:New Commuter Railway Service
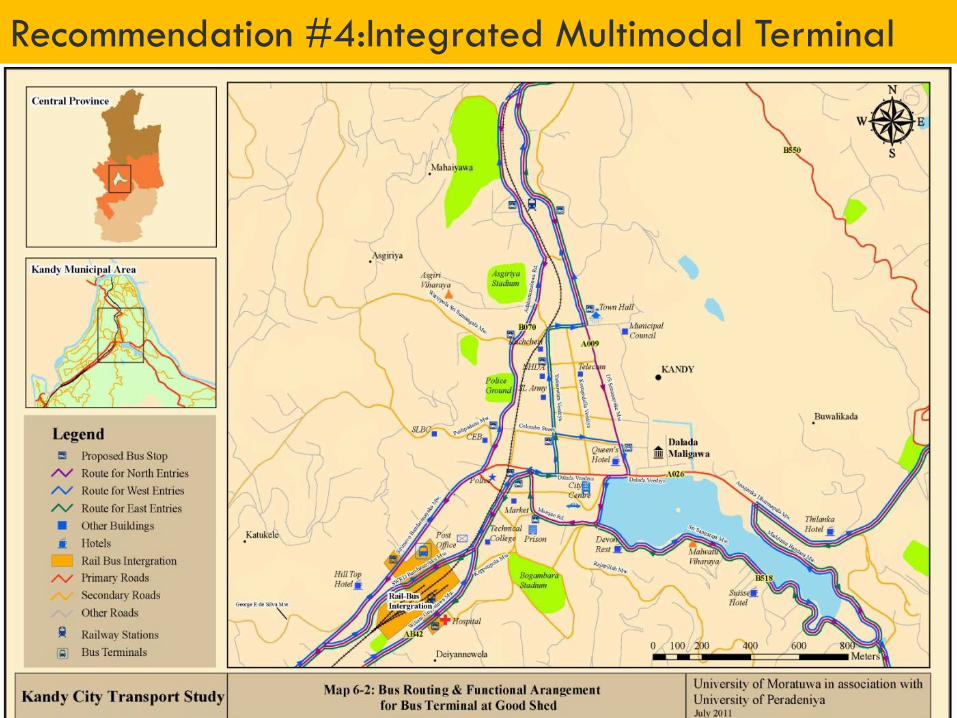
Recommendation #4:Integrated Multimodal Terminal
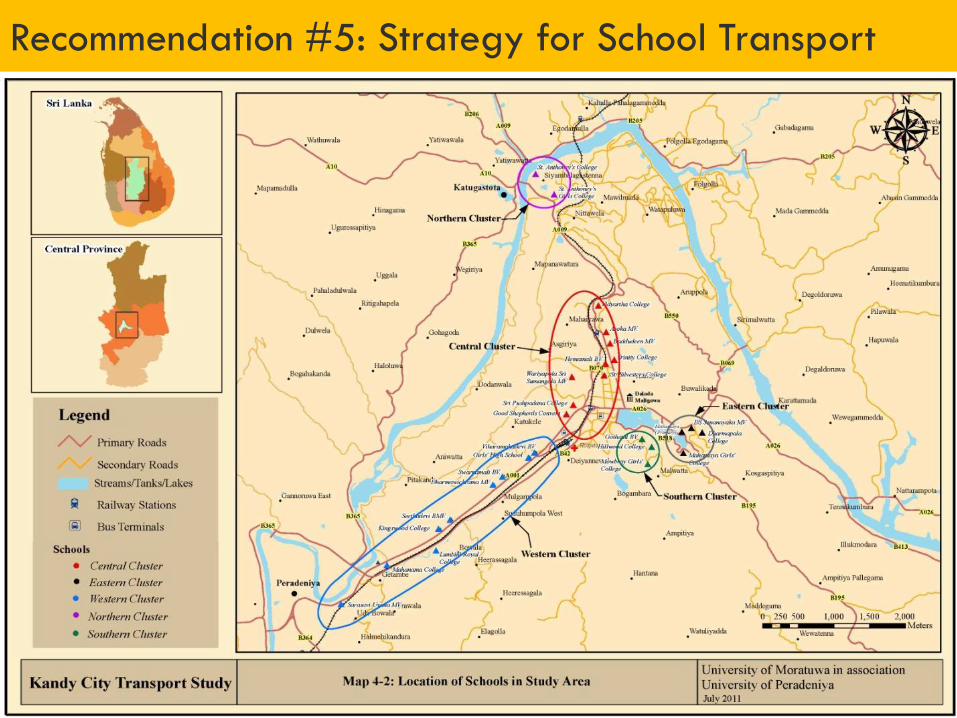
Recommendation #5: Strategy for School Transport
Pedestrian Walkways
Parking
Regulating School Transport
Traffic Restraints
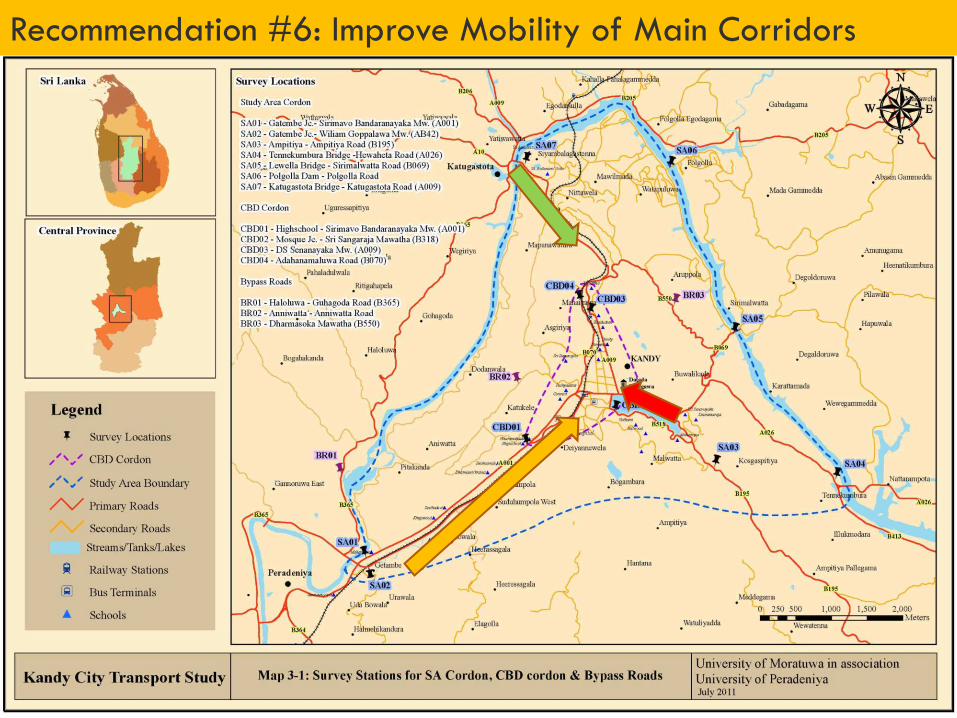
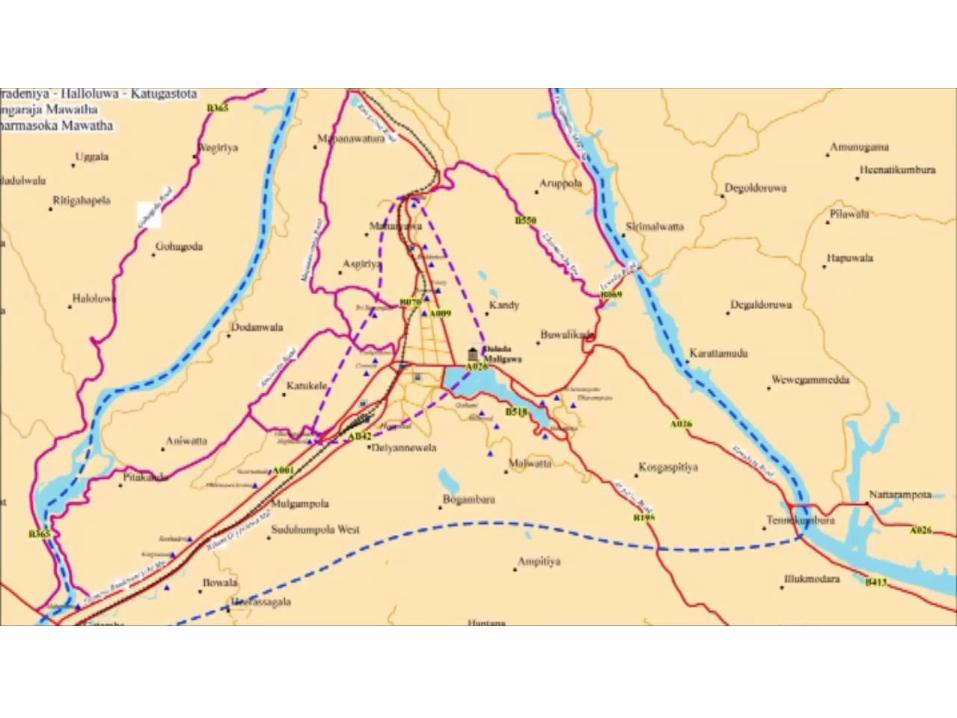
Recommendation #6: Improve Mobility of Main Corridors
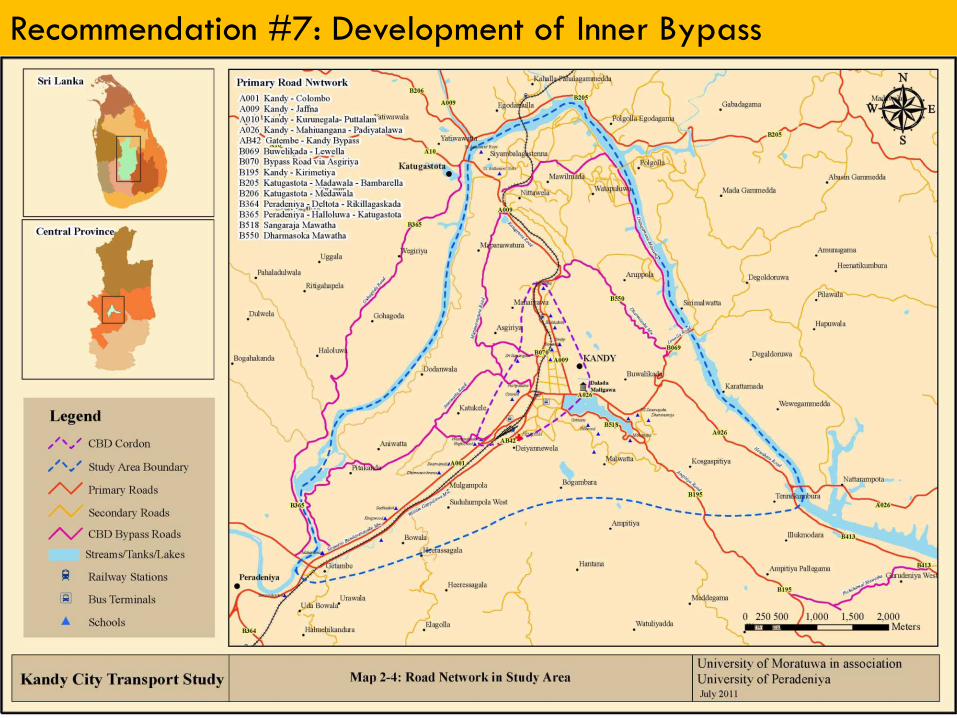
Recommendation #7: Development of Inner Bypass
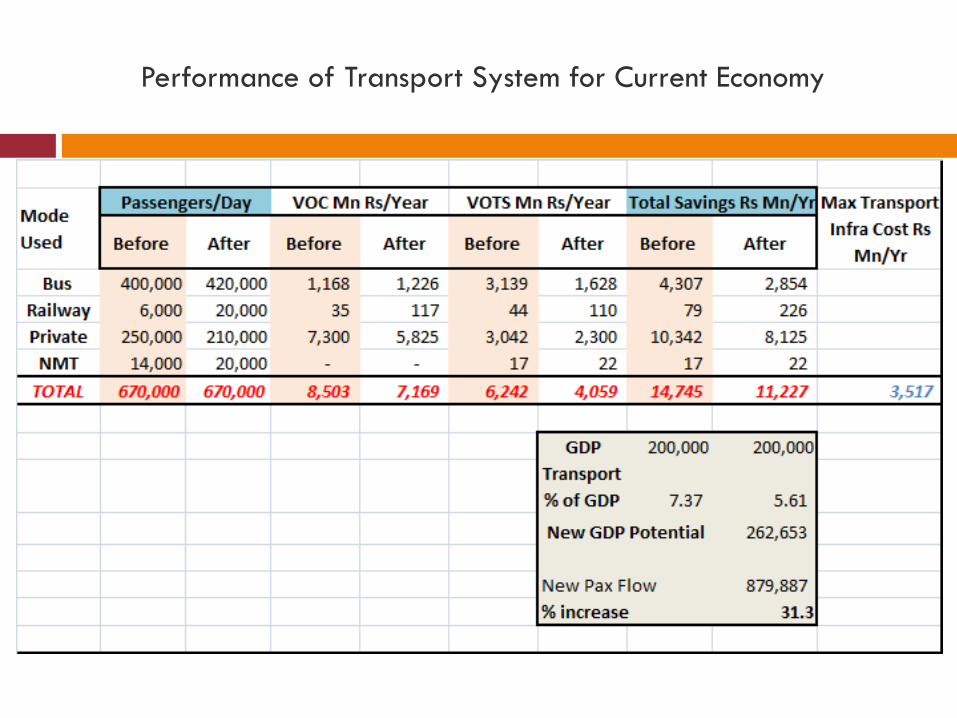
Performance of Transport System for Current Economy
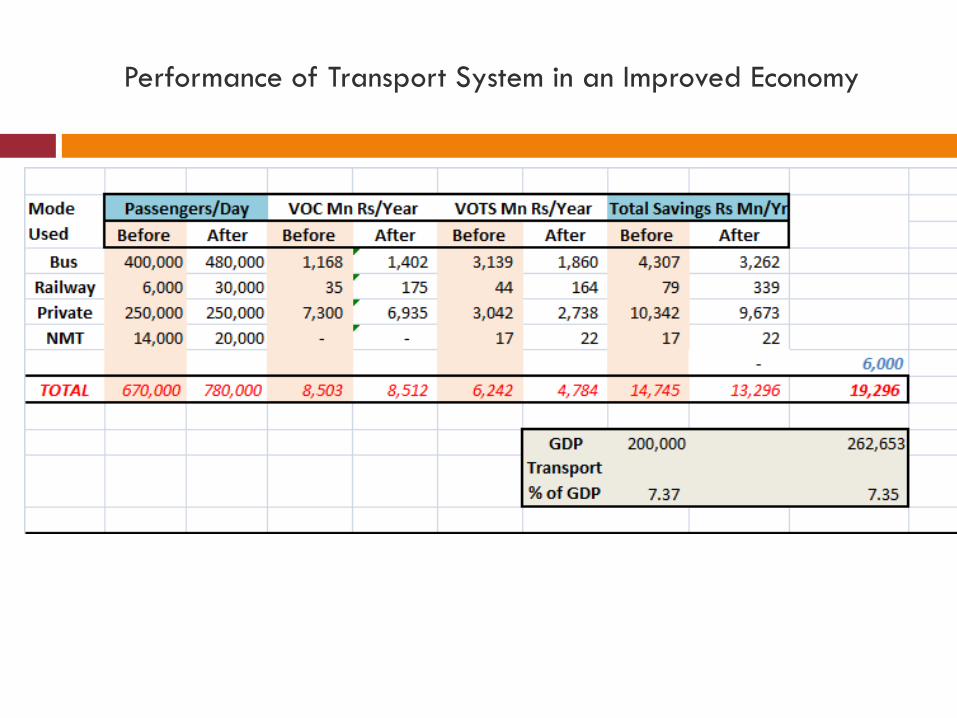
Performance of Transport System in an Improved Economy
Thank You
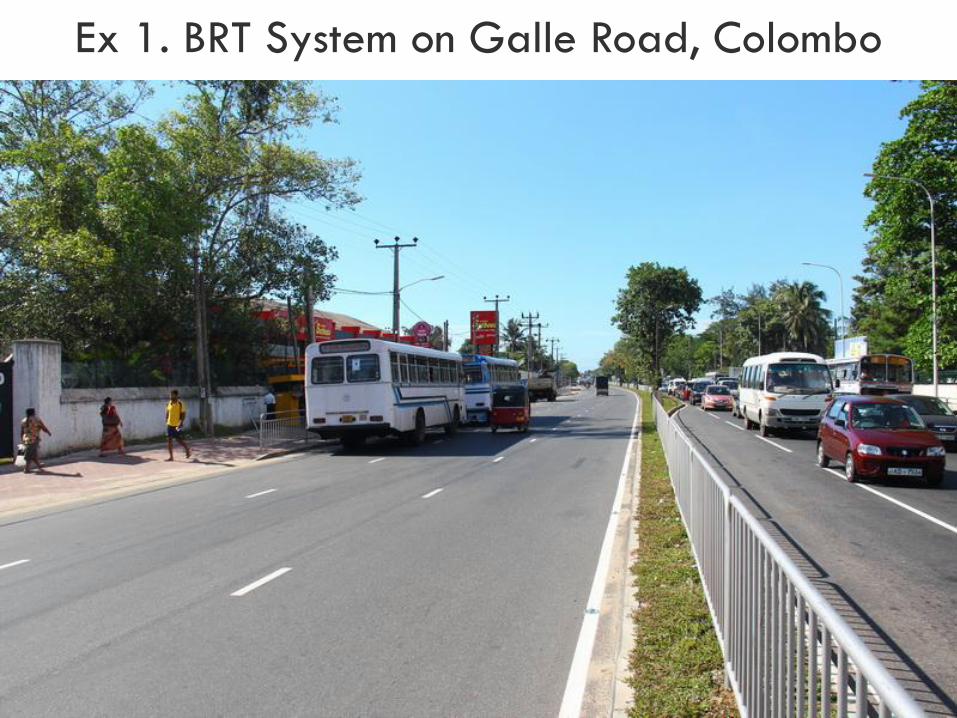
Ex 1. BRT System on Galle Road, Colombo
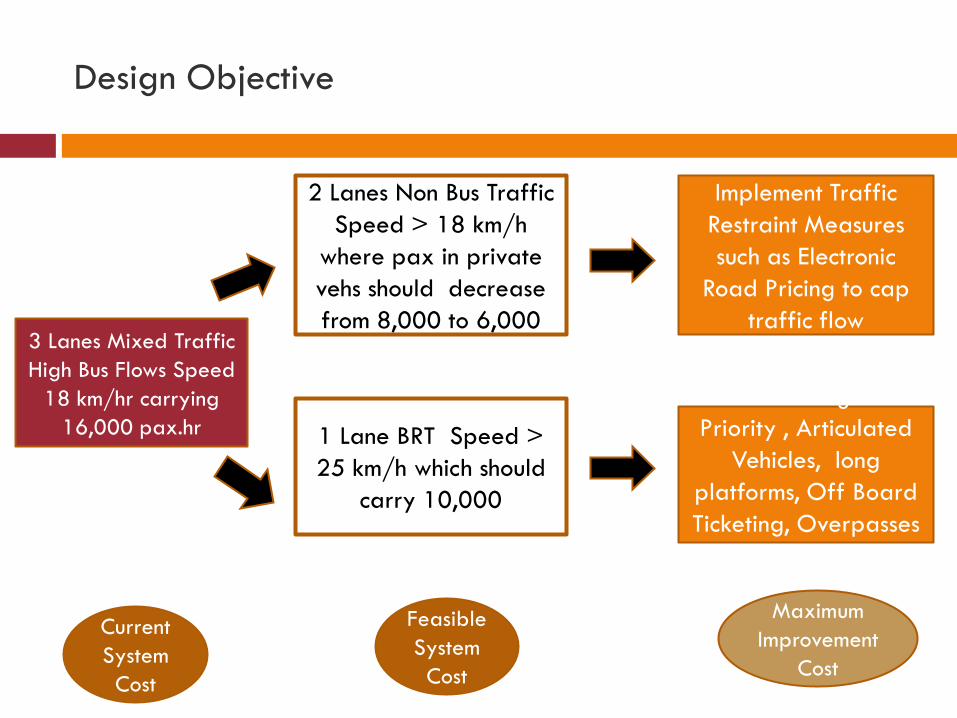
Design Objective
3 Lanes Mixed Traffic
High Bus Flows Speed
18 km/hr carrying
16,000 pax.hr
2 Lanes Non Bus Traffic
Speed > 18 km/h
where pax in private
vehs should decrease
from 8,000 to 6,000
1 Lane BRT Speed >
25 km/h which should
carry 10,000
Provide Signal
Priority , Articulated
Vehicles, long
platforms, Off Board
Ticketing, Overpasses
to keep 28 km/hr
Implement Traffic
Restraint Measures
such as Electronic
Road Pricing to cap
traffic flow
Current
System
Cost
Feasible
System
Cost
Maximum
Improvement
Cost
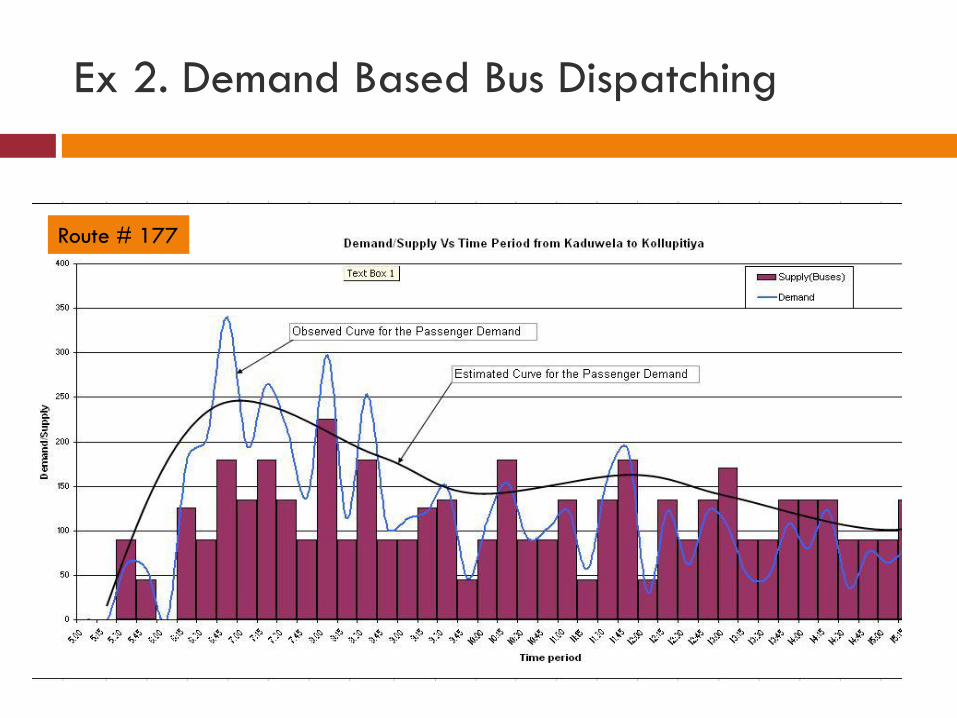
Ex 2. Demand Based Bus Dispatching
Route # 177
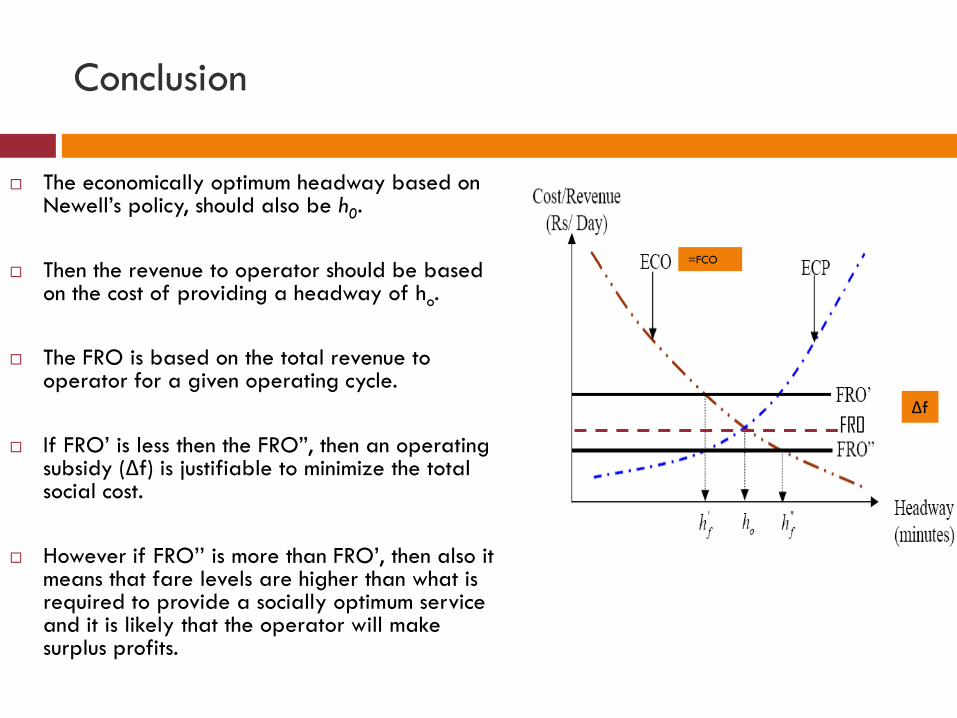
Conclusion
The economically optimum headway based on Newell’s policy, should also be h0.
Then the revenue to operator should be based on the cost of providing a headway of ho.
The FRO is based on the total revenue to operator for a given operating cycle.
If FRO’ is less then the FRO”, then an operating subsidy (Δf) is justifiable to minimize the total social cost.
However if FRO’’ is more than FRO’, then also it means that fare levels are higher than what is required to provide a socially optimum service and it is likely that the operator will make surplus profits.
=FCO
Δf FRO

Thank You


![Revitalizing the Brand[1]](https://img.pdfslide.net/doc/110x75/546aa096af79596c298b47b0/revitalizing-the-brand1.jpg)