Embed Size (px)
Citation preview

Internal Guide:
Dr. PRADEEP. P. LODHA
Associate Professor & Head
Civil Engineering,
G.E.C.Valsad
ANALYSIS OF RUNOFF FOR VISHWAMITRI RIVER WATERSHED USING
REMOTE SENSING AND GEOGRAPHIC INFORMATION SYSTEM
“National Conference on Transportation and Water resources
Engineering (NCTWE-2015)”
Prepared By:
VISHVAM PANCHOLI
(ME-WRM)
L.D.College of Engineering

Contents
Concept of Watershed & Watershed Management Importance of RS & GIS Introduction to study area Thematic maps with classification Estimation of Runoff using SCS-CN method Calculation of Rainfall-Runoff & Result References

Watershed :
It is necessary to know the various Characteristics need to be identified for Management & Planning of watershed.
Characteristics of Watershed:
1) SLOPE 2) PHISIOGRAPHY
3) DRAINAGE 4) GEOLOGY & SOILS
5) SIZE 6) CLIMATE
7) SHAPE 8) VEGETATION
These Characteristics are very useful for Watershed Management study.

Importance of Watershed management 1) WM is used to Conservation, Development and optimal utilization of land
and water resources for benefit to people.
2) Land Development (Agriculture, Forest etc.)
3) Development of Water Harvesting Structures
i). Check Dam
ii). Recharge well
iii). Recharge bore stone pitching
4) Nursery Rising
i). Timber
ii). Fuel Wood
iii). Horticultural Species.
5) Drinking water Facilities
6) Controlling Degradation of land (such as Erosion Control)
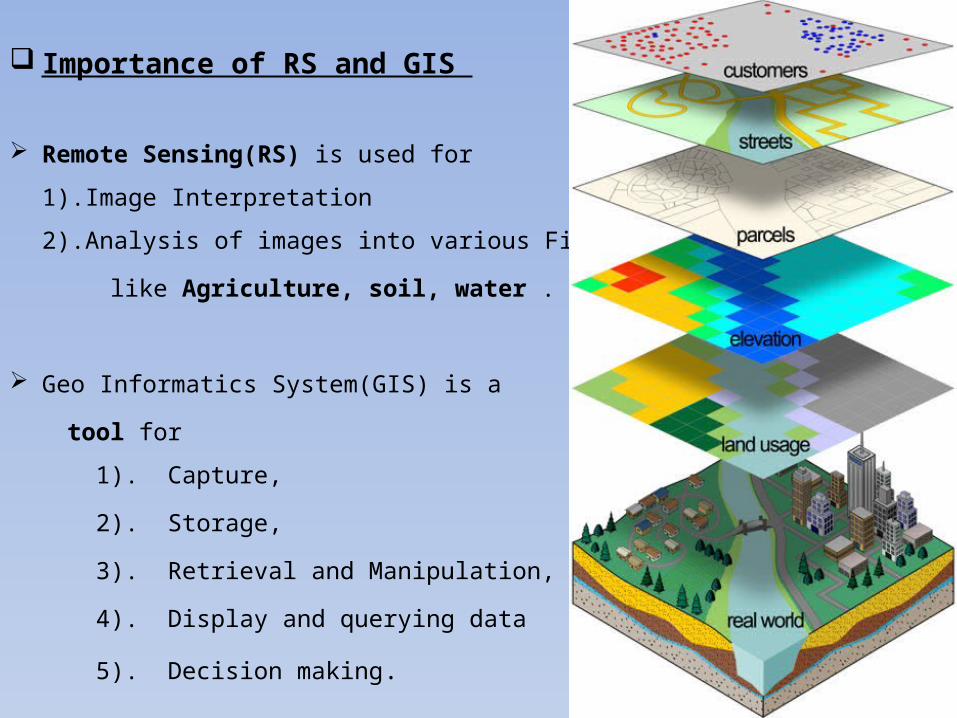
Importance of RS and GIS
Remote Sensing(RS) is used for
1).Image Interpretation
2).Analysis of images into various Fields
like Agriculture, soil, water .
Geo Informatics System(GIS) is a
tool for
1). Capture,
2). Storage,
3). Retrieval and Manipulation,
4). Display and querying data
5). Decision making.

Introduction to Study Area
Vishwamitri River Watershed is located between 22o 00’ and 22o 45’ of North Latitude and 73
00’ and 73 45’ of East Longitude in Panchmahal and Vadodara, in Gujarat State.
It originates in the hills of Pavagadh. The Vishwamitri flows west through the Vadodara city
and empties into the Gulf of Khambat.
Annual rainfall varies from 850 to 1000 mm.

Study Area
The total area of the Vishwamitri watershed is 1185 km2 .

Methodology
1. Preparation of Thematic maps (Land use/Land
cover, Soil, Slope) using ArcGIS Software 9.3.
2. Calculation of Average annual runoff using
SCS Curve number Method.

Thematic maps prepared at BISAG
ME-WRM(130280712013)

Land use map with classification
Sr.noLand use type Area in
sq.km
1 Agriculture 931.14
2 Built up 121.81
3 Forest 3.33
4 Waste land 51.51
5 Water bodies 36.68
6 Others 40.52
1185.0

Soil map with classification
Sr.no soil typeArea in sq.km
1 Very fine sand 126.3
2 Fine sand 826.0
3 Fine loamy 177.1
4 Coarse loamy 55.7
1185.0

Estimation of Runoff using
SCS CN method

METHODOLOGY

Introduction to SCS-CN Method
The SCS Curve Number method is developed by the United States Department of Agriculture (USDA).
This method used for estimating excess runoff from rainfall (Hjelmfelt,1991).
SCS CN Runoff Equation
or for P > 0.2S (1)Where,Q= Runoff in mm;P= Rainfall in mm; Ia = initial abstraction; (Ia=0.2S)S = potential maximum retention after runoff begins;
(2) Where, CN is Curve Number
Curve Number (CN) is determined based on land use, Hydrological Soil Group, and Antecedent Moisture Condition.
Curve Number (CN) is dimensionless number ranging from 0 to 100.

Hydrological Soil Group
• HSG is expressed in terms of four groups (A, B, C, D) according to the soil’s infiltration rate.The HSG is defined by the SCS soil scientists.
Table 1 USDA-SCS Soil Classification
HSG Types of Soil Soil TexturesRunoff
PotentialMinimum Rate of
Infiltration (mm/hr) Water Transmission
A Deep,well drained soilssand,loamy sand or
Sandy loamLow 7.62 - 11.43
High rate
(0.30 in/hr)
BModerately deep, well drained with moderately fine to coarse
texturessilt loam or loam Moderate 3.81 - 7.62
Moderate rate
(0.15-0.30 in/hr)
C Moderately fine to fine textures Sandy clay loam Moderate 1.27 - 3.81Low rate
(0.05-0.15 in/hr)
D
Soil which swell significantly when wet, heavy plastic and soil with a permanent high
water table
clay loam,silty clay loam,sandy
clay,silty clay,clayHigh 0 - 1.27
Very Low rate
(0-0.05 in/hr)

According to the present study, it consist mainly Fine, very fine loamy, sandy loam, and Clay loamy soils are present.
According to Technical Release (TR-55) fine, very fine loamy & sandy clay loam are in Category ‘C’ . Coarse loamy soils are in Category ‘D’. As per soil classification Category ‘C’ & ‘D’ has Highest Runoff potential.
Hydrologic soil group map of the vishwamitri watershed is prepare using union tool in Arc GIS software. The table will show (%) of area covered by HSG map.
Table 2. (%) of area as per HSG
Sr.no Type of soil % of area
1 C 95.3
2 D 4.7

Antecedent Soil Moisture condition (AMC)
(AMC) refers to the water content present in the soil at a given time. It is very important factor for determine final CN value.
It labeled as I, II, III according to soil conditions and rainfall limits for dormant and growing seasons.
Table 3 Classification of AMC condition( Ref-TR-55)
AMC
GroupSoil Characteristics
Total 5 day Antecedent rainfall
(mm)
Dormant SeasonGrowing
Season
1Soils are dry not to wilting point, cultivation
has taken place<13 <36
2 Average Condition 13-28 36-53
3
Heavy or light rainfall and low temperatures
have occurred within the last 5 days;
saturated soils
>28 >53

In present study average condition (AMC-II) is taken for determine CN value for vishwamitri river watershed.
SCS method is originally designed for use in watersheds of 15 km2, it has been modified for application to larger watersheds by weighing curve numbers with respect to watershed area.
The equation of weighted curve number is Given Below.
Where CNw is the weighted curve number;
CNi is the curve number from 1 to any number N; Ai is the area with curve number CNi;
A is the total area of the watershed. The Runoff curve Numbers for all Hydrologic soil cover for different
land use derived in Table 4 .

Table 4 Runoff curve numbers (AMC II) for hydrologic soil cover
Sr.No
Land useHydrologic Soil Group
A B C D
1 Agriculture 72 81 88 91
2 Double Crop 62 71 88 91
3 Plantation 45 53 67 72
4 Commercial 89 92 94 95
5 Industrial 81 88 91 93
6 Urban 89 92 94 95
7 Village 72 82 87 91
8 Land with scrub 36 60 73 79
9 Land without scrub 45 66 77 83
10 Scrub forest 33 47 64 67
11 Canal 100 100 100 100
12 River 97 97 97 97
13 Reservoir 100 100 100 100
14 Prosophis 61 70 74 78
15 Quarry 71 87 89 91
(Source: - TR 55, 1986)

Weighted Area Curve Number for Study area
Different layers of land use/Land Cover, Soil, HSG were added in Attribute table was using ArcGIS 9.3.By using Union tool box of the above layers are prepared.
Calculated value of CN is 88.14 (taking CN=88 )for Runoff calculation.Table 5 Calculation of Weighted Curve Number for AMC II
Land use Soil
type
CN Area in
km2
%of Area %of Area*CN (WCN)
Agriculture C 88 883.26 74.54 6559.23
88.14
D 91 47.89 4.04 367.73
Buit up C 94 119.51 10.08 947.99
D 95 2.31 0.194 18.50
Waste land C 77 49.90 4.211 324.27
D 83 1.60 0.135 11.23
Forest C 77 3.2 0.2695 20.75
D 83 0.140 0.011 0.977
Waterbodies C 100 34.96 2.95 294.98
D 100 1.72 0.15 14.54
Others C 74 38.53 3.25 240.59
D 78 1.99 0.17 13.11

Thiesson polygon used for Average precipitation A.M. Thiesson (1911) suggested this method in which weighing effect of
area in the area in the form of polygon closet to the station has been taken into account.
Thus it tries to eliminate the error due to non-uniform distribution of rain gauges.
The average precipitation of the area is given byP =
Thus, in general starting for 1 to n stations,
Where, A1, A2… An = Areas of the Thiesson polygon of the stations 1, 2… n.
P1, P2… Pn = Precipitations of corresponding stations.
A = Total area of the watershed

For analysis, Rain gauge stations which are nearer to the bank of river vishwamitri are taken in the study area.
Here mainly 5 rain gauge stations are covered entire watershed area of Vishwamitri River.
Figure 3 Rain gauge station Figure 4 Thiesson polygon map

Rainguage station is used to measure average precipitation for the entire watershed area.
Daily runoff will calculated using average precipitation. Thiesson polygon is drawn using Arc GIS 9.3 (Figure 4). It will automatically give an area from their attribute table shown below in
Table 6 .
Table 6. Area divided by Thiesson Polygon
No. Station Name Area in sq.km
1 Halol 153
2 Wadala tank 272
3 Vadodara 247
4 Waghodia 302
5 Pilol 211
Total area 1185

In Present study average rainfall and runoff for the period of (1990-2013) shows increasing over the Vishwamitri River Watershed shows below.
Table-7 Average Rainfall-Runoff for study area
Year Rainfall
(mm)
Runoff
(mm)
1990 898.7 288.1
1991 676.7 223.6
1992 594.9 91.9
1993 2170.2 603.5
1994 1220 390.4
1995 582.62 332.01
1996 1078.9 407.7
1997 939.7 294
1998 928.33 315.71
1999 336.28 49.49
2000 431.7 126.3
2001 691.9 185.2
Year Rainfall
(mm)
Runoff
(mm)
2002 687.5 291.8
2003 934.9 281.2
2004 854.8 261.2
2005 1547.96 800.19
2006 1357.3 548.6
2007 899 252.2
2008 1012 261.1
2009 437.38 99.25
2010 1036.6 340.2
2011 1106.1 350.1
2012 775.08 242.06
2013 1555 639.7
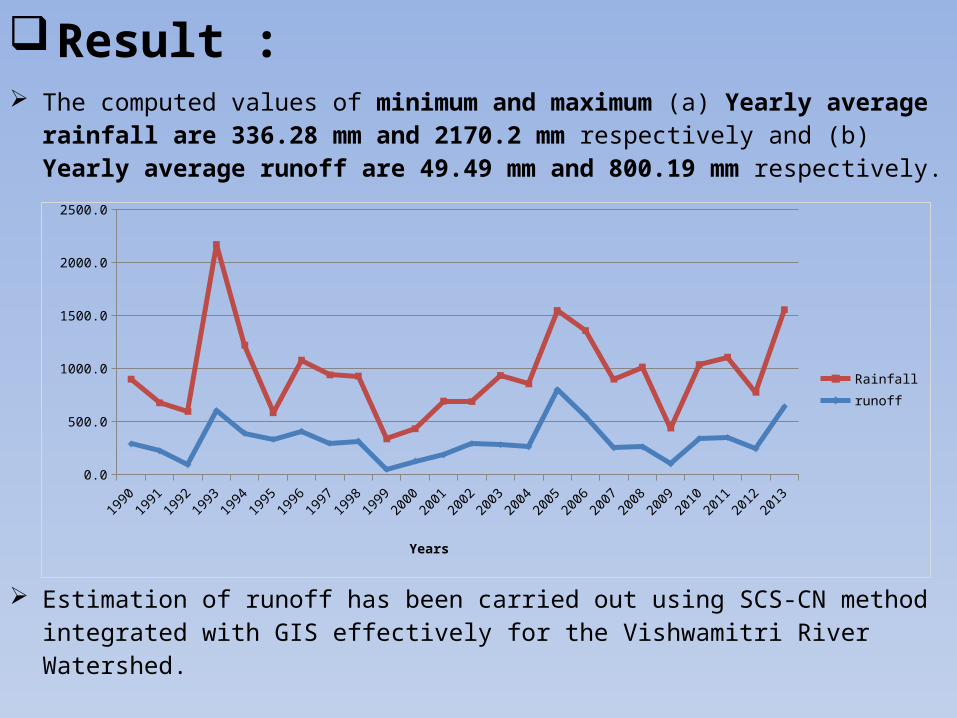
Result : The computed values of minimum and maximum (a) Yearly average rainfall are
336.28 mm and 2170.2 mm respectively and (b) Yearly average runoff are 49.49 mm and 800.19 mm respectively.
Estimation of runoff has been carried out using SCS-CN method integrated with GIS effectively for the Vishwamitri River Watershed.
1990 1991 1992 1993 1994 1995 1996 1997 1998 1999 2000 2001 2002 2003 2004 2005 2006 2007 2008 2009 2010 2011 2012 20130.0
500.0
1000.0
1500.0
2000.0
2500.0
Rainfallrunoff
Years

References:Abhijit M.Zende, Nagarajan R, Atal K.R., “Analysis of Surface runoff from Yerala River Basin using SCS-CN and GIS”,
International journal of Geomatics and Geosciences, Vol 4,No 3,2014.
Agricultural Handbook Number 537, “Prediction Rainfall Erosion losses- A guide to conservation Planning”,
U.S.Department of Agriculture, Dec-1978
Ashish Bansode, K. A. Patil, “Estimation of Runoff by using SCS Curve Number Method and Arc GIS”, IJSER,
Vol 5, Issue 7, July-2014, ISSN 2229-5518.
Ashish Pandey, P.P. Dabral, V.M. Chowdary, B.C.Mal., “Estimation of Runoff for Agriculture watershed using SCS
curve number and GIS”. Page 1-5
A.S.Ravikumar, H.B.Balakrishna, B.K.Anand, Watershed management and Impact of Environmental changes on
Water Resources-Page no-512-521.
Biswas et.al, 1999. Prioritization of Sub watershed based on Morphometric Analysis of Drainage Basin: A remote
sensing and GIS approach Journal of the Indian Society of Remote Sensing, (pg.155-166).
Ghanshyam Das (2000): Hydrology & Soil Conservation Eng. Prentice Hall of India, New Delhi.
Handbook of Hydrology (1972), Soil Conservation Department, New Delhi.
Murthy JVS. Watershed Management In India,(pg.21-34).
Pramod Kumar, K.N.Tiwari, D.K.Pal, 1991. Established SCS Runoff curve number from IRS digital data base, journal
of Indian Society of Remote Sensing vol.19,No.4.
Smith and Wischmer (1941), Interpretation of soil conservation data for field use. Agriculture Engineering (page
no .173-175)
Technical Release-55 , Manual for small urban watershed, 1986.


![Comparison of rainfall runoff simulation by SCS- CN and NAM model in Shipra …2019. 8. 26. · (Das, 2012) [4]. Important need of rainfall runoff modelling for practical problem in](https://img.pdfslide.net/doc/110x75/6149d24f12c9616cbc6902f5/comparison-of-rainfall-runoff-simulation-by-scs-cn-and-nam-model-in-shipra-2019.jpg)