Embed Size (px)
Citation preview

© 2015 Environmental Risk Communications, Inc.
Contact:
John Rosengard(415) 336-5085
www.erci.com
Fair Value Measurement of Environmental Liabilities
March 2015

© 2015 Environmental Risk Communications, Inc.
Outline for Today’s Webinar
Speaker’s Bio and Elevator Speech
Fair Value Measurement in GAAP
Why Transition to Fair Value Measurement
ERCI Observations
How to Document Fair Value Measurement
Q&A

© 2015 Environmental Risk Communications, Inc.
Speaker Background: John Rosengard
Wrote Defender™ liability forecasting software package
Environmental remediation liabilities (ASC 410-30) Asset retirement obligations (ASC 410-20) Due diligence on acquisitions and divestitures Watch list for future reserve increases (sites &
portfolios) Decision analysis on individual sites Pollution remediation obligations (GASB49) Counterparty (PRP) default tracking
We support Corporate remediation groups PRP groups Port authorities The engineering/consulting and legal partners Their internal and external auditors
MBA, Northwestern; BS, Georgetown
John RosengardPresident & CEO, [email protected], CA

© 2015 Environmental Risk Communications, Inc.
Elevator Speech: How/Why on FVM
What
“Market price”, since 2006, preferred basis for pricing liabilities, per GAAP.
Why
Common sense. Potentially validated by a counterparty, not a regulator.
And it might be free. Factor in deferred tax assets, full spectrum of cost recoveries, and avoidable escalation (lifecycle oversight, counterparty default, remedy failure)
How
Stop equating cleanup projects/budgets with environmental liabilities.
“Think like a counterparty” when we value an environmental liability. Understand why they would take on a liability; after all, this is how your company bought into the liabilities in the first place.

© 2015 Environmental Risk Communications, Inc.
Fair Value Volatility
six months
Fair value of environmental restoration cost
Fair value of operating asset
Fair value of environmental restoration cost
Fair value of operating asset
@ $100/barrel
@ $50/barrel
Takeaway: an asset that is operating profitably in 2013 can justify a small (present value) cost for restoration:-Indefinite “date of settlement”-Unknown future cleanup levels-Unknown future source (soil, GW)
Decommission or sell off an unprofitable asset in 2015, the environmental costs are:-Settled now-Based on current cleanup regulations-Based on today’s source knowledge
$5MM ($.5MM) $2MM ($3MM)

© 2015 Environmental Risk Communications, Inc.
Conceptual Framework
Source: FASB Statement of Financial Accounting Concepts No. 8, September 2010
Enhancing Qualitative
CharacteristicsFundamental Qualitative
Characteristics
Objective of Financial Reporting
Information
Useful to Decisions
Relevant
Predictive value
Confirmatory value
Faithful Representation
Complete
Neutral
Free from error
Elements of Financial
Statements
Comparability
Verifiability
Timeliness
Understandability
Recognition
Measurement
Presentation
Disclosure
Cost Constraint
Materiality Constraint

© 2015 Environmental Risk Communications, Inc.
GAAP Alignment Among Standard Owners
Standard owner FASB GASB IASBFor… US Corporations Govt Agencies Non-US Corp.
Environmental Obligations
ASC 410-30Oct1996
GASB 49Nov2006GASB 18Aug 1993
IAS 37Sep1998
ARO ASC 410-30Oct1996
ProjectOct2016 (est)
IFRIC 1Jul2004
Fair Value ASC 820 -Sep2006
GASB 72 –Feb 2015
IFRS 13 –May2011
Commitments ASC 440 Note in disclosures
IAS 16
Contingencies ASC 450 GASB 10 IAS 37Guarantees ASC 460 GASB 70 IAS 39Nonperformancerisk of counterparty default
ASC 820-10-35-17 and ASC 410-30-30-7
GASB 72, ¶62
IFRS 13:42

© 2015 Environmental Risk Communications, Inc.
What Are Environmental Liabilities (FASB)?
ObligationsASC 410
CommitmentsASC 440
ContingenciesASC 450
GuaranteesASC 460
Liabilities
Consent order to study and remediate a site
Promise to study and/or buy back a site if
contamination is found
Settlement to share past costs at a closed
landfill
Financial assurance instrument (LOC) to
regulator for performance of RCRA
monitoring
Asset retirement obligations

© 2015 Environmental Risk Communications, Inc.
Fair Value Measurement
Defined in FAS 157, now ASC 820 (Sep 2006)
For public agencies, GASB 72 (Feb 2015)
Presume an arm’s length, third party transfer in an orderly market
Three approaches
Market
Cost – best for environmental liabilities
Income
Counterparty risk included (a PRP fails and their liability defaults back to you)
Hierarchy of Inputs (next page)

© 2015 Environmental Risk Communications, Inc.
Fair Value Hierarchy (ASC 820, GASB 72)
Level 1 (preferred): quoted price, active market, identical liabilities
Example: Excavated soil will be “Class C” waste and trucked to landfill for a drive-off cost of $84.50/ton
Level 2: some observable inputs, less-active market, similar liabilities
Example: Operating a 20-gallon/minute groundwater extraction system has an annual utility cost of $8K to $10K
Level 3: unobservable inputs, little (if any) market, unique liabilities
Regulatory approval of the remediation plan may take four years; during that delay, the groundwater plume may expand 0%-25%, depending on rainfall

© 2015 Environmental Risk Communications, Inc.
Outline for Today’s Webinar
Speaker’s Bio and High-Level View
Fair Value Measurement in GAAP
Why Transition to Fair Value Measurement
ERCI Observations
How to Document Fair Value Measurement
Q&A
√

© 2015 Environmental Risk Communications, Inc.
Useful to decisions and decision makers
Eliminates surprises
GAAP Compliant: “relevant”, “faithful representation”
GAAP Compliant: comparable, verifiable, timely, understandable
Focuses spending on liability reduction (not deferral or remedy)
Helps manage knowledge loss
Improves execution on acquisitions and divestitures
Identifies portions of portfolio with long-term recoveries at risk- cost recovery mechanisms in customer contracts, which may be time limited- counterparties in danger of defaulting
Why Transition to Fair Value Measurement

© 2015 Environmental Risk Communications, Inc.
Where Do Liability Disclosures Fit In?
Source: FASB Statement of Financial Accounting Concepts No. 8, September 2010
Enhancing Qualitative
CharacteristicsFundamental Qualitative
Characteristics
Objective of Financial Reporting
Information
Useful to Decisions
Relevant
Predictive value
Confirmatory value
Faithful Representation
Complete
Neutral
Free from error
Elements of Financial
Statements
Comparability
Verifiability
Timeliness
Understandability
Recognition
Measurement
Presentation
Disclosure
Cost Constraint
Materiality Constraint
GAAP Conceptual Framework

© 2015 Environmental Risk Communications, Inc.
Legacy Behaviors: Liabilities not at Fair Value
Date Event12-31-2008 GM environmental reserve: $297 million6-01-2009 GM files Chapter 116-30-2009 GM updates their reserve to $536 million10-20-2010 $773 million for first six settlements12-14-2010 +$25.0 million settlement = $798.0 million3-3-2011 +$28.2 million settlement = $826.2 million3-7-2011 +$50.6 million settlement = $876.8 million3-29-2012 +$23.8 million settlement = $900.6 million6-29-2012 +$39.2 million settlement = $939.8 million
11 settlements = 3.2x reserve, three years$297 million >>> $940 million
Source: USEPA press releases
© 2015 Environmental Risk Communications, Inc.
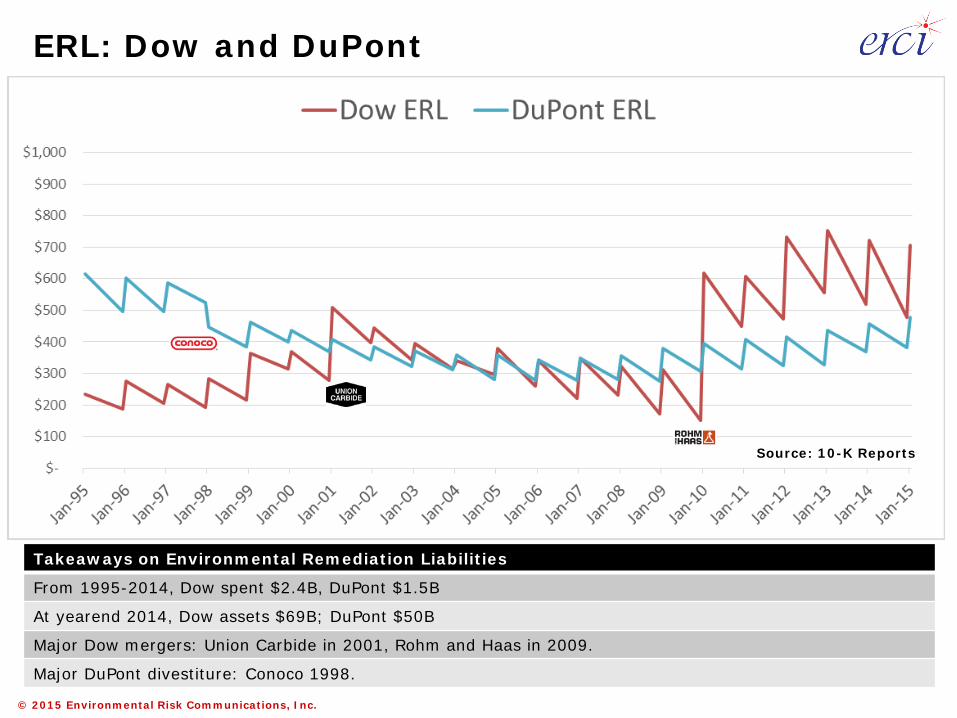
Source: 10-K Reports
ERL: Dow and DuPont
Takeaways on Environmental Remediation Liabilities
From 1995-2014, Dow spent $2.4B, DuPont $1.5B
At yearend 2014, Dow assets $69B; DuPont $50B
Major Dow mergers: Union Carbide in 2001, Rohm and Haas in 2009.
Major DuPont divestiture: Conoco 1998.

© 2015 Environmental Risk Communications, Inc.
If the ERLs were $439M annuities paying $79.6M/yr, they would be yielding 18% (!).
Use a lower discount rate instead, the liability shifts up:
Takeaway: “probably and reasonably estimable” liability balances are not consistent with PV of historical spend
Takeaway: adjust for inflation, distortion worsens
Are Reserve Balances Too Low?
Discount rate justification Discount rate Liability Value“probable and reasonably estimable”
$79.6M/$439M= 18.13%
$439M
NYSE – Price/Earnings Multiplier of 19 (March 2015)
5.27% $1,511M
DuPont pension plan (2014) 4.55% $1,749MDuPont’s cost of LT debt (2015) 2.43% $3,276M
DuPont 2010-2014 1995-2014ERL Spending/year $79.6M $75.4MERL Balance (avg) $439M $422MShelf life (years) =439/79.6 = 5.5 =422/75.4 = 5.6

© 2015 Environmental Risk Communications, Inc.
ERCI’s FAQ on Fair Value Measurement
Quote ERCI’s ReplyFVM applies to valuing assets, like our pension plan investments
FVM applies to liabilities, too. And not just financial instruments.
Our reserve policy generally treats Environmental Liabilities (ASC 410-30) as Contingencies (ASC 450)
FVM applies to Contingencies, too.
Our environmental reserves pass audit every year
Common outcome, but what are the root causes of recent reserve increases? What do we know nowthat we didn’t know before?
Auditors never ask for this; our reserves are immaterial
A statement like “all Obligations, Commitments, Contingencies and Guarantees are at/near market value” needs reliable evidence.
Some answers are privileged and confidential
Balance compartmentalization, privilege with business needs.

© 2015 Environmental Risk Communications, Inc.
Employee compliance with reserve policy is paramount From divestitures: FVM discounts are last-minute surprises From acquisitions: FVM discounts sometimes go unreserved;
field observations never get resolved Purchase accounting window closes after an acquisition
Multiyear budget ≈ reserve, which defaults to ≈ liability Incumbent vendors pricing “their” reserves @ “their” sites Reserve is not current market value of liability
“Don’t know what accounting does with our numbers” “Heave it over the transom” “I can’t explain the number in our SEC 10-K (20-F) report”
“Our auditor is not asking us for this; no one is….” Acceptance of the above
ERCI Observations on FVM

© 2015 Environmental Risk Communications, Inc.
Fair Value Reserve Calculation Example
$0.0
$0.5
$1.0
$1.5
$2.0
$2.5
$3.0
$3.5
$4.0
VendorQuote
RemedyFailure
ProjectManagement
CounterpartyDefault
Fair Value
Vendor QuoteGroundwater P&T System$2M install, $3 M O&MLess 50% in cost sharing= $2.5M
Remedy Failure80% status quo OK20% expand remedy (+$4M, less 50%)= [(80% x 0) +(20% x $2M)] = $0.4M
Project Mgmt10% add-on= $0.3M
Counterparty60% no defaults25% one PRP default, +$1M15% two PRP defaults, +$2M= [(60% x 0) + (25% x $1M) + (15% x $2M)] = $0.6M
$2.5
$3.8
+$0.4+$0.3
+$0.6

© 2015 Environmental Risk Communications, Inc.
How to transition to FVM @ lowest cost
Term Sheet for Each Liability Lifecycle cost projection
Contingencies for changes to scope, schedule and vendor
Premium for full/partial strategy failure
Premium for project management
Premium/discount for counterparty risk
Premium/discount for your company’s own ability to pay
Insurance covering cost escalation, reopener, NRDA risk
Income for brownfield redevelopment
Recovery of current and future spending Asserted and unasserted claims
Income for sunk cost recovery Asserted and unasserted claims
Consequences of deferred tax assets

© 2015 Environmental Risk Communications, Inc.
Fair Value Term Sheet (Reserve = A through F)
Variable Level 1/2/3 inputs: site-specific conditions, KPIs, unit costs
FVM Level
Income Impact
A. Lifecycle cost projection 12 years pump & treat, 10 gpm from 5 wells, three pore volumes of 19 acres
2 -$5.5 million
B. Contingencies for changes to scope, schedule and vendor
25% cost increase for fourth pore volume, doubling well count (to 10) in years 8-12
2 -$1.2 million
C. Premium for full/partial strategy failure
Additional ten years pump & treat for fifth and sixth pore volume
3 -$3.8 million
D. Premium for project management
12 years oversight, legal, contracting, cost recovery work
2 -$2.8 million
E. Premium/discount for counterparty risk
Successor owner has diesel generator onsite; credit rating 620
1 -$1.5 million
F. Premium/discount for your company’s own ability to pay
Fortune 200, credit rating 1085 1 +$0.5 million
G. Insurance for cost cap, etc Self-insuring all cost escalation, reopeners 3 +$0.0 million
H. Income for brownfield Ground lease $500K/yr to 2025 2 +$5.0 million
I. Recovery - current/future costsAsserted and unasserted claims
50% recoverable under Federal contract20% recoverable from legacy owner
2 +$7.4 million+$3.0 million
J. Recovery – sunk costsAsserted and unasserted claims
50% recoverable under Federal contract20% recoverable from legacy owner
1 +$0.5 million+$3.0 million
K. Value of deferred tax assets 30% of items A through F 1 +$4.3 million
Fair Value Components Total OutflowsInflows
Net
-$14.8 million+$23.7 million+$8.9 million

© 2015 Environmental Risk Communications, Inc.
How to Efficiently Transition to FVM
Objective: comply with the duty to display the obligation to management, and possibly to disclose
Build consensus for a Pilot Project Environmental project team Legal department Audit (internal and external) Treasury/Risk Management Board of Directors

© 2015 Environmental Risk Communications, Inc.
How to Efficiently Transition to FVM
Conduct a Pilot FVM Evaluation Project Opportunity Question: what can an acquirer find out/pay out by
2025?
Select a division, plant, asset type; <15% of company 90-day effort; use an FVM term sheet template; document what
contingencies do/don’t cover; learn if the remedy can fail and if so…what is the backup plan and probability
Produce a term sheet for each liability, listing key assumptions Numerical: soil and groundwater volume, cleanup goal(s), unit costs
Regulatory: contaminants of concern, driving regulations, future land use
Counterparties: identity, tentative allocation, current credit rating
Timeline: deadlines, constraints Scorecard: Level 3 answers moved to Level 2; Level 2 to Level 1
Perform “market testing” on select site(s) Ask a vendor to validate a market price to take over a liability
Compare terms and lifecycle costs

© 2015 Environmental Risk Communications, Inc.
How to Efficiently Transition to FVM
Conduct Post-Pilot Evaluation Develop business case for analyzing full portfolio Confirm cost/benefit for level 3, 2 and 1 answers Determine governance and frequency of deep-dive updates
Niche valuation experts or internal staff Three to five year cycles to bridge staff turnover, knowledge loss issues
Develop key performance indicators, phase-in schedule
Make final decision Implement, refine transition plan
Review 20%-33% of portfolio annually (3-5 year cycles) Rebuild forecasts, especially after major transactions Confirm type and approach for each liability (GAAP terms are obligation,
commitment, contingency, guarantee) Reclassify funding type as needed (ARO, OPEX, CAPEX, reserves)
Rebuild exit strategies Reduce the liabilities (“work it down”) Evaluate captive insurance (“fund it, isolate it”)

© 2015 Environmental Risk Communications, Inc.
Best Practices in FVM
Train everyone to use ASC 820 FVM Project managers Key external consultants Corporate leadership, asset managers, property managers Auditors Counsel
Use your spending data to justify -30%/+50% accuracy; reassure cost engineers (“never shoot the messenger”) that uncertainty is expected
Document pro/con of projects and current strategies (“what has to go right” “what can go wrong”)
Factor in strategy failure (starting over), in-kind services
Include sites that are “done”, “new”, “sold”, “never studied”
Include counterparty risk (% allocation grows)

© 2015 Environmental Risk Communications, Inc.
Best Practices: Site Estimates
Common work breakdown structure for all sites in the portfolio
Study, remedial design, remediation, OM&M, legal, project management
For costs >$100K, pinpoint Level 1 and 2 inputs “Four years OM&M after excavation concludes”
“Groundwater P&T system based on two pore volumes; five-year term, single flood event to reach 50gpm design requirement”
“25,000 cubic yards of soil, bulking factor of 1.25 due to high sand ratio, 83 miles to approved disposal facility”
Justification for revising the scenario weighting “Completed decision analysis exercise in June 2016”
“Reweighted the three scenarios after the community advisory board meeting in August and email exchange with regulator in September 2016”
“Operating plant asked that closure construction be synchronized with turnaround project X, now scheduled for Q4-2017”

© 2015 Environmental Risk Communications, Inc.
Outline for Today’s Webinar
Speaker’s Bio and High-Level View
Fair Value Measurement in GAAP
Why to Document Fair Value Measurement
ERCI Observations
How to Document Fair Value Measurement
Q&A √

© 2015 Environmental Risk Communications, Inc.
Resources to Read
ASC 410 – current FASB GAAP on environmental obligations
ASC 820 – current FASB on fair value measurement
GASB 49 – Pollution Remediation Obligations
GASB 72 – Fair Value Measurement and Application
28

© 2015 Environmental Risk Communications, Inc.
Next Steps
Website: www.erci.com
LinkedIn Group – webinar announcements
YouTube page – select webinar recordings
Email [email protected] or call me at (415) 336-5085 PDF of this presentation (original PPTX format on request)
March 2015 webinars on Managing Nonperformance Risk of Environmental Counterparties Obstacles to Recognizing and Measuring Environmental Liabilities
April 2015 webinars on Estimating and Disclosing Environmental Liabilities Auditor’s Tough Questions on Environmental Liabilities Calculating Counterparty Risk on Environmental Liabilities
29