
ck,,,icd mgbacerimg sdence, Vol. 41, No. I. pp. 25-36, 1986. OW9-2509/86 S3.00+0.00 Printed in Great Britain. Pergamon Press Ltd.
A SIMPLIFIED ANALYTICAL MODEL FOR THE RATE OF REACTION OF SO, WITH LIMESTONE PARTICLES
J. S. DENNIS? and A. N. HAYHURST Department of Chemical Engineering, University of Cambridge, Pembroke Street, Cambridge CBZ 3RA,
U.K.
(Receioed 12 February 1985)
Abstract-An analytical solution to the diffusion-reaction equations which describe the sulphation of a calcined limestone particle has been developed and applies for particle sizes typical of those currently fed to fluidized coal combustors. The model gives rates and conversions explicitly as a function of time and yet retains the parameters involved in the detailed mathematical description of a reacting particle. It is demonstrated that all of these parameterscan be evaluated from single experiments in a fluid&d bed in which batches of pre-sized sorbent are sulphated in simulated off-gases containing SO,. The model should readily lend itself to coupling with the equations for bed hydrodynamics to describe the desulphutition of a fluidized hed combustor.
INTRODUCTION
A fluidized bed coal combustor not only provides a compact and efficient method for burning coal, but also a means of reducing sulphurous emissions by adding crushed limestone (CaC03) or dolomite (MgCOJ .CaCO,) to the bed along with the coal. At the operating temperatures encountered in fluidized bed coal combustors (i.e. between 1073 and 1273 K; Moss, 1975), these materials calcine rapidly to their respective oxides. CaO can subsequently react with SOa and O2 to form CaSO,; MgO does not react, however, because MgSO, is unstable above 1048 K at atmospheric pressure.
CaSO, has a higher molar volume than CaO; thus a product layer forms on the pore walls which inhibits pore diffusion and eventually the reaction ceases as the pores plug at their entrances. The effect is best visualized by considering a single pore. The reaction rate can be considered (Ramachandran and Smith, 1977) to be governed by the rate of: (i) diffusion of SO* in the pore, (ii) diffusion through the CaSOd layer on the pore wall, (iii) surface reaction. The pore diffusion resistance causes a concentration gradient in the pore and the product layer on the wall is therefore thickest at the pore entrance, which eventually closes. From a consideration of molar volumes (Hartman and Coughlin, 1974), the theoretical maximum fractional conversion of CaO to CaSO, in a limestone is 57 %, which occurs when all of the pores are filled with product; utilization is usually much less in practice because the physical structure of the calcine has a profound effect on its eventual overall conversion (Ulerich et al., 1978).
The gas-solid reaction models used to model the reaction within the calcine presented hitherto can be classified into two categories: those that consider the
+ To whom correspondence should be addressed.
reaction on the surfaces of non-porous grains (e.g. Georgakis et al., 1979) and those that emphasize instead the reaction initiated on the pore walls within the solid (e.g. Bhatia and Perbmutter, 1981). These have been extensively reviewed by Ramachandran and Doraiswamy (1982). Although detailed gas-solid reac- tion models usually yield good agreement between theory and experiment and are instrumental in under- standing the reaction mechanism, they are highly non- linear and it is difficult to incorporate them into a hydrodynamic model of a fluidized bed combustor without having to resort to prohibitively lengthy computer calculations for each size of stone in the feed. As a result, a number of simpler, semi-empirical models have been developed. Fieldes and Davidson (1978) developed a model for a reacting particle which used a small number of empirical parameters which could be determined using simple batch experiments in a fluidized bed. More recently, several workers (Lee and Georgakis, 1981; Fee et al., 1983) have used the empirical fact that the overall conversion varies ap- proximately exponentially with time and have assumed that the rate varies likewise. By comparing sulphation with catalyst deactivation by coke formation, Zheng et al. (1982) arrived at a model which, again, gave a rate varying exponentially with time.
In this paper, a more fundamental model is pre- sented which gives rates and conversions explicitly as a function of time and yet retains the parameters involved in the detailed mathematical description of a reacting particle. Further, it is shown that these parameters can be evaluated from simple batch exper- iments in a fluidized bed combustor (Fieldes and Davidson, 1978; Fieldes, 1979; Dennis, 1985). The model concentrates on limestone as a sorbent but extension to a dolomite would be straightforward.
EXPERIMENTAL Before developing the model in detail, it is necessary
to describe briefly the experiments to measure the kinetics and extent of sulphation of limestone particles
25

26 J. S. DENNIS and
and the results obtained therefrom. The uptake of SOa by the sorbent was measured by adding a known mass of closely sized particles to an electrically heated bed of sand fluid&d by a gas mixture containing 1 .O vol. oA 02, 0.25 vol y0 SO2 with N2 as balance. The reactor was constructed from recrystallized alumina and was 80mm in diameter. This study concentrated on Penrith limestone (which contains 54 wt % CaO) in two size fractions (+ 710, -850pm and + 1400, - 1700 pm) and three bed temperatures: 1098, 1148 and 1248 K. The apparatus and method have been described fully elsewhere (e.g. Fieldes and Davidson, 1978; Fieldes, 1979; Dennis, 1985; Dennis and Hayhurst, 1984). Essentially, after the batch had been added to the bed, the outlet concentration of SO1 dropped sharply and then gradually returned to its original value in a time t, - 2000 s. At t = t, the pores have plugged and the reaction ceases. If Y, is the ratio of the outlet concentration of SO, at t s after adding the batch to the steady-state concentration before the addition, then the overall conversion of the sorbent at this time is:
s
I x = GyJ&f (1 -Y,)dt (1)
0 where G is the molar flow rate of gas entering the bed, yi the mole fraction of SO1 in the fluidizing gas and w is the number of moles of Ca in the batch.
The specific rate of reaction, K,, is defined here as K, = Q/d&,, where Q is the rate of reaction of a particle, d, its diameter and C, is the concentration of SOz in the particulate phase. K, was related to Y, by:
K, = -(AU/S)/(l/ln T + l/X’) (2)
derived (Fieldes, 1979) from a version of the bubbling bed model. Here A is the bed area, U the superficial gas velocity,3 the total external area of the particles in the batch and X’ the cross-flow factor for the bed. In these experiments U/U,r was in excess of 5.0.
A.N. HAYHURST
Using eqs (1) and (2), values of K, were plotted against X; a typical result is shown in Fig. 1. By extrapolating to x = 0, the initial specific rate, K,, was obtained. To correct this rate for external mass transfer, the Sherwood number was estimated from the Frossling equation with Re based upon a gas velocity of 2.5 UmE/smf (which is recommended by Clift et al. (1983) if U % Ud, as it was in these experiments). A specif%c rate in the absence of mass transfer, k,, can be defined as k, = Q/zdi C,, where C, is the SO2 concen- tration at the pore entrance. The initial specific rate corrected for the effect of external mass transfer, k,, (i.e. k, at t = 0) is given by:
l/k, = l/Km - l/k, (3)
(where k, is the external mass-transfer coefficient) provided the rate of reaction of SO2 with CaO is first order in SO, at t = 0 (Borgward& 1970). If this is true, then, by considering a heterogeneous reaction in a porous solid, we have:
Q xd,l *=*
= k, = 240, (coth 4 - l/#)/d, (4)
where do = (dp/2)(kS,/D,,)? Here S, is the B.E.T. area of the calcine, k the intrinsic rate constant and D,, the effective diffusivity of SO1 in the pores. The evaluation of D, is described in the next section. The value of 4 was large for the typical stone sixes used (see Table 1); e.g. 4 = 17 for d, = 780 pm at 1198 K. Thus:
k,, = (kSoD,,)* (5)
to a good approximation and
k, = 2WLld,. (6) Obviously eqs (3&(6) hold only at t = 0 when there is no product layer on the pore walls. Each batch experiment was replicated four times. Figure 2 shows x vs. t ford, = 780and 1550 pm, respectively and Figs 3 and 4 give K, vs. t for the same particle sixes.
Fig. 1. Specific rate, K,, against overall conversion, x, for Penrith limestone (dp = 1.55 mm) sulphated in a gas mixture containing 0.25 % SO1, 1.0% 02, balance N2 at T = 1148 K.

Analytical model for sulphation of calcined limestone 27
Table 1. Results for sulphation+ Penrith limestone
T(K) d,(m) Km (cm/s) k, (cm/s) k,, (cm/s) 9* x,
1098 780 13.3 52.7 17.9 16.6 0.34 1550 11.3 30.0 18.1 33.4 0.22
1148 780 14.3 55.7 19.2 17.4 0.28 1550 12.0 31.6 19.4 35.0 0.17
1 a48 780 16.1 63.1 21.6 18.7 0.20 1550 13.0 35.8 20.4 35.1 0.11
*Gas contained 2300 ppm SO,, 1.0% 0,, balance N, dk
*From C#I = e.
0 26
IX 0’6
dp=l.55mm
L
- model 111
400 800 1200 1600 2000 t (5)
Fig. 2. x as a function of time for two sizes of Pen&h limestone sulphated in a gas mixture containing 0.25 % SO1, 1.0% Oz. balance N, at 1148 K. Solid lines show model fit [eq. (32)].
0 LOO 800 1200 1600 2000 Lk,
Fig. 3. K, as a function of time for the 780 pm particles in Fig. 2. Model fits: -, eq. (29); - -- -, eq. (37).
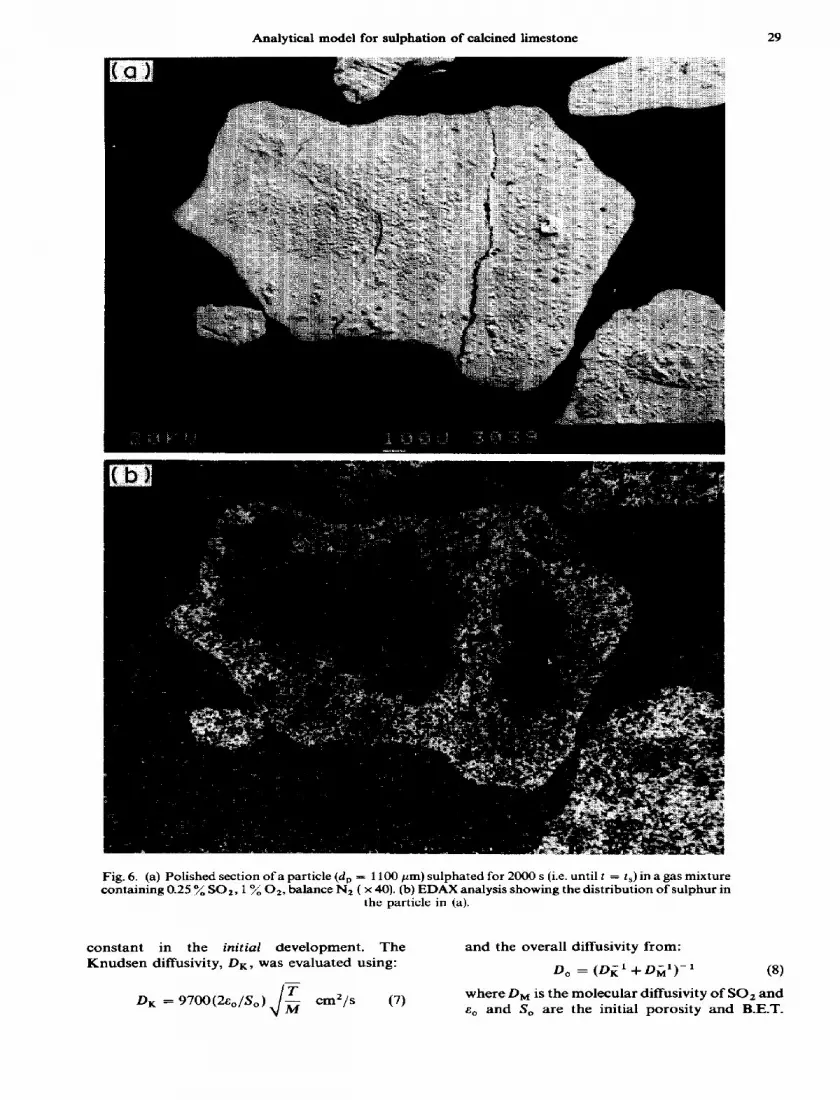
Pore size distributions were determined using mer- Finally, sulphur distributions across polished sec- cut-y intrusion and showed that the larger stone size tions of sulphated stones were obtained using EDAX had a slightly higher volume contained in large pores measurements. Figure 6 shows such a distribution for (see Fig. 5). a 780 pm limestone particle which has been fully

28 J. S. DENNIS and A. N. HAYHURST
0
0 400 800 1200 1600 2000 r(s)
Fig. 4. K, as a function of time for the 1550 pm particles in Fig. 2. Model fits: p, eq. (29); -- - -, eq. (37).
1
Fig. 5. Pore size distributions for Penrith limestone calcined in N, at 1148 K. Solid symbols, d, = 1550 pm; open symbols, d, = 780 pm.
sulphated. Such distributions were typical and pro- vided strong evidence that most of the reaction occurs very close to the external surface (i.e. 4 is large).
MODEL DESCRIPTION AHD ASSUMPTIONS
The assumptions made in deriving the model may be listed:
(i) The porous structure is fully developed at t = 0, i.e. calcination occurs rapidly (Fieldes, 1979).
(ii) The calcine has a geometry restricted to a number of parallel pores, each of finite length, with the wedge-shaped form shown in Fig. 7. The width of the pore, I, is considered to be much larger than the distance x so that reaction occurs only between the two major parallel surfaces.
(iii)
(iv)
(v)
(vi)
(vii)
Each pore has some reactant solid, length 1, associated with it. The concentration of SO2 is constant for 0 < y < (x - 8,) in Fig. 7.
The rate of reaction is governed by (a) pore diffusion, (b) diffusion through the CaS04 layer on the pore wall, and (c) reaction at the CaSO,/CaO interface. The product layer time t after the start of sulphation extends distances 6 1 and 6, either side of the original pore wall, as depicted in Fig. 7. All gaseous sulphur is present as SOZ, and CaSO, is formed according to: CaO + SO2 + f-0, = CaSO,, which is taken as first order in SO, and zero order in 0, (because the latter is in excess) (Borgwardt, 1970). The diffusivity within the pore was taken as
Analytical model For sulphation OF caleined limestone 29
Fig. 6. (a) Polished section of a particle {d, = 1100 pm) sulphated for 2000 s (i.e. until t = ts) in a gas mixture containing 0.25 O/_ S03, 1 o/0 Oz. balance N2 ( x 40). (b) EDAX analysis showing the distribution ofsulphur in
the particle in (a).
constant in the initial development The Knudsen diffusivity, DK, was evaluated using:
D, = 9700(2~,/8,) J
-’ cm2/s (7)
and the overall diffusivity from:
D, = (DK1+Dil)-’ where DM is the molecular diffusivity of SC E, and SO are the initial porosity and
(8) ! and .E.T.

30 J. S. DENNIS and A. N. HAYHUR~T
i
Fig. 7. Idealized pore for model. ABEF and CDHG are the original pore walls before sulphation occurred.
(viii)
(ix)
(x)
surface area of the calcine. The effective diffu- sivity, D,, within the calcine was calculated using the random pore model of Wakao and Smith (1962), viz:
D, = D, E;. (9)
The pseudo-steady-state analysis is valid (Bischoff, 1965). The asymptotic results relating the effectiveness factors for slab, cylindrical and spherical geometries of Aris (1975) are valid, using a normalized Thiele modulus 4 with the length based on the ratio (VP/S,), where VP is the overall volume of the particle and S, is the nominal external surface area. It was verified experimentally (above) that values of @ are large for the range of sizes likely to be fed to a fluid&d combustor. Since @ is large, the particle can be considered as a slab and the result then extended to spherical geometry. The external concentration of SO1 at the pore mouth, C,, is constant.
The reason for selecting the particular geometry used is discussed in the next section. To generate the equations describing the reaction, the procedure was to evaluate the local rate of reaction within the pore at a given distance from its entrance and then to couple this with the equation for gaseous diffusion of SOa into the solid. This is described in the Appendix.
DERIVATION OF MODEL
The general equations for a non-catalytic gas-solid reaction are:
vD*(x)vc* = #%z*f(X) (10)
ax ae= -c*_f(x)
with boundary conditions: C*=l at n=l
VC*=O at q=O
(11)
(124
and initial condition: C* = 0, X = 0, all q at 0 = 0. (12b)
Here X and C* are the local conversion and local, dimensionless SO* concentration at some dimension- less distance q from the centre. D* is the local dimensionless diffusivity of SOz (which, in general, depends on X) and B is a dimensionless time.
Following Del Borghi et al. (1976), this system is amenable to an analytical solution if D*(X) = 1 (i.e. D* is independent of q) by formally integrating eq. (11) and defining a cumulative concentration ‘Y, thus:
Del Borghi et al. (1976) show that the analogue of effectiveness factor when using the cumulative concen- tration is overall conversion, x (0), thus:
x(e) = +~I%“,,. (14)
To obtain x explicitly as a function of 8, it is necessary to (i) transform eq. (10) in terms of Y, (ii) solve the resulting equation for Y, and (iii) obtain X from eq. (14). A necessity is that, from eq. (13), X, and therefore f(X), has to be expressible explicitly in terms of Y. This restricts the form of s(X) and hence the type of geometry that can be considered for the original pore model; it turns out that only the parallel pore geometry used here satisfies this condition. Further, the trans- formed eq. (10) is only readily soluble for slab geometry. However, since Q is large, results for a slab are readily interpretable in terms of a sphere if the correct characteristic length (Y,,/S,) is used.
Using the form of f(X) derived in the Appendix- the form of eq. (4) appropriate to slab geometry - eq. (18) can be transformed using eq. (13) to:
d2’P Q2 2 = $(1+ 2j?Y)*- 11 drl
(15)
and X =;[(1+28’y)t-l] (16)

Analytical model for sulphation of calcined limestone 31
using, additionally, eq. (A9). Equation (15) can be (1 + 28e)t - 1 integrated once to: x [(1 +2/l@-3/30- l]f ( > ’
(23)
d’P 2@ 1 -= I (
7 +1+2/!?+-yr Equation (23) relates the rate of change of conversion drl explicitly to dimensionless time 8. For convenience, eq.
>I i (23) can be rewritten in terms of the specific rate, k,, (17) introduced earlier, thus:
k = ~(1 -G&, dX k,,(*)+((l+2/3e)f-l) 1-;(1+2Bs+-l)
( 5 6V,,, d8= ((1 +2/l@-3@- I)* = k,,/f; (0). (24)
where Y, is the cumulative concentration at the centre line. The experimental evidence suggests that Y, is small. If 0 is large, then during the initial stages of the reaction (when the product layer resistance is small, a steep concentration gradient exists) the concentration at the centre is negligibly small. At larger times, pore closure occurs at the external surface and inhibits gaseous diffusion into the pores with the result that a steep concentration gradient of SOP still exists. Thus ‘y, + 0 in eq. (17). Using eqs (14) and (17), the overall conversion in the slab, x(0), is:
-[E(1+2@'+-3/?e-1]j (18)
and so:
dX ,,‘j$j [(l +2/?0)*-l] _- de- @ [(i+2fle)‘-spe-iI+’ (19)
At small values of 0, eqs (18) and (19) should provide an adequate description of a reacting particle. As 8 increases, however, the diffusivity, D,, will vary as the voidage changes. In order to introduce a variable diffusivity without infringing the assumptions used in the analysis of Del Borghi et al. (1976), assume that the variation of D, with product build-up is dominated by the reduction in voidage at the pore entrance at the position q = 1 + A, with A being a very small distance. To proceed further, the surface voidage, E,, and the distance I in Fig. 7 have to be related to 8 and E,. By considering the volumes of solid at 8 = 0, we have:
a = 2(1 - E,)/S, (20)
and a volume balance at time 0 gives:
%I% = 1 - (Z - l)(l -Eo)Xs/&, (21)
where X, is the local conversion at the surface. From eqs (13) and (16) with Y(l,e) = C*(l, 0) = 1
and eq. (21):
&,I&, = 1 -[(z- l)(I --E,)[(I +zpe)*- q/jko-j. (22)
In eq. (14), Q = f.(kS,/D,)f, so allowing D, to vary gives D, = D,, (E,/E,)~ (Bhatia and Perbmutter, 1981) and eq. (19) becomes:
dX ,I?% -- de @
1 -(z-1)(1 -‘o) [(age+ I)+_ 11 BE, >
Equation (23) is readily integrated to give X:
&L@ ; Q’- [(
3;’ ; ;)’ w5( vi7 113
- ; (2D + l)+ + 3(2D + 1)f + 3f - 3*/5 >I (25 where U = (1 + 2@)*.
Equations (24) and (25) hold if k, is large, i.e. C, +cp.
)
RELATING THE MODEL TO BATCH EXPERIMENTS IN A FLUIDIZED BED
In the fluidized bed reactor used in this work, the Sherwood number was estimated to be in the range 2.54.0 so that the external mass-transfer resistance from the bulk gas to the surface of the particle is important. We have defined earlier the specific rate in the presence of external mass transfer, K,, as K, = QW&m where C, is the constant bulk gas concen- tration. From the definition of the external mass- transfer coefficient, k,, the value of C,, the concentra- tion of SO, at the pore entrance, varies in practice with K, as:
C, = C,(l -KS/k,). (26)
For Penrith limestone particles undergoing sulph- ation with d, = 0.78 or 1.55 mm in a gas mixture at 1148 K, the variation of K, with time is shown in Figs 3 and 4, respectively. For these conditions, k, was calculated to be 56.0 or 32.Ocm/s, respectively (see Table 1). Thus at t = 0, when K, (= K,,) is a maxi- mum, C, varies from C, by 25 and 38 %. respectively, but at t = 250 s (when x _ x,/3) the two concen- trations are practically equal. Consequently, external mass transfer has importance at early times in the sulphation of limestone. To proceed further, it was noted that for the typical values of the parameters /?, a and C, (when k, + co) given in Table 2, the value of I; (0) in eq. (24) is approximately independent of C, for times up to about 200 s. A deviation in the value of C, of 20 % gives a change in the value of fi (e) of only 4-5 %, depending on f. The error increases with t, but at large times (e.g. t = 2OOs), C, -C, so that the deviation of C, from C, eventually disappears. Experimental confirmation is provided in Fig. 8, in which values of K, are plotted against time for SO1

32 J. S. DENNIS and A. N. HAYHURST
Table 2. Parameters for analytical sulphation model
T(K) d&m) Pl ’ (cm/& P2 ’ (cm/s ‘) acp (I/s) B* &W Bf D, (cm2/s) 8
1098 0.78 1.93 x lO-4 2.35 x 1O-6 7.14 x IO-’ 110 2902 128 1 s.5 2.13 x lO-4 2.27 x lO-6 143 2345 103 7.6 x lo-lo
1148 0.78 1.96 x lO-4 2.69 x lO-6 7.77 x IO-’ 94 1968 93 1.55 2.00 x lO-4 2.53 x lo-” 111 2258 108 1.10 x lo-9
1248 0.78 1.64 x 1O-4 2.48 x lO-6 8.47 x 10-j 84 1710 88 1.55 1.78 x 1O-4 2.48 x 1O-6 100 1781 92 1.46 x lO-9
*Estimated from P,’ and P2’. *Estimated from Z, and eq. (38). GEstimated from pt.
01 I 0 40 60 120 160 200 MO
t(s)
Fig. 8. K, against time for various mole fractions of SO2 in the fluidizing gas; d, = 780 pm, T = 1148 K. 0, 0, x, 2300 ppm SO,;A, +, 1800 ppm SO,; 0, 1200 ppm SO,.
concentrations between 2300 and 1200 ppm; K, is approximately independent of C, and, hence, C,, for early times. Thus, from the definitions of k,, K, and k,:
Equation (30) could be integrated to obtain Ifi after first: (i) expanding the denominator and (ii) retaining the first two terms. However, since, experimentally (see Table 2), b/p is small and 2fl0 B 1 for even small values of time, the resulting equation for x simplifies to:
Q = nd;K,C, = xd;k,C, = nd,2 k, (C, -Co) (27)
we can write
K, = 1 l/k, + l/k, (28)
iff K, is approximately independent of C,. Thus from eq. (24):
Ks = Ck, ’ +A (Wkol- 1 and this relates K, to dimensionless time for a batch of limestone sulphated from 8 = 0 in a fluid&d bed.
From sulphation experiments it turns out that the ratio (km/k&/f1 (0) is usually less than 0.3 for even small times (e.g. t > 10 s). For example, for d, =1.55mmandT=1148K,f,(O)=2att=10sand k,,/k, = 0.6 (using data from Tables 1 and 2), so eq. (23) can be re-cast as:
noting that fi (0) > 1 for 6’ > 0.
X(O) .= 4i f2@ 0 ( 7 -&2"f
3P > . (31)
Hence x is related explicitly to dimensionless time, 0. Equation (31) can be re-cast as:
where PI = 2a ,,& (uC,)~/~Q~?~ and P2 = 2$ fi (~C.)~/5@j?*. Consequently, a plot of X/t* against tf should be linear at large times with slope -Pp2 and ordinate intercept PI. The unknown parameters a and /3 can be obtained as follows.
0) Q From eq. (A6) a = 2kV,,/A. Considering uniform
pores [eq. (20)]:
A = 2(1 -&,)/S, (20)
: . aC, = k&C, v,,!(l -80) (33a)
= (k,,‘/&,)C, v,ol(l -E,) (33b)

Analytical model for sulphation of calcined limestone 33
using eq. (6). The value of aC, is therefore completely determined if C, w C,.
(ii) B From eq. (32):
P,lP, = [S/(3 &)I (8/M* (34)
but b = (1 - so)(Z - 1)/s,. Thus from the intercept and slope of the x vs. t plot, together with the value of a, /? is obtainable.
To test eq. (32), the quantity (X&/t+) rather than (X/ti) was plotted against tf; the results should then be independent of d,. The parameters P, and Pz become P,’ and Pz’, where P,’ = P,dp and Pz’ = P,d,. A typical plot for the data in Fig. 2 is shown in Fig. 9; parameter estimates are given in Table 2. The linearity is striking. At early times, however, x is not as large as predicted and the plot becomes non-linear. This is because mass transfer has been neglected in eq. (31). As x -+ 0, values of (Xd,/tf) should be given by:
Xd,/tf = 6uC, K, t*/k,,’ (35)
using eq. (30) for 0 = 0. This defines the asymptote for t + 0.
Values of B were 17-30 % higher for the larger stone size. This is probably because values of S, were lower as d, increased. The fit of eq. (32) to the X-t data in Fig. 2 is excellent.
Having evaluated the parameters a and fl, a com- parison with the rate data was made by re-casting eq. (29) in the form:
K;’ = (k;‘+k,‘)+k,‘(f,(@-1). (36)
Thus, K; 1 should vary linearly with (fi (0) - 1). Results are plotted in Fig. 10 for sulphation at 1148 K for the two sizes of sorbent. The intercept is small in magnitude but the data appear to be scattered fairly evenly about the line with slope k,‘. In Figs 3 and 4, the model prediction is plotted along with the K,-t data for the limestone. There is a considerable dis- crepancy for t < 200 s which is not immediately ap- parent from such plots as Fig. 10. A better fit was obtained when eq. (32) was simply differentiated and related to K,, thus:
K
5
= (1 --%I 24~~ vcao
(3P;t-:-5P;G) (37)
3 p;t-t-p;&
0.21 0 8 16 2L 32 40 48
i” (<“I
Fig. 9. Plot of Ed,/6 as a function of ti for the data in Fig. 2. Sizes: +, = 15OOpm.
x , V, d, = 780 JW& 0, O,, 0, dp
0 10 20 f,C, 40 50 50 - 1
Fig. 10. Plot of l/K, against [f, (0) - I] for the data in Figs 3 and 4. Sizes: x ,A, +, d, 780 pm; q .m,O,V, dp = 1550pm.

34 J. S. DENNIS and A. N. HAYHURST
The fit to the data was much improved (for t > 20); see Figs 3 and 4.
DISCUSSION
(a) Signaficance of model parameters The significance of the physical parameters d,, S,,
k,, D,, E, and the experimental parameters C, and P on the values of K,,, x, and t, were investigated in Table 3. The method was to perturb a single parameter from its experimental value, which is used as the “base case” and then to calculate how values of K,, x, and t,were changed. It should be noted that connected parameters were altered as well, e.g. if co is the perturbed parameter then D,, was altered as well since D,, = f t% )-
Table 3 indicates that a change in the solid state diffusivity, D,, markedly affects x, and the overall rate of reaction with the value of the former increasing if D, is decreased and vice versa. The intrinsic rate constant k has little effect on X, or its rate of attainment. A variation in S, affects x, strongly. Smaller pores are associated with a large value of S,; such fine pores plug rapidly with product and also reduce the rate of diffusion of SO, into the calcine. The result is that x, decreases as S, increases. An increase
in porosity increases x,. These conclusions are sup- ported by other workers, (e.g. Georgakis et al., 1979; Bhatia and Perbmutter, 1981).
(b) Independent estimate of/3 An independent estimate of p-albeit ap-
proximate-is available. From eq. (22), when the pores have become plugged at their entrances, E, = 0; so:
(1 +2/30,)+ = 1 +/3/b (38)
where t?, corresponds to t = t,, the pore closure time. The value of t, is difficult to measure accurately; average values are given in Table 1 together with p estimated from eq. (34); the agreement between the estimates is satisfactory.
(c) Deviation of experimental rate data from eq. (29) The discrepancy in the fit to the rate data may be due
to an artefact of the experimental technique. From Fig. 8 it can be seen that there are slight differences in the values of K, depending on the initial concentration of SO, in the fiuidizing gas. The deviation from the initial value is used to infer the rate. Thus, the particle
Table 3. Effect of parameters on the reaction of a particle for T = 1148 K
Connected parameters Other parameters
Parameter k, nkW D,, (cmZ/s) zZ/s)
t, (s) P, ’ (cm/& Pz ’ (cm/d) B acp (I/s) x,+ perturbed (cm/s)
d, Cc=0 0.040 0.078$ 0.155
SC. (l/cm) 2.0 x lo5 3.0 x 1os* 4.0 X 10s
k (cm/s) 0.010 0.027* 0.040
D, (cm/s) 5.0 X lo- I0 1.38 x 10-9* 8.0 x 10-g
% 0 0.54* 0.60
C, (mol/cm”) 2.65 x 1O-9 2.65 x IO-** 5.30 x 10-s
P (bar abs.) 1.01* 6.00 18.00
99.0 15.6 2039 56.0 14.0 2039 32.0 11.7 2039
4.6 x 1O-6 0.06 14.0 4480 3.1 X 10-e 0.04 14.0 2039 2.3 x 1O-6 0.03 13.9 1133
3.1 x 1o-6 2.7 x 1o-6
0.04 0.05
0.043 0.027 0.016
9.4 2161 14.0 2039 16.0 2013
14.0 14.0 14.0
14.0 15.1
14.0 14.0 14.0
14.011 7.1 4.1
5497 2039
412
2039 2455
20390 2039 1020
2039 344 115
1.96~10-~ 2.69x1O-6 1.96 x lo-.’ 2.69 x 1O-6 1.96 x 1O-4 2.69 x 1O-6
1.61 X 10-d 1.49 X 10-e 1.96 x lo--’ 2.69 x 1O-6 2.27 x 10m4 4.18 x 1O-6
1.96 x 1O-4 2.69 x 1O-6 1.96 x lo-’ 2.69 x 1O-6 1.96 x 1O-4 2.69 x 1O-6
1.52 x 1O-4 1.26 x 1O-6 1.96 x 1O-4 2.69 x 1O-6 3.04 x 10-h 1.01 x 1o-5
1.96 x 1O-4 2.69 Y 1Om6 2.52 x lo-* 3.11 x 1O-6
3.49 x lo-’ 1.51 x lo-’ 1.96 x 10-h 2.69 x lo-” 3.30 x 10m4 6.40 x 1O-6
1.96 x lo-“ 2.69 x 1O-6 5.89 x lo-* 1.97 x 1O-5 1.03 x 1o-3 5.98 x lo-’
94.0 94.0 94.0
141.0 94.0 70.1
34.8 94.0
139.3
259.0 94.0 16.2
94.0 81.9
94.0 94.0 94.0
94.0 94.0 94.0
7.77 X lo- 3 7.77 X lo- 3 7.77 x 10⁻³
5.24 x lo- a 7.77 x 10-J 1.04 x lo-*
2.88 x 10-a 7.77 x 10⁻³ 1.15 x lo-*
7.77 X 10⁻³ 7.77 X 10-a 7.77 x 10-S
7.77 x 10-a 8.94 x 10-a
7.77 X 10-b 7.77 X 10-a 1.55 x 10-Z
7.77 X lo- = 4.60 x lo-* 1.38 X 10-I
0.56 0.29 0.15
0.43 0.29 0.22
0.29 0.29 0.29
0.48 0.29 0.12
0.29 0.44
0.29 0.29 0.29
0.2911 0.23 0.18
+X _=Xatt=t,. *Denotes base case. BAffects b = (1 --G,)(Z - 1)/q,. II Overall wend verified experimentally (Dennis and Hayhurst, 1984).

Analytical model for sulphation of eatined limestone 35
“sees” a variable SO2 concentration during sulpbation. At short times, the deviation is accounted for because the overall reaction is first order in SOP; at large times the deviation of C, from the initial value is small so C, is approximately constant. At “intermediate” times, the overall reaction is neither first order nor is C, close enough to the steady-state value to be constant. For example, for a batch of 780 pm particles of mass 3.04 g added to the bed at 1148 K, the value of C, was 66 % of its steady value at t = 100s. For simplicity, assume that the reactor was well-stirred. Then, between t = 0 and t = 100 the particle was subject to a reduction in the bulk level of SO, of about 34%. It the particulate phase concentration had not changed, the concentra- tion of SO, at the surface of the particle, C,, due to mass transfer alone would have been (with K, = 9.3 cm/s at t = 100 with k, = 56 cm/s), from eq. (26), equal to 85 % of the steady value. Thus the effect of the drop in SO, due to the batch is much greater than the effect of mass transfer, which explains why the term in (l/k,) is apparently unimportant. These obser- vations do not upset the estimation of a and /?; Q is evaluated from k,, at t = 0 and /I is estimated from conversion data at large times.
CONCLUSION
An analytical solution to the diffusion-reaction equations for sulphation has been developed. The model readily lends itself to coupling with the equa- tions for bed hydrodynamics in a model for the overall desulphurization of a fluidized bed combustor (Dennis and Hayhurst, 1985). Equations (32) and (37) ad- equately describe the conversion-time and rate-time behaviour of a sulphating limestone particle. The small number of parameters are verifiable from simple batch experiments in a fluidized bed. The model has been compared with experimental data, with good agree- ment being obtained.
Acknowledgement-This work was supported by Blue Circle Industries PLC, through a S.E.R.C. CASE Studentship.
b C
CO
CP C* 4 D,
De0
NOTATION
structural parameter (1 - s,)(Z - 1)/s, concentration of SO, at some position inside a reacting particle, mol/m3 concentration of SOz at CaSOJCaO interface, mol/m3 concentration of SO, at the external surface of the reacting particle, mol/m3 concentration of SO, in bulk gas mol/m’ dimensionless concentration, = C/C, particle diameter, m effective diffusivity of SO2 in the pores of the calcine at some time t during the reaction, m2/s D, at t = 0, m2/s
D*
DK
DM Q
k
k,
k 2
P
Q Re
3:
Stl SX t ts
u mf
;;r XS X'
x
xcc Y
Y,
z
dimensionless diffusivity, De/D, Knudsen diffusivity of SO2 in the particle, m2/s molecular diffusivity of SO,, m2/s diffusivity of SO2 in the product layer on the pore walls, m2/s surface rate constant for reaction, m/s external mass-transfer coefficient for SO2 from the bulk gas to particle surface, m/s specific rate of reaction at time t, = Q/zd’C,, m/s k, at t = 0, m/s specific rate of reaction at time t, = Q/nd2Cp. m/s K, at t = 0, m/s pore dimension (see Fig. 7), m total pore length, m half-width of porous slab, m molecular weight of S02, g/mol bed pressure, bar abs
parameters defined by eq. (32); Pi = P, d,, P;= P2dp reaction rate of S02/m2 interior pore surface area, mol/m’s reaction rate of particle, mol/s Reynolds number for particle = 2.5 U,rP,d,I~, total external area of particles in a batch, m2 B.E.T. surface area of calcine at t = 0, m2/m3 Sherwood number, = kgdp/DM external area of one particle, mz time, s time at which pores become completely closed at their external surface, s incipient fluidizing velocity for sand of given diameter at bed temperature, m/s
molar volumes of CaO, CaSOo, m’/mol volume of one particle, m3 distance from centre of slab of 3 width, L, m pore width (see Fig. 7), m local conversion at some point in the pore conversion at external surface of particle fluidized bed crossflow factor, dimen- sionless overall conversion of a particle at some time, t, dimensionless ultimate value of X at t = t,, dimensionless distance from pore centre-line (see Fig. 7), m ratio of outlet concentration of SO2 from fluidtied bed at time t after a batch addition to that at t = 0 before the ad- dition, dimensionless distance from pore entrance along pore, m

36 J. S. DENNIS and A. N. HAYHURST
ratio of molar volumes Vtiso,/Vao. dimensionless
Z
Greek letters structural parameter, defined in eq. (A6), m3/mol s structural parameter, defined in eq. (A6), distance that CaSO, product layer ex- tends outwards into the pore from the position of the original pore wall, m distance that CaSO, product layer ex- tends into the original CaO from the position of the original pore wall, m = 6, +&, m a small increment of distance, m initial voidage of calcine, dimensionless voidage of calcine at its external surface at time t, dimensionless dimensionless distance = w/L dimensionless time, = arc., t distance between adjacent pores (see Fig. 7) m Thiele modulus for sphere, = d,/2 (kS,/D,)f, dimensionless normalized Thiele modulus = L (k&/D,)*, where L = VP/S,, dimension- less cumulative dimensionless concentration
REFERENCES
Aris, R., 1975, The Mathematical Theory of Dz$usion and Reaction in Permeable Catalvsts. Vol. 1. Oxford University Press, Oxford.
_
Bhatia. S. K. and Perlmutter. D. D.. 1981. A.1.Ch.E. J. 27,226. Bischoff, K. B., 1965, Chem. &tgngSci. 20,783. Borgwardt, R. H., 1970, Enoiron. Sci. Tech. 4, 59. Clift, R., Ghadiri, M., Monteiro, J. L., Tan, B. K. C. and
Thambimuthu, K. V., 1983, Paper presented at Fluidisation IV, Engineering Foundation Conf., Sot. Chem. Engng., Japan, Kashibojima, Japan.
Del Borghi, M., Dunn, J. C. and Bischoff, K. B., 1976, Chem. Engng Sci. 31, 1065.
Dennis. J. S.. 1985, Ph.D. Dissertation, University of Cambridge.
Dennis, J. S. and Hayhurst, A. N., 1984, I.C.E. Symp. Ser. No. 87, 61.
Dennis, J. S. and Hayhurst, A. N., 1985, Paper in preparation. Fee. D. C.. Wilson, W. J., Myles, K. M., Johnson, I. and Fan,
L.-S., 1983, C/&n. EngngSci. 38, 1917. Fieldes, R. B., 1979, Ph.D. Dissertation, University of
Cambridge. Fieldes, R. B. and Davidson, J. F., 1978, Paper presented at
A.1.Ch.E. National Meeting, Miami, U.S.A. Georgakis, C., Chang, C. W. and Szekely, J., 1979, Chem.
Engng Sci. 34, 1072. Hartman, M. and Coughlin. R. W., 1974, Ind. Engng C/tern.
Proc. Des. Dev. 13, 248. Lee, D. C. and Georgakis, C., 1981, A.I.Ch.E. J. 27, 472. Moss, G., 1975, Instn. Fuel Symp. Ser. No. 1, Paper D2,
Fluidised Combustion Conf., London. Ramachandran, P. A. and Doraiswamy, L. K., 1982, A.I.Ch.E.
J. 28, 881. Ramachandran, P. A. and Smith, J. M.. 1977, A.I.Ch.E. J. 23,
353. Ulerich, N. H., O’Neill, E. P. and Keairns, D. L., 1978,
Thermochim. Acta 26, 269.
Wakao, N. and Smith, J. M., 1962, Chem. Engng Sci. 17,825. Zheng, J., Yates, J. G. and Rowe, P. N., 1982,Chem. Engng Sci.
37, 167.
APPENDIX In Fig. 7 the local rate of reaction per unit area of pore
surface q at distance z from the pore entrance is:
q=kCj (Al) where k is the surface rateconstant for the sulphation reaction and Cl is the SOz concentration at the CaO/CaSO, interface. For SOa diffusing through the product layer:
q= -&dc dy
where D, is the effective diffusivity of SO2 in CaSO,. By performing a mass balance over a differential slice of
pore, length dZ, the local conversion of CaO to CaSO,, X, is:
x = 26,/l (A3)
and further
6,/h = l/Z (A4)
where Z is the molar volume ratio (*)
and &=(?I1
+ 6,). Finally, considering the local rate of pore closure gives:
4(~CcaS”, - v,,) = -$x-6,)) ~2. (A5)
Equation (A2) can be integrated using eq. (Al) to eliminate q in eq. (A5) and using eqs (A3) and (A4) gives:
dX -= dt 646)
where OL = 2k V’,O/~ and /I = kZL/ZD,. Consider, now, the reaction to be occurring in a slab of
calcine with its half width, L, being much less than its length and breadth. The w coordinate is defined as perpendicular to the major face and is measured from the centre. The pores are considered to run in the direction of w but they can be tortuous. As a result, the internal pore arca within an element of width dw and unit superficial area in the major plane is S, dw. where S, is the B.E.T. area of the calcine. The rate of reaction is, therefore, @, dw. Performing a mass balance on SO1 over the element dw relates the rate of change of SO, concentration with respect to w to q:
(A7)
Introducing dimensionless variables:
?I= W/L; C* = C/C,; D’ = DJD,; 0 = aC,t gives for eqs (A6) and (A7)
(AN
and dX C- -= do (1 +BX)
where @ = L’S, k/D,. At this stage, the boundary conditions are:
C*=l at g=l all8
dC*/dq =O at 9 =O
with the initial condition:
C*=O at 0=0 X=0 at 8=0.
(A9)
Recommended


