
Analyzing Complex Network User Arrival
Patterns and Their Effect on Network Topologies
Michael Fire1*,** and Carlos Guestrin2*
*Department of Computer Science & Engineering, University ofWashington
**The eScience Institute, University of Washington
March 23, 2016
Abstract
Complex networks have non-trivial characteristics and appear in manyreal-world systems. Due to their vital importance in a large number ofresearch fields, various studies have offered explanations on how complexnetworks evolve, but the full underlying dynamics of complex networksare not completely understood. Many of the barriers to better under-standing the evolution process of these networks can be removed with theemergence of new data sources.
This study utilizes the recently published Reddit dataset, containingover 1.65 billion comments, to construct the largest publicly available so-cial network corpus, which contains detailed information on the evolutionprocess of 11,965 social networks. We used this dataset to study the ef-fect of the patterns in which new users join a network (referred to as userarrival curves, or UACs) on the network topology. Our results presentevidence that UACs are a central factor in molding a network’s topology;that is, different arrival patterns create different topological properties.Additionally, we show that it is possible to uncover the types of userarrival patterns by analyzing a social network’s topology. These resultsimply that existing complex network evolution models need to be revis-ited and modified to include user arrival patterns as input to the models,in order to create models that more accurately reflect real-world complexnetworks.
1 Introduction
Complex networks are loosely defined as networks with non-trivial structure anddynamics, appearing in social, molecular, biological, ecological, and economical
[email protected]@cs.washington.edu
1

real-world complex systems [11]. Many studies have provided models and algo-rithms to explain how complex networks evolve [6, 12, 18, 22, 24]. However, thefull underlying dynamics of complex networks are not entirely comprehended,and many questions remain unanswered [1].
With the rapid advances in the field of data science in recent years, newalgorithms, infrastructures, and techniques for data mining, data storage, dataprediction, and data visualization have emerged [3, 10, 23, 33]. These new toolsmake it feasible to gain new insights from large quantities of data (also knownas big data), and they can be utilized to tackle significant problems in researchfields as diverse as movie recommendations [19], malware detection [29], whaledetection [17], and disease identification [15].
In this study, we utilize data science tools to investigate the patterns inwhich new users join online communities and to study the impact of thesearrival patterns on the network structure. Our study focuses on Reddit,1 ahuge collection of online communities that discuss what is new and popular onthe Internet. Namely, we utilize the recently published Reddit dataset, whichcontains over a terabyte of uncompressed data and consists of over 13.2 millionusers2 who posted over 1.65 billion comments published over a 7-year timeperiod. This vast dataset contains information on the evolution process of morethan 239,000 online communities and the connections among the communitymembers (see Section 3). We used the Reddit dataset to construct a large corpusof selected 11,965 directed social networks, which contain over 97% of all theposted comments in the dataset (see Section 3). We assembled an unprecedentedcorpus of social networks with diverse topologies, ranging from social networkswith 11 vertices up to social networks with over 4 million vertices (see Table 1).
Using the constructed social networks, we studied how the patterns in whichusers joined the network influence the communities’ social network topologies.We analyzed the networks and their corresponding UACs using regression anal-ysis, machine learning algorithms, and graph theory algorithms, and we ran ouranalyses utilizing the AWS cloud computing infrastructure [3] and the GraphLabCreate machine learning framework [23].
Our study’s results indicate that most of the analyzed UACs match poly-nomial functions. Specifically, we observed that most of these curves can becategorized into one of five main types of growth patterns (see Section 5.3 andFigure 1): (a) polynomial growth, (b) sublinear growth, (c) linear growth, (d)superlinear growth, and (e) sigmoidal growth. Moreover, we observed that dif-ferent UACs influence the structure of the social networks. We observed thatsigmoidal-like growth usually makes the network denser and with a higher av-erage clustering-coefficient than polynomial growth (see Section 6).
These results indicate that different user-joining rates can considerably affectthe structure of a complex network. Therefore, to better understand complexnetwork dynamics, and to develop models that simulate complex network evo-lution, it is highly important to take into account the patterns of how new users
1http://www.reddit.com2The dataset contains 13,213,173 unique usernames. However, many Reddit users have
several usernames.
2

0 50 100 150 200 250 300 350 4000.0
0.2
0.4
0.6
0.8
1.0U
sers
Joi
n P
erce
ntag
e
Polynomial (Blogging)
0 50 100 150 200 2500.0
0.2
0.4
0.6
0.8
1.0 Sublinear (90s)
0 50 100 150 200 2500.0
0.2
0.4
0.6
0.8
1.0 Linear (AskComputerScience)
0 50 100 150 200 250 300Number of Weeks
0.0
0.2
0.4
0.6
0.8
1.0
Use
rs J
oin
Per
cent
age
Superlinear (Learnmusic)
0 50 100 150 200Number of Weeks
0.0
0.2
0.4
0.6
0.8
1.0 Sigmoidal (Eagle_Scouts)
0 50 100 150 200 250Number of Weeks
0.0
0.2
0.4
0.6
0.8
1.0 Events Oriented (BlackFriday)
Figure 1: Common UACs of the following subreddits: Blogging, 90s, AskCom-puterScience, Learnmusic, Eagle-Scouts, and BlackFriday.
join an emerging network. Until now, to the best of our knowledge, only a singleproposed network evolution model [21] incorporated the users’ arrival times aspart of the evolution model. Our study’s results should aid in developing newand more accurate evolution models, assist in evaluating existing models, andhelp in better understanding complex networks.
1.1 Contributions
To our knowledge, by several orders of magnitude this is the largest study toanalyze real-world directed social networks. In this study, we present evidencethat different users’ arrival patterns are a very important factor in the moldingof the network’s topology. Additionally, we show that it is possible to uncoverthe types of social network users’ arrival patterns by analyzing the network’stopology.
Furthermore, this study contains the following contributions: First, we presenta novel method to categorize UACs. Second, we empirically show that the ma-jority of UACs on the Reddit dataset match polynomial functions, which pro-vides a method to identify anomalous patterns that in many cases are influencedby real-world events. Third, we analyze the topological features of 11,965 real-world directed social networks and provide statistical analyses of these networkfeatures. Fourth, we share both our constructed social network datasets as wellas a significant portion of the code used for this study in order to make this
3

study reproducible. Lastly, we have developed a dynamic web interface to assistother researchers in investigating the social networks used in this study.
1.2 Organization
The remainder of the paper is organized as follows: In Section 2, we providean overview of various related studies. In Section 3, we give details on theReddit dataset which was used throughout this study. Additionally, we presentthe methodology that we used to clean the Reddit dataset. Section 4 describesthe methodology we used to construct the subreddit social networks and thesocial network topological features we utilized in this study. Next, in Section 5,we present the methods and algorithms we used to construct, categorize, andpredict the subreddit UACs. Then, in Section 6, we discuss the obtained results.Lastly, in Section 7, we present our conclusions from this study and also offerfuture research directions.
2 Related Work
The multidisciplinary fields of complex networks have been deeply studied in re-cent years, ever since Barabasi and Albert observed in 1999 that many real-worldnetworks, such social networks and the World Wide Web, are best described asnetworks with complex topologies. Barabasi and Albert also pointed out thatmany of these large networks have a common property of having a scale-free,power-law distribution of their vertex connections [6]. Since then, a large num-ber of studies have been devoted to identifying complex networks in variousreal-world systems [7, 25]. Additionally, many studies have provided modelsthat explain how complex networks are created [6, 12, 18, 21, 24].
In this section, we present a focused overview of studies related to socialnetworks and their evolution process. In addition, we give an overview of studiespertaining to online communities and the Reddit website, which are related tothe dataset utilized in this study.
2.1 Complex Networks
The study of complex networks began over half a century ago, in 1965. Whilestudying a network of citations among scientific papers, Price observed probablythe first example of a network in which degree distribution followed a powerlaw [26]. Later, in 1976, Price provided an explanation of the creation of thesetypes of networks by pointing out that “Success seems to breed success. Apaper which has been cited many times is more likely to be cited again than onewhich has been little cited” [27]. Using the rule that success breeds success, Priceoffered a method for the creation of networks in which their degree distributionfollows a power law.
Over three decades later, in 1999, Barabasi and Albert observed that net-works with degree distributions that follow power laws exist in a variety of
4

networks, including the World Wide Web [6]. Barabasi and Albert coined theterm “scale-free networks” for describing such networks - ones having degreedistributions that follow a power law distribution. Similar to Price’s methodfor creating scale-free networks [27],3 Barabasi and Albert [6] suggested a sim-ple and elegant model for creating random complex networks based on the rulethat the rich are getting richer. In their model (also known as the Barabasi andAlbert model), a network starts with m connected vertices. Then, each newvertex that is added to the network has a higher probability of connecting topre-existing vertices with higher degree, where the probability of connecting toan existing v is proportional to v’s degree [6]. As a result of the tendency of anew vertex to connect to vertices with higher degrees, “rich” vertices with highdegrees tend to become even “richer” due to their connections with new verticesthat join the graph.
Even though the Barabasi and Albert model can explain some of the char-acteristics of real-world complex networks, the random networks created by themodel were lacking in other network properties that were observed in real-worldcomplex networks. Therefore, in recent years, other models have been suggestedfor the creation of complex networks which have additional characteristics thatwere observed in real-world complex networks.
In 2005, while studying the evolution of four real-world networks, Leskovecet al. [22] observed that in contrast to existing graph-generation models, most ofthe observed networks became denser over time, the average distance betweenvertices shrinking over time. To create random complex networks that alignedwith their observations, Leskovec et al. introduced the Forest Fire model thatis based on having new vertices attach to the network by “‘burning’ throughexisting edges in epidemic fashion” [22]. In the basic version of the model,vertices first join the network one at a time. Then, each new vertex v createsan out-link to an existing vertex u. Vertex v starts burning outward from u toother vertices in the network, by linking with given probability to vertices thatare connected to u and recursively repeating the burning process with the newvertices that v was just linked to.
In 2008, McGlohon et al. [24] studied 14 real-world weighted graphs. Intheir study, they observed the following patterns in the graphs: (a) non-giantconnected components seem to stabilize in size; and (b) edges’ weights followseveral power laws with surprising exponents. Using these observed patterns,McGlohon et al. presented the Butterfly model in which new nodes can behavelike “‘social butterflies’ by choosing more than one starting point, or ‘host,’ intheir interactions; meeting nodes in the vicinity of the host, out-linking to someof them, and flying away.” [24]
In the same year, Leskovec et al. [21] performed edge-by-edge analysis of fourlarge-scale networks - Flickr, Delicious, Yahoo! Answers, and LinkedIn - withtime spans ranging from four months to almost four years. By studying a widevariety of network formation strategies, they observed that edge locality plays a
3A detailed explanation of the differences between Price’s method and the Barabasi andAlbert model for constructing complex networks can be found in [25].
5

critical role in the evolution of networks. Based on their finding, they offered amodel which focused on microscopic vertex behavior. In their proposed model,vertices arrive at a pre-specified rate and choose their lifetimes. Afterwards, eachvertex “independently initiates edges according to a ‘gap’ process, selecting adestination for each edge according to a simple triangle-closing model free ofany parameters” [21]. They showed that their model can closely mimic themacroscopic characteristics of real social networks. Additionally, Leskovec et al.,similar to this study, observed the arrival patterns of various vertices. Namely,they observed that (a) Flickr has grown exponentially over most of their networkdata; (b) Delicious has grown slightly superlinearly; (c) LinkedIn has grownquadratically; and (d) Yahoo! Answers has grown sublinearly. Due to thesevertex arrival pattern observations, they concluded that vertex arrival functionsneeded to be part of their proposed model, and they subsequently used specificvertex arrival functions as part of their network construction process. However,their study did not analyze the implications of using different arrival functions.
In 2012, Gong et al. [12] utilized data of around 30 million Google+ users tostudy the evolution of social-attribute networks (SANs). They observed that incontrast to several other social networks, the assortativity of Google+ is neu-tral. In addition, they observed that the Google+ distinct phases (initial launch,invite only, public release) manifest themselves in the social and attribute struc-tures. Gong et al. used their observations to develop a new generative modelfor social attribute networks, and they demonstrated that their proposed modelcould “reproduce SANs that accurately reflect the true ones with respect tovarious network metrics and real-world applications” [12].
In addition to the studies described above, a comprehensive review on variouscomplex network properties and various evolution models can be found at [9, 25].
2.2 Online Communities
In this study, we analyze the evolution process of social networks created inReddit’s online communities. In recent years, due to the sharp increase inonline social network platform usage, researchers have begun to explore howonline social networks and online communities develop over time.
In 2006, Backstrom et al. [4] utilized the DBLP and the LiveJournal datasetsto explore the principles by which groups evolve. Additionally, by using decision-tree techniques, they studied the structural features that influence whether indi-viduals will join a community, and whether a given group will grow significantly.Backstrom et al. discovered that the tendency of people to join communities,and of communities to grow rapidly, depends on the underlying network struc-ture. Moreover, Backstrom et al. discovered that the tendency of individuals tojoin a community is not only influenced by the number of friends the individualhas in the community, but also by how those friends are connected to each other.Furthermore, their obtained results indicated that communities with a higherpercentage of fringe members were much more likely to grow significantly overthe studied given period of time [4].
Two years later, in 2008, Backstrom et al. [5] utilized Yahoo! Groups, a
6

large-scale dataset, to study the social engagements and evolving relationshipsamong members within online groups. They discovered that group memberswho would become heavily engaged in a group in the long term received “highlydifferentiated treatment from the very first message they post.” Additionally,they discovered that a message receives a response decline as users remain heav-ily engaged in the group. Moreover, they discovered that an average memberof a small and private group will be considerably more active than an averagemember of a large and public group.
In 2012, Kairam et al. [16] utilized the Ning platform to study the factorscontributing to the growth and longevity of groups. They developed modelsfor predicting the growth and longevity of groups with different ages and sizes.Their utilized features captured the rate of growth and the proportion of thatgrowth occurring due to diffusion processes, as well as due to network-basedfeatures. Kairam et al. study’s results indicated that groups with a higherproportion of growth as a result of diffusion have a higher probability of dy-ing. Additionally, their results indicated that groups which contain relativelylarge cliques have significantly less likelihood of dying. Moreover, Kairam et al.study’s results indicated that groups that grow mainly from diffusion tend toreach smaller eventual sizes.
In addition to the general studies on online communities, there have beenseveral studies which have analyzed and studied the Reddit community. Thesestudies analyzed various data collected from Reddit.
To study the expected behavior within the Reddit community, Kelly Bergstrom [8]explored, as a case study, the story of “Grandpa Wiggly,” a Reddit communitymember who was accused of being a troll.
In 2013, Himabindu et al. [20] utilized image submissions to study the inter-play among content, title, community, and posting time. They utilized imagesposted on Reddit – multiple times with different titles, to multiple communitiesat different times – to observe how well the same content performs when postedon different scenarios. Himabindu et al. succeeded in developing models thatcan help to “understand how to better target social media content: by usingthe right title, for the right community, at the right time.”
Recently, Max Woolf published a blog post [32] in which he gave severalinsights on the Reddit dataset we used in this study. In his blog post, he alsoprovided an easy-to-follow tutorial on how to analyze the Reddit data usingGoogle’s BigQuery web service.4
3 The Reddit Dataset
To analyze UACs, we chose to use data collected from the Reddit website. Red-dit is a news aggregation website and online social platform, which was launchedin 2005 by Steve Huffman and Alexis Ohanian [8]. Reddit users (also known as“redditors”) can submit links on the website, which are then commented upon,and upvoted or downvoted by other users in order to increase or decrease the
4https://cloud.google.com/bigquery/
7

submission visibility. Redditors can also create their own subreddit on a topicof their choosing, make it public or private, and let other redditors join it. Thismakes Reddit a collection of online communities, centered around a variety oftopics such as books, gaming, science, and asking questions.5
In this study, we utilized the Reddit dataset which was recently made publicby Jason Michael Baumgartner (see Section 8). The Reddit dataset containsover 1.65 billion comments that were posted from October 2007 through May2015. These posts were created by 13,213,173 users, with unique usernames, in239,772 different subreddits. The dataset contains information on the exact timeand date each comment was posted. Moreover, for each comment, the datasetcontains the comment’s ID, as well as information on the user who posted itand the ID of the parent comment, i.e., the ID to which the current commentreplied.
For this study, we cleaned the dataset by removing nonessential comments.Namely, we removed comments that were marked as deleted and those thatdid not include the information of the user who posted them. Additionally,we removed posts by users who with high probability were bots. Namely, weremoved all the users who posted more than 100,000 comments each, and weremoved 897 redditors whose comments appeared in the bots list published inthe BotWatchman subreddit.6 After the removal of these posts, we were leftwith over 1.42 billion comments.
4 Subreddit Social Networks
In the following subsections, we give a detailed description of the methods thatwe used to construct and analyze the subreddit social networks. In Section 4.1,we introduce the methods we used to construct each subreddit’s social network.Then, in Section 4.2, we present the topological features we extracted from eachnetwork. Additionally, we provide a statistical overview of each topologicalfeature across all social networks.
4.1 Social Network Construction
To perform the analysis of the subreddits’ underlying social networks, we firstneeded to construct these social networks. However, many of the subreddits didnot contain enough users or were not active for a long enough time to extractmeaningful UACs. For example, the median number of redditors in a subredditwas 3, while only 5% of the subreddits consisted of 371 redditors or more.Therefore, for all subreddits in the clean dataset of over 1.42 billion comments,we selected only those subreddits that had at least 10 users, consisted of at least
5Each subreddit web page can be accessed at the following URL: https://www.reddit.
com/r/<SubredditName>/, by replacing SubredditName with the subreddit’s name.6We downloaded the bots list from the BotWatchman subreddit https://www.reddit.com/
r/BotWatchman/ during December 2015.
8

1,000 comments, and were active7 for at least 1 year. Out of all the subreddits,11,965 subreddits with over 1.38 billion posts (referred to as selected subreddits)fulfilled this criteria.
Next, for each selected subreddit, similar to the construction method usedby Kairam et al. [16], we created the subreddit’s social network directed graphby connecting users who posted comments as replies to other posted comments.Namely, for a subreddit, we define the subreddit’s directed graph to be: G :=<V,E > where V is the set of vertices, representing all the subreddit’s users thatposted at least a single comment in the subreddit, and e := (u, v) ∈ E is thelist of all edges between the subreddit’s users u ∈ V and v ∈ V . We definean edge between u and v to exist if there exists a comment on the subredditposted by u to which v posted a reply on the same subreddit. Lastly, weused the Powerlaw Python package [2] and observed that most of the socialnetworks’ vertex connection distributions match power law distributions withvarious exponent values. It important to notice that the constructed directedgraph also includes single vertices of redditors who posted comments and did notreceive any reply, as well as self-loop edges of redditors who posted a commentand then posted a comment as a reply to their own comment.
4.2 Calculating Topological Features
For each selected subreddit constructed social network graph, G :=< V,E >,we calculated the following topological features:• Vertices number - the number of vertices in the graph, defined as |V |.• Edges number - the number of edges in the graph, defined as |E|.• Density - the graph density, defined as D := |E|
|V |·(|V |−1) .
• Number of self-loops - the number of self-loops in the graph, defined asLoops := |{(v, v) ∈ E|v ∈ V }|.
• Number of triangles - the number of triangles (denoted by |T |) in thegraph [30].
• Average clustering coefficient - the graph’s average clustering coefficient(denoted by CC ) [28].
• Degree-based features - for a vertex v ∈ V , we defined the in-degree, out-degree, and total-degree of v to be din(v) := |{u ∈ V |∃(u, v) ∈ E}|,dout(v) := |{u ∈ V |∃(v, u) ∈ E}|, and dtot(v) := |{u ∈ V |∃(u, v) ∈E or ∃(v, u) ∈ E}|, respectively. Using the vertex degree definitions, wecan define the following graph degree features:
– avg-degree and avg-in-degree - the graph’s average-degree and average-
in-degree, defined as avg-deg :=
∑v∈V
dtot(v)
|V | and avg-in-deg :=∑v∈V
din(v)
|V | respectively.
– max-in-degree and max-out-degree - the graph’s maximum in-degreeand maximum out-degree, defined as max-in-deg := maxv∈V (din(v))
7Throughout this study, we considered the time in which a subreddit was active as thetime difference between the first and last comments published in the subreddit.
9

Table 1: Subreddits Social Network Features Overview
Feature Min Max Median Mean StdAvg-deg 0.0 53.343 1.893 2.889 3.404
Avg-in-deg 0.0 26.672 0.947 1.444 1.702CC 0.0 0.941 0.025 0.047 0.067D 0.0 0.936 0.001 0.003 0.017
Days 365.690 2,785.483 1,271.786 1,312.678 570.675LC-Ratio 0.002 1 0.416 0.389 0.189
Loops 0.0 73,791 7 88.058 931.786max-in-deg 0.0 24469 39 151.107 466.908
max-out-deg 0.0 24113 40 162.092 484.829|ELC | 0.0 4,2973,517 768 30,118.416 48,4602.036|E| 0.0 42,980,043 860 30,287.708 48,4771.671
|Single| 0.0 1643749 626 4,037.163 31,026.642|T | 0.0 73,148,002 92 70,057.296 1,289,299.629|VLC | 1.0 2,391,502 341 4345.554 39,425.021|V | 11.0 4,043,528 1,110 8605.852 70,357.225|WCC| 1.0 1,647,816 663 4,132.8 31,247.404
andmax-out-deg := maxv∈V (dout(v)), respectively, where the max func-tion returns the maximum value in a set.
• Connected components-based features - we separated the graph into aset of weakly connected components (denoted by WCC ) [31], in whichWCC := {H ≤ G|H is subgraph of G} and G = tH∈WCCH. Usingthe WCC, we can also define the graph’s largest component (referred asLC) GLC :=< VLC , ELC >, where GLC ≤ G, and ∀H :=< V ′, E′ >∈WCC, |VLC | ≥ |V ′|. Using the above definitions, we can define the follow-ing graph features:
– Number of connected components - the number of weakly connectedcomponents, defined as —WCC—.
– Largest component vertices number - the number of vertices in LC,defined as |VLC |.
– Largest component edges number - the number of edges in LC, definedas |ELC |.
– Largest component ratio - the ratio between the number of users inthe largest component and all users in the subreddit, defined as
LC-Ratio := |VLC ||V | .
– The number of single components - the number of components inWCC that consist of only a single vertex (denoted by —Single—),defined as |{H :=< V ′′, E′′ >∈WCC||V ′′| = 1}|.
Additionally, we added an extra feature (denoted as Days), where we calculatedthe number of days that had passed between the post times of the first and lastcomments.
Table 1 presents an overview of the various calculated topology features.Notice that the full set of topological features of all 11,965 selected subredditsis available online (see Section 8).
10

5 Subreddit User Arrival Curves and Results
In the following subsections, we describe in detail the methods which were usedto construct and analyze UACs. In Section 5.1, we define the UAC function andexplain how we constructed the selected subreddit UACs. Next, in Section 5.2,we describe the process we utilized to match each UAC and its correspondingfunction. Afterwards, in Section 5.3, we present the methods used to categorizethe different UACs. Lastly, Section 5.4 gives details on the methods used topredict the UAC categories based on the subreddits’ topologies.
5.1 User Arrival Curve Construction
For all the selected subreddits, we constructed the UACs using the followingmethodology: First, for each subreddit S, using the cleaned Reddit dataset, wecalculated the number of weeks (denoted as tSend) between the first commentand last comment that were posted on the subreddit, according to the dataset.Afterwards, we defined Users-NumberS(t) for t ∈ [0, tSend] to be the number ofusers who joined the subreddit t weeks since the first comments were posted onthe subreddit. We also defined the overall number of users who joined the sub-reddit after tSend weeks to be Total-UsersS . Then, using the above definitions,we defined UAC : [0, tSend]→ [0, 1] as:
UACS(t) =Users-NumberS(t)
Total-UsersS,
where UACS(0) and UACS(tSend) are always equal to 0 and 1, respectively.Lastly, to create the S UACs, we calculated the UACS value in 4-week intervals.8
By using a time interval of 4 weeks, the number of samples of the UACs for eachsubreddit ranged from 15 to 101, with a median value of 47.
5.2 User Arrival Curve Regression Analysis
To better understand the 11,965 UACs that we created, we utilized CurveExpertsoftware [14] to match several selected UACs with their best-fit functions usingregression analysis. Using CurveExpert, we obtained a list of best-fit candidatefunctions. In most cases, the best-fit function was a high-degree polynomialfunction. To avoid over-fitting of the fitted function, we used the python-fitpackage9 to find the polynomial function that was a best-fit for the majorityof UACs and still had a relatively low degree. Using the python-fit package,we discovered that 11,273 (94.2%) and 9,199 (76.9%) of the UACs matchedquartic function (q(x) := a + bX + cX2 + dX3 + eX4) with R2 ≥ 0.95 andR2 ≥ 0.99, respectively. Figure 2 presents the regressions’ R2 distributionvalues of these matched quartic functions, as well as the coefficient distributionsof the 11,273 matched quartic polynomials (referred to as matched-polynomials),
8In case tSend does not divide evenly by 4, the time interval between the next-to-last andlast UAC values will be less than 4 weeks.
9https://pypi.python.org/pypi/python-fit/1.0.0
11

which matched subreddit UACs with R2 values greater or equal to 0.95, as wellas the regressions’ R2 distribution values of these matched quartic functions.
Additionally, we performed regression analyses of the 692 UACs that did notmatch quartic functions. Out of these UACs, we observed that 274 matched the
MMF model, ab+cxd
b+xd [14], with R2 ≥ 0.95. The other 418 UACs (referred to asanomalous UACs) presented a wide range of patterns. By manually reviewingthese patterns, we can estimate that at least 37% of the UACs seem to haveunique shapes that we believe can be attributed to external events.
5.3 User Arrival Curve Categorization
After matching the UACs with their best-fit quartic functions, we could nowcategorize the different UACs. To achieve this goal, for each matched quar-tic function qS(x) of subreddit S, we defined the normalized area functionnorm-area : qS → [0, 1] as:
norm-area(qS) := narea(qS)
∫ tSend
0qS(x)dx
tSend
By the distribution of the 11,273 subreddit norm-areas, we observed that thenorm-area distributions were skewed to the right, with a minimal value of 0.065,a maximal value of 0.935, and a median value of 0.4, with a standard deviationof 0.159 (see Figure 3).
As a rule of thumb, we can foresee that fast growing subreddits, such as theBlogging subreddit (see Figure 1), will have a relatively small norm-area valueof close to 0. On the other hand, subreddits that had their growth halted forrelatively long time, such as the Eagle-Scouts subreddit (see Figure 1), will havea norm-area of about 1, and subreddits with constant growth rates will have anorm-area of about 0.5. With this rule of thumb and with the norm-area distri-butions in mind, we divided the matched-polynomials into five sets, accordingto their norm-area values: Set 1, {qS |narea(qS) ∈ [0, 0.24)} (with 905 UACs);Set 2, {qS |narea(qS) ∈ [0.24, 0.4)} (with 4,733 UACs); Set 3, {qS |narea(qS) ∈[0.4, 0.56)} (with 3,435 UACs); Set 4, {qS |narea(qS) ∈ [0.56, 0.72)} (with 1,483UACs); and Set 5, {qS |narea(qS) ∈ [0.72, 1)} (with 717 UACs). For the fivesets of matched-polynomials, we calculated the various coefficient distributions(see Figure 4), as well as manually viewed the UAC graph visualizations foreach set.10 By examining these UAC graphs, and by analyzing the coefficientdistributions in each set, we can observe the following:
1. The majority of the UACs with norm-area ∈ [0, 0.24) (Set 1) have positived and e coefficients. Therefore, in the majority of the cases these UACswill have a cubic or quartic growth rate (referred to as polynomial growth).
2. The majority of the UACs with norm-area ∈ [0.24, 0.4) (Set 2) have anegative e coefficient. Additionally, by manually reviewing the UACs, wecan observe that in most cases these UACs have a sublinear growth rate.
10The UAC graphs of each are available for download; see Section 8.
12

0.2 0.1 0.0 0.1 0.2 0.30
1000
2000
3000
4000
5000
6000
7000 a
0.10
0.05
0.00
0.05
0.10
0.15
0.20
0
1000
2000
3000
4000
5000
6000
7000
8000
9000 b
0.010
0.008
0.006
0.004
0.002
0.000
0.002
0.004
0.006
0.008
0
2000
4000
6000
8000
10000 c
0.000
20
0.000
15
0.000
10
0.000
05
0.000
00
0.000
05
0.000
10
0.000
15
0.000
20
0.000
250
2000
4000
6000
8000
10000
12000 d
0.000
0020
0.000
0015
0.000
0010
0.000
0005
0.000
0000
0.000
0005
0.000
0010
0.000
0015
0
2000
4000
6000
8000
10000
12000 e
0.95
0.96
0.97
0.98
0.99
1.00
0
1000
2000
3000
4000
5000
6000
7000
8000 R^2
Figure 2: Matched quartic polynomials’ coefficients and R2 distributions.
13

0.0 0.2 0.4 0.6 0.8 1.0Normalized Area
Figure 3: Normalized matched quartic functions’ area distributions.
In most cases the growth starts relatively slowly and then changes intolinear growth.
3. The majority of the UACs with norm-area ∈ [0.4, 0.56) (Set 3) haverelative large c coefficients. However, in most cases the d and e coefficientshave opposite signs; one is positive the other is negative. This indicatesthat most of the UACs do not grow at a fast rate. By manually reviewingthe UACs in this set, we observed that in most cases these UACs have anearly linear growth rate.
4. The majority of the UACs with norm-area ∈ [0.56, 0.72) (Set 4) have arelatively high positive b coefficient. However, in most cases the d and ecoefficients have opposite signs. This indicates that most of the UACs donot grow at a polynomial rate. Indeed, by manually examining the UACs,we observed that most UACs in this set have a superlinear growth rate.Many of the UACs in this set started with a faster than linear growth rateand then dropped to a linear growth rate.
5. The majority of the UACs with norm-area ∈ [0.72, 1) (Set 5) have rela-tively high positive b and d coefficients, and low negative c and e coeffi-cients. This indicates that the UACs grow very fast and then slow downuntil the growth stops. Indeed, we observed a growth pattern in theseUACs which is similar to the sigmoidal growth rate.
Additionally, we inspected the growth patterns of the 692 UACs that did notmatch quartic functions. The MMF model belongs to the family of sigmoidal
14

models. Therefore, the 274 UACs that matched this model have a sigmoidalgrowth rate. A closer look at the content of the other 418 anomalous UACsrevealed that many of them were related to external events that affected thegrowth, such as the launch of a new season of TV shows, special calendar dates,and the release of movies. We refer to this growth pattern as events-orientedgrowth.
5.4 User Arrival Curve Prediction
Our main goal of this study is to understand how various UAC growth ratesaffect the social networks’ topologies. To achieve this goal, using the 11,965selected subreddits that matched a quartic function, we first calculated thePearson correlations between the subreddit topological features (see Section 4.2)and the subreddit normalized-area values (see Section 5.3). Then, we usedregression algorithms to construct models which could predict a subreddit’snormalized-area values. Lastly, we used different classification algorithms toconstruct classifiers that could predict UAC categories based on their topologies.In the rest of this subsection, we provide a detailed overview of each method weused and the obtained results.
5.4.1 Correlations
We calculated the Pearson correlations between the 11,965 subreddit social net-work topological features and their normalized areas. The obtained results in-dicate that there is a weak positive correlation between norm-area and the net-work’s average clustering-coefficient (r = 0.23), and also between the norm-areaand the network’s density (r = 0.21). Additionally, there is a negligible neg-ative correlation between the norm-area and the network’s maximal in-degree(r = −0.12 ), as well as between the norm-area and the maximal out-degree(r = −0.14). Moreover, there is a moderate negative correlation between thenorm-area and the Days feature (r = −0.47).
These results indicate that subreddits that have relative smaller norm-areas,probably due to their rapid growth rates, will be active for longer periods oftime (and vice-versa). Additionally, networks with relatively high norm-areasare, in general, denser and have higher clustering-coefficients.
5.4.2 Regression Analysis
We constructed regression prediction models, which can predict a subreddit’sUAC normalized area using GraphLab Create [23]. We evaluated three regres-sion models: linear regression, Boosted Trees regression, and Random Forestregression. We created these models twice, one time using all the topologicalfeatures described in Section 4.2 and the second time with all the features plusthe Days feature. We evaluated the models using 10-folds cross validation andmeasuring the models’ average value of (a) mean absolute error (MAE ), (b)mean square error (MSE ), and (c) root mean squared error (RMSE ).
15

1 2 3 4 50.3
0.2
0.1
0.0
0.1
0.2
0.3
Val
ue
Coefficient = a
1 2 3 4 50.05
0.00
0.05
0.10
0.15
0.20 Coefficient = b
1 2 3 4 50.004
0.002
0.000
0.002
0.004
0.006
Val
ue
Coefficient = c
1 2 3 4 5Set Number
0.000200.000150.000100.000050.000000.000050.000100.000150.000200.00025 Coefficient = d
1 2 3 4 5Set Number
0.0000015
0.0000010
0.0000005
0.0000000
0.0000005
0.0000010
0.0000015
Val
ue
Coefficient = e
Figure 4: Coefficient distributions in each set.
16

Out of these regression models, the Boosted Trees regression presented thebest results, which were slightly better than the linear and Random Forest mod-els, with MAE = 0.125, MSE = 0.027, and RMSE = 0.163, using only thetopological features, and MAE = 0.114, MSE = 0.232, and RMSE = 0.152,using the topological features plus the Days feature. Additionally, the linearregression model created using the 11,965 subreddits’ topology features pre-sented an R2 value of 0.125, using only the topological features, and an R2
value of 0.262, using all the topological features plus the Days feature. More-over, in the linear regression model constructed with all the features, the CC, D,|ELC |,|VLC |, max-in-deg, Loops, |T |, and |WCC| had positive coefficients. TheAvg-deg, |E|, LC-Ratio, max-out-deg, |Single|, |V |, and Days had negativecoefficients.
5.4.3 Supervised Learning
We constructed supervised learning classifiers which can classify the category ofthe subreddit’s UAC, based on only the 11,965 selected subreddits’ topologicalfeatures, in the following way: First, we created a labeled dataset with the sixgrowth categories we defined in Section 5.3. Next, using the labeled dataset,we used WEKA [13] and constructed various classifiers using the following al-gorithms: OneR, J48 decision tree, Logistic, K-Nearest-Neighbors (KNN) withK = 1, Rotation Forest, and Random Forest. Then, we evaluated each classifierusing the 10-folds cross validation method and calculated the classifier’s AUC(area under the ROC curve) values. Lastly, we repeated the construction andevaluation process, only this time with only two growth categories – polynomialgrowth and sigmoidal growth.
Out of all the trained classifiers, the Logistic classifier obtained the bestresults, in terms of AUC, on both datasets. On the first dataset, with six cate-gories, the Logistic classifier obtained the highest weighted average AUC and thehighest correct classification percentage of 0.64 and 41.2%, respectively. Theseresults were considerably better than the simple OneR and KNN classifiers thatobtained weighted average AUCs of 0.52 and 0.53, and correct classificationpercentages of 37.4% and 31.7%, respectively. On the second dataset, whichconsisted of subreddits with only polynomial growth and sigmoidal growth, theLogistic classifier obtained the highest AUC and highest true positive rate of0.82 and 0.81, respectively. These results were considerably better than thesimple OneR and KNN classifiers that obtained AUCs of 0.67 and 0.64, andtrue positive rate of 0.7 and 0.63, respectively.
To obtain an indication of the usefulness of various features, we analyzedtheir importance using WEKA’s information gain attribute selection algorithm.On the first dataset, with all six growth categories, the top five attributes withthe highest rank were: |V | (score of 0.101), |WCC| (0.1), |Single| (0.01), D(0.088), and |VLC | (0.075).
17

6 Discussion
By analyzing the results presented in Sections 4 and 5, the following can benoted:
First, from the construction process results presented in Section 4.1, we canobserve that most of Reddit’s online communities have an activity period of lessthan a year. Moreover, we can observe that the 11,965 selected subreddits, whichare about 5% of all the subreddits in the dataset, contain 1.38 billion posts;these are 97.7% of all the posts in the constructed clean Reddit dataset. Thisindicates that most communities are short-lived and contain significantly lesscontent than the content that can be found in other more active communities.Therefore, studies aiming to analyze online communities need to carefully selectthe communities they choose to study.
Second, from Table 1 we can observe that the Reddit dataset contains manytypes of communities with a wide range of size scales and with various topologies.However, from the results presented in Section 5.2, we can surprisingly observethat even though there are many different social networks and the reasons peoplejoin these communities are varied and complex, in most online communities theUACs match quartic functions. Moreover, we can notice that among the sixidentified patterns presented in Section 5.3, there are user-join patterns whichare more common than others among the analyzed subreddits. Namely, wecan see that sublinear growth is the most common growth pattern, which wasidentified in 39.5% of all studied UACs, while anomalous patterns, which do notmatch quartic or MMF functions, appeared in 3.5% of the UACs. Moreover,near linear growth patterns, which include UACs categorized with sublinear,linear, and superlinear growth, were observed in about 80% of the UACs (seeSection 5.3).
Third, according to the high R2 values presented in Figure 4, for most sub-reddits, the subreddits’ UACs match quartic functions. The matched quarticfunctions may be able to predict how the community will grow (or decline),and also be able to identify significant events in the community. This can pro-vide valuable insights to the communities’ adminstrators, as well as to the webservice provider.
Fourth, according the correlation results presented in Section 5.4.1, we canobserve that, in general, UACs with higher normalized areas are probably denserand have higher clustering coefficients. Additionally, the negative correlationbetween the normalized area and the Days feature indicates that communitieswith smaller normalized areas, such as communities with polynomial growth,are active for longer periods of time. Furthermore, the linear regression coeffi-cients presented in Section 5.4.2, in which the D and CC features have positivecoefficients while the Days feature has a negative coefficient, support the aboveobservations. Additionally, the coefficients’ signs in the obtained linear regres-sion and the information gain results presented in Section 5.4 indicate thatlarger social networks with a higher number of users, higher number of links,and higher maximal degree features are usually more likely to have UACs withsmaller normalized areas.
18

Fifth, by observing the regression results in Section 5.4.2, which presentedmodels with relatively low RMSE values, and the classification results presentedin Section 5.4, which presented promising results with AUC of 0.82, we can inferthat analyzing a social network topology can, in many cases, predict the normal-ized area size of the UAC that created the network. Therefore, in many cases,we can predict the general pattern in which users joined the social network.Moreover, according to the classification results, the difference is noticeable be-tween social networks created by polynomial growth and social networks createdby sigmoidal growth.
Lastly, the results presented in Section 5 strongly indicate that the UAC hasa critical influence on the topological structure of a social network. This hasnever been deeply studied before. If we take the social network of a school asan example, we can assume that different social connections will be establisheddepending on whether new children join the school one by one or as a group.Of course, additional analysis would need to be performed to validate thatthere are no hidden causes that could influence both the community’s UAC andits topology. Nevertheless, developed complex network evolution models needto create social network which their topologies present different properties fordifferent input UACs.
7 Conclusions
In this study, we analyzed a unique and large-scale dataset containing over 1.65billion comments. From this dataset, we constructed 11,965 social networks(see Section 4), calculated various topological features of each social network(see Section 4.2), and created each network’s UACs (Section 5.1). Our method-ology demonstrated that most UACs match one of six user-join patterns (seeSection 5.3). Moreover, we classified the UAC category of the network, witha correct classification percentage of 41.2%, by utilizing only the social net-work’s topology. Moreover, we observed that networks with relatively largernormalized areas are denser and have higher clustering coefficients (see Sec-tions 5.4.1 and 5.4.2), while networks with smaller normalized areas tend to havehigher numbers of users and remain active for a longer time (see Sections 5.4.1,and 5.4.2).
These results indicate that complex network evolution models need to in-clude UACs as part of the models’ input. Moreover, for different UAC cate-gories, these models must create networks with different topological properties,which correlate with the topological properties observed in the subreddits’ socialnetworks which have UACs with the same category.
In the future, we hope to develop a complex evolution model that providestopological structures similar to the ones observed in this study for differentUACs. Another research direction we hope to pursue is to analyze the effect ofdifferent UACs on the topology of various complex networks, such as biologicalnetworks. A further possible research direction is to investigate how the contentof a community influences the community’s topology, and whether communities
19
with similar content have similar topologies and UACs. Moreover, the largecorpus of social networks created and released as a result of this study cangreatly contribute to better understanding online communities and complexnetworks. According Albert-Laszlo Barabasi, “If data of similar detail capturingthe dynamics of processes taking place on networks were to emerge in the comingyears, our imagination will be the only limitation to progress” [7].
8 Data and Code Availability
Instructions on how to download the raw Reddit dataset are available in thefollowing Reddit post. Additionally, the dataset can be downloaded from thislink. This study is reproducible research. Therefore, the social network datasets,a considerable part of the study’s code, are available for other researchers in thislink, or by contacting the paper’s first author. Moreover, we developed a websitewhich give researchers the ability to interactively explore and better understandthe social networks in this study’s dataset (see Appendix A).
9 Acknowledgments
First and foremost, we would like to thank Jason Michael Baumgartner formaking the Reddit dataset available online. We would like to thank Carol Tee-garden for editing and proofreading this article to completion. We also want tothank Stephen Spencer for his IT expertise which greatly assisted us during thisresearch. We thank Washington Research Foundation Fund for Innovation inData-Intensive Discovery, and Moore/Sloan Data Science Environments Projectat the University of Washington for supporting this study.
References
[1] R. Albert and A.-L. Barabasi. Statistical mechanics of complex networks.Reviews of modern physics, 74(1):47, 2002.
[2] J. Alstott, E. Bullmore, and D. Plenz. powerlaw: a python package foranalysis of heavy-tailed distributions. PloS one, 9(1):e85777, 2014.
[3] M. Armbrust, A. Fox, R. Griffith, A. D. Joseph, R. Katz, A. Konwinski,G. Lee, D. Patterson, A. Rabkin, I. Stoica, et al. A view of cloud computing.Communications of the ACM, 53(4):50–58, 2010.
[4] L. Backstrom, D. Huttenlocher, J. Kleinberg, and X. Lan. Group formationin large social networks: membership, growth, and evolution. In Proceed-ings of the 12th ACM SIGKDD international conference on Knowledgediscovery and data mining, pages 44–54. ACM, 2006.
20

[5] L. Backstrom, R. Kumar, C. Marlow, J. Novak, and A. Tomkins. Prefer-ential behavior in online groups. In Proceedings of the 2008 InternationalConference on Web Search and Data Mining, pages 117–128. ACM, 2008.
[6] A.-L. Barabasi and R. Albert. Emergence of scaling in random networks.science, 286(5439):509–512, 1999.
[7] A.-L. Barabasi et al. Scale-free networks: a decade and beyond. science,325(5939):412, 2009.
[8] K. Bergstrom. “don’t feed the troll”: Shutting down debate about commu-nity expectations on reddit. com. First Monday, 16(8), 2011.
[9] S. Boccaletti, V. Latora, Y. Moreno, M. Chavez, and D.-U. Hwang. Com-plex networks: Structure and dynamics. Physics reports, 424(4):175–308,2006.
[10] M. Bostock, V. Ogievetsky, and J. Heer. D3 data-driven documents. Visual-ization and Computer Graphics, IEEE Transactions on, 17(12):2301–2309,2011.
[11] E. Estrada. Journal of complex networks: Quo vadis? Journal of ComplexNetworks, 1(1):1–2, 2013.
[12] N. Z. Gong, W. Xu, L. Huang, P. Mittal, E. Stefanov, V. Sekar, andD. Song. Evolution of social-attribute networks: measurements, modeling,and implications using google+. In Proceedings of the 2012 ACM conferenceon Internet measurement conference, pages 131–144. ACM, 2012.
[13] M. Hall, E. Frank, G. Holmes, B. Pfahringer, P. Reutemann, and I. H.Witten. The weka data mining software: an update. ACM SIGKDD ex-plorations newsletter, 11(1):10–18, 2009.
[14] D. Hyams. Curveexpert software. http: // www. curveexpert. net , 2010.
[15] Kaggle. Identify signs of diabetic retinopathy in eye images. https://www.kaggle.com/c/diabetic-retinopathy-detection. [Online; accessed 25-January-2016].
[16] S. R. Kairam, D. J. Wang, and J. Leskovec. The life and death of onlinegroups: Predicting group growth and longevity. In Proceedings of the fifthACM international conference on Web search and data mining, pages 673–682. ACM, 2012.
[17] A. Karpistsenko. The marinexplore and cornell university whaledetection challenge - summary of the competition. https:
//www.kaggle.com/c/whale-detection-challenge/forums/t/4472/
summary-of-the-competition. [Online; accessed 25-January-2016].
[18] K. Klemm and V. M. Eguiluz. Growing scale-free networks with small-world behavior. Physical Review E, 65(5):057102, 2002.
21

[19] Y. Koren. The bellkor solution to the netflix grand prize. Netflix prizedocumentation, 81, 2009.
[20] H. Lakkaraju, J. J. McAuley, and J. Leskovec. What’s in a name? under-standing the interplay between titles, content, and communities in socialmedia. ICWSM, 1(2):3, 2013.
[21] J. Leskovec, L. Backstrom, R. Kumar, and A. Tomkins. Microscopic evolu-tion of social networks. In Proceedings of the 14th ACM SIGKDD interna-tional conference on Knowledge discovery and data mining, pages 462–470.ACM, 2008.
[22] J. Leskovec, J. Kleinberg, and C. Faloutsos. Graphs over time: densificationlaws, shrinking diameters and possible explanations. In Proceedings of theeleventh ACM SIGKDD international conference on Knowledge discoveryin data mining, pages 177–187. ACM, 2005.
[23] Y. Low, J. E. Gonzalez, A. Kyrola, D. Bickson, C. E. Guestrin, andJ. Hellerstein. Graphlab: A new framework for parallel machine learning.arXiv preprint arXiv:1408.2041, 2014.
[24] M. McGlohon, L. Akoglu, and C. Faloutsos. Weighted graphs and discon-nected components: patterns and a generator. In Proceedings of the 14thACM SIGKDD international conference on Knowledge discovery and datamining, pages 524–532. ACM, 2008.
[25] M. E. Newman. The structure and function of complex networks. SIAMreview, 45(2):167–256, 2003.
[26] D. Price. Statistical studies of networks of scientific papers. In StatisticalAssociation Methods for Mechanized Documentation: Symposium Proceed-ings, volume 269, page 187. US Government Printing Office, 1965.
[27] D. Price de Solla. A general theory of bibliometric and other cumulativeadvantage process. Journal of the American Society of Information Science,27:292–306, 1976.
[28] J. Saramaki, M. Kivela, J.-P. Onnela, K. Kaski, and J. Kertesz. Generaliza-tions of the clustering coefficient to weighted complex networks. PhysicalReview E, 75(2):027105, 2007.
[29] J. Saxe and K. Berlin. Deep neural network based malware detection usingtwo dimensional binary program features. arXiv preprint arXiv:1508.03096,2015.
[30] T. Schank. Algorithmic aspects of triangle-based network analysis. Phd incomputer science, University Karlsruhe, 3, 2007.
[31] E. W. Weisstein. Weakly connected component. http://mathworld.
wolfram.com/WeaklyConnectedComponent.html. [Online; accessed 5-February-2016].
22

(a) The fifa2013 subreddit social net-work
(b) The Blogging subreddit social net-work
Figure A.5: Blogging and fifa2013 social networks. It is noticeable that thefifa2013 social network is considerably denser than the Blogging social network
[32] M. Woolf. How to analyze every reddit submission and comment, in sec-onds, for free. http://minimaxir.com/2015/10/reddit-bigquery/. [On-line; accessed 29-January-2016].
[33] M. Zaharia, M. Chowdhury, M. J. Franklin, S. Shenker, and I. Stoica.Spark: cluster computing with working sets. In Proceedings of the 2ndUSENIX conference on Hot topics in cloud computing, volume 10, page 10,2010.
A Visualzing the Impact of User Arrival Curveson the Social Network Topology
During this research, we observed that in many cases the topological differencesof the social networks with different UAC categories can be easily observed usingthe social networks’ graph images. For example, in Figure A.5, we can noticethat the fifa2013 social network, which has 5,657 vertices, 11,243 edges, anda sigmoidal growth UAC, is considerably denser and has fewer single verticesthan the blogging social network, which has 2,301 vertices, 4,591 edges, and apolynomial growth UAC. To better understand how different UACs influencethe structure of the subreddits’ social network, we created a web interface (seeFigure A.6 and Section 8), which enables users to view each subreddit’s socialnetwork UAC and other features, as well as visualize a sample of a selectedsocial network’s topology. We believe that using this interface will empowerusers to perform their own investigation of the social networks corpus.
23
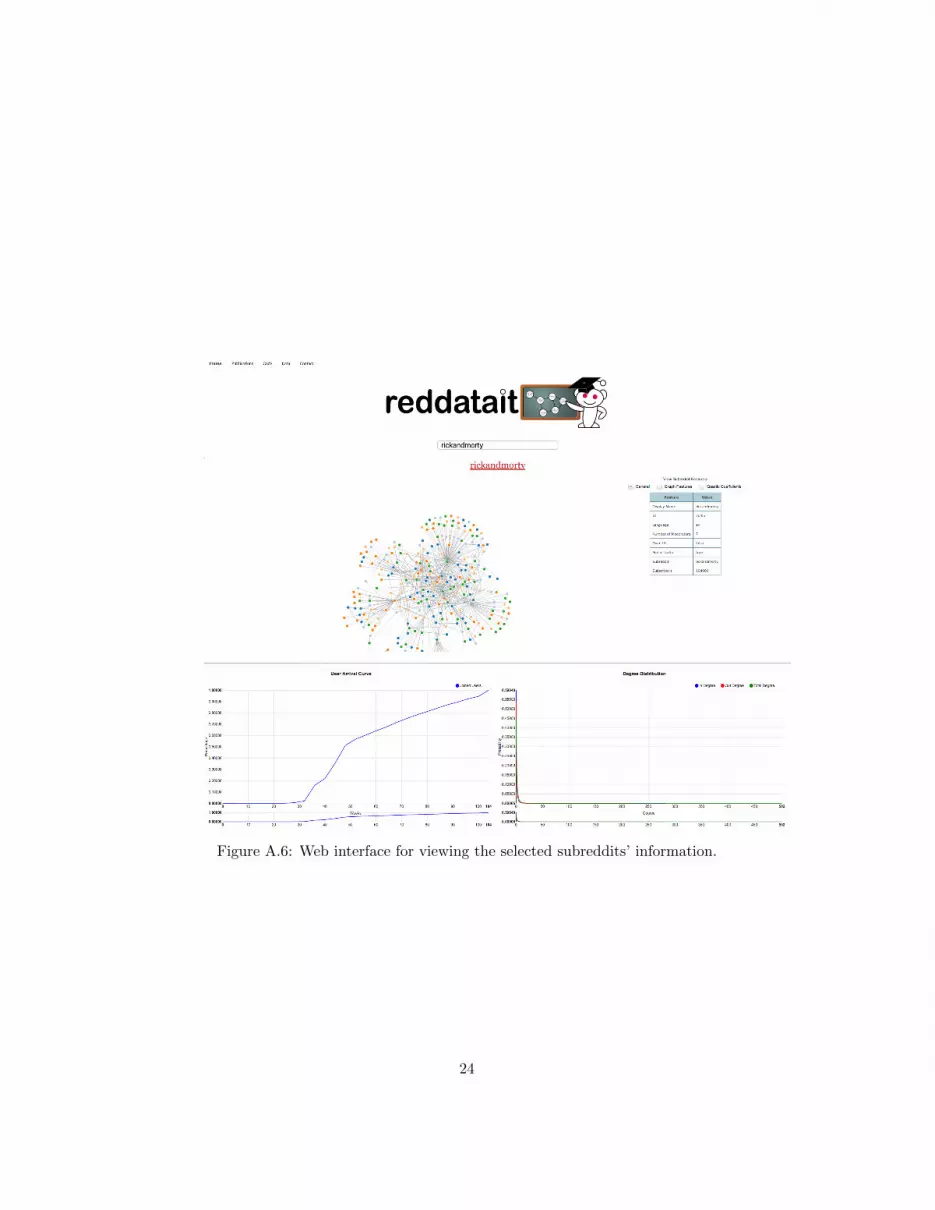
Figure A.6: Web interface for viewing the selected subreddits’ information.
24
Recommended


