Debugging Tools
Robert D. French Adam Simpson
NCCS User Assistance
2
ALLINEA DDT Memory Analysis and Debugging
3
DDT
• Graphical Parallel Debugging Tool • Supports CPU, Memory, and GPU Debugging – Memory debugging similar to Valgrind – Catch out-‐of-‐bounds access – Race DetecBon
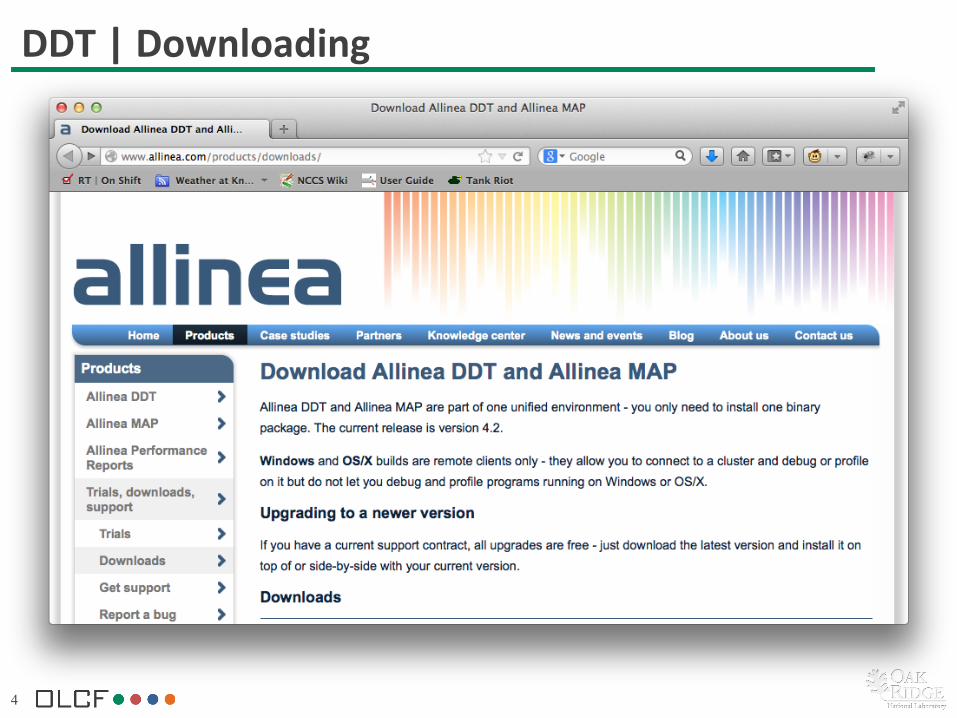
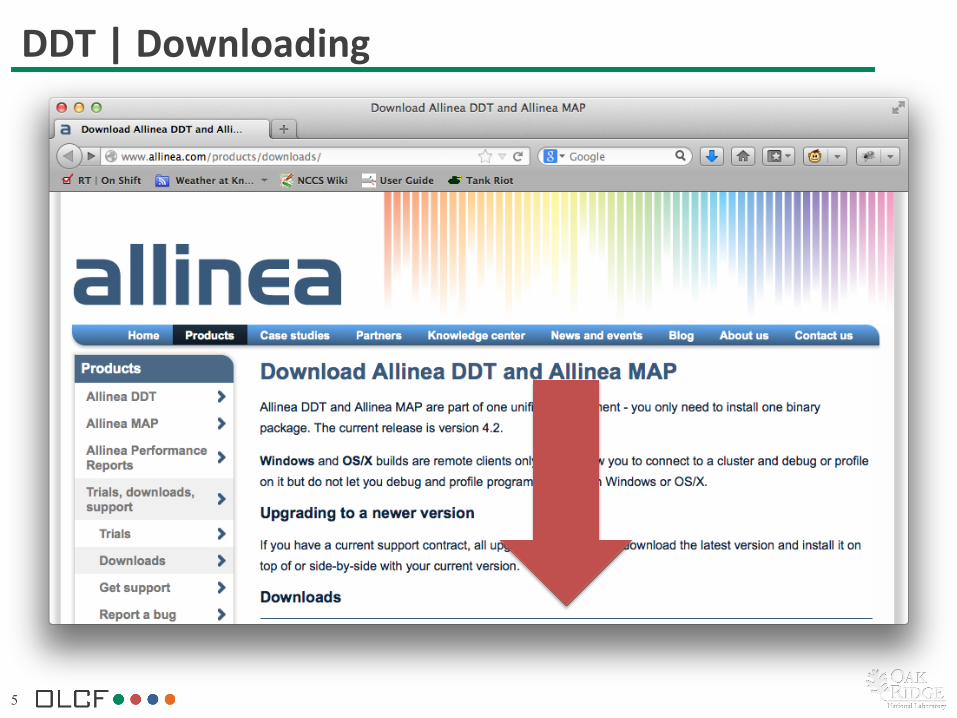
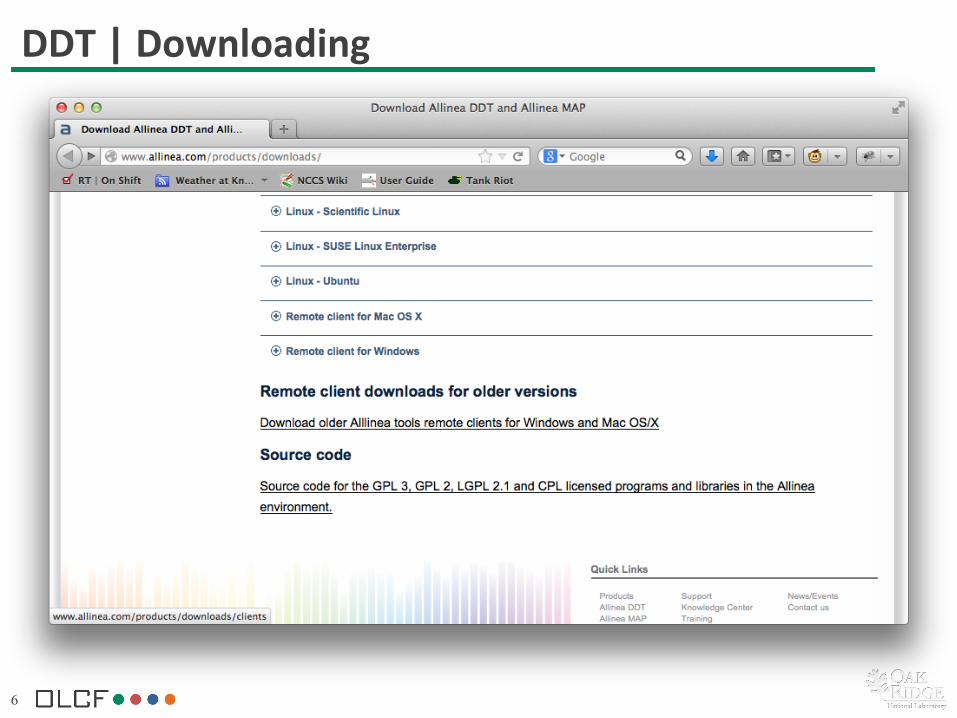
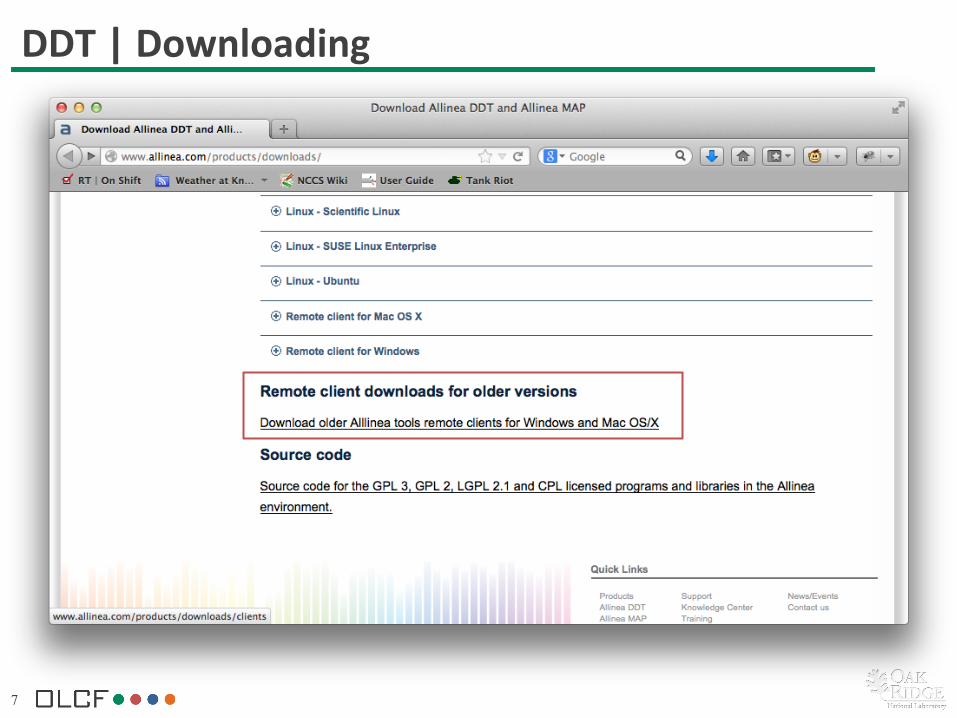
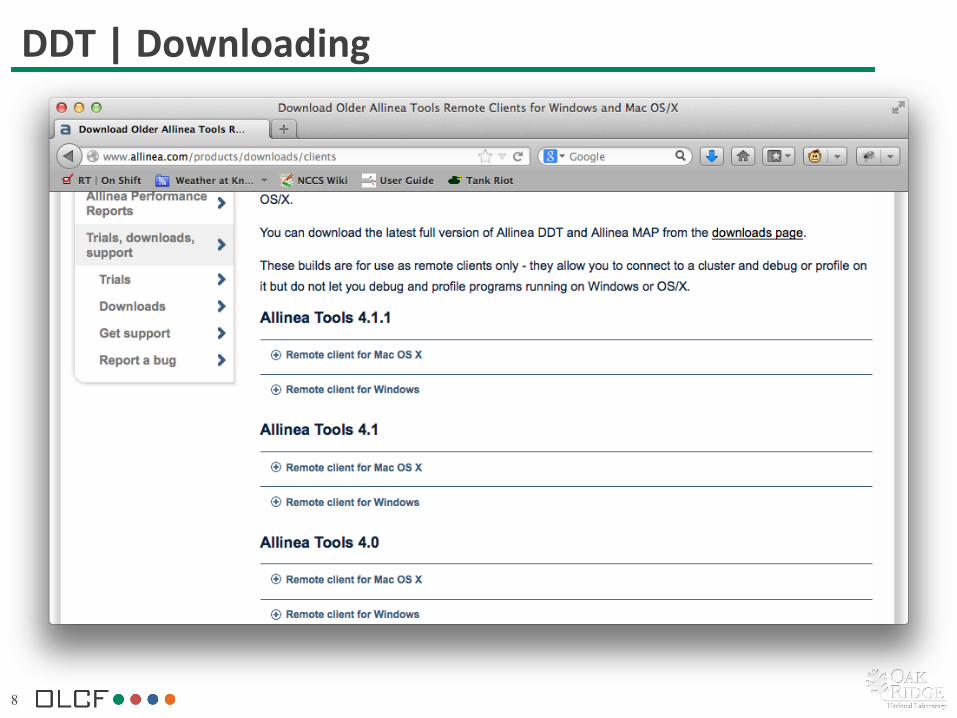
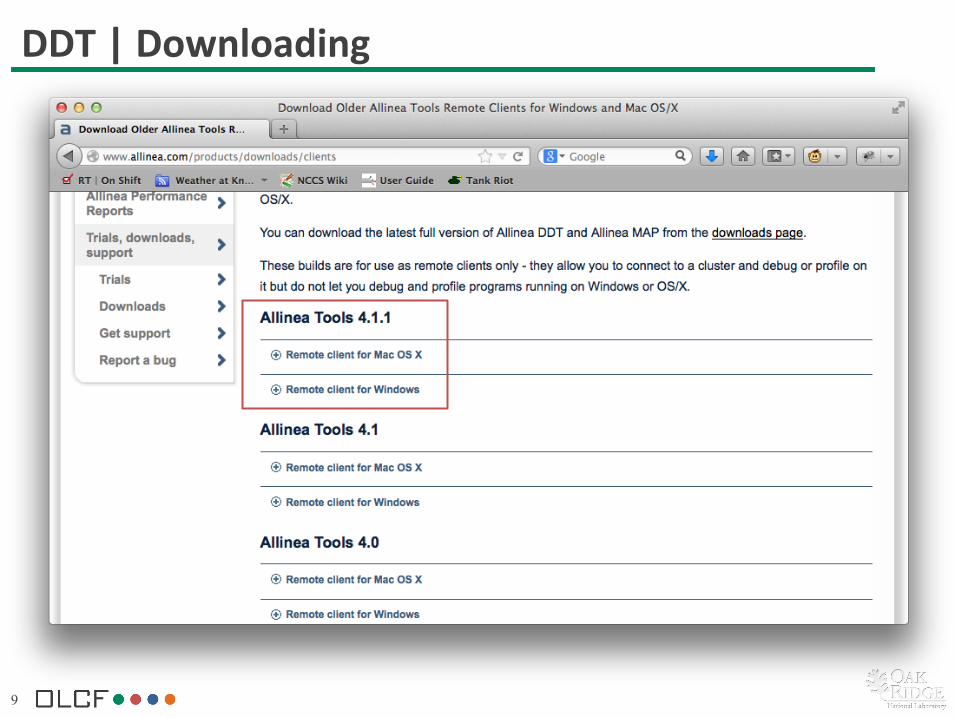
• DDT Remote Client (to avoid X11 tunneling) – hHp://www.allinea.com/products/downloads/ – hHps://www.olcf.ornl.gov/kb_arBcles/using-‐the-‐ddt-‐remote-‐client/
4
DDT | Downloading
5
DDT | Downloading
6
DDT | Downloading
7
DDT | Downloading
8
DDT | Downloading
9
DDT | Downloading
10
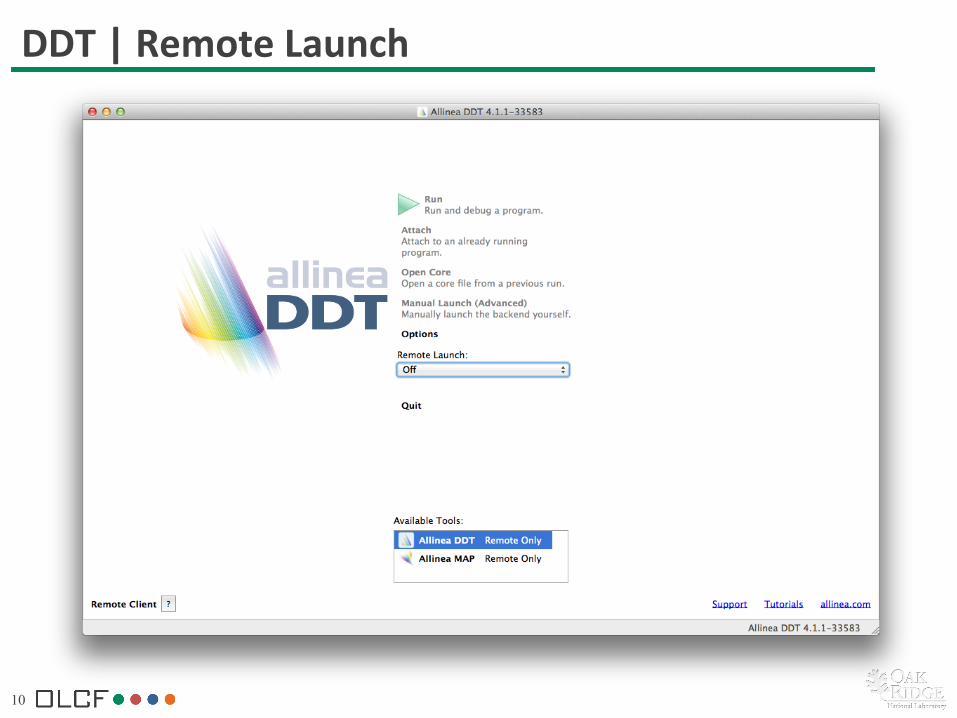
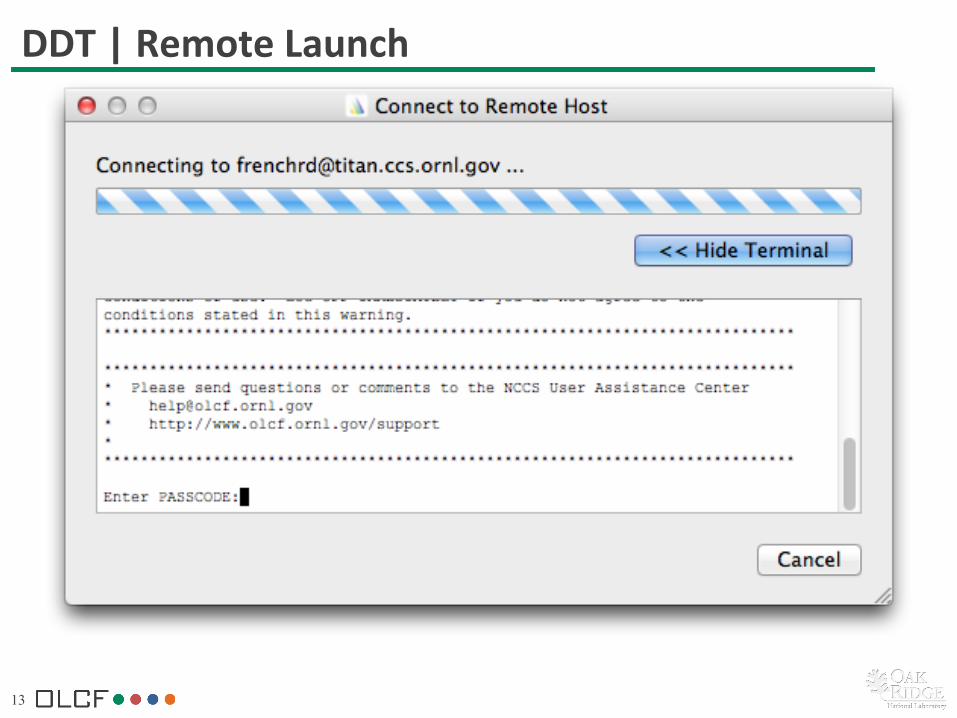
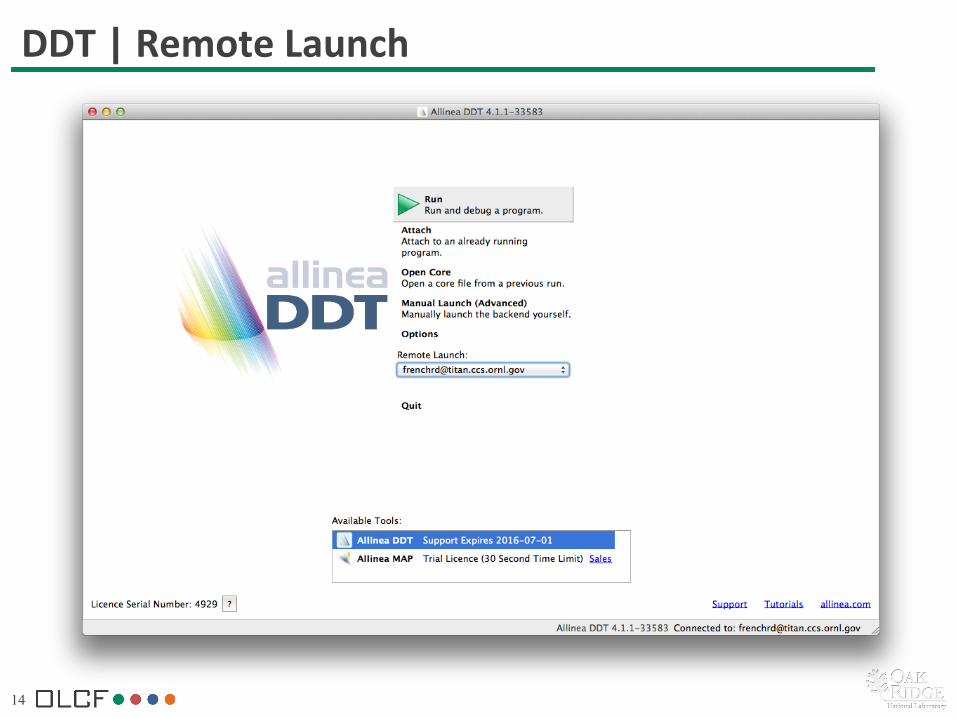
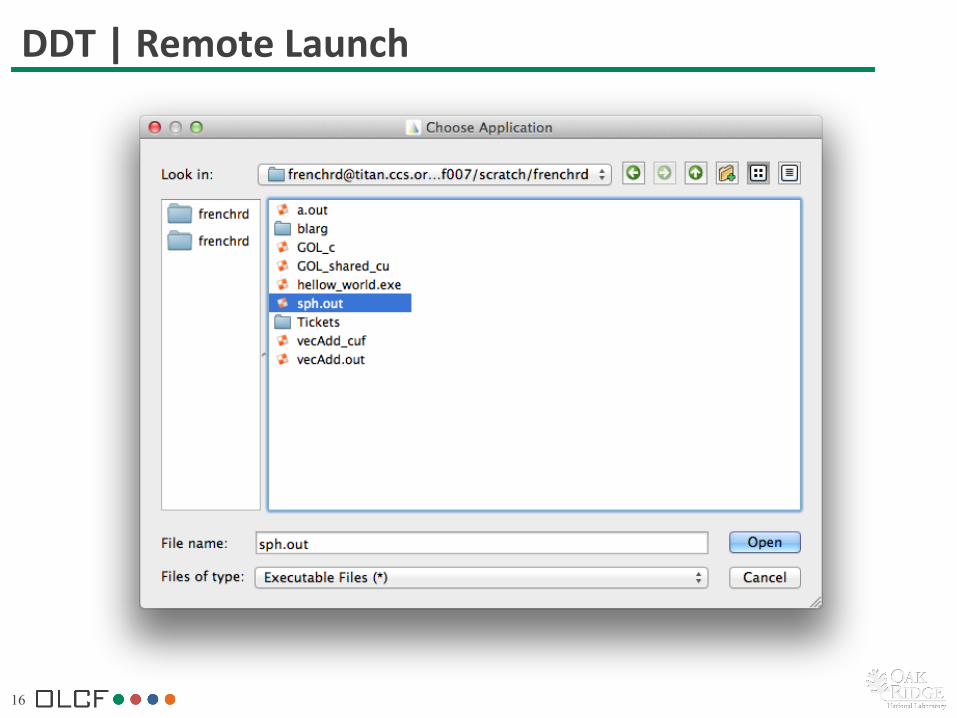
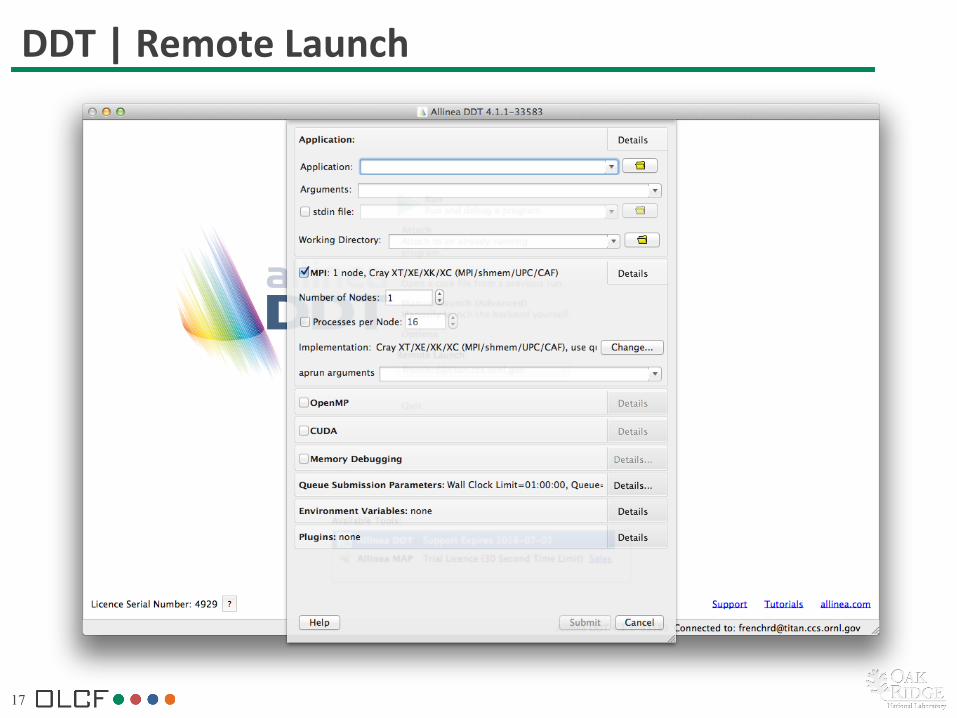
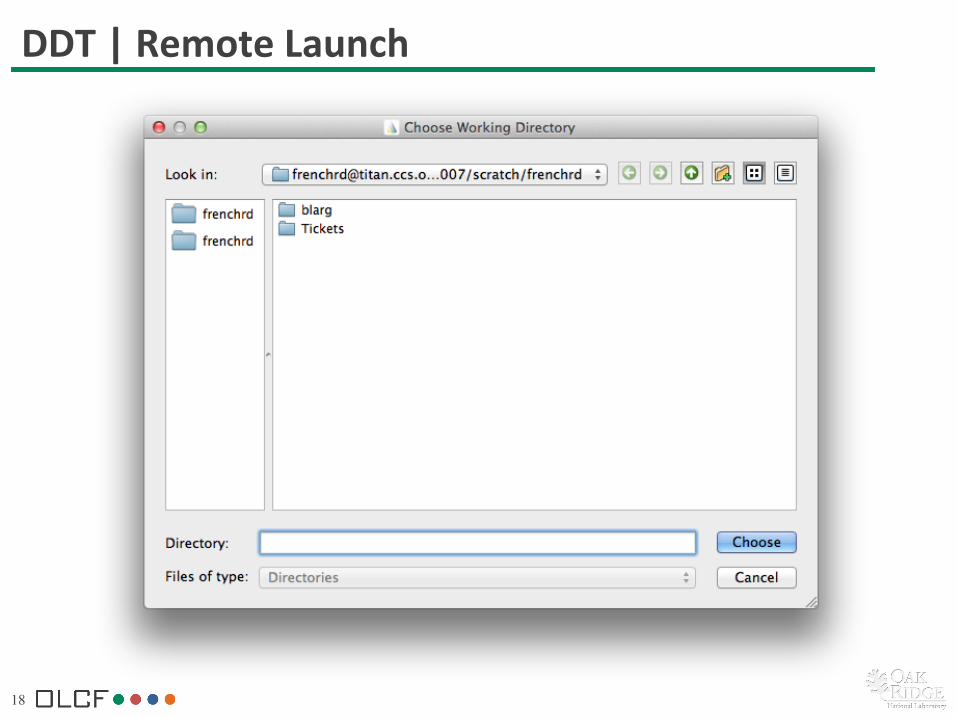
DDT | Remote Launch
11
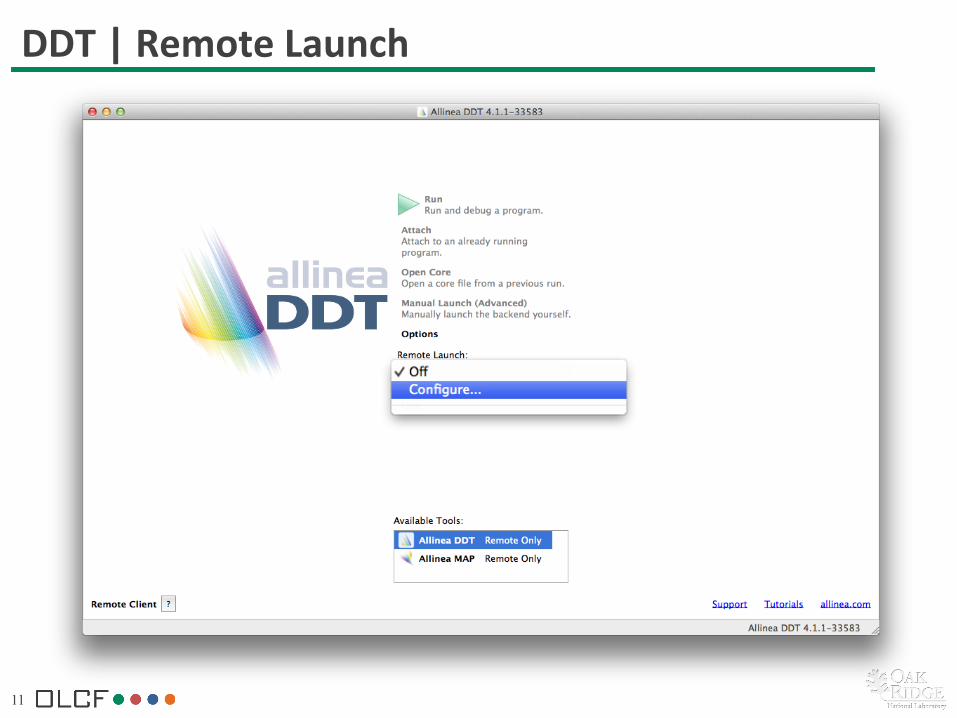
DDT | Remote Launch
12
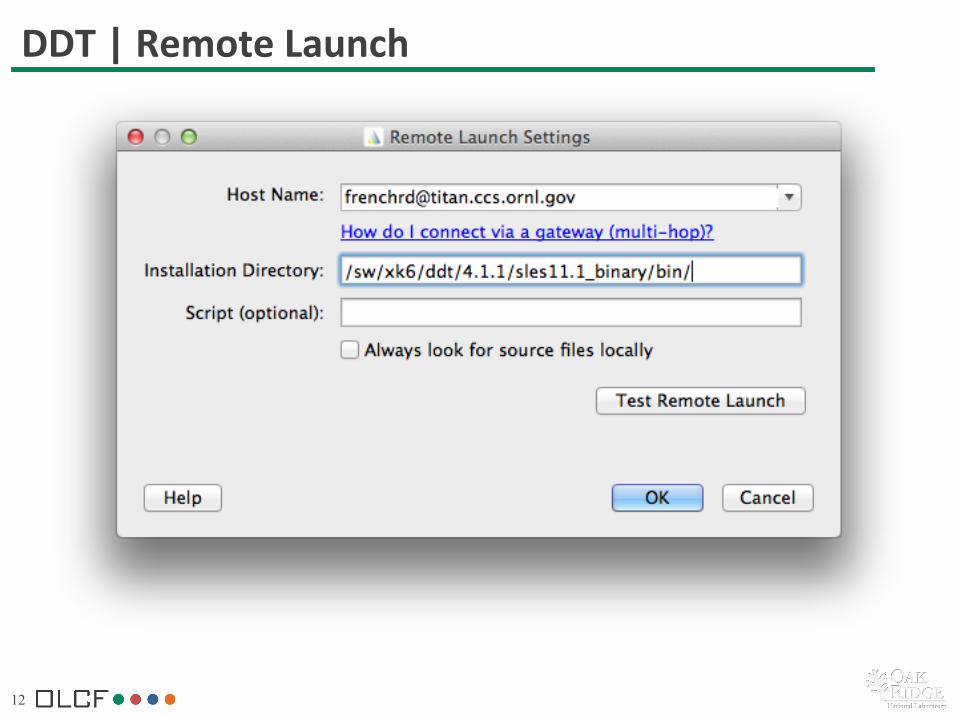
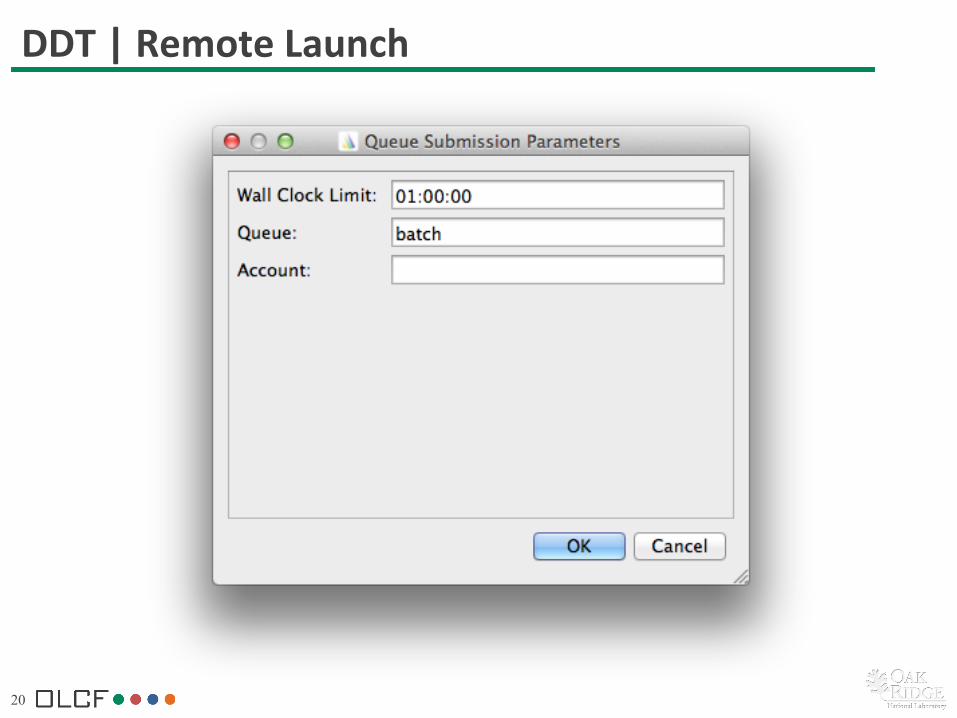
DDT | Remote Launch
13
DDT | Remote Launch
14
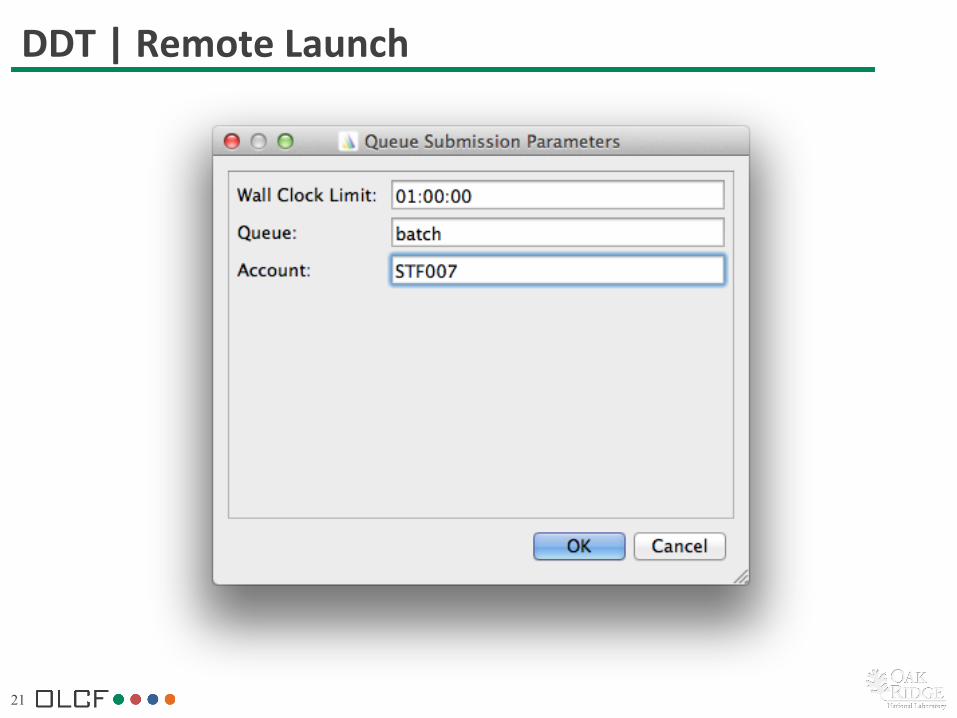
DDT | Remote Launch

15
DDT | Remote Launch
16
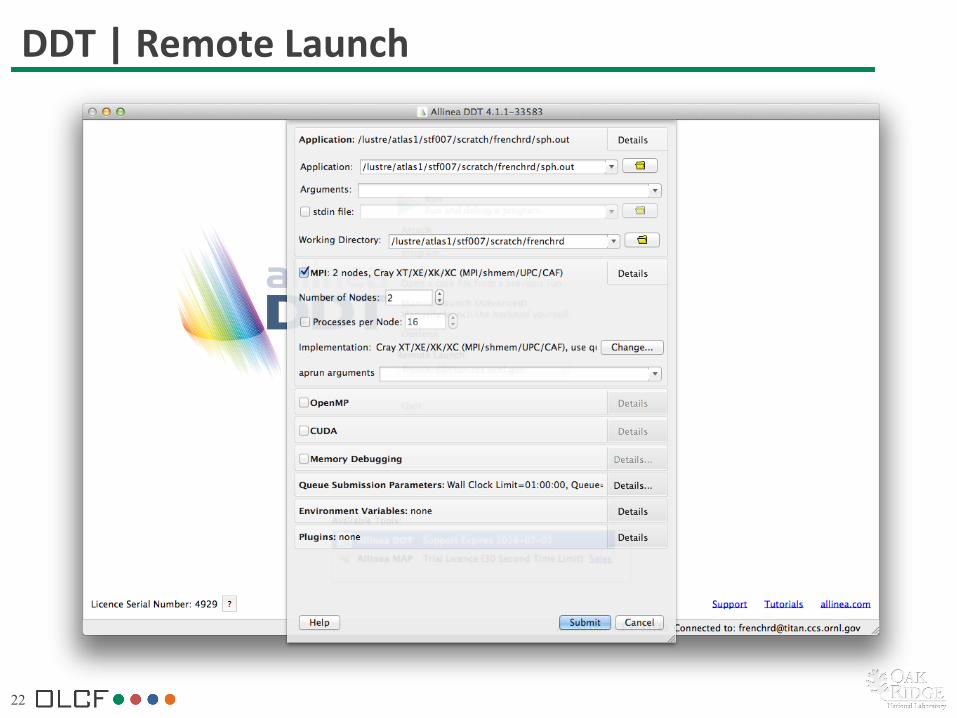
DDT | Remote Launch
17
DDT | Remote Launch
18
DDT | Remote Launch

19
DDT | Remote Launch
20
DDT | Remote Launch
21
DDT | Remote Launch
22
DDT | Remote Launch
23
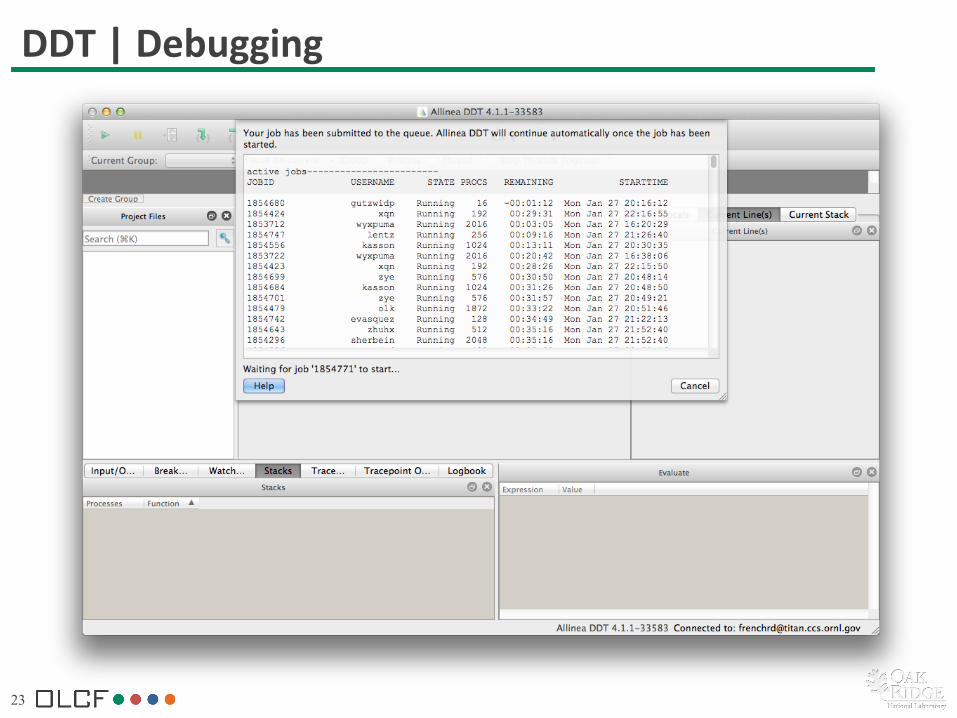
DDT | Debugging
24
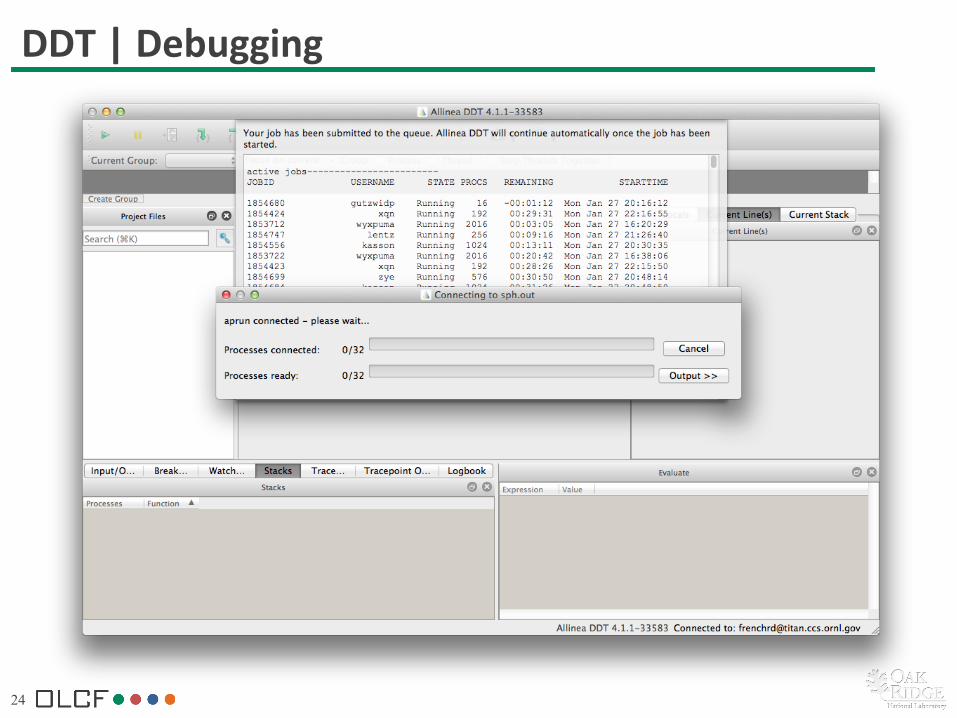
DDT | Debugging
25
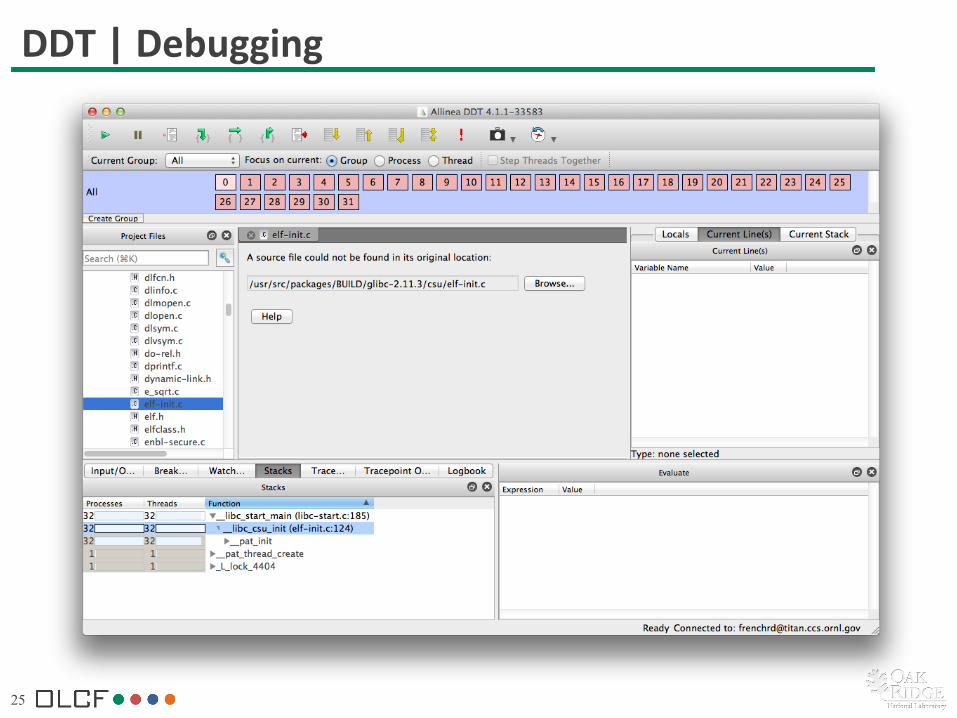
DDT | Debugging
26
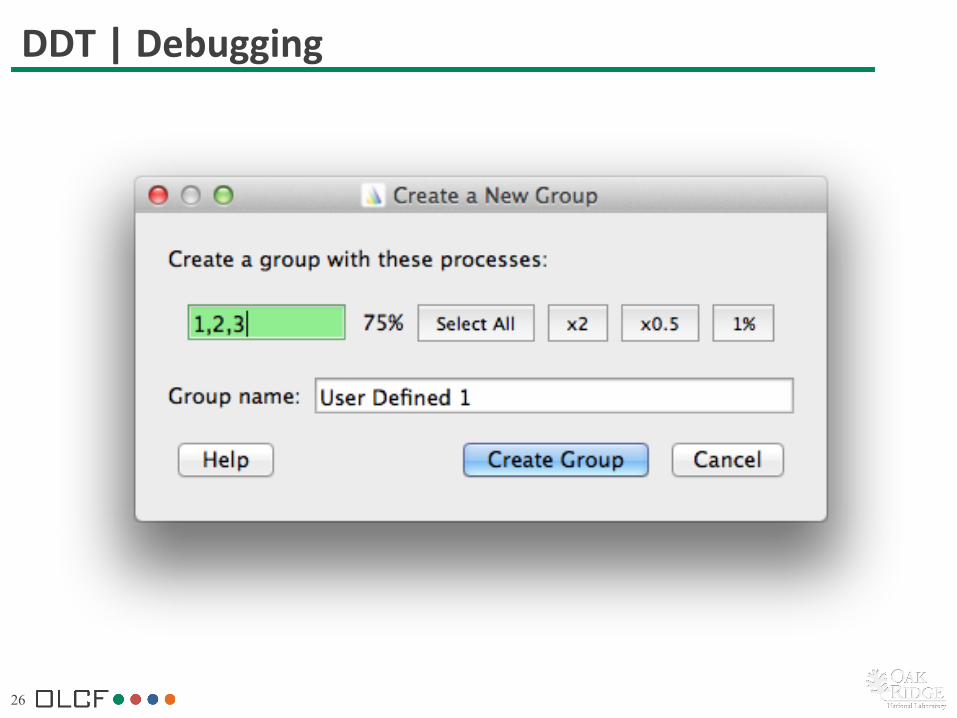
DDT | Debugging
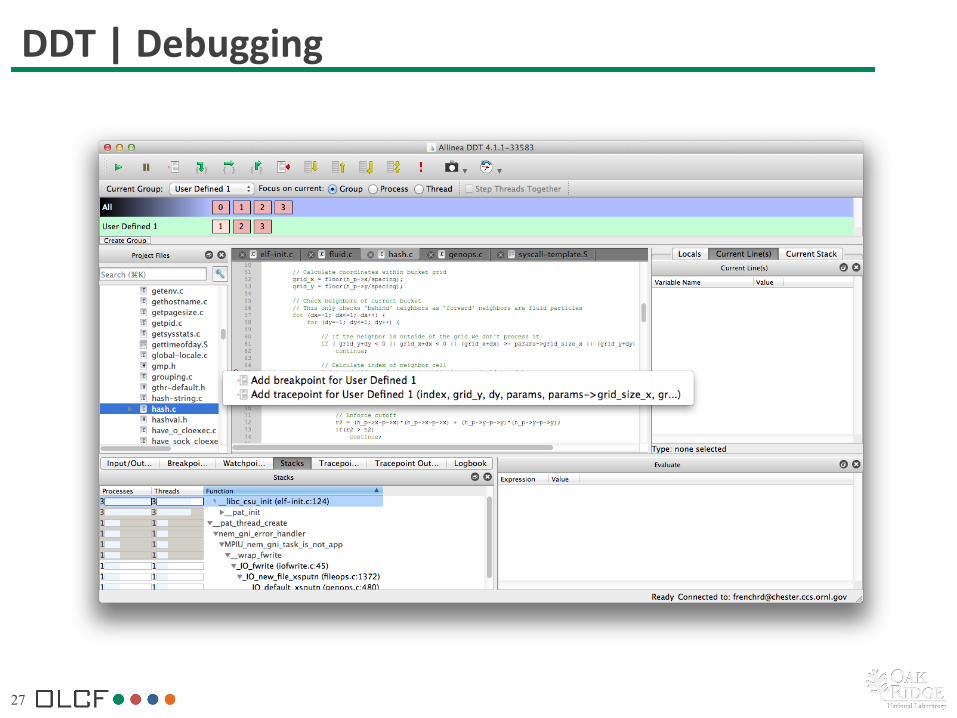
27
DDT | Debugging
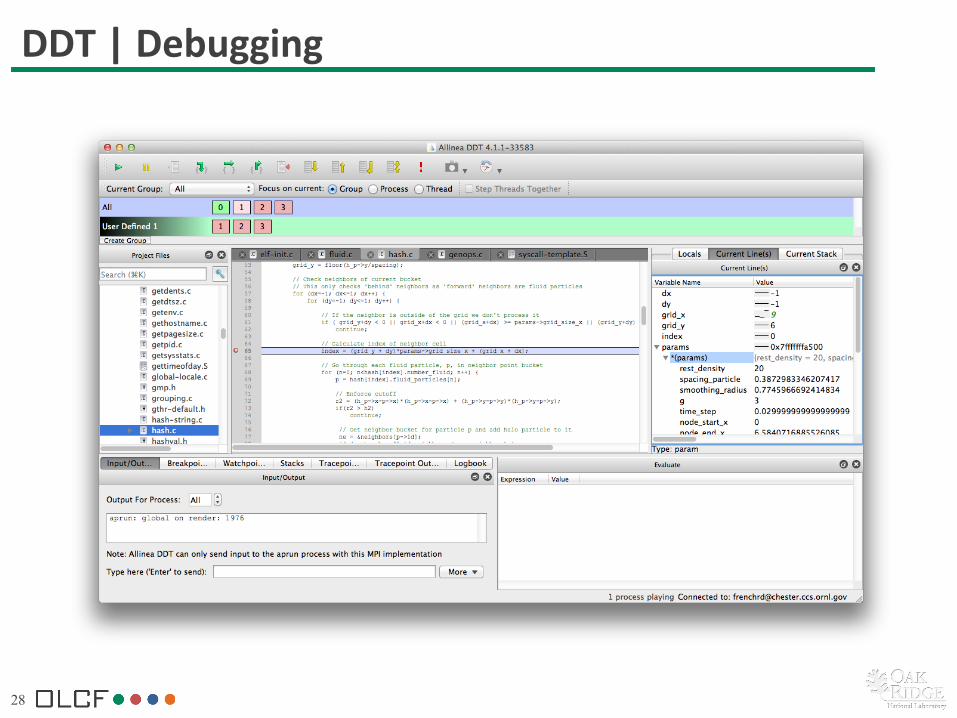
28
DDT | Debugging
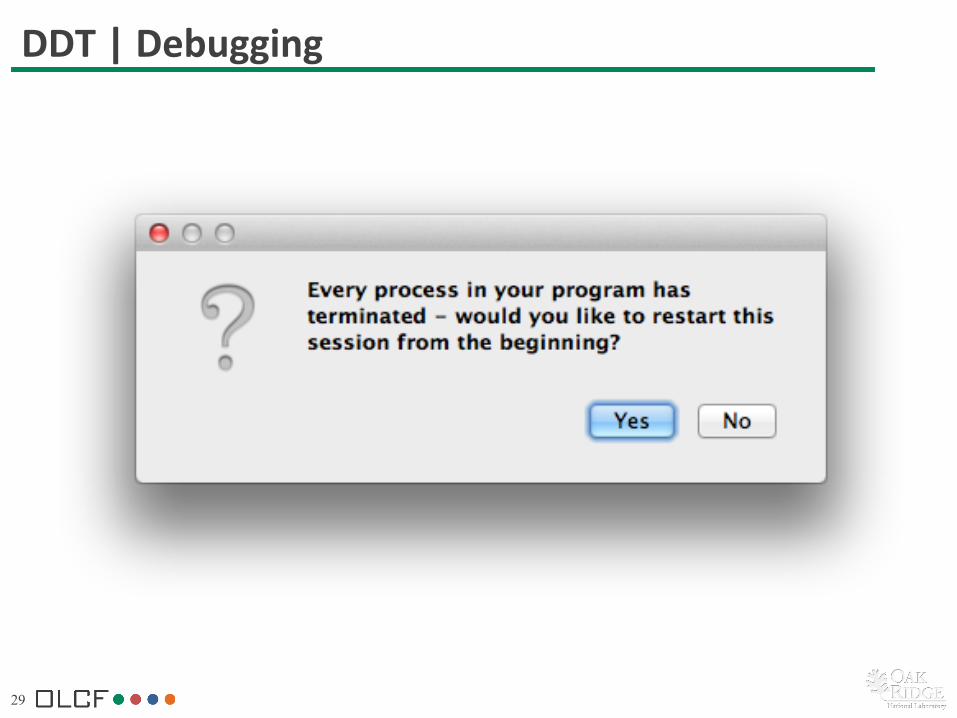
29
DDT | Debugging
30
CRAYPAT-‐LITE Cray Performance Analysis Tool
31
Craypat-‐lite
• Provides Sample-‐based profiling – Checks periodically to see what funcBon you are in
• To enable: – module load perPools-‐lite – Recompile – Launch as normal
• Generates reports & suggesBons
32
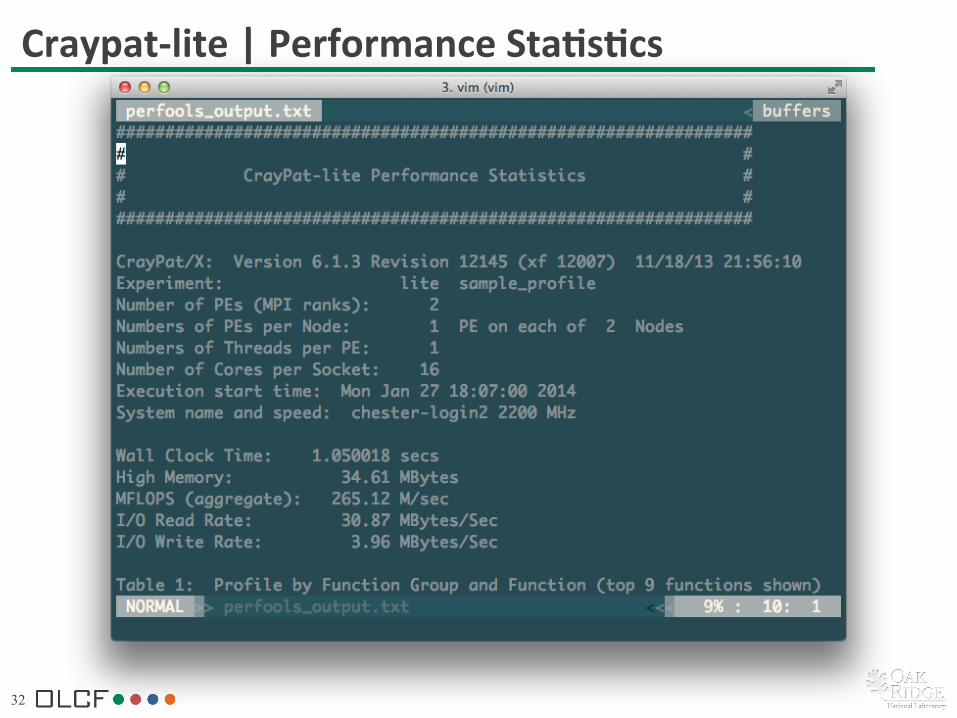
Craypat-‐lite | Performance StaGsGcs
33
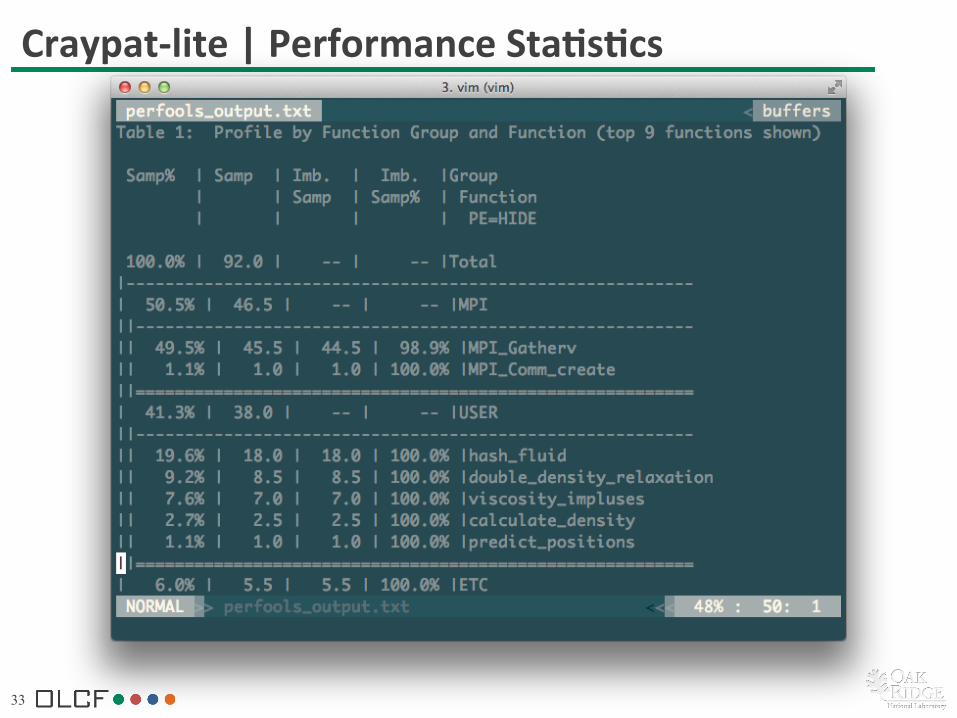
Craypat-‐lite | Performance StaGsGcs
34
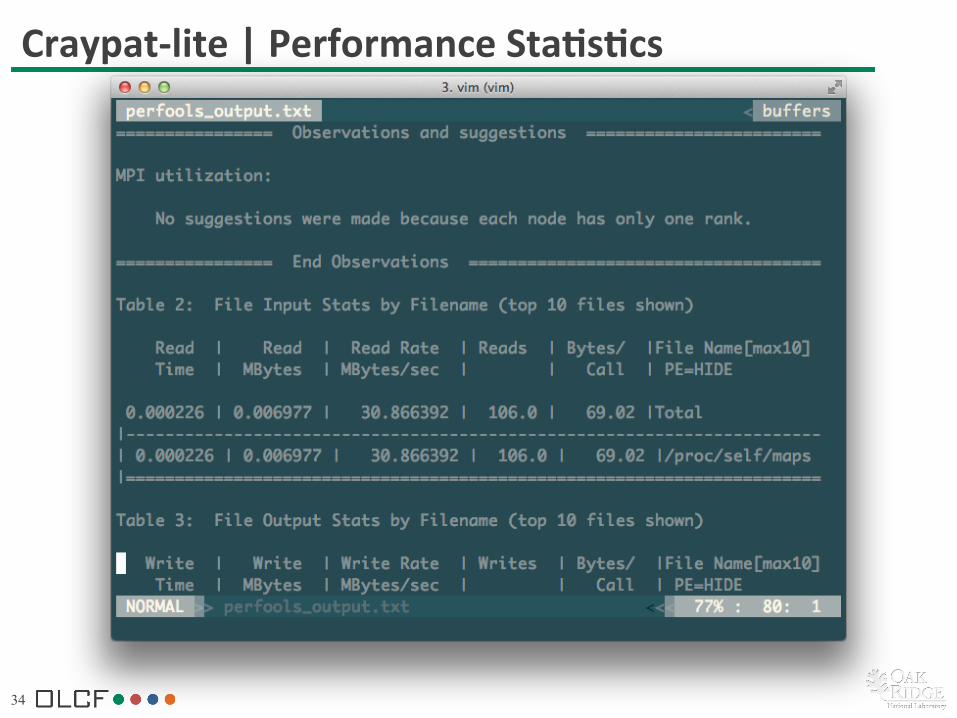
Craypat-‐lite | Performance StaGsGcs
35
Craypat-‐lite
• Provides Sample-‐based profiling – Checks periodically to see what funcBon you are in
• To enable: – module load perPools-‐lite – Recompile – Launch as normal
• Generates reports & suggesBons – pat_report – app2 (GUI)
36
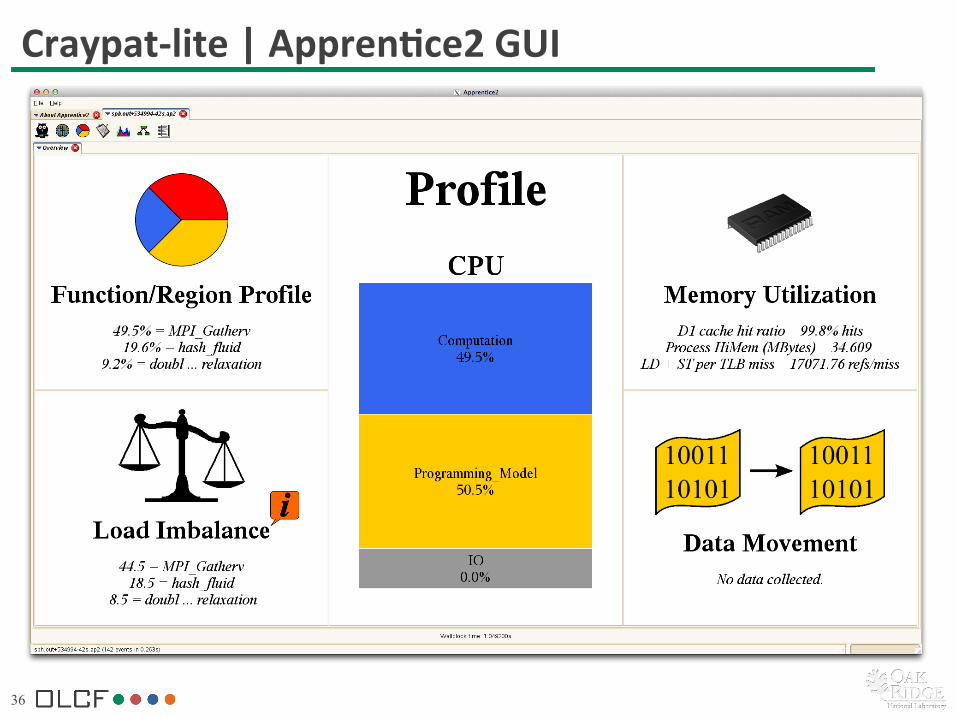
Craypat-‐lite | ApprenGce2 GUI
37
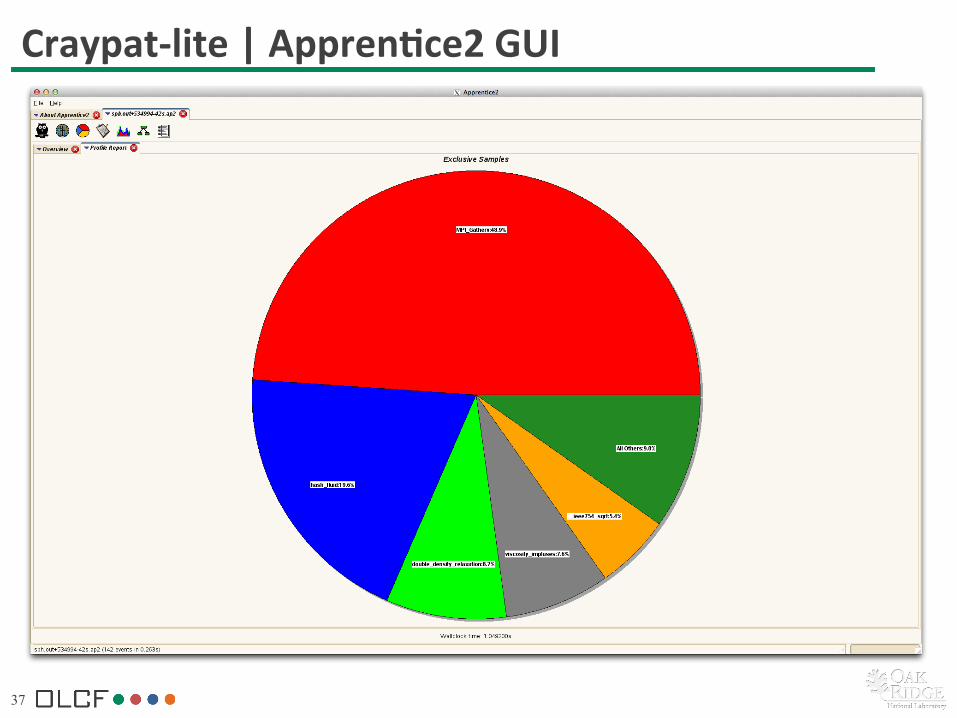
Craypat-‐lite | ApprenGce2 GUI
38
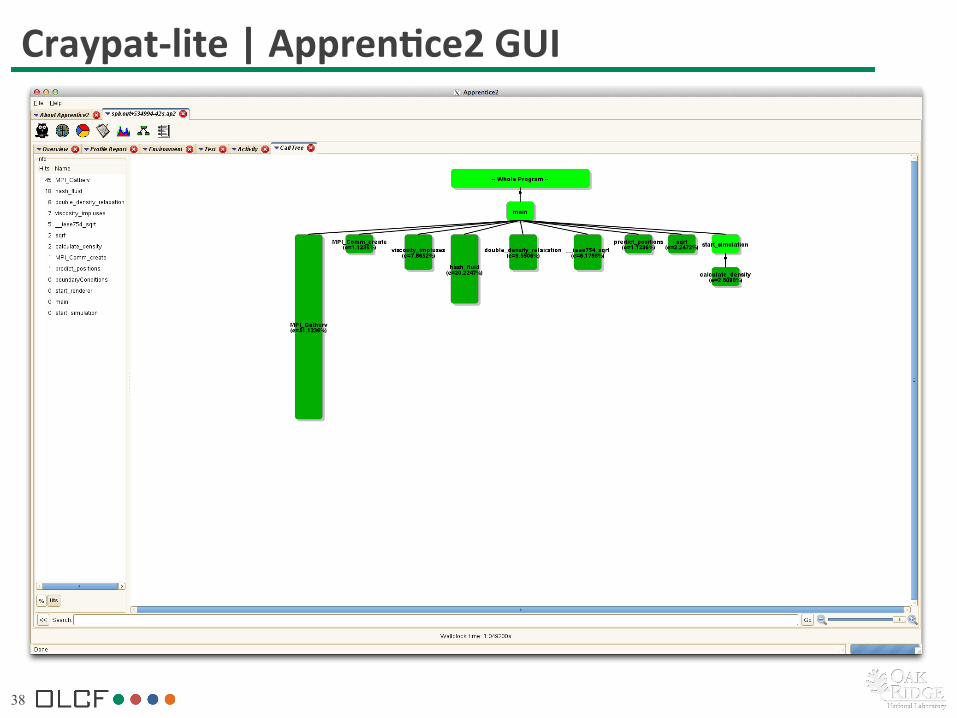
Craypat-‐lite | ApprenGce2 GUI
39
NVPROF NVIDIA Profiling Tool
40
nvprof
• GPU Kernel profiler from NVIDIA • Produces sample-‐based profiling – Checks periodically to see which funcBon is execuBng
• To load, simply >module load cudatoolkit – Then >aprun nvprof application
41
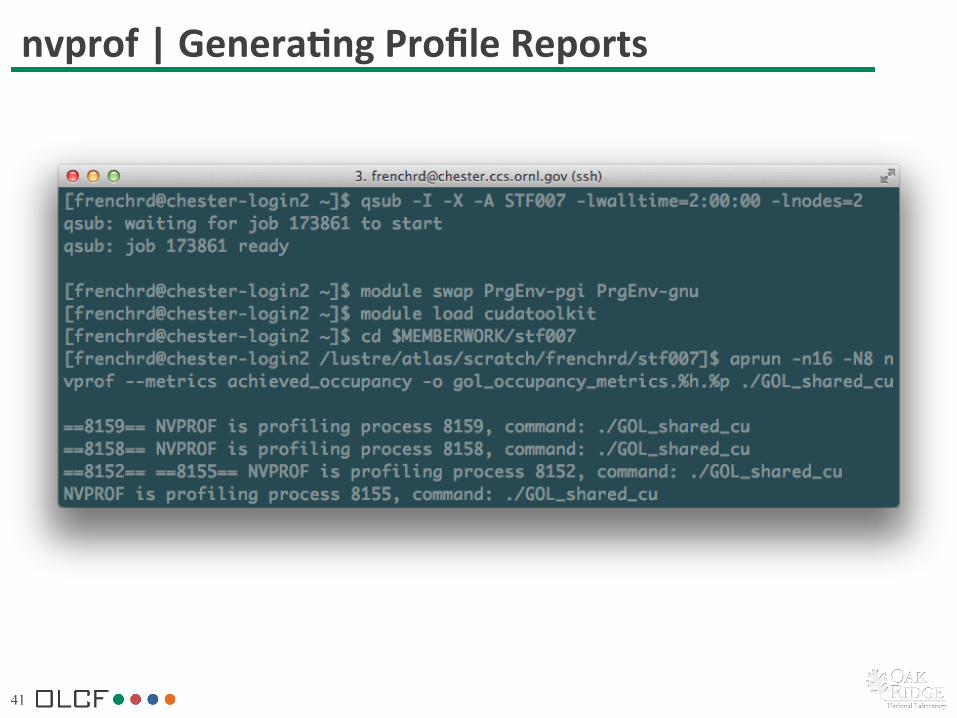
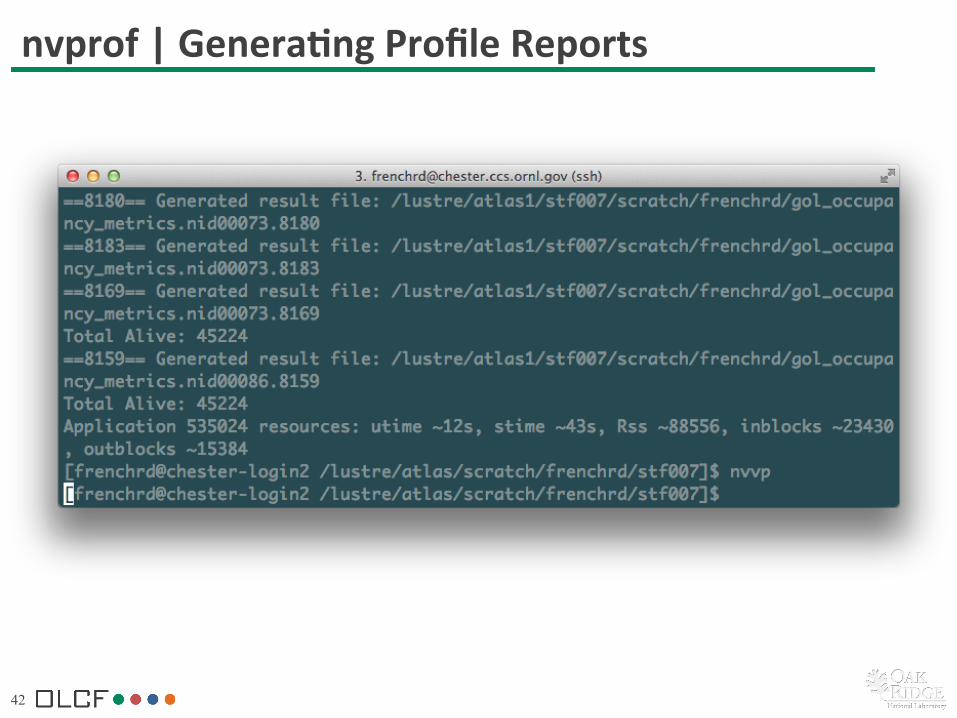
nvprof | GeneraGng Profile Reports
42
nvprof | GeneraGng Profile Reports
43
nvprof | NVIDIA Visual Profiler (nvvp)
44
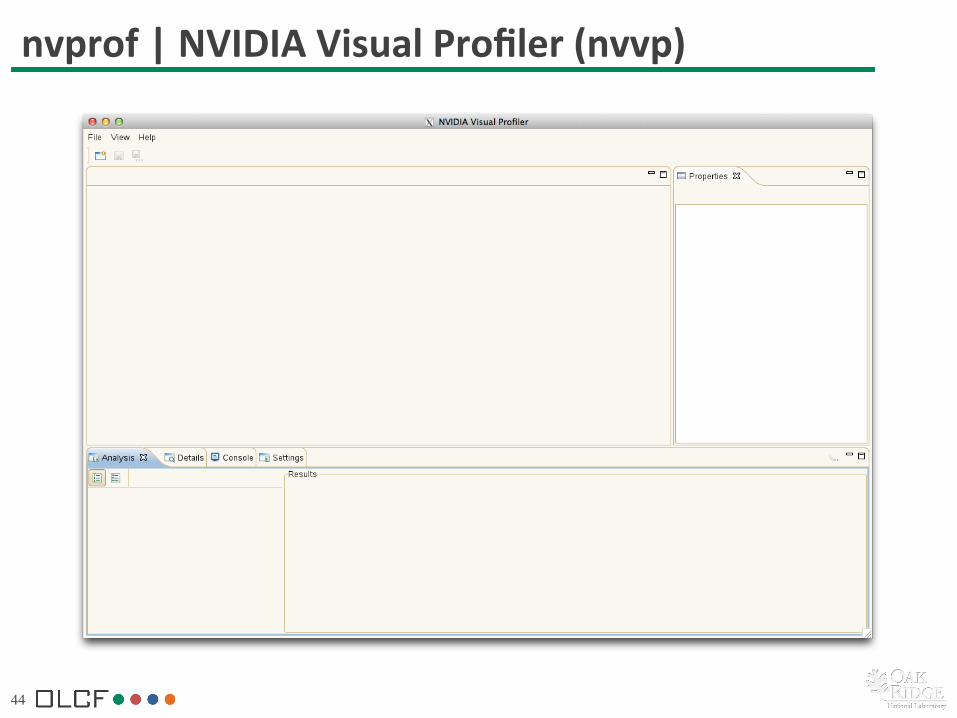
nvprof | NVIDIA Visual Profiler (nvvp)
45
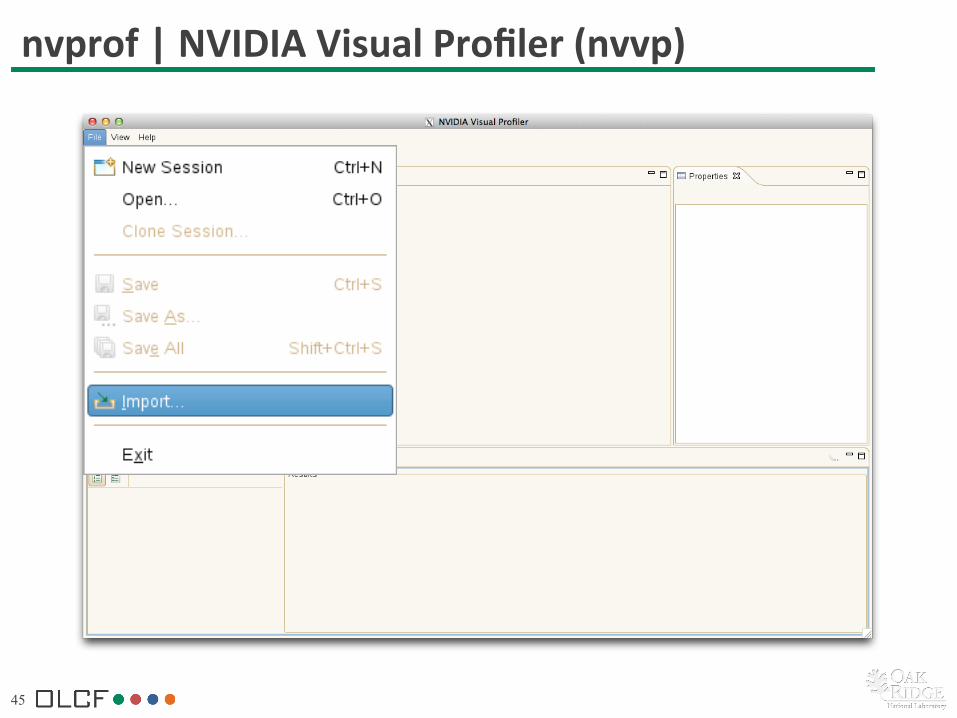
nvprof | NVIDIA Visual Profiler (nvvp)
46
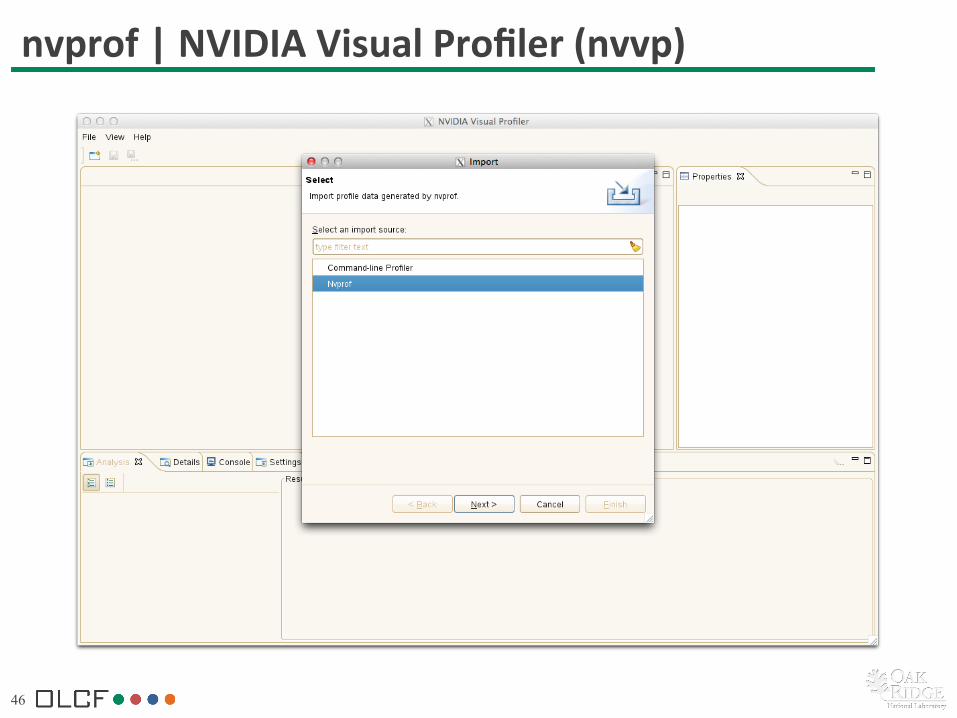
nvprof | NVIDIA Visual Profiler (nvvp)
47
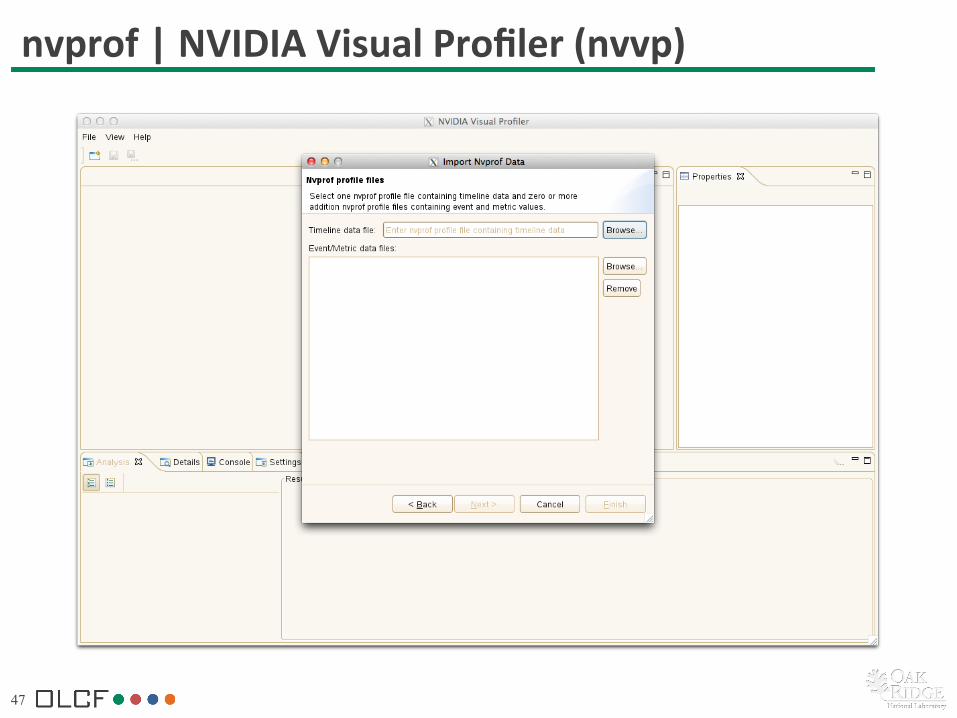
nvprof | NVIDIA Visual Profiler (nvvp)
48
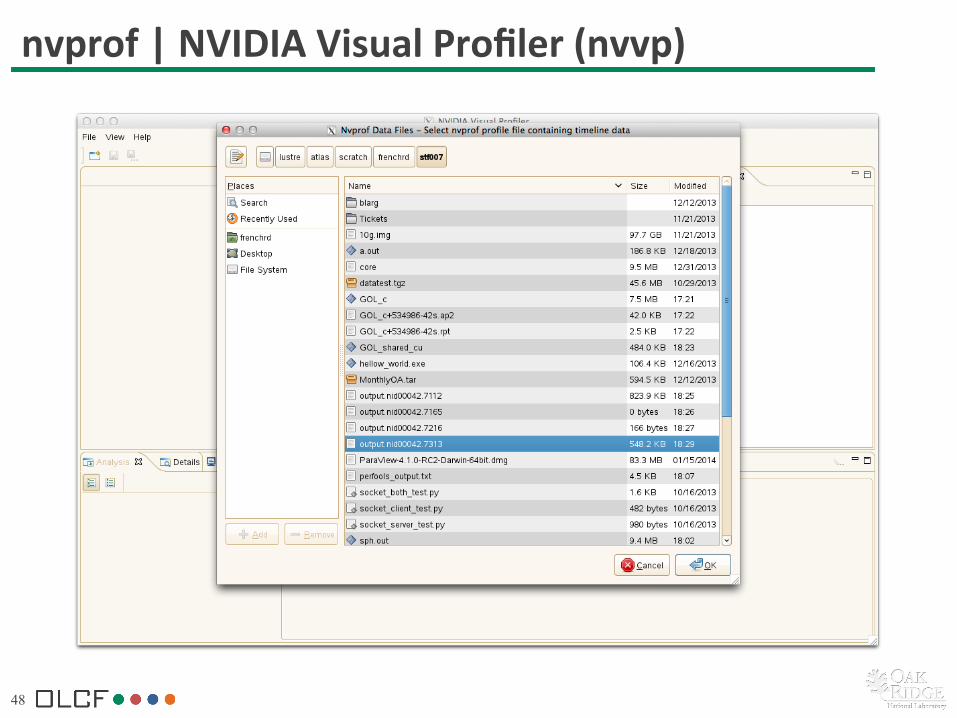
nvprof | NVIDIA Visual Profiler (nvvp)
49
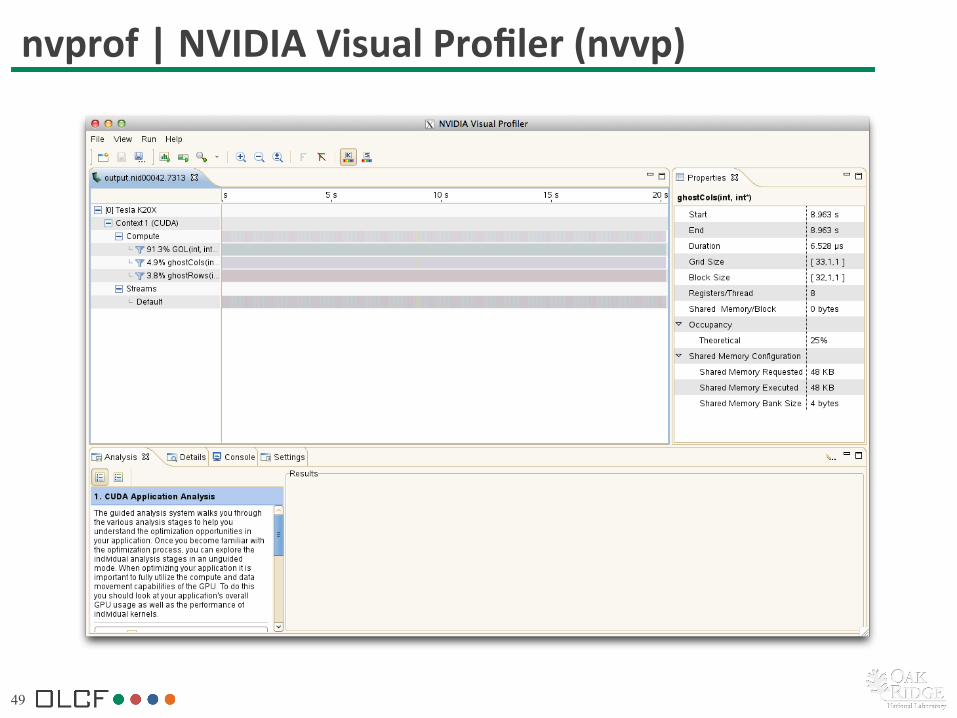
nvprof | NVIDIA Visual Profiler (nvvp)
50
nvprof | Command Line Reports
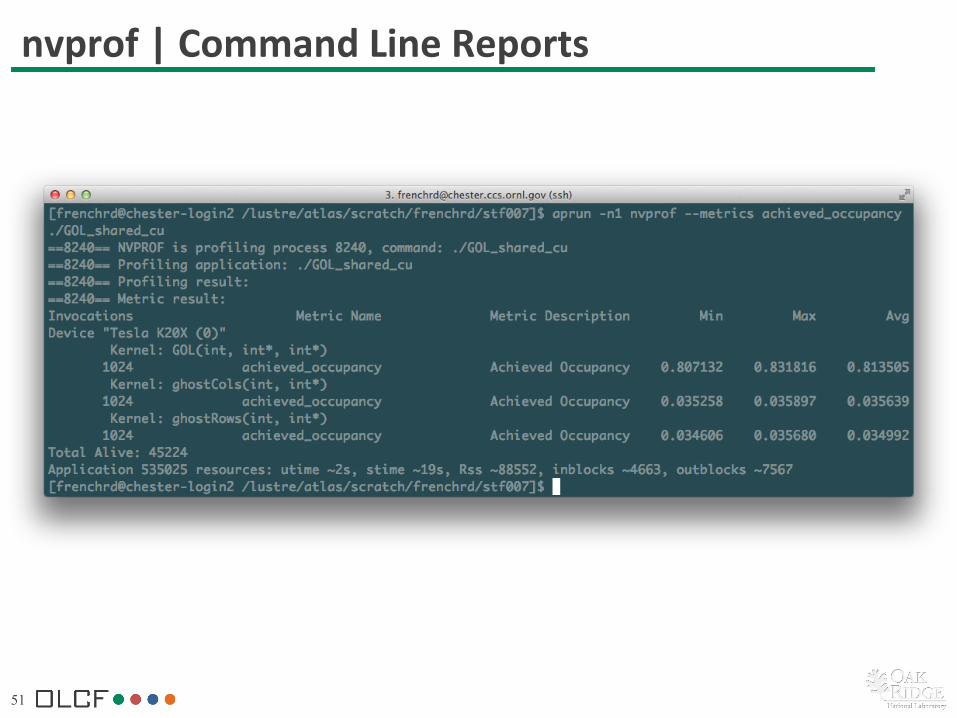
51
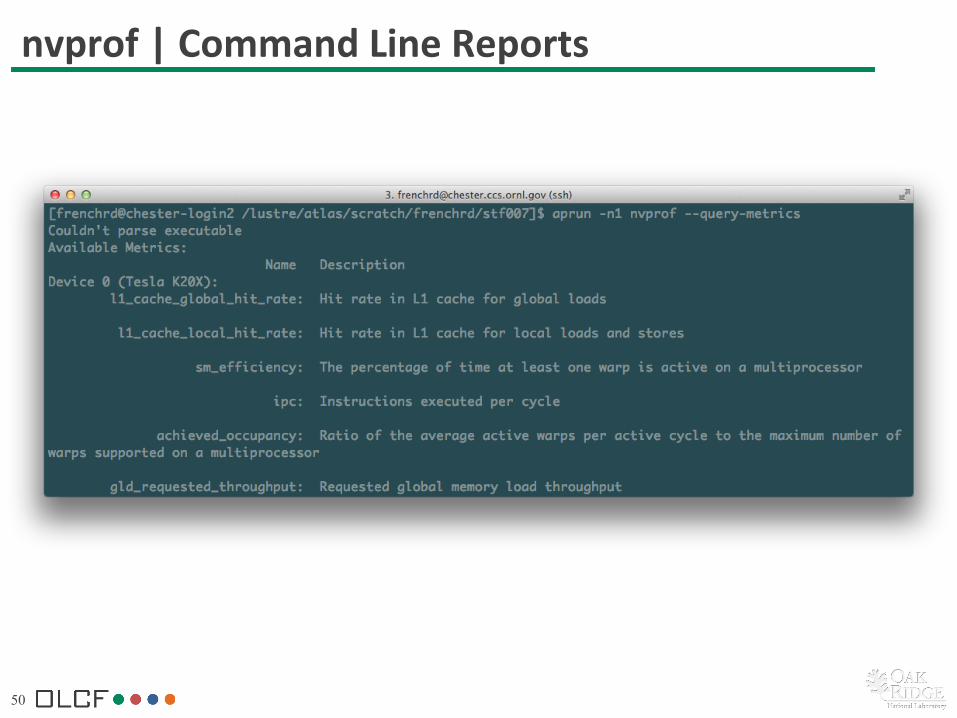
nvprof | Command Line Reports
52
QUESTIONS? OLCF Debugging Tools
Recommended


