
Expression profiling identifies the CRH/CRH-R1system as a modulator of neurovascular geneactivity
Jan M Deussing1, Claudia Kuhne1, Benno Putz1, Markus Panhuysen1, Johannes Breu1,Mary P Stenzel-Poore3, Florian Holsboer1 and Wolfgang Wurst1,2
1Max Planck Institute of Psychiatry, Munich, Germany; 2Institute of Developmental Genetics, GSF ResearchCenter for Environment and Health, Munich-Neuherberg, Germany; 3Department of Molecular Microbiologyand Immunology, Oregon Health Sciences University, Portland, Oregon, USA
Corticotropin-releasing hormone receptor type 1 (CRH-R1)-deficient mice display reduced anxiety-like behavior, a chronic corticosterone deficit, and an impaired neuroendocrine stress responsecaused by disruption of the hypothalamic–pituitary–adrenocortical (HPA) axis. The molecularsubstrates and pathways of CRH/CRH-R1-dependent signaling mechanisms underlying thebehavioral phenotype as well as the consequences of lifelong glucocorticoid deficit remain largelyobscure. To dissect involved neuronal circuitries, we performed comparative expression profiling ofbrains of CRH-R1 mutant and wild-type mice using our custom made MPIP (Max Planck Instituteof Psychiatry) 17k cDNA microarray. Microarray analysis yielded 107 genes showing alteredexpression levels when comparing CRH-R1 knockout mice with wild-type littermates. A significantproportion of differentially expressed genes was related to control of HPA and hypothalamic–pituitary–thyroid (HPT) axes reflecting not only the disturbance of the HPA axis in CRH-R1 mutantmice but also the interplay of both neuroendocrine systems. The spatial analysis of regulated genesrevealed a prevalence for genes expressed in the cerebral microvasculature. This phenotype wasconfirmed by the successful cross-validation of regulated genes in CRH overexpressing mice.Analysis of the cerebral vasculature of CRH-R1 mutant and CRH overexpressing mice revealedalterations of functional rather than structural properties. A direct role of the CRH/CRH-R1 systemwas supported by demonstrating Crhr1 expression in the adult murine cerebral vasculature. Inconclusion, these data suggest a novel, previously unknown role of the CRH/CRH-R1 system inmodulating neurovascular gene expression and function.Journal of Cerebral Blood Flow & Metabolism (2007) 27, 1476–1495; doi:10.1038/sj.jcbfm.9600451; published online7 February 2007
Keywords: corticotropin-releasing hormone; HPA axis; knockout; microarray; neurovascular; overexpression
Introduction
The neuropeptide corticotropin-releasing hormone(CRH) plays a central role in integrating theneuroendocrine, autonomic, and behavioral re-sponses to stress. To coordinate these tasks, CRHdisplays a dual capacity acting not only as a
secretagogue within the line of the hypothalamic–pituitary–adrenocortical (HPA) axis but also as aneurotransmitter modulating synaptic neurotrans-mission in the central nervous system (Deussing andWurst, 2005).
Clinical studies, supported by pharmacologic andgenetic animal models, have demonstrated a promi-nent role of CRH in mood and anxiety disorders(Holsboer, 1999; Groenink et al, 2003). Hypersecre-tion of CRH from the paraventricular nucleus of thehypothalamus accounting for HPA axis hyperacti-vity as well as elevated CRH levels detectable in thecerebrospinal fluid are prominent findings inpatients with major depression (Nemeroff et al, 1984).
As another hypothalamic–pituitary–end organaxis, the hypothalamic–pituitary–thyroid (HPT) axishas been implicated in affective disorders (Musselmanand Nemeroff, 1996). The HPA axis has a direct
Received 7 July 2006; revised 8 December 2006; accepted 13December 2006; published online 7 February 2007
Correspondence: Dr JM Deussing, Max Planck Institute ofPsychiatry, Molecular Neurogenetics, Kraepelinstrasse 2-10,Munich 80804, Germany.E-mail: [email protected]
This work was partially supported by the Bundesministerium fur
Bildung und Forschung within the framework of the NGFN2
(01GS0481) and by the Fonds der Chemischen Industrie.
Journal of Cerebral Blood Flow & Metabolism (2007) 27, 1476–1495& 2007 ISCBFM All rights reserved 0271-678X/07 $30.00
www.jcbfm.com

impact on the HPT axis by inhibiting its function viaCRH and glucocorticoids (Tsigos and Chrousos,2002).
Besides their crucial role in regulating the neuro-endocrine and behavioral stress responses, CRH andits receptors (CRH-Rs) affect peripheral cardiovas-cular function. Central administration of CRHelevates blood pressure and heart rate, whereasperipheral administration of CRH results in vaso-dilatation and decreased blood pressure (Parkes etal, 2001). Thyroid hormones as the end-effectors ofthe HPT axis also have a pronounced effect on thecardiovascular system, for example, hyperthyroid-ism results in increased cardiac output, heart rate,pulse and blood pressure, and decreased vascularperipheral resistance (Vargas et al, 2006).
In the last decade, numerous constitutive andconditional mouse mutants have been generated todissect the pathways implicated in HPA systemregulation and CRH-related circuitries involved inanxiety- and stress-related behavior in vivo (Mullerand Holsboer, 2006). Nevertheless, the molecularmechanisms behind CRH neurocircuitry regulationand its respective impact on aberrant behavior areyet not fully understood. Corticotropin-releasinghormone receptors are G protein-coupled hepta-helical transmembrane receptors, which can coupleto multiple G-proteins, and thereby are linked to avariety of intracellular signaling pathways (Reul andHolsboer, 2002). Recently, in vivo experimentsdemonstrated the involvement of mitogen-activatedprotein kinase signaling pathways that specificallymediate the behavioral adaptation to stress inresponse to CRH in distinct brain areas (Refojo etal, 2005).
The combination of microarray technology andexisting mouse mutants relevant to the CRH/CRH-Rsystem has already proven as a powerful approachto identify entirely new genes involved in adaptiveprocesses evoked by an imbalance of the CRH/CRH-Rsystem as recently demonstrated by Peeters et al(2004).
Here we report on the comparative analysis ofcerebral gene expression profiles of CRH-R type 1(CRH-R1) wild-type and knockout mice. We wereable to identify alterations in the expression of genesrelated to the control of HPA and HPT axes.Additionally, the spatial analysis of candidate genesrevealed a previously unknown role of the CRH-/CRH-R1 system in control of cerebrovascular geneexpression.
Materials and methods
Mice
Corticotropin-releasing hormone receptor type 1 knockout(KO) mice have been described previously (Timpl et al,1998). Male CRH-R1-deficient mice and wild-type litter-mates were obtained from heterozygous breedings. Micewere genotyped by polymerase chain reaction (PCR) using
primers: R1-GT1, 50-TCA-CCT-AAG-TCC-AGC-TGA-GGA-30;R1-GT2, 50-GTG-CTG-TCC-ATC-TGA-CGA-GA-30; R1-GT3B,50-GGG-GCC-CTG-GTA-GAT-GTA-GT-30. Standard PCRconditions result in a 697 bp wild-type and a 496 bpmutant PCR product. Mice overexpressing CRH underthe control of the metallothionein promotor have beendescribed previously and were kindly provided byStenzel-Poore et al (1992). Corticotropin-releasing hor-mone transgenic mice and wild-type littermates wereobtained from breeding of hemizygous males with wild-type C57BL/6J females. Mice were backcrossed for N = 18generations. Transgenic animals were visually distin-guished from their wild-type littermates by their severeCushing-like phenotype.
RNA Extraction
Mice (10 weeks old) were killed by cervical dislocation at10 am. Brains were carefully removed and immediatelytransferred into an appropriate volume (1 mL/100 mg) ofTRIzol reagent (Invitrogen, Karlsruhe, Germany). Tissuewas thoroughly homogenized using an Ultra-Turrax grinder(IKA-Labortechnik, Staufen, Germany) and subsequentlytotal RNA was prepared according to the manufacturer’srecommendations. Quality of total RNA was visuallyinspected by denaturing agarose gel electrophoresis.
Quantitative Northern Blot Analysis
Five micrograms of total brain RNA were separated in a1% formaldehyde agarose gel, transferred to Porablot NYPlus membrane (Macherey & Nagel, Duren, Germany) andhybridized with respective [a-32P]dCTP-labeled (Mega-prime labeling kit, Amersham, Piscataway, USA) cDNAprobes. Filters were washed at high stringency asdescribed. Membranes were stripped by boiling in 0.1%SDS for 10 mins and rehybridized with a 540-bp cDNAfragment of murine b-actin. Expression levels werequantified using a FUJIX BAS-3000 Phosphoimager (Fuji,Japan) and TINA 2.09 software (Raytest, Straubenhardt,Germany). The expression levels were normalized by thesignal intensity of murine b-actin expression.
Microarray Construction
The MPIP 17k cDNA microarray contained 18856 PCRproducts derived from different mouse cDNA libraries(sources: Research Genetics, RZPD Deutsches Ressourcen-zentrum fur Genomforschung, proprietary clones) repre-senting 12037 different unigene clusters (unigene build#144). The spotting buffer contained 3� SSC (standardsodium citrate) and 1.5 mol/L betaine. The PCR productswere spotted on gamma-amino-propylsilane-coated slides(GAPS II, Corning, NY, USA) using a Chipwriter Prospotting robot (Biorad, Munchen, Germany) and 48 SMP3stealth pins (TeleChem, Sunnyvale, CA, USA). Afterspotting, the arrays were heated to 801C for 10 secs andcrosslinked using a UV Stratalinker 2400 at 200 mJ(Stratagene, Cedar Creek, TX, USA). For blocking, arrays
Expression profiling of CRH-R1 knockout miceJM Deussing et al
1477
Journal of Cerebral Blood Flow & Metabolism (2007) 27, 1476–1495

were submerged in a mixture of 1.25 g succinic anhydride/250 mL 1,2-dichloroethane/3.1 mL 1-methylimidazole for 1 hat room temperature. Subsequently, arrays were washed in250 ml fresh dichloroethane, denatured in boiling ultrapurewater for 2 mins, rinsed in 95% ethanol, and finally dried bycentrifugation for 1 min at 1500 r.p.m. Arrays were stored ina dark, dry box at room temperature until usage.
Microarray Hybridization
We performed a dual color microarray experiment with adirect comparison of directly labeled, total RNA poolsincluding three technical replicates and dye-swap. Briefly,100mg of total RNA from each animal were subjected to alabeling reaction using oligo (dT) Primer (Amersham,Piscataway, NJ, USA), Cy3-coupled dUTPs and Cy5-coupled dUTPs (Amersham), and SuperScriptII reversetranscriptase (Invitrogen). After purification of labelingreaction using Bio-6-columns (Biorad) and YM-30columns (Millipore), 100mg of Cy3- and Cy5-labeled totalRNA from wild-type and knockout mice was combinedwith hybridization buffer, denatured at 951C for 3 mins,and hybridized to each of the three technical replicates,resulting in a total of six microarrays. The hybridizationbuffer contained 50% formamide, 50 mmol/L sodiumphosphate buffer (pH 7.0), 5�Denhard’s solution (Sigma,Taufkirchen, Germany), 6� SSC, 0.5% SDS, 0.4 mg/mLmurine COT1-DNA (Invitrogen), and 5 mg poly(dA)(Amersham). Hybridization was performed in hybridiza-tion chambers submerged in a waterbath at 421C for 16 h.The arrays were washed for 15 mins in 2� SSC/0.2%SDS at 601C, in 0.5� SSC for 15 mins at 601C, rinsed in0.2� SSC for 1 min at room temperature, shaken vigor-ously in 0.05� SSC at room temperature, and finallydried with Servisol Air Spray (Roth, Karlsruhe, Germany).All slides were scanned immediately after drying.
Microarray Analysis
Scanning was performed using a ScanArray 4000 laserscanner and ScanArray 3.1 Software (Perkin Elmer,Boston, MA, USA) with a fixed photomultiplier tubegain of 80%, and 98% (Cy3) or 70% (Cy5) laser power.Quantification was performed using QuantArray software2.1.0.0 (Perkin Elmer Rodgau-Jugesheim, Germany) andthe fixed circle-analysis method. Data were imported in aPSQL relational database for further analysis. Raw datawere normalized according to the procedure outlined inYang et al (2002) and subjected to a t-test for significantlydifferential expression. The obtained P-values werecorrected for multiple testing using Benjamini-Hochberg’sfalse discovery rate procedure (Hochberg and Benjamini,1990). Because we anticipated strong dilutive effects bythe whole-brain approach, a low threshold was chosen forselection of candidate genes: |Z-score|Z1.837 and |foldregulation|Z1.1. Additionally, a raw signal intensityZ1000 was set as threshold ensuring the practicabilityof independent confirmation by Northern blot or in situhybridization.
Quantitative In Situ Hybridization
Mice (10 weeks old) were killed by an overdose ofisoflurane. Brains were carefully removed and immedi-ately shock frozen on dry ice. Frozen brains were cut on acryostat in 20-mm-thick sections. Cryostat sections of wild-type and knockout brains were mounted side by side onSuperFrost Plus slides (Menzel GmbH, Braunschweig,Germany). This procedure allowed for parallel in situhybridization of wild-type and knockout sections underabsolutely identical conditions assuring meaningful quan-tification and comparison of hybridization signals. Allsections were processed for in situ hybridization accord-ing to a modified version of the procedure described byDagerlind et al (1992). Specific riboprobes were generatedby PCR from respective cDNA clones, which were spottedon the MPIP 17k array. Polymerase chain reaction productswere amplified with primers: T3 50-GCT-AAA-ATT-AAC-CCT-CAC-TAA-AGG-GAA-TAA-GC-30; T7 50-CGA-ATT-TAA-TAC-GAC-TCA-CTA-TAG-GGA-ATT-TG-30 universallyapplicable for pT7T3D-PAC derived plasmids. The follow-ing riboprobes were generated: Rgs5 gene (length B1000 bp,GenBank Accession No. AI847151), Sparc (length B1000 bp,GenBank Accession No. AI840232), Sepp1 (lengthB1700 bp, GenBank Accession No. AI838693), Pmp22(length B1000 bp, GenBank Accession No. AI852430), Vim(length B685 bp, GenBank Accession No. AI845820), Col1a2(length B1400 bp, GenBank Accession No. AI838652).Antisense and sense cRNA probes were transcribed from200 ng of respective PCR product and directly used as atemplate for the synthesis of radiolabeled transcripts byin vitro transcription with 35S-UTP using T7 and T3 RNApolymerase, respectively. After 20 mins of DNase I (Roche,Penzberg, Germany) treatment, the probes were purified bythe RNeasy Clean up protocol (Qiagen, Hilden, Germany)and measured in a scintillation counter. For hybridization,sections were pretreated and prehybridized as describedpreviously (Dagerlind et al, 1992). Subsequently, they werehybridized overnight with a probe concentration of7� 106 c.p.m./mL at 571C and washed at 651C in 0.1�SSC and 0.1 mmol/L dithiothreitol. The hybridized slideswere dipped in autoradiographic emulsion (type NTB2;Eastman Kodak, Rochester, NY, USA), developed after 3 to 6weeks, and counterstained with cresyl violet.
Alkaline Phosphatase Cytochemistry
Alkaline phosphatase (AP) is a marker for arteries,arterioles, and capillaries, and distinguishes afferent fromefferent blood vessels in the brain. Alkaline phosphataseactivity was assessed on 20 mm cryosections, which weremounted side by side on SuperFrost Plus slides (preparedas described above for in situ hybridization). Staining wasperformed for 10 mins at room temperature using eithernitro blue tetrazolium chloride/5-bromo-4-chloro-3-indo-lyl phosphate (NBT/BCIP, Roche, Penzberg, Germany) orVector Red (Vector Laboratories, Burlingame, CA, USA) asan AP substrate. Enzymatic reaction was stopped bywashing in phosphate-buffered saline followed by embed-ding in ProTaq MountFluor (Quartett Immunodiagnostics,Berlin, Germany).
Expression profiling of CRH-R1 knockout miceJM Deussing et al
1478
Journal of Cerebral Blood Flow & Metabolism (2007) 27, 1476–1495

Endogenous AP activity of cerebral blood vessels wasvisualized in intact brains as follows. Mice were killed byan overdose of isoflurane and transcardially perfused asfollows: 30 secs 50 U/mL heparin-NaCl 0.9%, 3 mins 4%cold paraformaldehyde and finally with 7.5 ml NBT/BCIPper animal. Brains were immediately removed andtransferred into 4% paraformaldehyde. Photographs weretaken using a Leica MZ APO binocular.
Immunofluorescence
Immunofluorescence detection of collagen type IV (CO-LIV) was perfomed on 20mm cryostat sections, stored at�201C until used. Sections were warmed for 5 mins atroom temperature (RT; incubations were performed at RTunless indicated otherwise), fixed 5 mins in 4% parafor-maldehyde, washed 3� 5 mins in 0.01% Tween/PBS(PBST), blocked 60 mins in 2% BSA (Sigma)/PBST, andwashed 3� 5 mins in 0.01% PBST. The goat anti-type IVcollagen antibody (Southern Biotech, Galveston, TX, USA)was diluted 1:200 in 0.01% PBST and incubated overnightat 41C. Sections were washed 3� 5 mins in PBS andincubated for 60 mins with the donkey anti-goat, biotiny-lated antibody (Jackson ImmunoResearch, Cambridge-shire, UK), diluted 1:100. Subsequently, sections werewashed 3� 5 mins in PBS and detection was performedincubating for 60 mins with Texas Red Streptavidin(Vector Lab, Burningham, Canada) diluted 1:50 in PBS.Finally, sections were washed 3� 5 mins in PBS andmounted in ProTaq MountFluor (Quartett Immunodiag-nostics, Berlin, Germany). Photographs were taken using aZeiss axioplan2 microscope.
Preparation of Cerebral Microvessels
Murine brain microvessels were prepared from fresh braintissue removed within minutes from 10-week-old mice killedby cervical dislocation. The brain was cleared from meningesand large surface vessels and then minced with a scalpel intoapproximately 1 mm segments. Tissue was homogenized inice-cold Dulbecco’s modified Eagle’s medium-nutrient mix-ture F-12 (DMEM F-12; Invitrogen) and centrifuged at 228gfor 5mins. After removal of the supernatant, the pellet wasresuspended in 15 ml of 18% (wt/vol) dextran solution andcentrifuged at 12,000g for 10mins. The supernatant wasremoved and the pellet was resuspended in 5ml of Ca2+ Mg2+
-free Hank balanced salt solution (Invitrogen). The suspen-sion was passed through a 70mm nylon mesh filter (BDBiosciences, Bedford, MA, USA) and the filter was washedthree times with HBBS. Microvessels retained on the filterwere dislodged by inverting the filter and rinsing in 1 mLTRIzol per brain. Total RNA from cerebral microvesselswas prepared using the TRIzol reagent (Invitrogen,Karlsruhe, Germany) as described for total brain RNA.
RT-PCR Analysis
Expression of Crh, Crhr1, and Crhr2 in cerebral micro-vessels was analyzed by RT-PCR. First-strand cDNAsynthesis from 1 mg total microvascular RNA and 1 mg
total brain RNA was performed with SuperScriptt IIreverse transcriptase (Invitrogen), according to the manu-facturer’s protocol using an oligo (dT) primer. Thefollowing intron-spanning primers were used for gene-specific PCRs: Crh: forward 50-CAC-CTA-CCA-AGG-GAG-GAG-AA-30, reverse 50-GTT-GCT-GTG-AGC-TTG-CTG-AG-30
(amplifying nucleotides 143 to 711 of mouse Crh cDNA,GenBank Accession No. NM 205769, 35 cycles); Crhr1:forward 50-GCC-GCC-TAC-AAC-TAC-TTC-CA-30, reverse50-CAG-AAA-ACA-ATA-GAA-CAC-AGA-CAC-G-30 (ampli-fying nucleotides 768 to 1289 of mouse Crhr1 cDNA,GenBank Accession No. NM 007762, 35 cycles); Crhr2:forward 50-ATG-TTT-GTG-GAG-GGC-TGC-TA-30, reverse50-GTC-TGC-TTG-ATG-CTG-TGG-AA-30 (amplifyingnucleotides 792 to 1411 of mouse Crhr2 cDNA, GenBankAccession No. NM 009953, 35 cycles); Glut1: forward 50-CAT-CTT-CGA-GAA-GGC-AGG-TG-30, reverse 50-CCT-CGG-GTG-TCT-TGT-CAC-TT-3 (amplifying nucleotides1067 to 1680 of mouse Glut1 cDNA, GenBank AccessionNo. BC 055340, 25 cycles); Rgs5: forward 50-GGG-AAT-TCT-CCT-CCA-GAA-GC-30, reverse 50-AAA-TTC-AGA-GCG-CAC-AAA-GC-30 (amplifying nucleotides 147 to 603of mouse Rgs5 cDNA, GenBank Accession No. NM009063, 30 cycles); Actb: forward 50-ATC-GTG-CGT-GAC-ATC-AAA-GA-30, reverse 50-ACA-TCT-GCT-GGA-AGG-TGG-AC-30 (amplifying nucleotides 702 to 1146 of mouseActb cDNA, GenBank Accession No. NM 007393, 25cycles); Nrgn: forward 50-GAC-TAG-GCC-AGA-GCT-GAA-CG-30, reverse 50-TGA-AAA-CCT-CCT-CCC-CTC-TT-30
(amplifying nucleotides 492 to 1,053 of mouse NrgncDNA, GenBank Accession No. NM 022029, 25 cycles);microtuble-associated protein 2 (Map2): forward 50-GGT-CTC-CAG-GGA-TGA-AGT-GA-30, reverse 50-GTG-TGG-AGG-TGC-CAC-TTT-TT-30 (amplifying nucleotides 5122to 5540 of mouse Map2 cDNA, GenBank Accession No.XM 901540, 25 cycles); Gfap: forward 50-GCC-ACC-AGT-AAC-ATG-CAA-GA-30, reverse 50-CCT-TCT-GAC-ACG-GAT-TTG-GT-30 (amplifying nucleotides 741 to 1210 ofmouse Gfap cDNA, GenBank Accession No. NM 010277,25 cycles). Polymerase chain reaction products wereanalyzed by agarose gel electrophoresis together with aDNA marker (Smart Ladder, Eurogentec, Brussels, Belgium).
Data Analysis
Autoradiographs of in situ hybridizations or photographsof AP (NBT/BCIP) stained sections were digitized andrelative levels of mRNA or AP staining were determinedby computer-assisted optical densitometry (ImageJ, http://rsb.info.nih.gov/ij/). For in situ hybridizations, routinelythree different exposure times were applied to assure thatthe signals to be quantified were in the linear range. Themean of five to eight measurements was taken from eachanimal (only three measurements for the paraventricularnucleus (PVN)). Data are presented as fold regulationrelative to wild-type measurements. In case of AP staining,the mean of 12 measurements per animal was calculated.Data are presented as mean AP staining intensities7s.e.m.Data analyses were performed on GraphPad Prism 4(GraphPad Software Inc., San Diego, CA, USA) using atwo-tailed t-test. P < 0.05 was taken as significant.
Expression profiling of CRH-R1 knockout miceJM Deussing et al
1479
Journal of Cerebral Blood Flow & Metabolism (2007) 27, 1476–1495
Results
Differential Gene Expression in Corticotropin-releasing Hormone Receptor Type 1 Wild-Type andKnockout Mice
To elucidate molecular mechanisms and neuronalnetworks underlying the behavioral phenotype, weperformed expression profiling utilizing our custom-made MPIP-17k cDNA microarray. Total RNAsamples, harvested from the brains of five CRH-R1wild-type and knockout animals at 2 months of age,were pooled genotype-wise. Cy3 and Cy5-labeledRNA pools were hybridized simultaneously to sixMPIP-17k arrays including dye-swap. Primary dataprocessing yielded 13,395 analyzable spots. Threethousand nine hundred and twenty-one spots wereregulated 71.1-fold and among them 129 spotsdisplayed a |Z-score|Z1.837 (SupplementaryFigure 1). Hundred and eleven spots exhibited amean expression of Z1000 representing 107 indivi-dual, differentially expressed genes (Table 1). Ofthese genes, 53 were upregulated and 54 genes weredownregulated. Differences in expression levelsranged from + 1.7 to �1.5-fold with the majority(78%) of candidate genes showing only weakregulation levels of + 1.2 to �1.2-fold. With 48candidates, almost half of the regulated genes areunknown genes represented by expressed sequencetags or RIKEN clones. Categorization of knowncandidate genes according to available Gene Onto-logy (Ashburner et al, 2000) annotations revealedthree major functional classes: genes related to signaltransduction mechanisms (33%), metabolism (17%),and control of cellular organization (14%; Table 1).Distributed within these classes, we found numerouscandidate genes directly connected to the endocrinesystems of the HPA and the HPT axis as anticipatedfrom CRH-R1 knockout mice. Genes related to theHPA axis include the nuclear receptor subfamily 3,group C, member 1 (Nr3c1, + 1.2-fold), the hydro-xysteroid 11-beta dehydrogenase 1 (Hsd11b1, + 1.3-fold), the FK506-binding protein 4 (Fkbp4, + 1.1-fold),calreticulin (Calr, + 1.2-fold) as well as the telo-merase-binding protein p23 (p23, + 1.1-fold). Weidentified the thyroid hormone receptor alpha (Thra,�1.1-fold), the thyroid hormone receptor interactor12 (Trip12, �1.2-fold), the type II iodothyroninedeiodinase (Dio2, + 1.5-fold), transthyretin (Ttr,�1.1/�1.2-fold), and prostaglandin D2 synthase(Ptgds, �1.3/�1.4-fold) as regulated candidate genesrelated to the HPT axis (Supplementary Figure 2).
Validation of Microarray Data by QuantitativeNorthern Blot Analysis
To independently confirm the obtained expressionprofiling data, we performed quantitative Northernblot analysis. The quantification was accomplishedwith total RNA from the entire brain of CRH-R1wild-type and knockout littermates (n = 7). For
confirmation, genes were chosen that reflected notonly the complete bandwidth of differential expres-sion but also the broad spectrum of mean expressionlevels of identified candidate genes (compare Table1). Hybridization data were quantified by normal-ization to b-actin. As an internal control, wedemonstrated the absence of Crhr1 expression inthe mutant mice. The expression levels of candidategenes analyzed showed a perfect correlation to themean expression levels obtained from the micro-array experiment (data not shown) and confirmedthe differential expression of candidate genes(Figure 1). The following regulation levels weredetected reflecting the differential expression iden-tified by microarray analysis (microarray results aregiven in parentheses): regulator of G-protein signal-ing 5 (Rgs5; Figure 1C) + 1.3-fold ( + 1.2-fold),secreted protein acidic and rich in cysteine (Sparc;Figure 1D) �1.5-fold (�1.3-fold), Ptgds �1.5-fold(�1.3/�1.4-fold; Figure 1E), makorin 2 (Mkrn2;Figure 1F) �1.3-fold (�1.5-fold), Ttr �1.4-fold(�1.2 fold; Figure 1G). Confirmation of expressionand regulation levels established quantitative North-ern blot analysis as a valid method for evaluation ofmicroarray data obtained from the MPIP-17k array(Figure 1).
Genes Differentially Regulated in Corticotropin-releasing Hormone Receptor Type 1 Knockout Miceare Inversely Regulated in CRH Overexpressing Mice
Mice ubiquitously overexpressing CRH (CRH-tg)display an opposed phenotype compared withCRH-R1 knockout mice. For CRH-tg mice, anincreased anxiety-related behavior and HPA axishyperactivity with the consequence of a Cushing’ssyndrome-like phenotype has been reported (Stenzel-Poore et al, 1992; van Gaalen et al, 2002). Thus,we intended to cross-validate candidate genes inCRH-tg mice. For confirmation, Northern blotanalysis of total RNA from the entire brain ofCRH-tg and respective wild-type littermates (n = 7) wasperformed. Hybridization with a Crh-specific probedemonstrated a 1.95-fold upregulation of Crh in theentire brain of CRH-tg mice (Figure 1B) whereasexpression of Crhr1 was not altered (Figure 1A).Rgs5 (�2.1-fold; Figure 1C), Sparc ( + 1.3-fold; Figure1D), Ptgds ( + 1.6-fold; Figure 1E), and Mkrn2 ( + 1.3-fold; Figure 1F) were significantly regulated inCRH-tg mice. The identified regulation was in theopposite direction compared with CRH-R1 knockoutmice while the degree of induction or repression ofgene expression was in a similar range as observedin CRH-R1 knockout mice. Only Ttr was notsignificantly regulated in CRH-tg mice (Figure 1G).The diametrical regulation of candidate genes inCRH-tg mice supports a direct influence of the CRH/CRH-R1 system on the expression of these genesidentified by expression profiling in CRH-R1knockout mice.
Expression profiling of CRH-R1 knockout miceJM Deussing et al
1480
Journal of Cerebral Blood Flow & Metabolism (2007) 27, 1476–1495

Table 1 Genes up- or downregulated in CRH-R1 knockout mice
Spot Genesymbol
a Gene name/description Accessionno.
Unigenecluster
Z-score Foldregulation
Meanexpression
Functional category
7402 Col1a1 CV Procollagen, type I, alpha 1 AI839149 22621 2.6 1.7 1006 Control of cellular organization726 Dio2 HPT Deiodinase, iodothyronine, type II AI324267 21389 2.3 1.5 1640 Metabolism6943 Col1a2 CV Procollagen, type I, alpha 2 AI838652 277792 4.5 1.5 1372 Control of cellular organization5754 Ptn CV Pleiotrophin AI836517 3063 1.9 1.4 17018 Cell growth and maintenance13387 Ptn CV Pleiotrophin AI850565 3063 2.9 1.4 3032 Cell growth and maintenance8903 Vim CV Vimentin AI845820 268000 2.6 1.4 3905 Control of cellular organization13435 RIKEN cDNA 5133400G04 gene AI850593 36835 3.4 1.4 2115 Unknown8337 RIKEN cDNA 1500041J02 gene AI840941 281019 3.6 1.4 1336 Unknown16029 Hypothetical protein 9630027E11 AI850939 40896 2.3 1.3 1135 Unknown9375 Hsd11b1 HPA Hydroxysteroid 11-beta dehydrogenase 1 AI847129 28328 3.2 1.3 1003 Metabolism15252 Pmp22 CV Peripheral myelin protein AI852430 1237 2.8 1.3 1872 Cell growth and maintenance12312 Ly6c Lymphocyte antigen 6 complex, locus C AI844280 1583 2.2 1.3 1382 Immune system13301 Rapgef3 Rap guanine nucleotide exchange factor
(GEF) 3AI850133 24028 2.0 1.3 1994 Signal transduction mechanism
12838 Weak similarity to protein ref:NP_055284.2 (H. sapiens) testes-specificheterogeneous nuclear ribonucleoproteinG-T
AI845029 40155 1.9 1.2 8973 Unknown
3342 Spred1 Sprouty protein with EVH-1 domain 1,related sequence
AI447802 245890 1.9 1.2 3917 Signal transduction mechanism
1187 Glul CV Glutamate-ammonia ligase (glutaminesynthase)
AI413315 210745 1.9 1.2 10231 Metabolism
7643 EST AI839323 2.7 1.2 7358 Unknown10830 Weak similarity to protein ref:
NP_037388.1 (H. sapiens) zinc-fingerprotein 180
AI847594 1504 2.6 1.2 2129 Unknown
191 Glul CV Glutamate-ammonia ligase (glutaminesynthase)
AI324037 210745 2.2 1.2 11570 Metabolism
9383 Rgs5 CV Regulator of G-protein signaling 5 AI847151 20954 1.9 1.2 3633 Signal transduction mechanism331 Cox8a Cytochrome c oxidase, subunit VIIIa AI326932 14022 1.8 1.2 9070 Metabolism9969 RIKEN cDNA 2810410P22 gene AI845892 28972 4.1 1.2 2636 Unknown7698 Car2 Carbonic anhydrase 2 AI841511 1186 2.4 1.2 8348 Metabolism10727 EST AI847573 2.1 1.2 16818 Unknown8422 Weak similarity to protein pir:T09052 (H.
sapiens) T09052 hypothetical proteinDBCCR1 – human
AI841051 329074 2.1 1.2 4232 Unknown
13024 RIKEN cDNA B230399N07 gene AI849887 40192 2.4 1.2 4918 Unknown16367 Mus musculus transcribed sequence AI851420 41001 2.6 1.2 4273 Unknown10603 RIKEN cDNA 4933403G14 gene AI835009 41709 2.5 1.2 1749 Unknown3250 Nr3c1 HPA Nuclear receptor subfamily 3, group C,
member 1AI447752 129481 2.3 1.2 5281 Transcription
11313 Calr HPA Calreticulin AI848391 1971 3.4 1.2 14148 Transcription14372 Rps27a Ribosomal protein S27a AI853484 180003 2.5 1.2 13600 Protein synthesis8756 RIKEN cDNA 1300007B12 gene AI845685 18230 3.6 1.2 1020 Unknown9828 Tjp1 CV Tight junction protein 1 AI847817 4342 2.2 1.2 1904 Control of cellular organization12031 Gabrb3 Gamma-aminobutyric acid (GABA-A)
receptor, subunit beta 3AI849425 8004 2.3 1.2 3397 Signal transduction mechanism
8092 Amotl1 CV Angiomotin-like 1 AI839055 159552 2.0 1.2 2360 Unknown8119 RIKEN cDNA 3526402H21 gene AI837343 306378 2.0 1.2 1476 Unknown
Expressionprofiling
ofCRH-R1
knockoutmice
JMDeussing
etal
1481
JournalofCerebralBloodFlow
&M
etabolism(2007)
27,1476–1495

Table 1 Continued
Spot Genesymbol
a Gene name/description Accessionno.
Unigenecluster
Z-score Foldregulation
Meanexpression
Functional category
12664 EST AI844422 2.7 1.1 8045 Unknown7752 Similar to retinoblastoma-binding protein
6 isoform 2; proliferation potential-relatedprotein; RB-binding Q-protein 1
AI841091 41712 1.9 1.1 1659 Unknown
7804 Sec13l1 SEC13-like 1 (S. cerevisiae) AI839895 29296 1.9 1.1 1807 Transport facilitation10618 p23 HPA Telomerase-binding protein p23 (Hsp90
co-chaperone) (progesterone receptorcomplex p23)
AI847198 2.0 1.1 4064 Signal transduction mechanism
9224 Pdk3 Pyruvate dehydrogenase kinase,isoenzyme 3
AI845462 12775 2.1 1.1 6354 Signal transduction mechanism
10339 cDNA sequence BC060632 AI846678 334807 2.2 1.1 2269 Unknown11904 Sap30 sin3 associated polypeptide AI849299 118 1.9 1.1 3398 Transcription10484 EST AI847856 5.2 1.1 8598 Unknown9596 EST AI843142 2.0 1.1 3781 Unknown6561 Hmgcs1 3-hydroxy-3-methylglutaryl-coenzyme A
synthase 1AI841574 61526 1.8 1.1 6685 Metabolism
14054 RIKEN cDNA 6720407G21 gene AI851909 291906 1.9 1.1 3800 Unknown11366 Fkbp4 HPA FK506 binding protein 4 AI848455 12758 1.9 1.1 2026 Siganl transduction mechanism4820 Rpa2 Replication protein A2 AI465248 2870 2.6 1.1 6034 Transcription7936 Mbp Myelin basic protein AI842020 252063 2.3 1.1 1953 Control of cellular organization5608 RIKEN cDNA 1810006K23 gene AI836456 41603 2.7 1.1 15829 Unknown8697 EST AI841156 2.7 1.1 7923 Unknown6024 Rps24 Ribosomal protein S24 AI836712 16775 1.9 1.1 20983 Protein synthesis7854 EST AI839919 2.3 1.1 2943 Unknown13783 RIKEN cDNA 1500009L16 gene AI851749 271188 1.9 1.1 1265 Unknown6536 EST AI837837 1.9 �1.1 7891 Unknown8670 EST AI841324 3.6 �1.1 43175 Unknown12416 Expressed sequence AW610627 AI844207 27140 2.0 �1.1 2995 Unknown172 Mapk1 Mitogen activated protein kinase 1 AI323600 196581 2.1 �1.1 3800 Signal transduction mechanism5364 Ube3a Ubiquitin protein ligase E3A AI661496 9002 1.9 �1.1 3948 Protein degradation11950 Rasa3 RAS p21 protein activator 3 AI848749 18517 2.1 �1.1 2861 Signal transduction mechanism11182 Ttr HPT Transthyretin AI848407 2108 2.1 �1.1 28065 Protein targeting. Sorting and
translocation10690 RIKEN cDNA 6330417K15 gene AI847460 259539 3.3 �1.1 4916 Unknown5746 Pura Purine-rich element binding protein A AI836331 259715 1.8 �1.1 5247 Transcription12919 Thra HPT Thyroid hormone receptor alpha AI844656 265917 3.8 �1.1 10200 Transcription6055 Gabarapl1 GABA(A) receptor-associated protein-like
1AI835946 14638 2.5 �1.1 5277 Signal transduction mechanism
8635 Prkce Protein kinase C, epsilon AI843403 287660 2.1 �1.1 4610 Signal transduction mechanism8113 Kif5a Kinesin family member 5A AI837333 30355 2.2 �1.1 4057 Transport facilitation9020 DNA segment, Chr 11, Wayne State
University 99, expressedAI843276 261620 1.9 �1.1 4120 Unknown
11396 RIKEN cDNA 1110051M20 gene AI849568 233541 2.1 �1.1 2867 Unknown7792 Aldoc Aldolase 3, C isoform AI841101 7729 2.2 �1.1 11424 Metabolism11876 Dncic1 Dynein, cytoplasmic, intermediate chain 1 AI849160 20893 1.9 �1.1 3197 Control of cellular organization11289 Btbd11 BTB (POZ) domain containing 11 AI847060 36544 2.0 �1.2 1368 Protein targeting. Sorting and
Translocation5452 RIKEN cDNA 2810401C16 gene AI835101 40038 3.1 �1.2 1478 Unknown8627 EST AI841304 2.4 �1.2 7452 Unknown6203 EST AI836107 2.2 �1.2 11149 Unknown
Expressionprofiling
ofCRH-R1
knockoutmice
JMDeussing
etal
1482
JournalofCerebralBloodFlow
&M
etabolism(2007)
27,1476–1495

Table 1 Continued
Spot Genesymbol
a Gene name/description Accessionno.
Unigenecluster
Z-score Foldregulation
Meanexpression
Functional category
13906 EST AI854455 2.3 �1.2 4690 Unknown9001 RIKEN cDNA 4933409K07 gene AI846433 75790 1.9 �1.2 2254 Unknown6046 Trip12 HPT Thyroid hormone receptor interactor 12 AI835998 209265 2.1 �1.2 1405 Signal transduction mechanism7194 Tm9sf2 Transmembrane 9 superfamily member 2 AI838784 275191 2.8 �1.2 1884 Protein targeting. Sorting and
translocation6631 RIKEN cDNA 3110040D16 gene AI837879 248843 2.3 �1.2 1928 Unknown6500 Ndrg3 N-myc downstream regulated gene 3 AI836631 279256 5.1 �1.2 13199 Cell growth and maintenance3882 RIKEN cDNA D030028O16 gene AI451127 259035 2.4 �1.2 7921 Unknown10440 Ttr HPT Transthyretin AI847846 2108 2.8 �1.2 27028 Protein targeting. Sorting and
translocation7427 Moderate similarity to protein sp:P98179
(H. sapiens) RBM3_HUMAN PutativeRNA-binding protein 3
AI838842 352353 2.7 �1.2 4971 Unknown
14068 Aldh1a1 Aldehyde dehydrogenase family 1,subfamily A1
AI851848 4514 3.2 �1.2 1801 Metabolism
12888 EST AI845055 2.7 �1.2 4143 Unknown16284 Similar to eukaryotic translation initiation
factor 3, subunit 9AI854624 21671 2.0 �1.2 2110 Unknown
14905 Ghitm Growth hormone inducibletransmembrane protein
AI852695 182912 4.3 �1.2 2491 Singal transduction mechanism
8846 Camk2a Calcium/calmodulin-dependent proteinkinase (CaM kinase) II alpha
AI846625 2.5 �1.2 5868 Singal transduction mechanism
4559 Icos Inducible T-cell co-stimulator AI451625 42044 2.4 �1.2 2796 Immune system7175 RIKEN cDNA C330002I19 gene AI838914 250641 2.7 �1.2 5466 Unknown7042 Sepp1 CV Selenoprotein P, plasma, 1 AI838693 22699 2.3 �1.2 8751 Control of cellular organization15005 EST AI853050 2.6 �1.2 3933 Unknown12911 RIKEN cDNA 5730469M10 gene AI850090 27227 2.0 �1.2 4689 Unknown4652 EST AI464328 2.4 �1.2 1938 Unknown7322 EST AI839328 3.5 �1.2 9975 Unknown9027 Eef1a1 Eukaryotic translation elongation factor 1
alpha 1AI843451 335315 2.9 �1.2 9107 Protein synthesis
7829 EST AI840273 1.9 �1.3 2035 Unknown8844 Sparc CV Secreted acidic cysteine-rich glycoprotein AI845741 291442 2.6 �1.3 6846 Control of cellular organization7690 Rap2ip Rap2 interacting protein AI839996 2560 2.0 �1.3 2178 Signal transduction mechanism537 Iars Isoleucine-tRNA synthetase AI327140 21118 3.1 �1.3 18315 Protein synthesis12959 Gng7 Guanine nucleotide binding protein (G
protein), gamma 7 subunitAI850107 222496 2.0 �1.3 13583 Signal transduction mechanism
1615 Similar to mKIAA0284 protein AI425997 23689 2.9 �1.3 1992 Unknown15419 Ptgds CV Prostaglandin D2 synthase 21 kDa (brain) AI854274 261831 4.1 �1.3 27463 Metabolism4555 RIKEN cDNA 1700047I17 gene AI451616 295715 1.8 �1.3 1281 Unknown6786 Apbb1 Amyloid beta (A4) precursor protein-
binding, family B, member 1AI840092 38469 2.4 �1.3 4264 Signal transduction mechanism
5959 Sez6l2 Seizure related 6 homolog (mouse)-like 2 AI835902 283926 2.2 �1.3 3160 Signal transduction mechanism8722 Gstm1 Glutathione S-transferase, mu 1 AI841346 37199 2.3 �1.4 8713 Metabolism11801 Ptgds CV Prostaglandin D2 synthase 21 kDa (brain) AI849257 291928 2.4 �1.4 18404 Metabolism7679 Mkrn2 Makorin, ring finger protein, 2 AI839975 101316 2.1 �1.5 8011 Signal transduction mechanism
aCategorization of genes related to the hypothalamic–pituitary–adrenocortical axis (HPA). The hypothalamic–pituitary–thyroid axis (HPT) or to the cerebral vasculature (CV).
Expressionprofiling
ofCRH-R1
knockoutmice
JMDeussing
etal
1483
JournalofCerebralBloodFlow
&M
etabolism(2007)
27,1476–1495

Spatial Analysis of Differentially Expressed Genes byIn Situ Hybridization
To determine the spatial distribution pattern ofcandidate genes and to identify those expressiondomains in the brain causative for the identifiedchanges in gene expression, we performed in situhybridization using riboprobes for selected candi-dates: Rgs5, Sparc, Ptgds (data not shown), Mkrn2(data not shown), Ttr (data not shown), peripheralmyelin protein 22 (Pmp22), selenoprotein P plasma 1(Sepp1), vimentin (Vim), and collagen type I alpha 2(Col1a2). Rgs5 expression was evenly distributedthroughout the brain (Figure 2A). Additionally, highlevels of expression were detected in the PVN of thehypothalamus (Figure 2B) and in the basolateral
amygdala (Figure 2C). Parallel hybridization ofcryosections from wild-type and CRH-R1 mutantbrains revealed an overall stronger expression ofRgs5 in CRH-R1 knockout mice ( + 1.21-fold,P = 0.002; two-tailed t-test; Figure 2A). A similarincrease in Rgs5 expression was observed in thePVN( + 1.27-fold, P < 0.001) whereas expression le-vels in the basolateral amygdala were not altered(Figures 2B and 2C). Sparc was broadly expressed inthe entire brain with highest expression levels in thebasal forebrain including septal nuclei, thalamus,hypothalamus, and amygdala as well as throughoutthe mid- and hindbrain. A significant decrease inexpression was observed in septal nuclei located atthe ventral midline like in the medial septum (�1.53-fold, P = 0.001) or the nuclei of the vertical and
Figure 1 Confirmation of differential expression of selected candidate genes by Northern blot analysis. Validation was performed inCRH-R1 knockout animals and cross-confirmed in CRH-tg animals by comparison with respective wild-type littermates. Forquantification, total RNA from the entire brain and scanning densitometry was applied. Relative expression levels were calculated bynormalization to b-actin signal intensities. Results are presented as mean7s.e.m. of seven animals per genotype. Additionally,representative Northern blots are presented for two animals per genotype including b-actin hybridization results. (A) Crhr1 and (B)Crh expression were monitored as internal controls. (C) Rgs5, (D) Sparc, (E) Ptgds, (F) Mkrn2 and (G) Ttr. *P < 0.05, **P < 0.01,***P < 0.001.
Expression profiling of CRH-R1 knockout miceJM Deussing et al
1484
Journal of Cerebral Blood Flow & Metabolism (2007) 27, 1476–1495

horizontal limb diagonal band (Figure 2D). In thePVN of CRH-R1 mutant mice, the expression of Sparcwas increased (Figure 2E) whereas the claustrum wasidentified as a region of diminished Sparc expressionin CRH-R1 mutant mice (�1.14-fold, P = 0.017;Figure 2F). As already detected for Rgs5, the overallhybridization signal in regions of moderate expres-sion like in the caudate putamen or in the cortex wasstronger in CRH-R1 knockout mice as compared withwild-type littermates ( + 1.21-fold, P = 0.001; Figure2D). The expression of Pmp22 in the mouse CNS has
not been studied in detail, but a recent publicationreport on the expression of Pmp22 at the developingblood–nerve and blood–brain barriers (Roux et al,2004). We found Pmp22 expressed at high levelsthroughout the brain (Figure 2G). In knockout mice,Pmp22 expression was clearly increased comparedwith wild-type littermates ( + 1.17-fold, P < 0.001)with strongest differences in the expression observedin the corpus callosum ( + 1.24-fold, P < 0.001) andin the anterior commissure ( + 1.16-fold, P < 0.001;Figures 2H and 2I). In situ hybridization with a
Figure 2 Spatial distribution of selected candidate genes in the adult mouse brain demonstrated by in situ hybridization usingradiolabeled riboprobes. Each riboprobe was hybridized to sections of 3–5 brains per genotype covering the entire brain from rostralto caudal. Sections of wild-type and CRH-R1 knockout mice were placed side by side on the same slide. Depicted are representativedark field photomicrographs of the coronal sections of Rgs5 (A–C); Sparc (D–F); Pmp22 (G–I); Sepp1 (J, K); Vim (L, M); Col1a2(N–P). Overviews and close-ups are composed of wild-type (left or top, WT) and knockout (right or bottom, KO) sections. AC: anteriorcommissure; BLA: basolateral amygdala; CC: corpus callosum; CL: claustrum; MS: nucleus of the medial septum; PVN:paraventricular nucleus; VDB: nucleus of the vertical limb diagonal band.
Expression profiling of CRH-R1 knockout miceJM Deussing et al
1485
Journal of Cerebral Blood Flow & Metabolism (2007) 27, 1476–1495

specific riboprobe for Sepp1 demonstrated itsubiquitous expression in the adult murine CNS.Quantification by parallel in situ hybridizationanalysis confirmed the decreased expression ofSepp1 throughout the brain of CRH-R1 knockoutmice compared with wild-type littermates (�1.16-fold, P < 0.001; Figure 2J). As for Sparc, the differencein expression was most obvious in the regionsof moderate expression like in the hippocampus(Figure 2K). Strong expression of the intermediatefilament protein Vim was detected in a scatteredpattern throughout the brain, reflecting the cerebralvascular network with blood vessels ranging indiameter from capillaries to arteries and veins. Theexpression of Vim was markedly increased in CRH-R1 knockout mice compared with wild-type animals
( + 1.32-fold; P < 0.001; Figure 2L). Additionally, Vimexpression was detected in the PVN where itsexpression was also found to be increased in mutantanimals ( + 1.28-fold, P < 0.001; Figure 2M). A com-parable but more restricted vascular expressionpattern was detected with a specific riboprobe forCol1a2. Col1a2 was predominantly detected in bloodvessels of larger diameter, with CRH-R1 knockoutmice showing an increased number of Col1a2 positiveblood vessels ( + 1.10-fold, P = 0.032; Figure 2N).Moreover, we identified a previously unrecognizedweak expression of Col1a2 in the PVN (Figure 2O) andin the ventromedial hypothalamus (Figure 2P). Theexpression of Col1a2 in the PVN was downregulatedin CRH-R1 knockout mice whereas no difference wasobserved in the ventromedial hypothalamus.
Figure 2 continued
Expression profiling of CRH-R1 knockout miceJM Deussing et al
1486
Journal of Cerebral Blood Flow & Metabolism (2007) 27, 1476–1495

All genes analyzed by in situ hybridizationpresented a moderate to high expression and wererather ubiquitously dispersed all over the brain. Themajority of identified differences in gene expressionreflected global changes in expression levels. Never-theless, some candidate genes exhibited genotype-dependent alterations in gene expression that wererestricted to specific nuclei and in some cases evenshowed an opposite regulation compared withobserved global changes.
Alterations in Gene Expression in Corticotropin-releasing Hormone Receptor Type 1 Mutant Mice arePredominantly Associated with the CerebralVasculature
The majority of genes analyzed by in situ hybridiza-tion exhibited global changes in activity reflecting
their ubiquitous expression throughout the adultmurine brain (Figure 2). A detailed analysis of thespatial distribution pattern of in situ hybridizationsignals within the brain parenchyma confined theexpression not only of Vim and Col1a2 but also ofRgs5, Sparc, and Sepp1 to the neurovascular net-work (Figures 3D–H). As an example, we demon-strated the microvascular localization of Rgs5. Cellsexpressing Rgs5 were detected in close vicinity of orattached to arterioles and capillaries as visualizedby vector red staining of endogenous AP activity,which is exclusively present in cerebral vascularendothelial cells (Figures 3A–C). Rgs5 and Sparcwere clearly upregulated in the cerebral vasculatureof CRH-R1 knockout mice as observed for Vim andCol1a2 (Figures 3D, 3E, 3G, and 3H) whereas theexpression of Sepp1 was decreased in brain capil-laries of mutant animals (Figure 3F). Besides Rgs5,Sparc, Sepp1, Vim, Col1a2, and Pmp22 further
Figure 3 Genes regulated in CRH-R1 knockout mice are differentially expressed within the cerebral vasculature. (A–C) Rgs5expression was specifically detected in vascular smooth muscle cells and pericytes by in situ hybridization and simultaneous APstaining of cerebral blood vessels. (A) Dark field photomicrograph from the cortex displaying Rgs5 expression (arrows) associatedwith cerebral microvessels (red). (B, C) Bright and respective dark field photomicrograph of brain capillaries with associated Rgs5-expressing pericytes. (D–H) Representative dark field photomicrographs of coronal sections from the cortex hybridized withriboprobes of Rgs5 (D); Sparc (E); Sepp1 (F); Vim (G); and Col1a2 (H). Photomicrographs are composed of wild-type (left, WT) andmutant (right, KO) sections.
Expression profiling of CRH-R1 knockout miceJM Deussing et al
1487
Journal of Cerebral Blood Flow & Metabolism (2007) 27, 1476–1495

genes known to be expressed in cell types associatedwith the cerebral vasculature were identified amongcandidate genes obtained by expression profiling:procollagen type I alpha 1 (Col1a1), glutamate-ammonia ligase (Glul), tight junction protein 1(Tjp1), angiomotin-like 1 (Amotl1), and pleiotrophin(Ptn). In summary, analysis of the spatial expressionpattern of candidate genes underscores a predomi-nant effect of the CRH-R1-deficiency on the regula-tion of genes associated with the cerebralvasculature.
Opposite Regulation of Candidate Genes inCorticotropin-releasing Hormone OverexpressingMice Confirmed the Changes in Gene ExpressionAssociated with the Cerebral Vasculature
We have demonstrated that genes differentiallyexpressed in CRH-R1 knockout mice were conver-sely regulated in CRH-tg mice. Therefore, we alsoexamined the expression of genes associated withthe cerebral vasculature identified in CRH-R1knockout mice in the brain of CRH-tg mice (Figure4). In situ hybridization for Rgs5, Sparc, Sepp1, Vim,and Col1a2 on cryosections of CRH-tg and wild-typecontrol mice confirmed the expression patternspreviously observed in CRH-R1 knockout andwild-type mice (Figures 4A–J). While the differencesin gene expression restricted to specific brain nucleiwere not observed in CRH-tg mice, for example, theexpression of Sparc in the claustrum was not altered(Figure 4C), the vascular localization and genotype-dependent differential expression was confirmedfor all genes analyzed. As observed in the Northernblot analysis, genes upregulated in CRH-R1mice (Rgs5, Sparc; Vim, Col1a2) were found to bedownregulated (Rgs5: �1.57-fold, P < 0.001,Figure 4B; Sparc: Figure 4D; Vim: �1.13-fold,P = 0.023, Figure 4H; and Col1a2: �1.07-fold,P = 0.051, Figure 4J) in the cerebral vasculature ofCRH-tg mice and vice versa (Sepp: + 1.51-fold,P = 0.052; Figure 4F).
The Density of Cerebral Blood Vessels was AffectedNeither in Corticotropin-Releasing Hormone ReceptorType 1 Knockout Nor in Corticotropin-ReleasingHormone Overexpressing Mice, but AlkalinePhosphatase Activity was Regulated Differently
To test whether the observed differences in geneexpression potentially resulted from quantitativemorphologic differences, we investigated the den-sity of the cerebrovascular network. Cryosections ofCRH-R1 wild-type and mutant mice were stainedfor the basement membrane protein collagen IV tovisualize blood vessels. No significant genotype-dependent differences regarding the density ofcapillaries were observed (data not shown). Wefurther examined AP activity, which is a specificmarker for endothelial cells of arteries, arterioles,
and capillaries, and distinguishes afferent fromefferent blood vessels in the brain (Bell and Scarrow,1984). Staining of cryosections with the AP sub-strate BCIP confirmed the similarity of cerebralmicrovessel density in the brains of CRH-R1 mutantand wild-type animals. However, a strong differencein enzymatic activity became apparent (Figure 5A).Histomorphometrical quantification revealed a 1.8-fold upregulation of AP activity in sections of CRH-R1-deficient brains compared with wild-type brains(Figure 5C). Accordingly, collagen IV staining ofcerebral blood vessels of CRH-tg mice revealed nogenotype-dependent differences in the density ofthe neurovascular network compared with wild-type littermates (data not shown). However, APstaining manifested a marked decrease of enzymaticactivity in CRH-tg brains compared with wild-typelittermates (Figures 5B and 5C).
Perfusion of entire brains of CRH-R1 mutant miceand wild-type littermates with BCIP revealed thatthe increase in AP staining is consistently presentthroughout the afferent blood supply, from pialarteries on the surface of the brain to intracerebralcapillaries (Figures 6A and 6B). This is in contrastto CRH-tg mice, where AP activity is severelydownregulated within the afferent blood supply(Figures 6C and 6D). In summary, these resultsestablish AP as a marker reflecting CRH/CRH-R1-dependent changes in neurovascular geneexpression.
Corticotropin-Releasing Hormone Receptor Type 1 isExpressed in the Cerebral Microvasculature
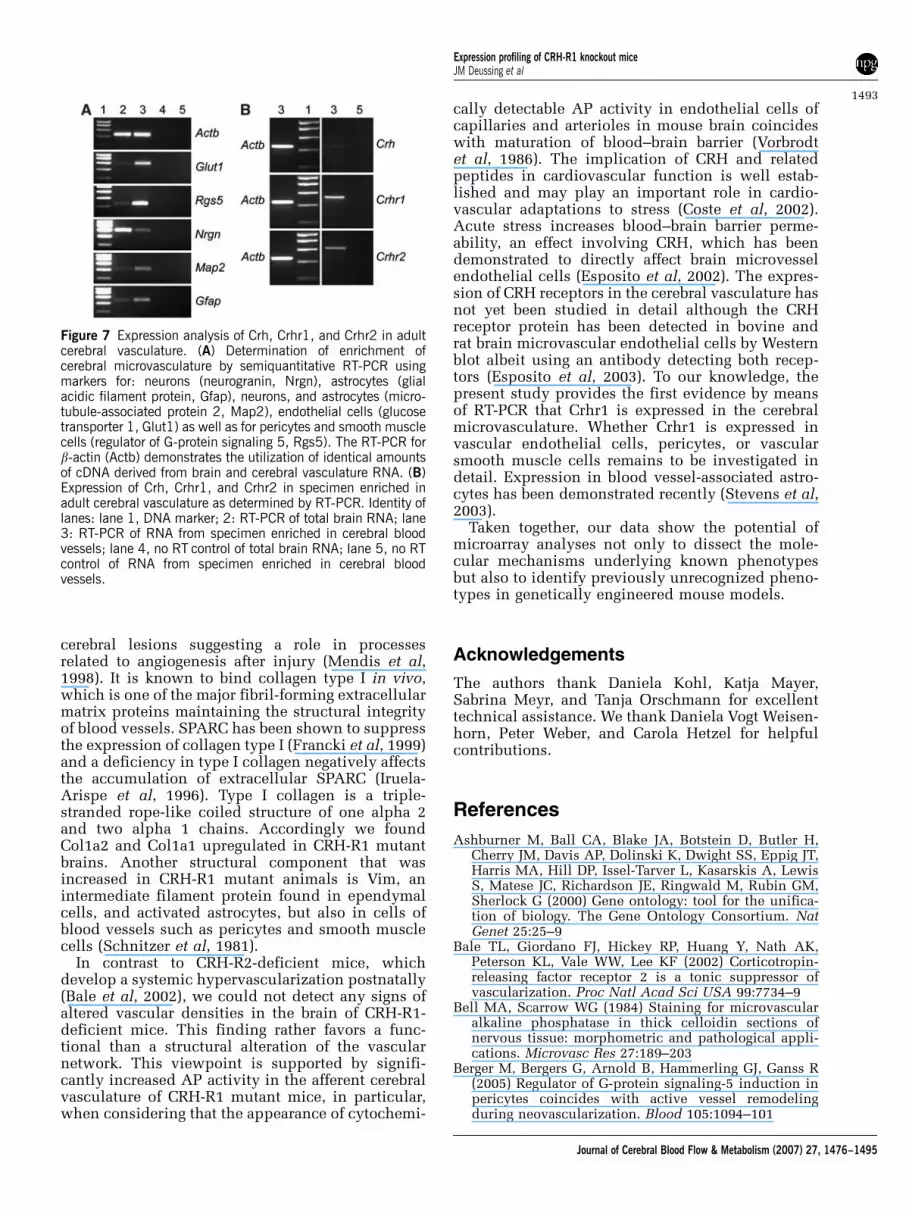
The observed changes in cerebrovascular geneexpression in CRH-R1 mutant animals and theirconfirmation in CRH-tg mice suggest a direct role ofthe CRH/CRH-R system in modulating neurovascu-lar gene expression. Since the expression of CRHand its receptors in the cerebral vasculature of themouse has not been studied in detail, we investi-gated the expression of Crh, Crhr1, and Crhr2by semiquantitative RT-PCR in RNA extractedfrom specimen enriched in murine cerebral vascu-lature.
We demonstrated the strong enrichment of cere-bral blood vessels using glucose transporter 1(Glut1) and Rgs5 as specific markers for endothelialand perivascular cells (pericytes and smooth musclecells), respectively (Figure 7A). The purity of bloodvessels was assessed by RT-PCR using neurogranin(Ngrn) as a marker for neurons as well as the Map2,which is a marker for neurons and astrocytes. Thelow expression of Nrgn in the vascular sampleindicates only a minor contamination with neurons.However, the increased expression of Map2 in thevascular sample compared with the brain samplesuggests a co-purification of astrocytes that mostlikely remain attached to the cerebral vasculature.This interpretation is supported by the increased
Expression profiling of CRH-R1 knockout miceJM Deussing et al
1488
Journal of Cerebral Blood Flow & Metabolism (2007) 27, 1476–1495

expression of Gfap observed in the sample enrichedin cerebral vasculature (Figure 7A). RT-PCR revealedthe expression of Crhr1 in the cerebral vasculature.
Crhr2 was also found expressed, however, at lowerlevels whereas Crh is not expressed or its expressionlevel was below the detection limit (Figure 7B).
Figure 4 Cross-confirmation of CRH-R1 deficiency-dependent gene expression in the cerebral vasculature of CRH-tg mice.Expression of Rgs5 (A, B), Sparc (C, D), Sepp1 (E, F), Vim (G, H), Col1a2 (I, J) in adult mouse brains demonstrated by in situhybridization using radiolabeled riboprobes. Each riboprobe was hybridized to sections of 3–5 brains per genotype covering the entirebrain from rostral to caudal. Sections of wild-type and CRH-tg mice were placed side by side on the same slide. Representative darkfield photomicrographs depict overviews and close-ups of coronal views composed of wild-type (left or top, WT) and CRH-tg (right orbottom, TG) sections.
Expression profiling of CRH-R1 knockout miceJM Deussing et al
1489
Journal of Cerebral Blood Flow & Metabolism (2007) 27, 1476–1495

Discussion
Despite the enormous heterogeneity of the brain,which consists of a multitude of different cell typesand is composed of numerous functionally andmorphologically distinguishable units, we identi-fied and confirmed differentially expressed genesestablishing the MPIP-17k array as a reliable plat-form for expression profiling. The comparison ofgene expression profiles of brains derived fromCRH-R1 knockout and wild-type mice identifiedalterations in gene expression predominantly re-lated to (i) the HPA axis, (ii) the HPT axis, and (iii)the cerebral vasculature.
Hypothalamic–Pituitary–Adrenal Axis Dysregulationin Corticotropin-Releasing Hormone Receptor Type 1Mutant Mice Results in Altered Expression of GenesControlling Hypothalamic–Pituitary–Adrenal AxisActivity and Glucocorticoid Signaling
The PVN plays a crucial role in controlling HPA axisactivity via stress-induced expression and release of
CRH. Disruption of the HPA axis in CRH-R1 knock-out mice results in an activation of the hypothalamicvassopressinergic system, which is sufficient tomaintain normal basal plasma ACTH levels (Mulleret al, 2000). Similar adaptive mechanisms mayaccount for altered expression of Rgs5, Vim, Sparc,and Col1a2 observed in the PVN of CRH-R1 knock-out mice. As genes directly related to HPA axiscontrol and glucocorticoid signaling, we foundNr3c1, Hsd11b1, Fkbp4, Calr, and p23 differentiallyexpressed between wild-type and knockout mice.Nr3c1, also known as glucocorticoid receptor (GR),was found to be upregulated 1.2-fold in the brain ofCRH-R1 mutant mice. An autoregulation of GR hasbeen demonstrated earlier in adrenalectomized rats,which show increased hippocampal GR expression(Reul et al, 1989). Hsd11b1, the key enzymeregulating intracellular regeneration of glucocorti-coids in the brain and pituitary, was increased 1.3-fold in CRH-R1 mutant brains likely by similarregulatory mechanisms. Studies with mice deficientin Hsd11b1 have demonstrated the importance ofthis 11-b-hydroxysteroid dehydrogenase for HPAaxis regulation (Harris et al, 2001). Our result is in
Figure 4 continued
Expression profiling of CRH-R1 knockout miceJM Deussing et al
1490
Journal of Cerebral Blood Flow & Metabolism (2007) 27, 1476–1495

line with expression-profiling experiments usingCRH-tg mice, which reported a 0.57-fold down-regulation of Hsd11b1 in the hippocampus poten-tially attributed to the chronic elevation ofglucocorticoids in these mice (Peeters et al, 2004).Peeters and co-workers further demonstrated a 2.17-fold upregulation of Fkbp5 in the temporal area andin the nucleus accumbens of CRH-tg mice. Ourstudies revealed an increase of Fkbp4 ( + 1.1-fold) inthe entire brain of CRH-R1 knockout mice. Gluco-corticoid receptor forms a heteromultimeric cyto-plasmic complex with heat-shock protein (HSP) 90,HSP70, and FKBP5. On ligand binding, FKBP5 isreplaced by FKBP4, which links the complex to
dynein and thereby mediates the transport to thenucleus. Expression of p23, another co-chaperonestabilizing the GR-HSP90 complex and involved inGR activation, was found 1.1-fold increased (Dittmaret al, 1997). The upregulation of Calr ( + 1.2-fold)most likely parallels regulatory mechanisms invol-ving Fkpb4 and p23. CALR is a multifunctionalprotein, which is capable of binding to the DNA-binding domain of GR and facilitates its export fromthe nucleus to the cytoplasm (Holaska et al, 2002).In CRH-R1-deficient mice, the increase in Fkbp4,p23, and Calr expression might contribute tocompensatory processes counteracting low plasmacorticosterone levels, in contrast to CRH-tg mice,where upregulation of Fkbp5 is rather attenuatingGR as a response to high levels of circulatingglucocorticoids.
Differential Expression of Hypothalamic–Pituitary–Thyroid Axis Components Reflects Cross-RegulatoryMechanisms Between Hypothalamic-Pituitary-Adrenal and Hypothalamic–Pituitary–Thyroid Axes
The HPT axis is a stress-responsive endocrinesystem, which is regulated by glucocorticoids, theend product of the HPA axis. Different from the HPAaxis, the HPT axis is inhibited in depressed patients(Musselman and Nemeroff, 1996). Glucocorticoidsrepress the HPT axis on the level of the hypothala-mus by inhibiting thyrotropin-releasing hormoneexpression (Kakucska et al, 1995). Activation of theHPA axis has been associated with the decreasedproduction of thyroid-stimulating hormone andinhibition of peripheral conversion of L-thyroxine(T4) to the biologically more active 3,5,30-L-tri-iodothyronine (T3). The herein reported microarrayanalysis identified an altered expression of severalmajor HPT axis components in the brain of CRH-R1mutant mice reflecting the regulatory influence ofthe HPA axis. For instance, Ttr (also known asprealbumin), which is in the brain the only thyroidhormone-binding plasma protein, was downregu-lated 1.1/1.2-fold. Under physiologic conditions,TTR functions as a carrier for T4 and vitamin A, inthe latter case through binding to the retinol-bindingprotein (Monaco, 2000). T4, which is the majorsecretory product of the thyroid gland, is convertedby DIO2 to active T3. Thereby DIO2 plays a criticalrole in locally regulating the intracellular T3concentration (Bianco et al, 2002). We found Dio2upregulated 1.5-fold in mutant mice, potentiallyresulting in increased brain T3 levels. This result isin agreement with array data by Peeters et al (2004),where Dio2 was found to be downregulated (0.53-fold) in the prefrontal cortex of CRH-tg mice. Thedownregulation of the nuclear hormone receptorThra (�1.1-fold), which is the executer of T3 activity(O’Shea and Williams, 2002), might reflect aconsequence of increased local T3 levels becauseof elevated DIO2 activity. Finally, the downregulation
Figure 5 The activity of AP in the cerebral vasculature is alteredin CRH-R1 knockout and CRH-tg mice. Representative brightfield photomicrographs of AP-stained cryosections from thestriatum of (A) CRH-R1 knockout and from the cortex of (B)CRH-tg animals and respective control littermates. (C) Histo-morphometric quantification of AP activity on adult brainsections from CRH-R1 knockout and CRH-tg animals.
Expression profiling of CRH-R1 knockout miceJM Deussing et al
1491
Journal of Cerebral Blood Flow & Metabolism (2007) 27, 1476–1495

of Trip12 (�1.2-fold) underscores the direct impactof the HPA axis disruption on the HPT axis inCRH-R1-deficient mice.
Corticotropin-Releasing Hormone Receptor Type 1Deficiency and Corticotropin-Releasing HormoneOverexpression Interfere with Neurovascular GeneExpression
Apart from the HPA and HPT axis, our attention wasdrawn to the cerebral vasculature by the highproportion of regulated genes localized to themicrovasculature and to cells associated with theblood–brain barrier. For instance, Rgs5 ( + 1.2-fold)is almost exclusively expressed throughout thecerebral microvascular network. RGS5 belongs to alarge family of multifunctional signaling proteins,acting as GTPase-activating proteins, thereby nega-tively regulating G protein-coupled receptor signal-ing. RGS5 was identified as a novel marker for
pericytes and vascular smooth muscle cells by theexpression profiling of PDGF-B-deficient mouseembryos (Bondjers et al, 2003), and was founddownregulated in brain capillaries of stroke-pronespontaneously hypertensive rats (Kirsch et al, 2001).RGS5 regulates platelet-derived growth factor re-ceptor-b and G protein-coupled receptor-mediatedsignaling pathways active during fetal vascularmaturation as well as during phases of active vesselremodeling (Berger et al, 2005).
The expression of several structural constituentsof the cerebral vasculature including Sparc, Vim,and Col1a2 was induced in CRH-R1 knockoutbrains. The Ca2 +-binding matricellular glycoproteinSPARC modulates the interaction of cells with theextracellular matrix by regulating cell adhesion andbinding of growth factors. SPARC regulates theactivity of PDGF, VEGF, and fibroblast growthfactor-2, which are important for vascular home-ostasis (Raines et al, 1992; Kupprion et al, 1998).SPARC was induced in mature blood vessels close to
Figure 6 Alkaline phosphatase activity in the afferent blood supply of CRH-R1 knockout and CRH-tg mice is regulated genotypedependently. Dorsal view of (A) CRH-R1 knockout (KO) and (C) CRH-tg (TG) brains and respective wild-type controls (WT, left) afterperfusion with the AP substrate NBT/BCIP. (B) Alkaline phosphatase activity in cerebral arteries of CRH-R1 knockout (bottom, KO)animals is increased compared with wild-type animals (WT, top). (D) Alkaline phosphatase activity in cerebral arteries of CRH-tganimals (bottom, TG) is decreased compared with wild-type animals (WT, top).
Expression profiling of CRH-R1 knockout miceJM Deussing et al
1492
Journal of Cerebral Blood Flow & Metabolism (2007) 27, 1476–1495
cerebral lesions suggesting a role in processesrelated to angiogenesis after injury (Mendis et al,1998). It is known to bind collagen type I in vivo,which is one of the major fibril-forming extracellularmatrix proteins maintaining the structural integrityof blood vessels. SPARC has been shown to suppressthe expression of collagen type I (Francki et al, 1999)and a deficiency in type I collagen negatively affectsthe accumulation of extracellular SPARC (Iruela-Arispe et al, 1996). Type I collagen is a triple-stranded rope-like coiled structure of one alpha 2and two alpha 1 chains. Accordingly we foundCol1a2 and Col1a1 upregulated in CRH-R1 mutantbrains. Another structural component that wasincreased in CRH-R1 mutant animals is Vim, anintermediate filament protein found in ependymalcells, and activated astrocytes, but also in cells ofblood vessels such as pericytes and smooth musclecells (Schnitzer et al, 1981).
In contrast to CRH-R2-deficient mice, whichdevelop a systemic hypervascularization postnatally(Bale et al, 2002), we could not detect any signs ofaltered vascular densities in the brain of CRH-R1-deficient mice. This finding rather favors a func-tional than a structural alteration of the vascularnetwork. This viewpoint is supported by signifi-cantly increased AP activity in the afferent cerebralvasculature of CRH-R1 mutant mice, in particular,when considering that the appearance of cytochemi-
cally detectable AP activity in endothelial cells ofcapillaries and arterioles in mouse brain coincideswith maturation of blood–brain barrier (Vorbrodtet al, 1986). The implication of CRH and relatedpeptides in cardiovascular function is well estab-lished and may play an important role in cardio-vascular adaptations to stress (Coste et al, 2002).Acute stress increases blood–brain barrier perme-ability, an effect involving CRH, which has beendemonstrated to directly affect brain microvesselendothelial cells (Esposito et al, 2002). The expres-sion of CRH receptors in the cerebral vasculature hasnot yet been studied in detail although the CRHreceptor protein has been detected in bovine andrat brain microvascular endothelial cells by Westernblot albeit using an antibody detecting both recep-tors (Esposito et al, 2003). To our knowledge, thepresent study provides the first evidence by meansof RT-PCR that Crhr1 is expressed in the cerebralmicrovasculature. Whether Crhr1 is expressed invascular endothelial cells, pericytes, or vascularsmooth muscle cells remains to be investigated indetail. Expression in blood vessel-associated astro-cytes has been demonstrated recently (Stevens et al,2003).
Taken together, our data show the potential ofmicroarray analyses not only to dissect the mole-cular mechanisms underlying known phenotypesbut also to identify previously unrecognized pheno-types in genetically engineered mouse models.
Acknowledgements
The authors thank Daniela Kohl, Katja Mayer,Sabrina Meyr, and Tanja Orschmann for excellenttechnical assistance. We thank Daniela Vogt Weisen-horn, Peter Weber, and Carola Hetzel for helpfulcontributions.
References
Ashburner M, Ball CA, Blake JA, Botstein D, Butler H,Cherry JM, Davis AP, Dolinski K, Dwight SS, Eppig JT,Harris MA, Hill DP, Issel-Tarver L, Kasarskis A, LewisS, Matese JC, Richardson JE, Ringwald M, Rubin GM,Sherlock G (2000) Gene ontology: tool for the unifica-tion of biology. The Gene Ontology Consortium. NatGenet 25:25–9
Bale TL, Giordano FJ, Hickey RP, Huang Y, Nath AK,Peterson KL, Vale WW, Lee KF (2002) Corticotropin-releasing factor receptor 2 is a tonic suppressor ofvascularization. Proc Natl Acad Sci USA 99:7734–9
Bell MA, Scarrow WG (1984) Staining for microvascularalkaline phosphatase in thick celloidin sections ofnervous tissue: morphometric and pathological appli-cations. Microvasc Res 27:189–203
Berger M, Bergers G, Arnold B, Hammerling GJ, Ganss R(2005) Regulator of G-protein signaling-5 induction inpericytes coincides with active vessel remodelingduring neovascularization. Blood 105:1094–101
Figure 7 Expression analysis of Crh, Crhr1, and Crhr2 in adultcerebral vasculature. (A) Determination of enrichment ofcerebral microvasculature by semiquantitative RT-PCR usingmarkers for: neurons (neurogranin, Nrgn), astrocytes (glialacidic filament protein, Gfap), neurons, and astrocytes (micro-tubule-associated protein 2, Map2), endothelial cells (glucosetransporter 1, Glut1) as well as for pericytes and smooth musclecells (regulator of G-protein signaling 5, Rgs5). The RT-PCR forb-actin (Actb) demonstrates the utilization of identical amountsof cDNA derived from brain and cerebral vasculature RNA. (B)Expression of Crh, Crhr1, and Crhr2 in specimen enriched inadult cerebral vasculature as determined by RT-PCR. Identity oflanes: lane 1, DNA marker; 2: RT-PCR of total brain RNA; lane3: RT-PCR of RNA from specimen enriched in cerebral bloodvessels; lane 4, no RT control of total brain RNA; lane 5, no RTcontrol of RNA from specimen enriched in cerebral bloodvessels.
Expression profiling of CRH-R1 knockout miceJM Deussing et al
1493
Journal of Cerebral Blood Flow & Metabolism (2007) 27, 1476–1495

Bianco AC, Salvatore D, Gereben B, Berry MJ, Larsen PR(2002) Biochemistry, cellular and molecular biology,and physiological roles of the iodothyronine seleno-deiodinases. Endocr Rev 23:38–89
Bondjers C, Kalen M, Hellstrom M, Scheidl SJ, AbramssonA, Renner O, Lindahl P, Cho H, Kehrl J, Betsholtz C(2003) Transcription profiling of platelet-derivedgrowth factor-B-deficient mouse embryos identifiesRGS5 as a novel marker for pericytes and vascularsmooth muscle cells. Am J Pathol 162:721–9
Coste SC, Quintos RF, Stenzel-Poore MP (2002) Cortico-tropin-releasing hormone-related peptides and recep-tors: emergent regulators of cardiovascular adaptationsto stress. Trends Cardiovasc Med 12:176–82
Dagerlind A, Friberg K, Bean AJ, Hokfelt T (1992)Sensitive mRNA detection using unfixed tissue: com-bined radioactive and non-radioactive in situ hybridi-zation histochemistry. Histochemistry 98:39–49
Deussing JM, Wurst W (2005) Dissecting the genetic effectof the CRH system on anxiety and stress-relatedbehaviour. C R Biol 328:199–212
Dittmar KD, Demady DR, Stancato LF, Krishna P, Pratt WB(1997) Folding of the glucocorticoid receptor by theheat shock protein (hsp) 90-based chaperone machin-ery. The role of p23 is to stabilize receptor.hsp90heterocomplexes formed by hsp90.p60.hsp70. J BiolChem 272:21213–20
Esposito P, Basu S, Letourneau R, Jacobson S, TheoharidesTC (2003) Corticotropin-releasing factor (CRF) candirectly affect brain microvessel endothelial cells.Brain Res 968:192–8
Esposito P, Chandler N, Kandere K, Basu S, Jacobson S,Connolly R, Tutor D, Theoharides TC (2002) Cortico-tropin-releasing hormone and brain mast cells regulateblood–brain-barrier permeability induced by acutestress. J Pharmacol Exp Ther 303:1061–6
Francki A, Bradshaw AD, Bassuk JA, Howe CC, CouserWG, Sage EH (1999) SPARC regulates the expression ofcollagen type I and transforming growth factor-beta1 inmesangial cells. J Biol Chem 274:32145–52
Groenink L, Pattij T, De JR, van der GJ, Oosting RS, DirksA, Olivier B (2003) 5-HT1A receptor knockout mice andmice overexpressing corticotropin-releasing hormone inmodels of anxiety. Eur J Pharmacol 463:185–97
Harris HJ, Kotelevtsev Y, Mullins JJ, Seckl JR, Holmes MC(2001) Intracellular regeneration of glucocorticoids by11beta-hydroxysteroid dehydrogenase (11beta-HSD)-1plays a key role in regulation of the hypothalamic–pituitary–adrenal axis: analysis of 11beta-HSD-1-defi-cient mice. Endocrinology 142:114–20
Hochberg Y, Benjamini Y (1990) More powerful proce-dures for multiple significance testing. Stat Med 9:811–8
Holaska JM, Black BE, Rastinejad F, Paschal BM (2002)Ca2+-dependent nuclear export mediated by calreticu-lin. Mol Cell Biol 22:6286–97
Holsboer F (1999) The rationale for corticotropin-releasinghormone receptor (CRH-R) antagonists to treat depres-sion and anxiety. J Psychiatr Res 33:181–214
Iruela-Arispe ML, Vernon RB, Wu H, Jaenisch R, Sage EH(1996) Type I collagen-deficient Mov-13 mice do notretain SPARC in the extracellular matrix: implicationsfor fibroblast function. Dev Dyn 207:171–83
Kakucska I, Qi Y, Lechan RM (1995) Changes in adrenalstatus affect hypothalamic thyrotropin-releasing hor-mone gene expression in parallel with corticotropin-releasing hormone. Endocrinology 136:2795–802
Kirsch T, Wellner M, Luft FC, Haller H, Lippoldt A (2001)Altered gene expression in cerebral capillaries ofstroke-prone spontaneously hypertensive rats. BrainRes 910:106–15
Kupprion C, Motamed K, Sage EH (1998) SPARC (BM-40,osteonectin) inhibits the mitogenic effect of vascularendothelial growth factor on microvascular endothelialcells. J Biol Chem 273:29635–40
Mendis DB, Ivy GO, Brown IR (1998) SPARC/osteonectinmRNA is induced in blood vessels following injury tothe adult rat cerebral cortex. Neurochem Res 23:1117–23
Monaco HL (2000) The transthyretin-retinol-binding pro-tein complex. Biochim Biophys Acta 1482:65–72
Muller MB, Holsboer F (2006) Mice with mutations in theHPA-system as models for symptoms of depression.Biol Psychiatry 59:1104–15
Muller MB, Landgraf R, Preil J, Sillaber I, Kresse AE, KeckME, Zimmermann S, Holsboer F, Wurst W (2000)Selective activation of the hypothalamic vasopressiner-gic system in mice deficient for the corticotropin-releasing hormone receptor 1 is dependent on gluco-corticoids. Endocrinology 141:4262–9
Musselman DL, Nemeroff CB (1996) Depression andendocrine disorders: focus on the thyroid and adrenalsystem. Br J Psychiatry Suppl 30:123–8
Nemeroff CB, Widerlov E, Bissette G, Walleus H, KarlssonI, Eklund K, Kilts CD, Loosen PT, Vale W (1984)Elevated concentrations of CSF corticotropin-releasingfactor-like immunoreactivity in depressed patients.Science 226:1342–4
O’Shea PJ, Williams GR (2002) Insight into the physiolo-gical actions of thyroid hormone receptors fromgenetically modified mice. J Endocrinol 175:553–70
Parkes DG, Weisinger RS, May CN (2001) Cardiovascularactions of CRH and urocortin: an update. Peptides22:821–7
Peeters PJ, Fierens FL, van den Wyngaert I, GoehlmannHW, Swagemakers SM, Kass SU, Langlois X, Pullan S,Stenzel-Poore MP, Steckler T (2004) Gene expressionprofiles highlight adaptive brain mechanisms in corti-cotropin releasing factor overexpressing mice. BrainRes Mol Brain Res 129:135–50
Raines EW, Lane TF, Iruela-Arispe ML, Ross R, Sage EH(1992) The extracellular glycoprotein SPARC interactswith platelet-derived growth factor (PDGF)-AB and -BBand inhibits the binding of PDGF to its receptors. ProcNatl Acad Sci USA 89:1281–5
Refojo D, Echenique C, Muller MB, Reul JM, Deussing JM,Wurst W, Sillaber I, Paez-Pereda M, Holsboer F, Arzt E(2005) Corticotropin-releasing hormone activatesERK1/2 MAPK in specific brain areas. Proc Natl AcadSci USA 102:6183–8
Reul JM, Holsboer F (2002) Corticotropin-releasing factorreceptors 1 and 2 in anxiety and depression. Curr OpinPharmacol 2:23–33
Reul JM, Pearce PT, Funder JW, Krozowski ZS (1989) TypeI and type II corticosteroid receptor gene expression inthe rat: effect of adrenalectomy and dexamethasoneadministration. Mol Endocrinol 3:1674–80
Roux KJ, Amici SA, Notterpek L (2004) The temporospa-tial expression of peripheral myelin protein 22 at thedeveloping blood–nerve and blood–brain barriers.J Comp Neurol 474:578–88
Schnitzer J, Franke WW, Schachner M (1981) Immuno-cytochemical demonstration of vimentin in astrocytesand ependymal cells of developing and adult mousenervous system. J Cell Biol 90:435–47
Expression profiling of CRH-R1 knockout miceJM Deussing et al
1494
Journal of Cerebral Blood Flow & Metabolism (2007) 27, 1476–1495

Stenzel-Poore MP, Cameron VA, Vaughan J, SawchenkoPE, Vale W (1992) Development of Cushing’s syndromein corticotropin-releasing factor transgenic mice. Endo-crinology 130:3378–86
Stevens SL, Shaw TE, Dykhuizen E, Lessov NS, Hill JK,Wurst W, Stenzel-Poore MP (2003) Reduced cerebralinjury in CRH-R1 deficient mice after focal ischemia: apotential link to microglia and atrocytes that expressCRH-R1. J Cereb Blood Flow Metab 23:1151–9
Timpl P, Spanagel R, Sillaber I, Kresse A, Reul JM, StallaGK, Blanquet V, Steckler T, Holsboer F, Wurst W (1998)Impaired stress response and reduced anxiety in micelacking a functional corticotropin-releasing hormonereceptor 1. Nat Genet 19:162–6
Tsigos C, Chrousos GP (2002) Hypothalamic–pituitary–adrenal axis, neuroendocrine factors and stress.J Psychosom Res 53:865–71
van Gaalen MM, Stenzel-Poore MP, Holsboer F,Steckler T (2002) Effects of transgenic overproductionof CRH on anxiety-like behaviour. Eur J Neurosci15:2007–15
Vargas F, Moreno JM, Rodriguez-Gomez I, Wangensteen R,Osuna A, varez-Guerra M, Garcia-Estan J (2006)Vascular and renal function in experimental thyroiddisorders. Eur J Endocrinol 154:197–212
Vorbrodt AW, Lossinsky AS, Wisniewski HM (1986)Localization of alkaline phosphatase activity in en-dothelia of developing and mature mouse blood-brainbarrier. Dev Neurosci 8:1–13
Yang YH, Dudoit S, Luu P, Lin DM, Peng V, Ngai J,Speed TP (2002) Normalization for cDNA microarraydata: a robust composite method addressing single andmultiple slide systematic variation. Nucleic Acids Res30:e15
Supplementary Information accompanies the paper on the Journal of Cerebral Blood Flow & Metabolism website (http://www.nature.com/jcbfm)
Expression profiling of CRH-R1 knockout miceJM Deussing et al
1495
Journal of Cerebral Blood Flow & Metabolism (2007) 27, 1476–1495
Recommended


![SIP Handbook R1[1]](https://img.pdfslide.net/doc/110x75/631b35fc665120b3330b4208/sip-handbook-r11.jpg)


