
The International Congress for global Science and Technology
ICGST International Journal on Graphics, Vision
and Image Processing (GVIP)
Volume (14), Issue (I) August 2014
www.icgst.com
www.icgst-amc.com www.icgst-ees.com
© ICGST, 2014 Delaware, USA

GVIP Journal ISSN Print 1687-398X ISSN Online 1687-3998 ISSN CD-ROM 1687-4005 © ICGST 2014

Table of Contents
Papers Pages
P1151351311, Gangadhar Tiwari and Debashis Nandi "Secure Image Encryption using Two Dimensional Logistic Map"
1--9
P1151345302, Gangadhar Tiwari, Debashis Nandi and Madhusudhan Mishra "Non-Invertible Wavelet Domain Watermarking using Hash Function",
11--19
P1151404314, Suhas Rautmare and Anjali Bhalchandra "Bench Marking Higuchi Fractal for CBIR"
21--28
P1151420328, Basma M.Almezgagi, M. A. Wahby Shala and Hesham N. Elmahdy "Improved Iris Verification System" 29--38
P1151418327, Vishnu Murthy. G, V. Vijaya Kumar and B.V. Ramana Reddy "Employing Simple Connected Pattern Array Grammar for Generation and Recognition of Connected Patterns on an Image Neighborhood"
39--44
P1151423331, P.Kiran Kumar Reddy, Vakulabharanam Vijaya Kumar and B.Eswar Reddy "Texture Classification Based on Binary Cross Diagonal Shape Descriptor Texture Matrix (BCDSDTM)"
45--51

ICGST International Journal on Graphics, Vision and Image Processing
(GVIP)
A publication of the International Congress for global Science and Technology - (ICGST)
ICGST Editor in Chief: Dr. rer. nat. Ashraf Aboshosha
www.icgst.com, www.icgst-amc.com, www.icgst-ees.com

Secure Image Encryption using Two Dimensional Logistic Map
* Gangadhar Tiwari1, Debashis Nandi2, Abhishek Kumar3, Madhusudhan Mishra4
1, 2Department of Information Technology, NIT Durgapur (W.B.), India 3Department of Electronics and Electrical Engineering, NITAP, (A.P.), India
4Department of Electronics and Communication Engineering, NERIST, (A.P.), India *E-mail: [email protected], http://www.nitdgp.ac.in
Abstract Current researches in image encryption techniques suggest using chaotic systems. But, one-dimensional (1D) chaotic schemes have drawbacks like small key space and weak security. This paper proposes a novel chaotic image encryption scheme based on two-dimensional (2D) logistic map. The 2D logistic map has more complex chaotic behaviors with respect to 1D logistic map like basin structures and attractors. The proposed scheme is based on permutation-substitution network and offers good confusion and diffusion properties in stream and block ciphers both. It encrypts plaintext image into random-like ciphertext image by generating the pseudorandom sequences from logistic map. The key schedule algorithm translates a binary encryption key to initial values and system parameters used in the 2D logistic map. This scheme uses 256 bit long cipher key for encryption/decryption. Experimental result indicates that the proposed scheme is secure against known cryptanalytic attacks and offers superior performance compared to existing chaotic image encryption schemes.
Keywords: Image Encryption, Two Dimensional Logistic Map, Permutation-Substitution Network, Logistic Sequence Generator, Differential Attack.
1. Introduction In order to protect digital images against third party attacks during transmission over insecure digital communication links like internet, there arises the need for image encryption. The conventional cryptographic techniques are based on number theoretic or algebraic concepts and hence unfit for multimedia data encryption due to their huge sizes, higher inter-pixel redundancy, interactive operations, complexity and inability in handling different data formats and requirement of real-time responses [1]. Recent researches suggest that the chaos based image encryption schemes are highly efficient in terms of speed and security with respect to traditional cryptographic schemes. Further, the properties of chaotic maps like sensitivity to initial conditions and system parameter, ergodicity, pseudorandom property, non-periodicity and topological mixing etc. meets the cryptographic requirements.
The main idea behind chaotic image encryption is capacity of chaotic maps to generate pseudorandom number sequences based on initial conditions and control parameter using which images are encrypted. While decrypting, these random number sequences deeply rely on the initial condition and control parameter employed during generation. Little variation in them produces an entirely different set of random numbers. This sensitivity to initial condition and control parameter makes chaotic maps perfect for image encryption and the initial states and control parameters are used as keys during encryption process [2]. A brief analysis of existing chaotic image encryption techniques is presented below.
After, Matthews proposed the first chaos based image encryption scheme, it is researched for years and there exists many papers on chaotic image encryption schemes [3]. An image encryption algorithm based on 2D chaotic maps (baker/cat map) was proposed in reference [4] where discretized chaotic map of image’s pixel were permuted by multiple iterations of shuffling. Diffusion is performed between two adjacent rounds of permutations that notably change the image histogram distribution thereby making statistical cryptanalysis infeasible. Another image encryption scheme based on combination of Kolmogorov flows with fast shift-register-based pseudorandom number generator was proposed in reference [5]. Although these existing techniques operating on block cipher offered greater security and speed, but cannot withstand lossy compression. To tackle this menace, an image encryption technique that performs compression and encryption both was proposed in reference [6]. This scheme encrypts image by manipulating the Huffman coding tables. To achieve this, it selects many different Huffman tables employing them alternatively and the selection of particular Huffman tables and its order are used as secret key. This method is computationally efficient but cannot resist chosen-plaintext attack. An encryption scheme was proposed in reference [7], which employs wavelet transform to decompose the image into several sub-bands and encryption at each level is achieved by random permutation. However, the scheme is insecure against known-plaintext attack or chosen-plaintext attack. A
GVIP Journal, ISSN 1687-398X, Volume 14, Issue 1, August 2014
1

chaotic video encryption scheme based on a multiple digital chaotic system was proposed in reference [8]. To generate pseudorandom signals necessary for hiding the video and performing pseudorandom permutation it employs 2n chaotic maps controlled using another single chaotic map. Their scheme is independent of video compression algorithms and provides greater security.
Later, 1D Logistic map was extensively used for developing image encryption schemes due to its simplicity and ease of implementation [8-11]. However, these schemes were insecure due to weak security and small key space. To improve the security, an image encryption scheme based on non-linear chaotic algorithm (NCA) which uses power function and tangent function was proposed in reference [11]. This model deduced the structural parameters of the chaotic map using experimental analysis and increased the number of parameters to six. The algorithm is designed in a one-time-one password system. Although, it offered better security compared to other 1D chaotic algorithm, still weak security and small key space were the major limitations. Another model proposed to shuffle the pixel position of plain-image and change their gray values to increase the security [12]. An image encryption scheme was proposed in reference [13] by combining Toeplitz and Hankel matrix. Similarly, in reference [14] an image encryption scheme based on perturbation technique was proposed which performs parameter modulation of a non-linear 1D discrete quadratic map (DQM) and greatly reduces dynamical degradation. To achieve greater robustness against attacks it employs two rounds of iterations for encryption and decryption both. A chaotic image encryption scheme based on the time-delay Lorenz system in combination with Circulant matrix was employed in reference [15]. However, these existing techniques treat pixel bytes as bit stream. Further, they are deemed unfit due to weak keys, limited key space, exposure to selected plain text/cipher text attacks and other issues [16, 17, 28]. To overcome this, we adopt an image encryption scheme based on 2D Logistic map in consideration with the confusion and diffusion properties and possible attacks. The logistic map with two dimensions has more complex chaotic behaviors with respect to 1D logistic map like basin structures and attractors. We employ this chaotic map to generate pseudorandom sequences where we propose a key schedule algorithm to translate a binary encryption key to initial values and parameters used in the 2D logistic map. We propose an image encryption algorithm using these pseudorandom sequences based on permutation-substitution network, which effectively provides both confusion and diffusion properties in stream and block ciphers. Experimental results indicate robustness and superiority of the proposed scheme with respect to existing techniques. The security analysis suggests that the proposed algorithm is secure against known cryptanalytic attacks.
The remainder of the paper is organized as follows: Section (2) focuses on detailed analysis of 1D and 2D logistic map and their chaotic properties. The proposed algorithm with block diagram is presented in Section (3).
Section (4) is devoted on simulation results. Discussion on proposed algorithm and its security analysis are provided in Section (5). This paper ends in Section (6) with conclusion. 2. 1D Logistic map vs.2D Logistic Map A 1D Logistic map is defined by Equation (1) below:
)1(1 nnn xxx (1)
where the system parameter (λ) and initial condition(xn) represent the key and lies within the range
)4,0( and )1,0(nx respectively [18]. The
parameter λ is divided into three parts, examined by experiments based on following conditions:
If 3.00 x and )3,0( it does not depict any chaotic
behavior. When )6.3,3( , the phase space concludes
at several points and the system appear periodic. When )4,6.3( , it becomes a chaotic system without
periodicity. Thus 1D Logistic map does not satisfy uniform distribution property and when )6.3,3( the
phase space concludes at several points so deemed unfit to be employed for image encryption. Hence it can be concluded that such cryptosystems would have small key space and weak security. A 2D logistic map is a non-linear dynamical system. If r denotes the system parameter and (xi,yi) represents the pair-wise point at ith iteration, then a 2D logistic map is defined by Equation(2) below:
)1()13(
)1()13(
1
1
iiii
iiii
yyxry
xxyrx
(2)
It evolves in different dynamics depending on system parameter’s value. A detailed analysis of 2D logistic map
with initial conditions )33.0,89.0(),( 00 yx and the
system parameter r indicates that when )1,1(r , the
system has an attractive node and two saddle points, and makes both x and y axes being unstable manifolds. At 1r , the attractive focus undergoes a Neimark-Hopf bifurcation. The attractive focus becomes repulsive and an oscillation appears when )11.1,1(r . The system
exhibits chaotic properties when )19.1,11.1(r , and
the system becomes unpredictable for 19.1r . The 2D logistic map is of specific interest when the value of system parameter lies within the range (1.11, 1.19), as it exhibits cyclic chaotic properties, single chaotic attractor and bifurcations at basin borders [19, 20]. Thus, it can be concluded that provided the value of system parameter and initial conditions are known, the (x,y) trajectory when compared for chaotic behavior is random-like but predictable. Hence, a 2D logistic map is well suited for pseudorandom number generation for image encryption.
In terms of complexity, a 2D logistic map is highly complex compared to 1D logistic map. Table-1 compares the complexity of some known chaotic maps in terms of Lyapunov Exponent and Lyapunov Dimensions. Lyapunov Exponent is measured with respect to each eigen-value by using the Lyapunov toolbox under
GVIP Journal, ISSN 1687-398X, Volume 14, Issue 1, August 2014
2

MATLAB. Lyapunov Dimensions is calculated by using the Lyapunov toolbox under MATLAB [21, 22]. From Table-1, it is evident that a 2D logistic map has a greater value of Lyapunov exponent indicating that it is more dynamic than 1D logistic map. Further, it has greater Lyapunov dimensions compared to other chaotic maps. Figure-1 shows bifurcation diagram for One Dimensional
logistic map where horizontal axis denotes the system parameter, and vertical axis denotes x and each trajectory of logistic map about x with a fixed x is plotted as dots. Thus it is clear that 2D logistic map has more complex chaotic behavior compared to 1D logistic map. Hence we employ it in the proposed image encryption algorithm.
Table-1 Complexity Comparison for known chaotic maps
3. The Proposed Model The image encryption algorithm consists of Logistic Permutation, Diffusion and Transposition creating a permutation-substitution network necessary for image ciphering. The block diagram for proposed image encryption and decryption schemes is presented in Figure-2. If K denotes the cipher key, O is the original image, and E and D are encryption and decryption function respectively, then Encryption and decryption operations are expressed using Equation-(3-4).
),( KOEC (3)
),( KCDO (4)
3.1 The Cipher Key The cipher key K employed in the proposed scheme consist of five parts viz. (x0,y0) being the initial conditions, r the system parameter and T and A the parameters for 2D logistic sequence generator [23]. The first four parts are denoted as a fraction part for double precision float numbers of 56-bit length; and the last part
}.......,{ 821 aaaA stores eight initial coefficients for
generating round keys, each containing four bit }...{ 30 bb .
To calculate(x0, y0), r and T we calculate a fraction value
m from a 56-bit string }.......,{ 5621 nnn using
Equation (5) as below:
56
1
2i
iinm (5)
To calculate coefficients of A, we convert the 4-bit strings to integers. The initial value for each round can be calculated using the Equation (6),
1mod
1mod
1)8mod#(0#
0
1)8mod#(0#
roundround
roundround
o
AyTy
AxTx (6)
The initial conditions and system parameter simultaneously generate long chaotic sequences with length equal to number of pixels in original image. This result in a 256-bit long cipher key, K controlling the pseudorandom number sequences from the 2D logistic map for each round.
Complexity Parameter
1D Logistic (a,b)
2D Logistic (r) Henon (a,b) Duffing’s Eq. (k,B)
3.6 4.0 1.11 1.19 (1.4,0.3) (0.1,11) Start
Chaos End
Chaos Start
Chaos End
Chaos Chaos
Chaos
Lyapunov Exponent
λ1 λ1 λ2 λ1 λ2 λ1 λ2 λ1 λ2 λ3 0.0693 0.364 -0.116 0.565 -0.210 0.418 -1.621 0.114 0 -0.214
Lyapunov Dimension
ND
4.131 3.679 1.26 2.53
Figure-1 Bifurcation diagram for One Dimensional Logistic Map
GVIP Journal, ISSN 1687-398X, Volume 14, Issue 1, August 2014
3

3.2 Logistic Permutation Logistic permutation generates a random ciphertext permutation matrix for an image permutation matrix based on certain initial condition using 2D logistic map. Considering the size of original image O to be M×N, a sequence of pair wise x and y can be generated using
Equation (7). If Xseq and Yseq represents x and y coordinate
sequence respectively then
}.......,{
}.......,{
21
21
MNseq
MNseq
yyyY
xxxX
(7)
On rearranging the above element we obtain a matrix of size M×N for X and Y respectively. Thus rth row of X can
be used to form a bijective mapping x
e and cth column
of Y have a bijective mapping y
e .Thus Xsorted and
Y sorted can be expressed using Equation(8)
ciXY
iXX
y
x
esorted
ci
ersorted
ir
),(
)(
,
,,
(8)
Finally, row and column permutation matrix is calculated using Equation (9)
Ncccy
Mrrrx
yyy
xxx
eeeA
eeeA
.............,
...............21
21
(9)
The algorithm for logistic permutation is as below: Algorithm-1 Logistic Permutation Algorithm Input-Plaintext image O of size M×N, row and column permutation matrix Ax and Ay. Output- Ciphertext image C for r = 1 to M for c = 1 to N Qr,c=O×Ax
r,c, % row shuffling end for end for for r = 1 to M for c = 1 to N Cr,c=Qr×Ay
r,c,,c% row &column shuffling. end for
end for
After 2D logistic permutation, pixels in plaintext image O are well shuffled and permutated image C is unrecognizable. 3.3 Logistic Diffusion The logistic diffusion is applied on every A×A image block Ob within the original image O over the finite field GF(28) , where A is the block size variable determined by the plaintext image format. Ciphertext image block Cb and Ob are determined using Equation (10) where Md is
the maximum distance separation matrix found from 4×4 random permutation matrices represented using Equation (11). (A finite field in cryptography states that for any prime integer p and any integer ≥1, there exists a unique field with pn elements in it, denoted GF (pn). Here, unique means that any 2 fields with same number of elements must be same).
811
8
2)(
2)(
dbdb
dbdb
MCMO
MOMC (10)
4231
1324
1432
4213
dM
13939374
106192103138
85112222189
55122221215
1dM (11)
If the plaintext image O is grayscale or color types, both code an image pixel as a byte, then the image block Ob has size 4×4; else if the plaintext image is a binary image, then Ob is of size 32×32 in bits equivalent to 4×4 image
block in bytes. If plaintext image O has a size M × N indivisible by A, we only apply this process with respect
to the region M×N = floor (size (W)/A) ×A. (A floor(x)
rounds the elements of x to the nearest integers towards minus infinity). Since the 2D logistic diffusion process is applied to every A×A image blocks in the plaintext image per cipher iteration, any one pixel change in plaintext image then causes a change for A×A pixels in each round. Therefore, the least number of cipher iteration to have M×N changing pixels is calculated by Equation (12). After 2 iterations represented by Equation (13), any slight change in a plaintext image leads to significant changes in ciphertext and thus attains the diffusion properties.
(a) Image Encryption System
(b) Image Decryption System
Figure-2 Block Diagram of Proposed Algorithm
Original Image
Logistic Diffusion
Logistic Transposing
Encrypted Image
Logistic Permutation
2D Logistic Sequence Generator Cipher key
2D Logistic Sequence Generator Cipher key
Original Image
Logistic Diffusion
Logistic Transposing
Encrypted Image
Logistic Permutation
GVIP Journal, ISSN 1687-398X, Volume 14, Issue 1, August 2014
4

)log2
log(log
2
2)(min A
NMceilNMiterations AA
(12)
)log
log(
2
2min A
NMceiliterations
(13)
3.4 Logistic Transposition The transposition changes pixel values with respect to the reference image I, which is dependent on the logistic sequence generated after logistic diffusion. First, X and Y, generated in permutation stage are added together to be Z using Equation (14).
YXZ (14) Furthermore, each 4×4 block A in Z is then translated to a random integer matrix using the block function f(A) as shown in Equation (15), where A is a 4×4 block, and the
sub function gN (.), gR (.), gS (.) and gD (.) are defined in Equation (16). The function τ(d) truncates a decimal d from the 1st to 8th digit to form an integer. The symbol F denotes the number of allowed intensity scales of the plaintext image format.
)(Ag)(Ag)(Ag)(Ag
)(Ag)(Ag)(Ag)(Ag
)(Ag)(Ag)(Ag)(Ag
)(Ag)(Ag)(Ag)(
)(
4,4S4,3R4,2N4,1D
3,4R2,3N3,2D3,1S
2,4N2,3D2,2S2,1R
1,4D1,3S1,2R1,1Ag
AfI
N
(15)
)4()(
)()(
)()(
)2()(
3
3
ddg
ddg
ddg
ddg
D
S
R
N
(16)
The random integer matrix I is obtained when function f(.) is applied to all 4×4 block within the 2D logistic map associated with random matrix Z, where each 4×4 block in I is actually mapped from a corresponding 4×4 block in Z with the function f(.) defined in Equation (15). Finally, transposition is achieved by shifting each pixel in original image with the specified amount of the random integer image I over the integer space [0; N-1], N is the number of allowed intensity scales of original image. The encryption and decryption can be represented using Equation (17).
NICO
NIOC
mod)(
mod)(
(17)
4. Simulation Results We performed simulation on Matlab R2011a, under the Windows 7 professional with Dual Core CPU and 4 GB RAM. The sample images from USC SIPI image database are used for testing the performance. An ideal image encryption algorithm should be sensitive to secret key, which means that small (1 bit) change in cipher key would not let cipher image to produce original image after decryption and the resultant image should not convey any information about the original image. The simulation result for Lena and Cameraman images are presented in Figure-3 which proves the validity of encryption scheme. (Lena image is referred here as its properties are most widely reported in image encryption literature.)
(a) Original image (b) Encrypted Image (c) Decrypted Image (d) Decrypted by wrong Key
(a) Original image (b) Encrypted Image (c) Decrypted Image (d) Decrypted by wrong Key Figure-3 Simulation Results on Test Images
GVIP Journal, ISSN 1687-398X, Volume 14, Issue 1, August 2014
5

5. Discussion on Proposed Algorithm and Simulation Results A good image encryption method should be secure against known cryptanalytic attacks. The security analysis of the proposed algorithm such as key space analysis, and its robustness to entropy, statistical and differential attacks proves the validity of algorithm.
5.1 Key space and Key Sensitivity Analysis The key space for a secure encryption scheme should be big enough to thwart brute-force attack. A key space means the total number of different keys used for image encryption/ decryption. An image encryption scheme is secure against brute-force attacks if its key space is greater than 2100 [24]. The cipher key of this algorithm consists of five parts, i.e. (x0, y0), r, T and A, where the first 4 parts are denoted as a fraction part for double precision float number of 56-bit length; and the last part A stores 8 initial coefficients for generating round keys, each containing 4 bits. Thus, the cipher key has 56×4 + 8×4 = 256-bits and the key space is 2256-1, big enough to remain secure against brute force attack. The proposed algorithm is highly key sensitive as evident from simulation results presented in Figure- 3.
5.2 Information Entropy Test Information entropy measures the randomness of the image. The entropy H of a symbol source S can be calculated by following Equation (18)
1
02 )(log)()(
N
iii spspsH (18)
where p(si) represents the probability of symbol si and the entropy is expressed in bits. If the source S emits 28 symbols with equal probability, i.e. S = {s1, s2, . . . , s256}, then the result of entropy is H(S) = 8. The entropy values of original and encrypted images are listed in Table-2. Thus from Table-2, it is evident that information leakage in the scheme is negligible.
Table-2 Entropy of Original and Encrypted Images
Original Image
Entropy of Original Image
Entropy of Encrypted Image
Cameraman 7.1516 7.9992 Elaine 7.6738 7.9785 Gold hill 7.4913 7.9850 Lena 7.4895 7.9775 Pepper 7.5939 7.9895
5.3 Statistical Analysis A secure encryption system encrypts an original image into random-like uniformly-distributed ciphertext image. Image histogram plots the number of pixels in y-axis at each intensity level in x-axis to describe the dispersion of image pixels. We compute the histograms of original and ciphertext images to measure the security level of the proposed scheme. Figures 4(a) and 4(b) shows the histograms of Original Lena image (Figure-3a) and its encrypted version (Figure-3b). Thus, it is evident from Figure-4 that the encrypted image is statistically dissimilar with respect to original image and hence statistical steganalysis using its histogram is impossible.
It is known that each pixel of original image is always highly correlated with its adjacent pixels in horizontal, vertical or diagonal directions. Correlation coefficient (CC), among the adjacent pixels are calculated using Equation (19) and denoted by ρ
22 )''()(
)'')((
xxxx
xxxx (19)
where x and x′ are pixel values of original and encrypted images at position (i,j) respectively. Correlation properties of Lena and its cipher image are given in Figure-5 and their value are listed in Table-3 by proposed method as well as those from literature. It is evident that two adjacent pixels in cipher image are nearly unrelated and the proposed scheme is secure against statistical attack.
(a) Histogram for Original Lena image (3a)
(b) Histogram for Encrypted Lena Image (3b) Figure-4 Histogram Analysis
GVIP Journal, ISSN 1687-398X, Volume 14, Issue 1, August 2014
6

Table-3 CC of adjacent pixels for Lena image and its encrypted version
Image Type Method Horizontal Vertical Diagonal Original Image 0.9749 0.9881 0.9624 Encrypted Image Proposed -0.0089 0.0037 -0.0010 Mao et al., [9] 0.0016 0.0063 -0.0012
Gao et al., [11] 0.04450 0.0284 0.0206 Alam et al., [25] -0.0150 0.0653 -0.0323 Yong [26] 0.0095 0.0106 0.0048
5.4 Analysis of Anti-Differential Attack The number of changing pixel rate (NPCR) and the unified averaged changed intensity (UACI) are employed for evaluating the performance of encryption scheme against differential attack. They are calculated using Equation (20-21) respectively.
%100),(
),(1 1
21
M
i
N
j T
jiDCCN (20)
%100),(),(
),(1 1
2121
M
i
N
j TL
jiCjiCCCU (21)
where C1,C2 are two ciphertext images, T denote the number of pixels in the ciphertext image and L denotes the largest allowed pixel intensity. The difference function D (i, j) is defined in Equation (22) which denotes if two pixels located at the image grid (i, j) of encrypted images are equal.
),(),(,1
),(),(,0),(
21
21
jiCjiCif
jiCjiCifjiD
(22)
Accordingly, the NPCR and UACI tests are applied to encrypted images using proposed algorithm on sample images and results are presented in Table-4. The average NPCR is 99.66% and UACI is 33.60%. To compare reported NPCR and UACI scores from recent image encryption algorithm their values are also listed in
Table-4. From Table-4, it is clear that the proposed method is secure against differential attack and superior with respect to other methods.
6. Conclusion In this paper, we propose a novel image encryption algorithm using 2D logistic map. The 2D logistic map has more complex chaotic behaviors in another dimensions with respect to 1D logistic map hence, the pseudorandom number sequences generated using 2D logistic map for image encryption are quite random and complex thereby offering greater security and better encryption quality. The proposed scheme adopts a permutation-substitution network offering good confusion and diffusion properties and individual cipher round comprises of three encryption stages viz. Logistic Permutation, Logistic Diffusion and Logistic Transposition, where each results in an image cipher. The initial condition and system parameter of logistic map serve as the cipher key. The security features discussed above demonstrate that the proposed cryptosystem is secure against known cryptographic attacks. The cipher key is 256 bits long, big enough to resist brute force attack. The entropy test indicates that information leakage is negligible. The encrypted image histogram is uniform and analysis of its correlation coefficient values indicates that the adjacent pixels are nearly unrelated. The individual correlation coefficient values are smaller compared with the available literatures. Thus this scheme is secure against
Original Image Horizontal Vertical Diagonal
Encrypted Image Horizontal Vertical Diagonal
Figure-5 Correlation in 5000 randomly selected adjacent pixels in original and encrypted images.
GVIP Journal, ISSN 1687-398X, Volume 14, Issue 1, August 2014
7

statistical attack. The NPCR and UACI scores were used to measure the performance of algorithm against differential attack which suggests that it is secure against differential attack. From Table-4, it is clear that NPCR
and UACI values of the proposed algorithm are better compared to previous works. Thus, the proposed algorithm is ideal for image encryption.
Table -4 NPCR and UACI values for Encrypted Images
References [1] D. R. Stinson, Cryptography: theory and practice,
2006, Chapman and Hall CRC Press, USA. [2] E.Corrochano, Y. Mao and G. Chen, Chaos-based
image encryption, Handbook of Geometric Computing, pp. 231-265, 2005
[3] R. Matthews, On the derivation of a chaotic encryption algorithm, Cryptologia, 1989, vol.13, pp.29–42.
[4] J Fridrich, Symmetric ciphers based on two-dimensional chaotic maps, International Journal of Bifurcation and Chaos,1998, vol. 8(6), pp.1259 – 1284.
[5] J. Scharinger, Fast encryption of image data using chaotic Kolmogorov flows, Journal of Electronic Imaging 1998, vol. 7(2), pp.318 – 325.
[6] CP Wu and CCJ Kuo, Fast encryption methods for audiovisual data confidentiality, Proc SPIE, 2000, pp.284 – 295.
[7] T.Uehara, R. Safavi-Naini and P.Ogunbona, Securing wavelet compression with random permutations, 1st IEEE Pacific Rim Conference on Multimedia, Australia, pp.332 – 335, 2000
[8] SJ Li, X. Zheng, X. Mou, Y Cai, Chaotic encryption scheme for real-time digital video, Proc SPIE on Electronic Imaging, San Jose CA, pp.149 – 160, 2002
[9] G. Chen, Y. Mao, and C. K. Chui, A symmetric image encryption scheme based on 3d chaotic cat maps, Chaos, Solitons & Fractals, 2004, pp.749-761.
[10] Z.-H. Guan, F. Huang, and W. Guan, Chaos-based image encryption algorithm, Physics Letters A , 2005, vol. 346(1-3), pp. 153–157
[11] H. Gao, Y. Zhang, S. Liang, and D. Li, A New Chaotic Algorithm for Image Encryption, Chaos, Solitons & Fractals, 2006, vol. 29 (2), pp. 393-399.
[12] T. G. Gao and Z. Q. Chen, Image encryption based on a new total shuffling algorithm, Chaos, Solitons & Fractals, 2008, vol. 38(1), pp. 213–220.
[13] G. D. Ye, A chaotic image cryptosystem based on toeplitz and hankel matrices, Imaging Science Journal, 2009,vol. 57(5), pp. 266–273.
[14] D. Chattopadhyay, M. K. Mandal and D. Nandi, Robust Chaotic Image Encryption based on
Perturbation Technique, ICGST – GVIP Journal, 2011, vol.11(2), pp. 41 –50.
[15] X. Huang, G. Ye, and K. Wong, Chaotic Image Encryption Algorithm Based on Circulant Operation, Journal of Abstract and Applied Analysis,2013, pp. 1-8.
[16] A. Skrobek, Cryptanalysis of chaotic stream cipher, Physics Letters A, 2007, vol. 363(1-2), pp. 84-90.
[17] S. Lian, J. Sun, and Z. Wang, Security analysis of a chaos-based image encryption algorithm, Physica A: Statistical Mechanics and its Applications, 2005, vol. 351(2), pp.645-661.
[18] B. Marek, G. Artur, Chaotic and non-chaotic mixed oscillations in a logistic system with delay and heat-integrated tubular chemical reactor, Chaos, Solitons & Fractals, 2002, vol.(14), pp.1749–1756.
[19] S. Strogatz, Nonlinear dynamics and chaos: with applications to physics, biology, chemistry, and engineering, Westview Press, 1994
[20] D. Fournier-Prunaret and R. Lopez-Ruiz, Basin bifurcations in a two-dimensional logistic map, eprint arXiv :nlin/0304059, 2003.
[21] K. Chlouverakis and J. Sprott, A comparison of correlation and lyapunov dimensions, Physica D Nonlinear Phenomena, 2005, pp. 156-164.
[22] H. Kantz, A robust method to estimate the maximal lyapunov exponent of a time series, Physics Letters, 1994, pp.77-87.
[23] A. Menezes, P. Van Oorschot, S. Vanstone, Handbook of Applied cryptography, 1997, Chapman and Hall CRC Press, USA.
[24] P. Fei, S. S. Qiu and L. Min, An Image Encryption Algorithm Based on Mixed chaotic Dynamic Systems and External Keys, IEEE, pp. 1135-1139, 2005.
[25] M.Alam and S.Ahmed, A New Algorithm of Encryption and Decryption of Images Using Chaotic Mapping, International Journal on Computer Science and Engineering, 2009, pp.46-50.
[26] Z. Yong, Image Encryption with Logistic Map and Cheat Image, IEEE, 2011, pp. 97-101.
[27] LH Zhang, XF Liao and XB Wang, An image encryption approach based on chaotic maps, Chaos, Solitons & Fractals, 2005, pp. 759–765.
Encryption Method Image Name NPCR (%) UACI (%) Proposed Cameraman 99.67 33.62 Proposed Elaine 99.65 33.65 Proposed Gold hill 99.67 33.56 Proposed Pepper 99.68 33.57 Proposed Lena 99.62 33.61 Chattopadhyay et al., [14] Lena 99.62 28.33 Alam et al., [25] Lena 99.62 33.48 Yong [26] Lena 99.60 33.46 Zhang et al., [27] Lena 99.59 33.33
GVIP Journal, ISSN 1687-398X, Volume 14, Issue 1, August 2014
8

[28] Y Wu, G Yang, H Jin, and P. Noonan, Image Encryption using Two-dimensional Logistic Chaotic Map, SPIE, 2012, pp.1-29.
Biographies
Mr. Gangadhar Tiwari received his B.Sc. degree in Mathematics from Guwahati University in 2006 and his M.Sc. degree in IT from Punjab Technical University, in 2011. Currently he is pursuing PhD at NIT Durgapur, India under the supervision of Dr. Debashis Nandi.
His research interests include Computer Security, Digital Image and Signal Processing. Dr. Debashis Nandi received his
BE degree in Electronics and Communication Engineering from RE College, Durgapur (University of Burdwan), India, in 1994 and M. Tech. Degree from Burdwan University on Microwave Engineering in 1997. He received
his PhD degree from IIT, Kharagpur, India on Medical Imaging Technology. His area of research includes Computer security and cryptography, Secure chaotic communication, Video coding. He is an Associate Professor in the Department of Information Technology, NIT, Durgapur, India.
Mr. Abhishek Kumar received his B.Tech degree in Electrical and Electronics Engineering from Pondicherry University in 2009 and M.Tech degree in Power System Engineering from North Eastern Regional Institute of Science and Technology, India in
the 2012.He is currently working as an Assistant Professor with Department of Electrical & Electronics Engineering, National Institute of Technology, Arunachal Pradesh, India.
Mr. Madhusudhan Mishra has completed his B.Tech in Electronics and Communication Engineering from North Eastern Regional Institute of Science and Technology (NERIST), Nirjuli, Arunachal Pradesh in 2004 and M.Tech in Signal Processing from IIT Guwahati in 2011.
He worked in Sankara Institute of Technology, Kukas, Jaipur for some years and joined NERIST as Assistant Professor in 2006. His main interest of research area includes Digital Signal and Image Processing.
GVIP Journal, ISSN 1687-398X, Volume 14, Issue 1, August 2014
9

GVIP Journal, ISSN 1687-398X, Volume 14, Issue 1, August 2014
10

Non-Invertible Wavelet Domain Watermarking using Hash Function
*Gangadhar Tiwari1, Debashis Nandi 2, Madhusudhan Mishra3
1,2 IT Department, NIT, Durgapur-713209, West Bengal, India, 3ECE Department, NERIST, Nirjuli-791109, Arunachal Pradesh, India,
*[email protected], http://www.nitdgp.ac.in
Abstract This paper proposes a novel watermarking technique by employing Secure Hash Algorithm-2 for generating hash from singular values of high frequency component of wavelet transformed sample image and using it as watermark to protect digital images against invertibility attack. The invertibility attack aims to find a fake watermark and fake original from a watermarked image, to falsely claim the ownership. This scheme performs watermarking and compression simultaneously, by hiding the watermark in wavelet domain and employing arithmetic encoding for compression. Data losses are prevented by performing Histogram modification at both pre and post processing stages. Simulation results indicate that the watermarking scheme is secure against invertibility attack; watermark is recoverable even if the content is altered by geometric attacks, and robust to signal processing distortions. Besides, hiding the watermark in middle bit plane of integer wavelet coefficients and its high frequency sub-bands provides better signal quality while arithmetic encoding results in compressed data. The restored images are distortion free. Keywords: Watermarking, Invertibility Attack, Secure Hash Algorithm-2, Integer Wavelet, Arithmetic Encoding 1. Introduction With the rise of multimedia information systems in networked environment, information security and copyright protection have become a critical issue. Protecting multimedia information is the need of the hour. Digital watermarking seems to be an important tool to achieve this. Watermark is the information about the digital content it intends to protect and needs to be embedded such that it remains detectable at acceptable perceptual quality of the digital content. Many watermarking techniques have been proposed in recent years [1, 2]. The researches in design of these techniques concentrate on achieving perceptual and statistical invisibility and robustness against common signal processing distortions. However, there still exist security concerns with respect to these watermarking schemes.
An eminent case, as discovered by Craver et al, is how to solve the rightful ownership of invisible watermarking schemes [3]. Craver attacked existing watermarking techniques by providing fake watermarking schemes that can be performed on watermarked image resulting in ownership deadlock. This attack is referred as invertibility or ambiguity attack. The development of the studies of non-invertibility indicates that the rightful ownership problem is either not addressed or addressed improperly within current watermarking techniques and hence a stand-alone provably secure non-invertible scheme does not exist. A Non-invertible watermarking scheme is one where it is computationally impossible for an attacker to find a pair of fake image and fake watermark such that the pair can result in the same watermarked image created by the real owner. In this paper, we propose to employ a cryptographically secure one way hash function named Secure Hash Algorithm-2 (SHA-2) to generate 512 bit long hash value from singular values of high frequency component of wavelet transformed sample image and use this hash value as our watermark. The main idea is that if the scheme is invertible, then SHA-2 is not secure, and thus lead to a contradiction. The remainder of the paper is organized as follows: Section-2 provides an overview of multimedia watermarking system. It also discuses non-invertibility property of watermarking schemes, and analyzes state of art on invertibility attacks. Section-3 deals in detail description of our watermarking model. Experimental results are presented in Section-4. A discussion on results and proof of non-invertibility is presented in section-5. This paper ends in Section 6 with conclusion.
2. Digital Watermarking A watermarking system consists of three components viz. Watermark Carrier, Encoder and Decoder. The block diagram of the watermarking system is given in Figure 1. Original image depicts the carrier which needs protection. The watermark encoder embeds the watermark in to the cover image. The watermark key is used to protect the system. Decoder estimates the watermark from the watermarked/distorted watermarked image with the help of watermark key and original image.
GVIP Journal, ISSN 1687-398X, Volume 14, Issue 1, August 2014
11

Figure-1 Digital Watermarking System
2.1 Non-Invertible watermarking Watermarking is an efficient tool for copyright protection. But without a careful design and proper requirements, the attacker can manipulate the watermarked image and claim ownership. Craver et al provided a scenario where an attacker watermarks a watermarked image using any watermarking scheme. Thus the resultant image will have original and attacker’s watermark on it, and hence both the owner and attacker can claim ownership. They indicated that a following scenario is possible: Alice has the original image I and a secret watermark W. She releases the watermarked image IW into the public domain where WII W . Given IW and without
knowing I and W, Bob creates a fake watermark WF and fake original IF, where
WFF IWI (1)
If such a watermark WF is found, Bob can create ownership deadlock by claiming that: (i) IW is watermarked by his watermark WF, and (ii) The image FW WI is the original.
If Equation (1) can be achieved then the scheme is called invertible watermarking otherwise not.
2.1.1 Proving Ownership
Alice has the original image I and a secret watermark W.
She releases the watermarked image WIIW into
the public domain. To prove the ownership of IW, Alice has to show that she knows a pair (K, W), such that W is correctly generated from K and is detectable in IW
2.1.2 Definition of Non-Invertibility
Now we define invertibility and non-invertibility mathematically. Table 1 represents the basic notations of all variables used in the paper. A watermarking scheme (E, D, C) is invertible if for any
watermarked image IW, there exists a mapping 1E such that
'),(
),()(1
WFF
FFW
IWIE
WIIE
(2)
where the construction of 1E is computationally
feasible and FW belongs to the set of allowable
watermarks, 'WI and FI are perceptually similar, i.e.
1),,'( VFW IIC , 'WI and WI are perceptually
similar, and 1),,'( VWW IIC and extracted
watermark ),'( FW IID is similar to FW i.e.
1),),,'(( WFFW WIIDC where C is the
correlation function and is defined as: Given threshold δ, two images or watermarks X, Y are similar if C(X,Y, δ)=1 if c>δ otherwise 0 where c(X,Y) is correlation function of X and Y[3, 4]. If Equation (2) is achieved the scheme is invertible otherwise not.
Symbol Meaning
I Original Image
W Original Watermark
IW Watermarked Image
IF Fake Original Image
W’ Extracted Watermark
WF Attacker’s Watermark
E Watermark Embedding Function E(I,W)=IW
D Watermark Detection Function D(IW,I)=W’
C Correlation Function
δ threshold
Table-1 Basic Notations of Variables
2.2 Related Work
As discussed in previous section, Craver et al found invertibility attack and proposed a solution based on secure hash. They suggested to use a one-way hash function to map 1000 bits of the original image I to a bit sequence bi (i=1, 1000) and then use a bit sequence to arbitrate between two different marking functions i.e. if bi=0 then use formula Ii (1+αwi) and if bi=1 then use Ii(1-αwi) where Ii is the ith element of 1000 highest AC coefficients of the original image and wi is the ith bit of the watermark. Thus the main idea is to compute the
Watermark Encoder Attack
Watermark Decoder
Recovered Watermark
Watermark
Original Image
Watermark Key
Watermarked Content
Distorted Watermarked Content
GVIP Journal, ISSN 1687-398X, Volume 14, Issue 1, August 2014
12

watermark or the watermarking-key in a one-way manner from the original work. The attacker needs to invert the one-way hash function for computing the duplicate. Qiao et al) studied invertibility attacks on audio and video objects and give schemes that they claim to be non-invertible. They proposed to make a strict requirement on construction of watermark and binding the watermark to the original image itself which will reduces the possibility of finding fake watermark and fake original [5]. The weaknesses of these results are discussed in some subsequent papers. Ram Kumar et al give an algorithm to break the scheme proposed by Craver et al, as well as an improved scheme [6]. Later Adelsbach et al found that these methods fail when the false-positives rate are high [7, 8]. The first stand-alone provably secure non-invertible scheme with zero knowledge proof for detection algorithm is proposed by Li et al, where valid watermarks are generated by a cryptographically secure pseudo-random generator, and the underlying watermarking scheme is spread-spectrum based [10, 11]. However, this scheme requires a very large watermark dimension, which makes it unpractical. Li et al later proposed a practical secure non-invertible watermarking scheme to reduce the watermark dimension, but the security proof is not appropriate [12]. A formal definition of invertibility attacks pointed out that a scheme cannot be non-invertible if the false-alarm of underlying watermarking scheme is high. Sencar et al proposed to embed multiple watermarks into a work, such that the robustness and perceptual quality of work is not affected, but the false-positive is reduced. In this way, by generating all watermarks using a secure one-way function and requiring all watermarks to be present for the ownership proof, the security of the resulting scheme can be improved [13]. A provably secure non-invertible scheme with the help of a trusted third party is proposed Adelsbach, where valid watermarks are generated and issued by trusted party. The owner with the earliest timestamp is true owner [9]. Hung et al proposed a new method that combines image feature extraction and timestamp technique. This scheme doesn’t modify original image, registers at fair third party, and uses timestamp to prove the real owner. It can distinguish the real owner, by identifying the embedding order of watermark using timestamp [14]. However, employing feature extraction techniques suffers from stability of feature points when attacked and there is trade-off between false alarm probability and miss probability. Hu et al, proposed the method that uses the important features of the original image to construct watermark, without amendment to the images of these features and protects the copyright of image better based on time-stamp and digital signature [15]. The protocol introduces digital certificate, through the extraction of important information in images to generate zero watermark with digital signature and time-stamp as specific information. It includes Diffie-Hellman Protocol for WaterMark(DHWM) which is a cult of watermark and key exchange algorithm, and a Trusted Third Party (TTP). When there is dispute in copyright, TTP can nail down copyright ownership through technical means and Key
exchange. But this scheme requires Copyright Owner (CO) and TTP to apply to Certifying Authority (CA) for certificate inquiries during authentication time that increases the network delay. While the protocol greatly enhances security, it reduces performance. Zhu et al proposed to use an electronic signature algorithm that mingles digital signature, digital watermarking and time stamp such that the timestamp information is added to digital signature data, improving the signature’s security. Further, the signature information can be embedded into the signature image as a watermark, enhancing the signature information hidden. This algorithm not only implements authentication, but also ensures integrity and non-tampering of contract [16]. However, timestamps based techniques for non-invertible watermarking are not suitable since timestamps can be manipulated, increases network delay due to participation of Third party in proving ownership and is insecure against attackers that probe the system. We propose a solution to this in the next section.
3. Proposed Watermarking Model Our watermarking scheme is divided into four parts viz. watermark generation based on Secure Hash Algorithm-2 (SHA-2), watermark embedding in middle bit plane of integer wavelet domain of the cover image, watermark extraction and ownership verification. Block diagram for watermark embedding and extraction is shown in Figure 2 and Figure 3 3.1 Watermark Generation A stricter requirement on choice of watermark and binding it to original image can be a possible solution against invertibility attack, as this will greatly limit the
choice of attacker for finding the watermark FW and
fake original FI . Thus it will be computationally
impossible for the attacker to find the pair FW , FI that
satisfies equation (1), and hence non-invertibility is achieved [4]. In this scheme, watermark generation involves two steps: 1. Choosing the sample image for hashing depends on the relation between energy of singular value of high frequency component of wavelet transformed cover image and sample image, and 2. Hashing the singular values of high frequency component of wavelet transformed chosen image using Secure Hash Function-2 to obtain the watermark.
We discuss each of the above in the following sections along with Singular value decomposition, Integer wavelet transform and Secure Hash Algorithm-2.
3.1.1 Singular Value Decomposition (SVD) It is a powerful tool in linear algebra having numerous applications in digital watermarking and other signal processing domains. If S is a nn matrix, then SVD of matrix S is represented using Equation (3)
'VSUS (3) where U and V are the orthogonal matrices and S is a diagonal matrix. Diagonal elements of S are the singular values and they satisfy the condition as in Equation (4)
),(........)3,3()2,2()1,1( nnssss (4)
GVIP Journal, ISSN 1687-398X, Volume 14, Issue 1, August 2014
13

SVD is extensively used in watermarking because singular values represent intrinsic algebraic properties and large portion of signal energy and the singular values of an image have higher noise immunity [17].
3.1.2 Integer Wavelet Transform (IWT) Wavelet transform (WT) has gained widespread acceptance in digital watermarking and signal processing due to their inherent multi-resolution nature. Watermarking in wavelet domain help us achieve in obtaining the highest possible robustness without losing the transparency [18]. Wavelet-coding schemes are especially suitable for applications where scalability and tolerable degradation are important. The basic idea of wavelet transform is to decompose image into sub-image of different spatial domain and independent frequency district, then transform coefficient of sub-image. After the original image has been transformed, it is decomposed into 4 frequency bands viz.CA, CV,CH and CD where CA band represents low frequency giving approximate details, CH and CV representing middle frequency giving horizontal and vertical details and CD represents high frequency band highlighting diagonal details of the image respectively. During watermarking, we consider eight-bit grayscale images and denote the most significant bit-plane the 8th bit-plane and least significant bit-plane by the 1st bit-plane. Researches suggest that the bias between binary 0s and 1s increase steadily in most significant biplanes, resulting in redundancy, implying that bit can be compressed in one or more than one bit plane to leave space to hide watermark data. To achieve a large bias between 0s and 1s, we then resort to image transforms. Using integer wavelets transform that maps integer to integer avoids rounding error of floating point in mathematical transformation; and its transforming speed is fast and it doesn’t need extra storage cost[19].
3.1.3 Secure Hash Algorithm-2 It produces 512 bits long hash value. It is described in Request For Comments (RFC)-4634 and computed with 64-bit words. It uses different shift amounts and additive constants. The best public cryptanalysis shows attack breaking pre-image resistance for 46 out of 80 rounds of SHA-512.
3.1.4 Choice of Sample Image and Watermark Generation using Hashing Watermark generation is accomplished in following steps: 1. Decompose the cover image and sample image using integer wavelet transform into four frequency bands: CA, CH, CV and CD band. 2. Select CD band of cover images and calculate its singular values. It is observed that singular values lie between 121 and 221. 3. Similarly, calculate the Singular values of CD band of sample image. It is observed that the values lie between 0-200. Table 2 lists maximum and minimum singular values of CD band of the cover and sample images. 4. Select the sample image, if and only if the energy of CD band of its singular values is approximately equal to energy of the singular values of CD band of cover image.
5. Calculate the hash of singular values of CD band of sample image using secure hash algorithm-2. 6. This hash value is written to an image and used as watermark during watermark embedding. Sample image selected for watermark generation in this scheme is preprocessed to have singular values within the range of 0–150. Watermark size is made equal to the size of the CD band.
Image Singular Values Max Min
Airplane 178.93 0.06 Cameraman 221 0 Elaine 198.76 0.15 Lena 182.40 0 Peppers 121 0 Copyright 200 0 Table 2 Singular values of CD band of test images
3.2 Watermark Embedding The key component of watermark embedding scheme includes histogram modification to prevent data losses and Arithmetic encoding based bit plane embedding. In the following section we discuss these in detail.
3.2.1 Histogram Narrowing Watermark embedding in IWT coefficients may lead to data losses i.e. overflow/underflow, which means that after inverse wavelet transform the gray scale values of some pixels in watermarked image may exceed the upper bound (255 for an 8-bit grayscale image) and/or the lower bound (0 for an 8-bit grayscale image). To avoid this, we perform histogram modification, which narrows the histogram from both sides using the algorithm presented by Xuan et al, [20].
3.2.2 Arithmetic Coding based Bit-plane Embedding As discussed earlier image redundancies increase in higher bit-planes, but changes in higher bit-plane results in larger distortion. We select to hide the watermarking data in middle bit plane of IWT domain so that the watermarked image is perceptually similar to original image. Further, we embed data only in the high frequency sub-bands, i.e. CH, CV and CD because it contains the finer details and contributes trivially to the image energy, hence watermark embedding will not affect the perceptual fidelity of cover image. Further, it is observed that watermark inserted in high frequency sub band is robust against image processing distortions like noise addition; intensity manipulation etc. and human visual system fails to differentiate changes made to it. In the chosen bit-plane of the high frequency sub-bands, the arithmetic encoding is chosen to losslessly compress binary data due to its high coding efficiency. The difference between the capacity of sub-bands in the bit plane and amount of compressed data results in accommodation of hidden data imperceptually. The stepwise procedure for watermark embedding in original image is given below: Step1. To avert data losses, necessary pre and post processing using histogram modification is applied to the original image. Step2. Wavelet decomposition up to single level containing 4 sub-bands is achieved by performing Integer
GVIP Journal, ISSN 1687-398X, Volume 14, Issue 1, August 2014
14

Wavelets Transform on original grayscale image. Step3. The watermark is hidden in 5th Bit plane of the Integer Wavelet Domain and its middle and high frequency sub bands. Step4. Binary images from 5th bit plane of middle and high frequency sub bands are created. To do this, the particular sub-bands are converted to 8 bit binary sequence. The binary image is assigned value 2 if the 5th bit is 1 else assigned 1. Step5. Arithmetic Encoding is used for data compression in binary images obtained from CH, CV and CD. Step6. The watermark generated in previous section is used as watermark signal. Step7. The embedding signal contains watermark, header information and compressed data. If embedded bit is 1or (0), then we convert integer wavelet coefficient in CH sub band into 8 bit binary sequence and replace 1or (0) to the 5th bit plane of that binary sequence and convert back to integer. The process is continued till all the embedded bits are hidden in 5th bit plane of CH, CV and CD coefficients. Step8. Access to wavelet coefficient is secret key dependent which keeps hidden data secret even if the algorithm is known to public. The secret key function used here is represented using Equation 5:
sxkky mod10 (5) where k0=1030, k1=289, s is a 256×256 color image, x and y are coordinates of 5th bit plane. Step9. Finally, we compute Inverse integer wavelet transform to reconstruct watermarked image.
3.3.1 Watermark Extraction Watermark extraction is inverse process of watermark embedding. The steps of algorithm are: Step1. Necessary pre-processing is performed over the watermarked image. Step2. Single level integer wavelet transform for watermarked image is performed. Step3. The embedded signal is extracted from 5th bit plane of CH, CV, and CD respectively. To achieve extraction from CH sub-band, each integer wavelet
coefficient in CH is converted into 8 bit binary sequence and if its 5th bit is 1, then embedded bit is 1 else 0.
The code spinet employed is as below:
Algorithm-1 Watermark Extraction Algorithm
index = 1; embedSignal =zeros(size(CH,1)*size(CH,2)+ size(CV,1)*size(CV,2 +size(CD,1)*size(CD,2),1); for i=1 to size(CH,1) for j=1 to size(CH,2) if CH(i,j) ≠-ERROR_NUM binSeq = dec2bin(abs(CH(i,j)),8). if binSeq(BITPLANE_NUMBER) == '1' embedSignal(index,1) = 1; else embed Signal(index,1) = 0; end if index = index + 1; end if end for end for
Similar process is applied to extract the signal from CV and CD. Further steps include: Step1. The binary watermark image is extracted as per the header information. Step2. The binary images of CH, CV and CD are extracted as per the header information. Step3. Original bit sequence is retrieved after decompression using arithmetic decoding. Step4. Watermark is removed and decompressed 5th bit data is inserted into CH, CV and CD sub-bands. Step5. Inverse integer wavelet transform is calculated to reconstruct original gray scale image. Step6. Necessary post processing is done to prevent possible overflow.
3.3.2 Block Diagram The block diagram is given in Figure 2 and Figure 3 below:
Figure-2 Watermark Embedding Algorithm
Secret key
Data to Embed
Compression
Compressed Bit Stream
Watermarked Image
IIWT
Post Processing
Original Image
Pre processing IWT Wavelet Coefficients
Embedding
GVIP Journal, ISSN 1687-398X, Volume 14, Issue 1, August 2014
15

Figure 3 Watermark Extraction Algorithm
3.4 Verification Process The watermark verification is accomplished in three steps: (a) The claimant is required to provide original image, the watermark key and his watermark. The trusted third party can verifies the creation of watermark. If the watermark is verified, we proceed to next step. (b) The trusted third party applies watermark embedding according to our proposed method. Let this watermarked image be IV. (c) The trusted third party compares similarity between IV and IW using Correlation function defined by Equation (6)
1),,( WV IIC (6)
If (6) holds true, ownership is granted to claimant else not. 4. Simulation Results We performed simulation on Matlab R2011a, under Windows 7 professional with dual Core CPU and 4 GB
RAM. The test images of size 512×512×3 from USC SIPI image database (freely available at http://sipi.usc.edu/database) are used. We generate the watermark from hash value of Singular values of high frequency component of wavelet transformed 256 × 256 gray scale DA-IICT logo. A comparison between Bit plane no. vs. Peak Signal to Noise Ratio (PSNR) Value and compression ratio is presented in Figure 4 and Figure 5 and simulation results are presented in Figure 6. The watermarked images were subjected to various attacks to check the robustness of the scheme and results, in terms of standard metrics like PSNR, Mean Structural Similarity Index (MSSIM), Correlation Coefficient (CC) and Euclidean Distance (ED) are listed in Table 3.
Secret key Extracting
Decompression
Compressed Bit Stream
Restored Image
Post Processing
IIWT Watermarked Image
Pre processing IWT Wavelet Coefficients
Watermarked Coefficients
Extracted Data
Figure 4 Bit Plane No. vs. PSNR Value Figure 5 Bit Plane No. vs. Compression Ratio
GVIP Journal, ISSN 1687-398X, Volume 14, Issue 1, August 2014
16

Original Image
(512×512)
Watermarked Image
PSNR value for Attacked Images CC between Embedded & Extracted Watermark
ED
PSNR (in dB)
MSSIM Salt & Pepper Noise
Poisson Noise
Gaussian Noise
Speckle Noise
Airplane 39.80 0.9992 25.62 25.60 26.03 25.01 0.9231 0.1095
Cameraman 38.90 0.9922 25.16 27.35 26.34 25.47 0.9280 0.2141
Elaine 40.68 0.9991 25.28 25.39 26.36 25.27 0.9133 0.1047
Lena 39.85 0.9967 25.50 27.30 26.01 25.65 0.9311 0.0983
Peppers 41.63 0.9993 25.07 28.21 26.90 25.66 0.9411 0.0914
Table 3 Values of Quality Metrics under different Test Conditions
5. Discussion on Result From the simulation results, it is evident that the watermarking scheme satisfies the key requirements of an ideal watermarking system including perceptual quality, robustness and security. Moreover, it is evident from Figure 4 and Figure 5 that embedding the watermark in 5th bit plane helps us achieve better signal quality with good compression ratio. The requirement based analysis is presented as below: 5.1a Perceptual quality: Peak-signal-to-noise ratio (PSNR) and Mean Structural Similarity Index (MSSIM) are used as a metric to check perceptual similarity between original and watermarked image while Correlation coefficient (CC) between recovered and original watermark, is used as a metric for performance evaluation of the scheme. David et al suggested that the acceptable value of PSNR should be between 25dB to 50dB [21]. The higher value represents better signal quality. Similarly, the MSSIM and CC value lies between −1 and +1. The correlation coefficient value from 0.4 to 0.9 indicates significant similarity between two watermarks. Thus, from Table 3, it is evident this scheme is effective and has better perceptual fidelity with respect to existing techniques [18-20]. 5.1b Robustness: In order to measure the robustness of the scheme, watermarked images are distorted. The result after rotation, cropping, shear, median and scaling on watermarked Lena image is presented in Figure 6. The results, in terms of PSNR value, after Salt & Pepper,
Gaussian, Speckle and Poisson Noise addition to watermarked images are listed in Table 3. Thus from Table 3 and Figure 6 it can be concluded that the watermarking scheme is robust to different sets of attacks. 5.1c-Security: Watermark embedding/extraction is based on a secret key function based watermarking key, where access to each wavelet coefficient for embedding and extraction depends on this key. Thus hidden data is kept secret even if the algorithm is published. For a successful attack on the scheme the attacker would be forced to break the secret key. 5.2 Proof of Non-Invertibility In order to prove Non-Invertibility we need to analyze two key steps: (a) Watermark Generation (b) Watermarking Process (a) Watermark Generation: It is evident from literature that watermark needs to be generated from the original in a one-way manner to achieve non-invertibility since the attacker would be forced to break the underlying one-way function [3-6]. In the proposed scheme we compute the watermark using a secure hash algorithm-2. Thus for a successful attack on the proposed scheme the attacker has to break (invert) the secure hash function-2 which is impossible [22]. (b) The watermarking process in our scheme is fixed and the result depends on original image I and watermark W, which is generated by SHA-2 and hence a hash value. Thus applying this scheme to two different images would
(a) Original Image (b) Watermarked Image (c) Restored Image (d) Rotated Image (300)
(e) Cropped Image (f) Sheared Image (g) Median Attacked Image (h) Scaling (256×256)
Figure 6 Simulation Results
GVIP Journal, ISSN 1687-398X, Volume 14, Issue 1, August 2014
17

result in producing two different watermarked images
such that 1),,( WV IIC .
Thus it is evident that this scheme is non-invertible. 6. Conclusion This paper aims to provide a solution for invertibility attack on watermarked images. The proposed scheme generates the watermark using cryptographically secure one way hash function named SHA-2 and thus secure against invertibility attacks. Further, watermark is recovered successfully after the content is altered by geometric attacks, and it is robust to signal processing distortions. Besides, hiding the watermark in Integer wavelet transform that maps integer to integer, provides better signal quality and application of arithmetic encoding provides data compression simultaneously. The application of secret key provides necessary security. Finally, the recovered images are distortion free. References [1] I Cox, M Miller and J Bloom, Digital
Watermarking, 2002, 2nd Edition, Academic Press, San Diego, USA.
[2] C.S. Lu, Multimedia Security: Steganography and Digital Watermarking Techniques for Protection of Intellectual Property, 2005, Idea Group Publishing, 3 Henrietta Street, London
[3] S. Craver, N. Memon, B.L. Yeo, and M.M. Yeung, Resolving rightful ownerships with invisible watermarking techniques: Limitations, attacks, and implications, IEEE Journal on Selected Areas in Communications, 1998, vol16(4), pp. 573–586.
[4] L. Qiao and K. Nahrstedt, Watermarking schemes and protocols for protecting rightful ownerships and customer’s rights, Journal of Visual Communication and Image Representation, 1998, vol 9(3), pp:194–210.
[5] L. Qiao and K. Nahrstedt, Non-invertible watermarking methods for MPEG encoded audio, Proceedings of SPIE, Security and Watermarking of Multimedia Contents, 1998, pp. 194–202.
[6] M. Ram Kumar and A. Akansu, Image watermarks and counterfeit attacks: Some problems and solutions, Symposium on Content Security and Data Hiding in Digital Media, 1999, pp. 102–112.
[7] A. Adelsbach, S. Katzenbeisser, A.R. Sadeghi, On the insecurity of non-invertible watermarking schemes for dispute resolving, International Workshop on Digital Watermarking (IWDW), pp: 374–388, 2003.
[8] A. Adelsbach and A. Sadeghi, Zero-knowledge watermark detection and proof of ownership, 4th Int. Workshop on Info. Hiding, 2000, pp. 273–288.
[9] A. Adelsbach, S. Katzenbeisser and H. Veith, Watermarking schemes provably secure against copy and ambiguity attacks. DRM, 2003, pp. 111–119.
[10] Q. Li and E. Chang, On the possibility of noninvertible watermarking schemes, in Information Hiding Workshop, 2004, vol. 3200 of LNCS, pp: 13–24.
[11] Q. Li and E. Chang, Zero-knowledge watermark detection resistant to ambiguity attacks, ACM Multimedia Security Workshop, 2006.
[12] Q. Li and N. Memon, Practical Security of Non-Invertible Watermarking Schemes, Proc. of IEEE ICIP, San Antonio, Texas, 2007.
[13] H.T. Sencar and N. Memon, Combating ambiguity attacks via selective detection of embedded watermarks, IEEE Transactions on Information Forensics and Security, 2007
[14] H Sun, C Hong and C Chen, A New Approach to Feature-based Copyright Protection of Images, IEEE, 2005
[15] C. Hu and X. Wang, Zero Watermark Protocol Based on Time-stamp and Digital Signature, Information Technology and Applications, IEEE, 2009, vol(3), pp. 193 – 196.
[16] Likun Zhu and Lizhe Zhu, Electronic signature based on digital signature and digital watermarking, 5th International Congress on Image and Signal Processing (CISP), 2012, China, pp.1644 – 1647.
[17] A.K. Gupta and M.S. Raval, A robust and secure watermarking scheme based on singular values replacement, 2012, Sadhana vol 37 (4), pp. 425–440, Indian Academy of Sciences.
[18] S Jadhav and S.Bhalchandra, Insight on using non-Evolutionary Optimization Method to estimate Mixing Matrix for BSS based Digital Image Watermarking, ICGST International Journal on Graphics, Vision and Image Processing, 2011, vol. 11(1), pp.21-27.
[19] G. Xuan, J. Zhu, J. Chen, Y. Q. Shi, Z. Ni and W. Su, Distortion less data hiding based on integer wavelet transform, IEEE Electronics Letter, 2002, pp: 1646-1648.
[20] G. Xuan, Y. Q. Shi and Z. Ni, Lossless data hiding using integer wavelet transform and spread spectrum, IEEE International Workshop on Multimedia Signal Processing, 2004, Italy.
[21] D. Salomon, Data Compression: The Complete Reference (4 Ed.), 2007, Springer. pp.:281.
[22] Federal Information Processing Standards Publication 180-3, Secure Hash Standard, 2008, http://csrc.nist.gov/publications/fips/fips180-3_final.pdf
Biographies
Mr. Gangadhar Tiwari received his B.Sc. degree in Mathematics from Guwahati University in 2006 and his M.Sc. degree in IT from Punjab Technical University, in 2011. Currently he is pursuing PhD at NIT Durgapur, India under the supervision of Dr. Debashis Nandi.
His research interests include Computer Security, Digital Image and Signal Processing.
GVIP Journal, ISSN 1687-398X, Volume 14, Issue 1, August 2014
18
Dr. Debashis Nandi received his BE degree in Electronics and Communication Engineering from RE College, Durgapur (University of Burdwan), India, in 1994 and M. Tech. Degree from Burdwan University on Microwave Engineering in 1997. He received
his PhD degree from IIT, Kharagpur, India on Medical Imaging Technology. His area of research includes Computer security and cryptography, Secure chaotic communication, Video coding. He is an Associate Professor in the Department of Information Technology, NIT, Durgapur, India.
Mr. Madhusudhan Mishra has completed his B.Tech in Electronics and Communication Engineering from North Eastern Regional Institute of Science and Technology (NERIST), Nirjuli, Arunachal Pradesh in 2004 and M.Tech in Signal Processing from IIT Guwahati in 2011.
He worked in Sankara Institute of Technology, Kukas, Jaipur for some years and joined NERIST as Assistant Professor in 2006. His main interest of research area includes Digital Signal and Image Processing.
GVIP Journal, ISSN 1687-398X, Volume 14, Issue 1, August 2014
19

GVIP Journal, ISSN 1687-398X, Volume 14, Issue 1, August 2014
20

Bench Marking Higuchi Fractal for CBIR
Suhas Rautmare, Anjali Bhalchandra A. Tata Consultancy Services, Mumbai B. Govt. College of Engineering, Aurangabad
[suhas.rautmare, asbhalchandra]@gmail.com
Abstract Content Based Image Retrieval (CBIR) has been approached through color, shape, texture and many other approaches. CBIR can also be approached through fractals. Fractal dimension based approach and fractal compression based approach are two variants in this domain. The proposed work implements a fractal dimension based approach supported by morphological operations to enhance the results. The images under consideration are resized to 128x128. Fractals are patterns that exhibit self similarity. The paper discusses Higuchi Fractal dimension (HFD) based approach for CBIR. HFD provides direction dependent and direction independent analysis of the image. To enhance the results, morphological operations have been performed. The main purpose of adopting morphological operations is to extract image components that are useful in the representation and description of the content of image. Morphological operations like fill Holes, clear border object and dilation of the image have been used to enhance the results. A feature vector of the size 256, 128 for columns and 128 for rows, has been used to identify the relevant match of the images through Euclidean distance measure. The paper establishes a bench mark for Higuchi fractal dimension to be used for CBIR. The performance of the proposed system is good enough in comparison with other fractal based systems to be considered as a bench mark for using Higuchi fractal in CBIR process. The results and analysis has been presented for the proposed approach. 1 Keywords: Content Based Image Retrieval (CBIR), Fill Holes, Higuchi Fractal Dimension (HFD), Morphological Operation, Precision, Recall
1 The performance of the proposed system and approach is validated on a system with specifications: Intel Core i3, Windows 7, Mat lab R2012b, RAM 3 GB, Wang database of 1000 images.
1. Introduction Defining criteria for search, feature vectors of the image, bridging the semantic gap between high level contents of the image and representative feature vector and retrieval time are the key challenges to Content Based Image Retrieval. Various approaches to CBIR address these key issues. Image processing and feature vector extraction influence the outcome of CBIR process. The user intention, data scope and query modalities are other variables to be integrated in image retrieval process. In spite of various attempts and research in this field, the wait for a universally acceptable image retrieval system is still on. The mathematical representation of an image and establishing similarity criteria serve as the impetus to conduct further research in this field. Image signature must be extracted out of mathematical formulation to represent significant features of the image. Adaptivity of the signature from image and user perspective shall be the need of a retrieval system. Colour, shape and texture features backed by mathematical fundamentals and associated relations have been extensively used in the research domain for CBIR. Appreciable success has been achieved through these approaches. Each of these approaches has come with its advantages and limitations. Distance measures have a strong influence on the search. Similarity computation can be performed with feature vectors, local features and signatures. However the output of the retrieval system shall be grossly affected if the signature or feature vector is not adequate enough to represent the image. A traditional way of describing objects through Euclidean geometry has to be supplemented with Fractal geometry to define the objects precisely. Mandelbrot defined fractals as: Mathematical and natural fractals are shapes whose roughness and fragmentation neither tend to vanish nor fluctuate up and down, but remain essentially unchanged as one zooms in continually and examination is refined. Fractal dimension is measure of self similarity. Self similarly can be deterministic or statistical. Because of the strong mathematical features, Fractal dimension can be a precise mathematical representation of the image so as to be effectively exploited for CBIR. The paper details out the use of Higuchi fractal dimension and support processes to be used for an image retrieval system. The
GVIP Journal, ISSN 1687-398X, Volume 14, Issue 1, August 2014
21

basic principle of fractal coding consists of the representation of an image by a contractive transform of which the fixed point is close to that of an image. Higuchi algorithm for fractal dimension estimation is based on curve length measurement which can represent the image precisely and effectively.
The remainder of the paper is organized as follows: Section (2) focuses on Literature Survey. System Development has been discussed in Section (3). Performance of the proposed system has been analyzed in Section (4). Section (5) provides the conclusions out of the conducted experimentation.
2. Literature Survey Content Based Image Retrieval (CBIR) has evoked a huge response amongst research scholars and academicians. The emphasis is more on the contents of the image than metadata. The intention is to filter the images based on content to provide better indexing and return accurate results. The query image also holds the key for intended search. Ritendra Datta et al. have analyzed various dimensions of this research field [1] and have listed references that summarize various approaches taken so far. Color, shape, texture, histogram, vector quantization and hybrid approaches for CBIR have yielded appreciable results with associated limitations. Use of clustering, classification and relevance feedback mark the learning techniques for the proposed systems to improve the retrieval efficiency. The authors emphasized the need of a strong mathematical representation of an image so as to have an efficient image retrieval system. Mandal M.K. and Basu A, proposed four statistical indices through histogram of fractal parameters for CBIR. Experimental results on a database of 416 texture images indicated that the proposed technique improved the image retrieval rate significantly [2]. Carlos Gomez et al used Higuchi fractal dimension for the analysis of MEG recordings from Alzheimer’s disease patients [3]. Fractal dimension was used to quantify the signal complexity. Higuchi fractal dimension proved its ability to discriminate the data features. W. Klonovski et al. proposed a new method for assessment of histological images using Higuchi Fractal dimension. Image contour and its complexity were analyzed with success using fractal dimension [4]. Irini Relgin and Branimir Relgin [5] advocated for the use of fractal geometry and multi fractals in analyzing and processing medical data and images. The authors observed that the propose approach tends to extract more relevant information than conventional classical approaches. There is another reference by W Klonovski et al. for the use of Higuchi fractal dimension for medical image data analysis [6]. The researchers used horizontal and vertical landscape of the images to compute fractal dimension. Reduction in computational complexity has been reported. B.S. Raghavendra and D Narayana Dutt proposed a method to compute fractal dimension of discrete time signals in the time domain by modifying box counting technique [7]. The authors validated the estimation accuracy as well as performance of the proposed methodology. The performance of Higuchi fractal dimension was compared to Katz and Sevcik. Liangbin Zhang et al used entropy and fractal coding for image retrieval [8]. The authors
proposed that an image can be characterized by fractal codes. The experimental analysis reflected that the proposed approach was better than other conventional image pixel based approach and reduced the retrieval complexity. Suhas Rautmare and Anjali Bhalchandra recommended Hausdorff fractal based clustering approach for CBIR [9]. Hausdorff fractal dimension has been used as feature vector and the CBIR process was supported by an innovative max cluster size and max distance based clustering approach to yield better results. Experimental results have validated the suggested approach for a reasonable level of precision and recall. In few other proposed CBIR systems, morphological operations have been extensively used to improve the performance of a CBIR system. Erchan Aptoula and Sebastian Lefvre demonstrated the potential of morphological operators for color description of the image [10]. The performance of proposed operators has been compared with its alternatives to prove its worth. Dr H.B. Kekre et al. suggested CBIR based on edge texture of images extracted using morphological operators [11]. CBIR results for block truncation coding supported by morphological operators have been encouraging enough for adoption. Dimo Dimov and Alexander Marinov proposed a geometric morphological method for artifact noise isolation in the image periphery by a contour evolution tree. The objective was to offer a noise free image for CBIR of trademark images [12]. The experimentation resulted in significant improvement and reduction in noise. The results are valid for black and white as well as random images. A lot of experimentation has been carried out with a variety of similarity measures for CBIR. Dyah E Herwindiati and Sani M. Isa suggested that classical distance is generated from arithmetic mean which is vulnerable to masking effect. The authors proposed a vector variance based similarity measure [13]. The proposed measure displayed a robust technique in comparison with other conventional distance measures. Miguel Arevalillo-Herraez et al. analyzed the importance of selecting a distance measure in CBIR and proposed a method by combining various dissimilarity measures. For each similarity function, a probability distribution is built [14]. A composite measure that could yield better results has been proposed and validated. Colour texture features [15] have been a significant influence on successful CBIR. So also region of interest and indexing [16] based CBIR has been recommended by researchers. As discussed in multiple papers, CBIR is vastly influenced by nature of the query, databases in consideration; similarity measure and feature extraction that represents the image. Potential uses of CBIR include photograph archives, art collections, medical diagnosis, crime control, military, science and many others. 3. System Development The block diagram of the proposed Higuchi fractal dimension based CBIR system is given in figure 1. The approach separately scrutinizes CBIR with and without morphological operations. The objective of the proposed approach is to investigate the possibility of using Higuchi Fractal dimension for CBIR and analyze the
GVIP Journal, ISSN 1687-398X, Volume 14, Issue 1, August 2014
22

performance of such a system. The images under consideration are resized to 128x128 for further image processing. The query image is transformed to a gray scale image for contrast enhancing and global consistency. Quality of the digital image is influenced by spatial, spectral, radiometric and time resolution. Hence color to grayscale conversion is recommended and done. The intended operation will perform color to gray scale conversion by expressing gray scale as a continuous, image dependent, piecewise linear mapping of RGB color primaries and their saturation. Contrast magnitude, Contrast polarity and dynamic range of gray scale are aimed at in this operation. The resultant binary image may have some imperfections. Morphological image processing is aimed at removing these imperfections by accounting for the form and structure of the image. Before subjecting the image for computing fractal dimension, morphological operations like fill holes, Clear border object and dilate image operations are performed. Morphological operations are recommended in feature extraction, image segmentation, image sharpening, image filtering and classification. Morphological operations are non linear operations and rely on relative ordering of pixel values. Morphological operations are applied to gray scale images with the assumption that their light transfer functions are unknown and absolute pixel values are of minor interest. The Higuchi fractal dimension is then computed for two dimensions, vertical and horizontal, for the morphologically transformed images. Each fractal dimension is representing fractal dimension of a column or row. Hence a feature vector of size 256 is obtained in the process. The feature database stores precompiled 256 dimension feature vectors representing images in the database. Euclidean distance measure is used to compute similarity between query image and images within database. The matching images are then displayed as retrieved images. The significant operations used in this process are explained below.
3.1 Fill Holes:
Morphological reconstruction has a broad spectrum of practical applications, each characterized by the selection of the marker and mask images. For example, let I denote a gray scale or binary image and suppose that the marker image, F, to be 0 everywhere except on the image border, where it is set to 1-I;
,, ,
(1)
Then,
(2)
H is a binary/gray scale image equal to I with all holes filled. The fill holes operation provides better rendering quality of images objectively as well as subjectively.
3.2 Clear Border Object: Another useful application of reconstruction is removing objects that touch the border of an image. Again, the key task is to select the appropriate marker to achieve the desired effect. It was observed that the clear border object process tends to reduce the overall intensity level in addition to suppressing border structures. Suppose we define the marker image, F, as:
,, ,
(3)
Where I is the original image, then using I as the mask image, the reconstruction, Yields an image, H that contains only the objects touching the border.
(4)
The difference, 1-H contains only the objects from the original image that do not touch the border.
Figure 1: Block Diagram of the Proposed System
GVIP Journal, ISSN 1687-398X, Volume 14, Issue 1, August 2014
23

3.3 Dilate Image: Dilation is an operation that “grows” or “thickens” objects in an image. The specific manner and extent of this thickening is controlled by a shape referred to as structuring element. Structuring element is a binary image or mask that allows defining arbitrary
neighborhood structures. Denoted as ,
^| ( ) z
A B z AB
(5)
Where, ϕ is the empty set and B is the structuring element. In words, the dilation of A by B is the set consisting of all the structuring element origination location where the reflected and translated B overlaps at least one element of A. It is a convention in image
processing to let the first operand of be the image and the second operand be the structuring element, which usually is much smaller than the image. Dilate image operation is intended at pre-processing so as to get appropriate representation of the image details before computing fractal dimension of the image under consideration.
3.4 Higuchi Fractal Dimension: Higuchi Fractal Dimension is a non linear measure used to estimate the dimensional complexity and details of an image. Higuchi method of computation of fractal dimension of the one dimensional vector can be explained as follows. An vector corresponding to row or a column in an image can be represented as y(1), y(2),…., y(N), where N is the total no of element in a vector, from the given vector, k new sub-vectors are constructed and
represented by , each of them is defined as:
, , , … ,
, , …… (6)
Where, m and k are integers, indicating initial index and k as a stepping value respectively.
/ (7)
Where, represents integer part of a.
For each of the sub vector constructed, the average length is computed as,
∑ (8)
Where / represents a normalization factor. The length of the vector L(K) for the index k is computed as the mean of the k values. For m=1,2,…….k. That is
∑ (9)
If L (k) is proportional to k-D, the curve describing the shape of the intensity values in a image corresponding to the vector under processing is fractal-like with the dimension D. Thus, if L(K) is plotted against k, k=1….kmax , on a double logarithmic scale, the points should fall on a straight line with a slope equal to –D. The least-square linear best fitting procedure is applied to
the graph , . The coefficient of linear
regression of the plot of versus is taken
as an estimate of the fractal dimension of the vector. The value of interval used is taken as k=1, 2, 3, 4, and
/ for k larger than 4, where j=11, 12, 13… and [.] denotes Gauss notation. The implemented morphological operations successfully defined the boundaries and skeleton of the images under consideration.
3.5 Euclidean Distance Measure Euclidean distance measure is one of the most common distance measures for establishing similarity between two images. The 256 dimension feature vector in the form of Higuchi fractal dimension is compared with precompiled feature vectors within image database to establish similarity.
(10)
3.6 Peak Signal-to-Noise Ratio (PSNR) Peak Signal-to-Noise Ratio, PSNR, is an image quality metric. It is an engineering term for the ratio between the maximum possible power of a signal and the power of corrupting noise that affects the dependability of its representation. PSNR is the most commonly used to measure the image quality. Mean Square Error is often called as MSE. MSE is used to quantify the difference between values implied by an estimator and the true values of that quantification are being estimated.
∑ ∑ ,
√
4. Performance Analysis The performance of the proposed system has been compared with other proposed systems that work on Hausdorff fractal dimension. Precision and Recall are two widely accepted criteria for assessing performance of CBIR system. Here too, the performance of the proposed system is validated through these two parameters. From the Wang database,
(a) (b)
GVIP Journal, ISSN 1687-398X, Volume 14, Issue 1, August 2014
24

(c) (d)
(e)
Figure 6: Images used for performance analysis.
Figure 7: Retrieved Images for Query Image 1
Figure 8. Retrieved Images for Query Image 2
Figure 9. Retrieved Images for Query Image 3
Figure 10: Retrieved Images for Query Image 4
GVIP Journal, ISSN 1687-398X, Volume 14, Issue 1, August 2014
25

Figure 11: Retrieved Images for Query Image 5
Figure 6, a to e represent sample queries; that same were used for the performance analysis provided in table 4.1, while Figure 7 to 11 and represent the retrieved images for the queries respectively. For the Dinosaur class of images 25 out 30 images belong to the same class. While for the roses class 29 out of 30 belong to the same class and so on. The results are at per with other recommended systems thereby validating Higuchi fractal dimension as an important feature vector for CBIR. Table 4.1 provides comparison of the results obtained for Higuchi Fractal dimension based CBIR with and without morphological operation. For each of the selected category of images, the number of retrieved images increased significantly after image enhancement. The introduction of morphological operations enhanced the estimation of Higuchi Fractal dimension and thereby improved the results. An average precision improved significantly for all the categories of images when image enhancement is implemented through morphological operations. Figure 6 indicates the noted improvement, where Precision is:
.
(11)
Figure 7 registers a significant improvement in Recall for given set of query images after the introduction of morphological operations, where recall is:
.
. (12)
The figures demonstrate the importance of pre processing of images before working out Higuchi fractal dimension.
As expected, morphological operations offer reduction in noise and detailed features for computation of Higuchi fractal dimension. The performance of the proposed system is encouraging enough to further investigate and improve on use of fractal dimension for CBIR.
Table 4.1: Performance of suggested approaches
Image No.
Higuchi Fractal Without
Morphological Operations
Proposed Higuchi Fractal
Hausdorff Fractal
Hausdorff Fractal With
Clustering
1
16
25
11
14
2
27
29
4
3
3
8
22
15
19
4
5
16
1
4
5
5
18
7
6
The following fig. 12 and fig. 13 provides the performance advantage of the proposed algorithm through Higuchi fractal with morphological operations. The Hausdorff fractal uses the binary image for the purpose of feature vector calculation. The performance of Hausdorff fractal is obtained with maxdistnace=0.05 and maxclustersize=1. The figures 7 and 8 representing Precision and Recall for various approaches clearly explain the performance advantage. The performance of HFD with morphological operators is significantly better than the performance obtained with Hausdorff fractal with clustering and other tabled approaches. With the help of this analysis we can say that Higuchi fractal with morphological operations can be efficiently used for the purpose of CBIR process.
Table 4.2 : PSNR values obtained for different morphological operations on a sample query images
Image No.
PSNR Value (dB) Filled Holes image
Border object cleared image
Dilated image
1 11.55 2.08 2.10 2 35.03 24.65 26.26 3 27.74 13.80 14.85 4 32.17 14.12 15.41 5 26.57 10.42 11.22
The Fig. 14 shows the graphical representation for the PSNR values obtained in context of original gray scaled image to the images as an outcome of different morphological operation in order to achieve the performance objective.
GVIP Journal, ISSN 1687-398X, Volume 14, Issue 1, August 2014
26

Figure 12: Comparison depending on Precision
Figure 13: Comparison depending on Recall
Fig. 14: PSNR values for different morphological operation performed on sample query images in Fig.6
GVIP Journal, ISSN 1687-398X, Volume 14, Issue 1, August 2014
27

5. Conclusion Creation of a bench mark and a reference for implementing CBIR through Higuchi Fractal dimension is the major contribution of this research work. The results have validated effective adoption of Higuchi fractal dimension supplemented by morphological operations for CBIR. A significant level of precision and recall has been reached through the adopted process Image enhancement through noise reduction; contrast stretching and edge enhancement has improved the image quality for further operations. Morphological operations like fill holes, Clear border objects and dilation clearly defined the boundaries and skeleton of the images for better precision and recall. The results have justified the use of these morphological operations on the images for CBIR. The suggested approach is simple and does not need computational complexity to extract feature vectors that effectively represent the image. 6. References [1] Ritendra Datta, Dhiraj Joshi, Jia Li, James Z Wang,
Image Retrieval: Ideas, Influences and Trends of the New Age, ACM Computing Surveys, Vol 40 No 2, Article 5 , April 2008.
[2] Mandal M.K., Basu A. Image retrieval based on histogram of fractal parameters, pages 597 – 605. IEEE Transactions, Multimedia 7, 4, 2005.
[3] Carlos Gomez, Angella Mediavilla, Roberto Hornero, Daniel Abasolo, Alberto Fernandez, Use of Higuchi fractal dimension for the analysis of MEG recordings from Alzheimer’s disease patients, pages 306 – 313, Elsevier, ScienceDirect, Medical engineering and Physics 31, 2009.
[4] W. Klonovski, Robert Stepien, Pawel Stepien, Simple fractal method of assessment of histological images for application in medical diagnostics, Nonlinear Biomedical Physics, Vol 4:7, 2010.
[5] Irini S. Reljin, Branimir D. Reljin, Fractal geometry and multifractals in analyzing and processing medical data and images, Archive of Oncology, 2002:10(4), pp–pp 283 – 293, 2002.
[6] W. Klonovski et al., Application of Higuchi’s fractal dimension in analysis of images of Anal Intraepithelial Neoplasia, Elsevier, Chaos, Solutions and Fractals, Vol 48, pages 54 – 60, March 2013.
[7] B.S. Raghavendra, D. Narayana Dutt, Computing Fractal Dimension of Signals using Multi resolution Box counting Method, International Journal of Information and Mathematical Sciences 6:1, pp–pp 50 – 65, 2010.
[8] Liangbin Zhang et al., Image Retrieval Method based on Entropy and Fractal Coding, WSEAS Transaction on Systems, Issue 4 Vol 7, pp–pp 332 – 341, April 2008.
[9] Suhas Rautmare, Anjali Bhalchandra, Fractals Based Clustering for CBIR, International Journal on Computer Science and Engineering, Vol 4 No 6, pp–pp 1007 – 1016, June 2012.
[10] Erchan Aptoula, Sebastian Lefvre, Morphological Description of Color Images for Content Based Image Retrieval, IEEE Transactions on image
processing, Vol 18, No 11, pp–pp 2505 – 2517, November 2009.
[11] Dr H.B. Kekre, Sudeep Thepade Priyadarshini Mukherjee et al., Image Retrieval with shape features extracted using Morphological Operators with BTC, International Journal of Computer Applications, Vol 12, No 3, pp–pp 1 –5, November 2010.
[12] Dimo Dimov, Alexander Marinov, Geometric Morphological Method for Artifact Noise Isolation in the Image Periphery by a Contour evolution Tree, International Conference on Computer Systems and Technologies, CompSysTech, pp–pp 15-1–15-8, 2006.
[13] Dyah E Herwindiati, Sani M Isa, The robust distance for Similarity Measure of Content based Image Retrieval, Proceedings of the World Congress on Engineering 2009 Vol II, WCE 2009, London UK, 2009
[14] Miguel Arevalillo-Herraez, Juan Domingo, Francesk J. Ferri, Combining similarity measures in content based image retrieval, Elsevier, Pattern Recognition Letters 29(2008), pp–pp 2174 – 2181, 2008.
[15] H.B.Kekre, Sudeep D Thepade, Image Retrieval using colour texture features extracted from Walshlet Pyramid, ICGST, International Journal on Graphics, Vision and Image Processing, GVIP, 2010, Volume 10, Issue 1, pp–pp 9 – 18, 2010.
[16] Yung-Gi, Wu, Region of Interest Image Indexing system by DCT and Entropy, ICGST, International Journal on Graphics, Vision and Image Processing, 2006, Volume 6, Issue 4, pp–pp 7 – 16, 2006.
Biographies
Suhas S. Rautmare has received B.E.(Elect and Telecomm) degree from Marathwada University and M. Tech. (EDT) from CEDT. He is currently working with Tata Consultancy Services, Mumbai. He is research scholar at Govt. College of Engineering,
Aurangabad. His areas of interest and research are image processing, information security and automation.
Anjali Bhalchandra has received B.E. (Electronics and Telecom), M.E.(Electronics) and Ph. D. from SGGS College of Engineering and Technology, Maharashtra, India. She is in the field of research and education for last 26 years. Currently she is working as
Professor and Head of the department at Government College of Engineering Aurangabad, MS, India. Her research interests are image and signal processing. She has published research papers in the related areas in national and international journals and publications.
GVIP Journal, ISSN 1687-398X, Volume 14, Issue 1, August 2014
28

Improved Iris Verification System
Basma M.Almezgagi, M. A. Wahby Shalaby and Hesham N. Elmahdy
Faculty of Computers and Information, Cairo University, Egypt. [email protected], [email protected], [email protected]
Abstract Most computer based systems need to be secured. Human iris is a unique identifier for each person which is used widely. Iris recognition is preferable for person verification. Iris verification divided in two phases: the enrollment phase and the testing phase. This paper tackles developing an improved iris verification system using Chinese Academy of Science Institute of Automation (CASIA) iris database. Basma Mohamed Hesham System (BMHS) consists of four main steps, they are; iris and pupil localization/segmentation using a Canny Edge Detection scheme and circular Hough Transform with a novel dynamic-based technique in determining iris radius range, iris normalization (using Daugman’s rubber sheet model), feature extraction/ encoding (using the convolution with log Gabor filter wavelets) and pattern matching (using hamming distance as a matching technique). This proposed dynamic-based technique in determining the iris radius led to improve the iris localization/segmentation level. We compared our system with other iris verification systems. BMHS is evaluated based upon False Acceptance Rate (FAR), False Rejection Rate (FRR) and computational cost required in both open and close set. A comprehensive experimental work shows an improvement in the false rejection rate and reduction in the system computational cost on different types of iris image. 1 Keywords: Localization; biometric identification; pupil. 1. Introduction Currently, industry and academia have a high attention on biometric personal recognition and verification."Who really you are” is the base of working in most biometric systems. The iris is an element in the human body, where it was established at an early stage of human life. The iris does not change for long part of life. Construction and installation of the iris of the eye is not related to genetic factors. Iris of every person is different from the other even if they are twins [1]. Recently, human iris recognition considered as one of the most successful
1 This study has been implemented on Matlab 2012 platform. University of Cairo
methods for human authentication due to its accuracy and effectiveness [2]. In addition, it is tested to be one of the most reliable approaches for automatic personal recognition/verification with high-quality images of the eye acquired in the near-infrared (NIR) wavelengths [3]. Todays, efficient and fast verification systems are the demand of the current area. Verification system means the comparison between the features extracted from the person and the feature template stored in the database. Therefore, only authorized person will be accepted. Iris verification system divided into two phases; the enrollment phase and the testing phase. In the first phase, the authorized person is registered in the system database. A template of features extracted from his/her iris image is stored in the system data base. In the testing phase, anyone from outside the system needs to use to the system must insert his/her eye image. Localization and isolation to the iris from the eye image executed as the first stage. Iris segmentation and eyelash detection executed as the second stage. Segmentation is very important stage because information extracted from an iris image that does not segment successfully will be not effective [4]. Iris normalization and feature extraction are executed. Then matching these features with the claimed identity feature vector stored in database is required. The system decides whether the feature vector of the given person iris similar to the feature vector of the claimed person in databases using one of the matching algorithms. Accordingly, person accepted or rejected. User will be able to access the system if the similarity between the image of the iris and its model stored in databases less than a specific threshold otherwise the user is rejected [5]. Figure 1 illustrates the first four stages of the iris verification system enrollment phase. Iris recognition is more reliable in many usages. In Future Warfare choosing the iris recognition is considered highly efficient and secure technology [6]. There are some characteristics in the human iris make it reliable to determine the identity of the human. Uniqueness and stability are some of these characteristics [7]. However, human iris face some problems such as covering part of the iris area by the eyelids and eyelashes (incomplete iris image) and strong lighting on human eye maybe affect on the iris/pupil
GVIP Journal, ISSN 1687-398X, Volume 14, Issue 1, August 2014
29
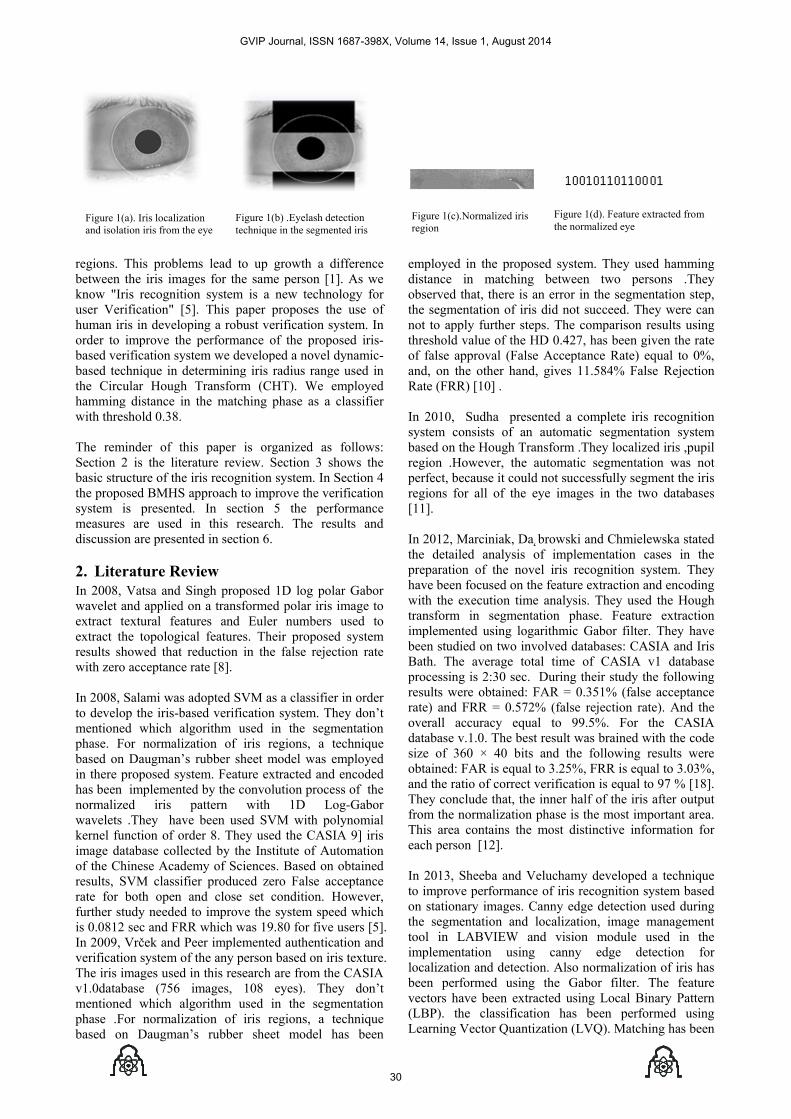
Figure 1(a). Iris localization and isolation iris from the eye
Figure 1(b) .Eyelash detection technique in the segmented iris
Figure 1(d). Feature extracted from the normalized eye
Figure 1(c).Normalized iris region
regions. This problems lead to up growth a difference between the iris images for the same person [1]. As we know "Iris recognition system is a new technology for user Verification" [5]. This paper proposes the use of human iris in developing a robust verification system. In order to improve the performance of the proposed iris-based verification system we developed a novel dynamic-based technique in determining iris radius range used in the Circular Hough Transform (CHT). We employed hamming distance in the matching phase as a classifier with threshold 0.38. The reminder of this paper is organized as follows: Section 2 is the literature review. Section 3 shows the basic structure of the iris recognition system. In Section 4 the proposed BMHS approach to improve the verification system is presented. In section 5 the performance measures are used in this research. The results and discussion are presented in section 6. 2. Literature Review In 2008, Vatsa and Singh proposed 1D log polar Gabor wavelet and applied on a transformed polar iris image to extract textural features and Euler numbers used to extract the topological features. Their proposed system results showed that reduction in the false rejection rate with zero acceptance rate [8]. In 2008, Salami was adopted SVM as a classifier in order to develop the iris-based verification system. They don’t mentioned which algorithm used in the segmentation phase. For normalization of iris regions, a technique based on Daugman’s rubber sheet model was employed in there proposed system. Feature extracted and encoded has been implemented by the convolution process of the normalized iris pattern with 1D Log-Gabor wavelets .They have been used SVM with polynomial kernel function of order 8. They used the CASIA 9] iris image database collected by the Institute of Automation of the Chinese Academy of Sciences. Based on obtained results, SVM classifier produced zero False acceptance rate for both open and close set condition. However, further study needed to improve the system speed which is 0.0812 sec and FRR which was 19.80 for five users [5]. In 2009, Vrček and Peer implemented authentication and verification system of the any person based on iris texture. The iris images used in this research are from the CASIA v1.0database (756 images, 108 eyes). They don’t mentioned which algorithm used in the segmentation phase .For normalization of iris regions, a technique based on Daugman’s rubber sheet model has been
employed in the proposed system. They used hamming distance in matching between two persons .They observed that, there is an error in the segmentation step, the segmentation of iris did not succeed. They were can not to apply further steps. The comparison results using threshold value of the HD 0.427, has been given the rate of false approval (False Acceptance Rate) equal to 0%, and, on the other hand, gives 11.584% False Rejection Rate (FRR) [10] . In 2010, Sudha presented a complete iris recognition system consists of an automatic segmentation system based on the Hough Transform .They localized iris ,pupil region .However, the automatic segmentation was not perfect, because it could not successfully segment the iris regions for all of the eye images in the two databases [11]. In 2012, Marciniak, Da˛browski and Chmielewska stated the detailed analysis of implementation cases in the preparation of the novel iris recognition system. They have been focused on the feature extraction and encoding with the execution time analysis. They used the Hough transform in segmentation phase. Feature extraction implemented using logarithmic Gabor filter. They have been studied on two involved databases: CASIA and Iris Bath. The average total time of CASIA v1 database processing is 2:30 sec. During their study the following results were obtained: FAR = 0.351% (false acceptance rate) and FRR = 0.572% (false rejection rate). And the overall accuracy equal to 99.5%. For the CASIA database v.1.0. The best result was brained with the code size of 360 × 40 bits and the following results were obtained: FAR is equal to 3.25%, FRR is equal to 3.03%, and the ratio of correct verification is equal to 97 % [18]. They conclude that, the inner half of the iris after output from the normalization phase is the most important area. This area contains the most distinctive information for each person [12]. In 2013, Sheeba and Veluchamy developed a technique to improve performance of iris recognition system based on stationary images. Canny edge detection used during the segmentation and localization, image management tool in LABVIEW and vision module used in the implementation using canny edge detection for localization and detection. Also normalization of iris has been performed using the Gabor filter. The feature vectors have been extracted using Local Binary Pattern (LBP). the classification has been performed using Learning Vector Quantization (LVQ). Matching has been
GVIP Journal, ISSN 1687-398X, Volume 14, Issue 1, August 2014
30

performed usystem, they is released bAcademy of classic iris sesystem timeAcceptance Ris 1%, hamm In 2011, Sirdeveloped a nis able to copred spectrumbeen able to visible spectrcan be increin accuracy bexperiments 16213 imageiris segmentaexecution timseconds[14] In 2014, Gapattern featudatabase. Anfeature extra[15]. It is seen researchers ulocalize and of Hough Traby the choiceffects on ththe verificatiiris radius toproposing a iris radius ranenhance the as well the ov 3. Structu3.1 Iris localFigure 2, givimage contairecognition sso on. For thsystem is theand extract localization dsclera. Upperto be detectetwo circles, ointerior to theand eyelasheof the iris algorithms Transform aare the mostto determine such as lineproblem face
using hammin have been usby the InstituSciences. The
et which contae complexity Rate equal to
ming distance u
rlantzis Hoqunovel iris segmpe with noisy m. the propose
cope efficienrum images; a
eased significaby 3%. The neis CASIAv3
es from 411 uation accuracyme for the al.
ale and Salanure extractionnd they analyction methods
from the used Hough segment the iansform in segce of iris radihe correctnession accuracy search for indynamic-basenge. The use oaccuracy of sverall accurac
ure of the Blization/segmves an overviins un useful system, such ahis reason, the e segmentatiothe iris regi
determines thr and lower bed. "The iris rone for the ire first, for the
es normally ocregion"[16]. in the seg
and Daugmant popular algo
the parametees and circleed with the im
ng distance. sed CASIA irute of Autome CASIA V1.0ains 756 imag
is4.295 sec0%, and, the fused with 0.35
uea and Deramentation meimages of vised segmentat
ntly with bothas well as ,theantly with a mear infra red d, the Lamp s
users and CASy on CASIAvlgorithm is ap
nkar studied n on the basiyzed the resus based on CA
literature revTransform iniris and pupil.gmenting iris ius ranges to s of segmente. Instead of
n the segmentaed technique iof such technisegmented iricy of a verifica
Basic Iris Rmentation
iew of the eyparts that not
as the pupil, efirst step of t
on. It exists inion from thee iris region boundaries of tregion can beris/sclera bouniris/pupil bou
cclude the uppSeveral syste
gmentations ’s Integro-dif
orithms .Hougers of simple es, present inmplementation
To evaluateris database w
mation in Chi0 iris databaseges, 108 eyes.c. and the Ffalse rejection5 threshold [1
avi proposed thod. This meible and near ion algorithm
h near infra ede algorithm sminimal redudataset used insubset, whichSIAv1 .the syv1 is 91.97%.pproximately
methods foris of CASIAult of the varASIA iris data
view that mn their system However, theand pupil affesearch for. T
ed iris and heusing fixed r
ation phase win determiningique is expectis which enhaation system.
Recognition
ye texture. Ant important foeyelids, sclerathe iris recognn order to loce eye image.between pupilthe iris are nee approximatendary and anoundary. The eyper and lower ems used se.Circular H
fferential Opegh Transform geometric objn an image. n of the CHT
e the which inese e is a . The False n rate 3].
and ethod infra
m has d and speed ction n our h has ystem The 2.97
r iris A iris
rious abase
many ms to e use ected
These ence, range
we are g the ed to ances
n eye or iris , and
nition calize Iris l and eeded ed by other, yelids parts veral ough
erator used jects, One
T was
that dataone datapixeThe perfiris/pinsteDaualgonot refle
3.2Incopersimagtextuexisfixethe nregitranthesrubbremcoorangl
Figur
3.3In thextrinfostoretwo usedpersfeatuand Wav 3.4Heretwo Ther
it required dabase. Radius
of these reabase, values els, while the p
Hough transformed first, pupil boundaread of the who
ugman’s Inteorithm used fowork accurat
ections.
Fig
Iris normalionsistency mason. In order ging in consiure to fixed
sts to convertd range. Sevenormalizationstration, virtsformation an
se algorithmsber sheet moap each pointrdinates (r,θ) le [0,2π]"[3].
re 3. Daugman's r
Feature encohis stage, the acted from evrmation, whied in the datirises, featur
d against thson extracted. ure extraction
Gaussian fivelet & PCA[1
Feature mate, a decision iris pattern gere are several
different paramrange of iris
equired paraof the iris radpupil radius rasform for the
then the Hry was performole eye regionegro-differentior localizing te on images
gure 2.Texture of
zation aybe exists in
to allow coistencies, trandimension is
t the range oeral systems un. Daugman's tual circles, nd bilinear is .The most odel showed t within the irwhere r is on
rubber sheet mod
oding/ extracmost distinct
very normalizch is called tabase. To allres of the irishe feature o
Many methoby many rese
filter[3], Gab17].
tching can be made
enerated from methods used
meters to be and pupil to
meters. For dius range froanges from 28e iris/sclera bHough transfomed within th
n [3]. ial Operator the iris in eyethat contain n
the human eye
n the images omparisons annsform the ses required. N
of pixel intensiused several arubber sheet m
a polar tinterpolation
common isin Figure 3
is region to a n the interval[
del in the normaliz
ction and unique in
ed iris imagea feature velow compariss encoded in f authorized/
ods have beenearchers. Suchor Wavelet,
to determinethe same/ diff
d for feature m
set for each search for is the CASIA
om 90 to 150 8 to 75 pixels. boundary was orm for the he iris region,
is another e. But it does noise such as
of the same nd overcome egmented iris Normalization ity values to algorithms in model, image to Cartesian are some of
s Daugman's 3. "Daugman
pair of polar [0,1] and θ is
zation process.
nformation is . This unique ctor, will be sons between the database
/unauthorized n proposed to h as Laplacian
Log Gabor
e whether the fferent person. matching such
f
GVIP Journal, ISSN 1687-398X, Volume 14, Issue 1, August 2014
31

as hamming distance, Weighted Euclidean Distance, normalized correlation, Key Nearest Neighbors (KNN),
Support Vector Machine (SVM). .The most common one is the hamming distance. 4. Proposed Model It is known that, the accuracy of the verification / recognition iris based system is highly dependent on the formulation of feature vector. Most important module in formulation iris feature-vector is the iris segmentation level. Since Circular Hough transform (CHT) is the most popular algorithm in iris segmentation systems. CHT with unknown radius range is more accurate. However, it works on a three dimensions and thus consume more computational time to find the circle parameters. In this work, CHT case with less cost (case of known radius) has been selected to segment the eye images. The case of CHT with known radius is required the radius of the circle to be detected in the image to be known. Most previous works that used CASIA database with CHT used 90-150 as a radius range to the human iris. However, the results of segmentation suffer from problems of inaccurate detection as shown in figure 4.
In our proposed approach, a dynamic-based technique in determining the more suitable iris radius range to search for
developed in order to achieve irises that are more accurate as shown in figure 5. In the proposed approach, Circular Hough Transform is employed with modifications in order to improve the number of correctly segmented images. Our segmentation algorithm is based on implementing the circular hough transform with a dynamic range determination technique to detect iris and pupil boundaries exactly, thus for determine the radius and centre coordinates of the pupil and iris regions. Some steps have been implemented in order to identify iris/pupil circles in the Hough Space This steps are: 1) Employ canny filter on the human eye image to
generate a binary image with clear edges. 2) Create a space that contains a cell for each pixel
called accumulator H. 3) Increment all cells according to the circle equation
stated number 1, the incrimination by one each time. That where any circle needs three parameters(x,y,r), This parameters passed through the Hough space to define the circle,
x y r (1)
The x,y are the center coordinate of the circle and r
is the circle radius (this parameters selected based on a dynamic technique determination ).
4) Searching for maximum point in the Hough accumulator, these points is corresponds to the radius and centre coordinates of the circle, best defined by the edge points.
The technique started with a small iris radius rang to minimize the number of circles created in the Hough
Figure 4(A). Segmentation of image 95 (iris radius 90-150)
Figure 4(b). Segmentation of image 46 (iris radius 90-150)
Image Segmentation
Human ID
Segmented correctly Use the dynamic radius range method
Calculate the average iris radius range to search for.
Iris radius range passed through CHT
NO
Yes
Figure 5. A dynamic-based technique in determining the most appropriate iris radius range to search for
GVIP Journal, ISSN 1687-398X, Volume 14, Issue 1, August 2014
32

space (H) and this is expected to minimize the computational time of the segmentation phase. We have been observed that, whenever we change the iris radius range passed through the CHT, the segmented images changed related to the change of ranges.
After more suitable iris radius range is calculated in terms of segmentation accuracy. The proposed iris-based verification system consists of two phases: enrollment phase and testing phase. In the two phases image localization and segmentation, normalization, extraction feature vector are required .In the enrollment phase each person registers to the system database with show his/her identity. A template of bits is stored in the system database. In the testing phase, the system implements sequence steps are: image segmentation, iris normalization, feature extraction, template matching employed to verifying the person identity. In order to evaluate the dynamic method, this work employed automatic iris verification system. Figure 6 shows the structure of our verification system. 4.1 Iris Segmentation Iris segmentation is the most important phase in Iris verification module. This section used Circular Hough Transform (CHT) after employed the dynamic technique. The output of this technique is the most appropriate iris radius rang used through CHT as mentioned earlier. 4.2 Iris Normalization As mentioned in the previous, to overcome the inconsistencies between the iris images, normalization is required. Lighting, difference in distance between the camera and the person eye, all this is possible affect on image dimensions. Iris normalization converts the iris image to fixed dimension image. The normalization process will produce iris regions, which have the same constant dimensions. We employ Daugman’s rubber sheet model. As in Figure 3 ,the circular iris region is
modeled as a flexible rubber sheet, which is expand into a rectangular area with constant dimensions[2].The process of the remapping iris region from (x,y) Cartesian coordinates to the normalized non-concentric polar representation is modeled as[3]:
I x r, ⱷ , y r, ⱷ I x, y 2
where I(x,y) is the segmented iris region, (x,y) are the original Cartesian coordinates, (r,θ) are the corresponding normalized polar coordinates. 4.3 Feature Extraction After we got the iris region and mapped it to normalized image with fixed dimensions .We extracted a template of bits from the normalized iris pattern .The extraction process is convolve the normalized iris pattern with 1D log Gabor filter wavelets. decomposed the 2D normalized image to multiple 1D signal. Each 1D signal convolved with 1 D log Gabor wavelets. Log-Gabor filters are constructed using[3]:
/
2 /. 3
Where fo represents the centre frequency, σ gives bandwidth of the filter [5].The complex valued signals output from the convolution process are phase quantized to four levels using the Daugman method. The feature extraction illustrated in Fig. 7. The output from this level is a template contains values 1 or 0 depending on which quadrant it lies in, called feature vector. The feature vector size is 20*480 (9600) bit. 4.4 Iris Matching Here, after applying and experimenting number of classifiers such as hamming distance, Euclidian distance, SVM, we found the hamming distance is the more accurate one to be using in matching two templates of
Iris segmentation using CHT with the average radius range to search for
Iris Normalization
Feature Extraction
Database Matching
Verified
Not Verified
Human ID
Figure 6.Structure of the Proposed System
GVIP Journal, ISSN 1687-398X, Volume 14, Issue 1, August 2014
33

bits. It was appropriate as it reduced the system computational time and reduced the FRR. Hamming distance (HD), depends on comparing two bit patterns(x,y) .The average hamming distance define as the sum of the exclusive-OR between X and Y over N such N is the total number of bits .The HD constructed using[3]:
∑ 4
If the HD less than 0.38 the person is authorized ,else the person classifed as unauthorized person. 5. Performance Measures In order to measure the decision accuracy of the iris verification system,the performance protocol is defined as follows [21]. Let the stored iris template of a person be represented with T, and the acquired input for recognition be represented with I. Then the null and alternate hypotheses are: H0 = I≠ T, input I is not from the same person as the original template. H1 = I= T, input I is from the same person as the original template. The associated decisions are: D0 the person is not who she/he claims to be. D1 the person is who she/he claims to be. We know from mathematics that, the conditional probability of event A given event B is defined by:
p A|B| ∗
5
In this work, the performance protocol can be measured in terms of: 1) False match rate (FMR) called false acceptance rate (FAR). 2) False non-match rate (FNMR) called false rejection rate (FRR): The False Match Rate and the False Non Match Rate are define as follows:
FMR= P (D1|H0= True) (6) FNMR= P (D0|H1=True) (7)
6. Database and Experimental Methodology
6.1 Iris database The Chinese Academy of Sciences–Institute of Automation (CASIA) eye image database is used in the experiment. CASIA database contains near infrared images and it is the most always used on iris biometric experiments. CASIA Iris Image Database Version 1.0 (CASIA-IrisV1) includes 756 iris images from 108 eyes. For each eye, 7 images are captured in two sessions .To evaluate the effectiveness of the proposed system, a database of 432 grayscale eye images (108 eyes with 4 different images for each eye) was employed. About 400 grayscale eye images with 100 unique eyes are considered as authorized users and others are impostors.The experimental results were conducted on at 3.00GHz core i3 PC with 1GB RAM. 6.2 Evolution strategy Since we have four images to each person(one for testing and three for training) ,we can evaluate the FNMR and FMR based on conditional probability. We have been in the testing 108 images. 100 images are authorized. Eight persons are unauthorized users .We have been tested each authorized and unauthorized users three times in order to verify if this user is the claimed one. User number one matched to three templates, although the other users .We can say that, we have been 100*3 images are the input images of authorized person. When the decision is 1 this means the user is accepted, when the decision is 0 this means the user is rejected. Table 1 is show part of the experimental results. FNMR as mentioned previously can be calculated as the probability of the number of authorized person rejected times the probability of the number of unauthorized person over the probability of the authorized persons. 6.3 Verification result Low FNMR, low FMR and minimum run time are the main objectives of the proposed system in order to achieve both high usability and high security of the system. We have two sets closed set, open set. When
2D normalized iris Decomposed to
1D signal
1D signal
1D signal
1 D log Gabor wavelets
complex valued signals
Convolved with ….
1011010101001001010101010101
output
Phase quantization Output
Iris Template
Figure 7 .The feature extraction process
GVIP Journal, ISSN 1687-398X, Volume 14, Issue 1, August 2014
34

authorized person used other authorized person identity this means the FAR increased in the closed set. When unauthorized person used other authorized person identity this means the FAR increased in the open set. We evaluate our system in the two sets. In the training phase, in the segmentation, we started using Hough Transform with the radius of iris and pupil to search for from 90 to 150 pixels and pupil radius ranges from 28 to 75 pixels, we have obtained that the FRR is 5.78% .Due to the 20% of images Segmented incorrectly as in fig 4(A) and 4(B) to user 46and 95. Then we implement our dynamic-based technique in determining iris radius range. We found 110 to 150 iris radius range to search for is more suitable to give more correct segmented image for some images. This paper shown that, 95-140 is the more suitable radius range to search for. Because only three images from 108 segmented incorrectly .The false rejection rate reduced to be 0.241% with a minimal increasing in the false acceptance by 0.231%. This paper has shown that, the most appropriate iris radius range which give 100%segmentation accuracy to user 46 is from 110- 140 . Figure 8 illustrates the use of CHT in segmenting iris is affected by the choice of iris radius range to search for. These effects on the verification accuracy in terms of the false rejection rate and acceptance rate. In other words whenever the iris radius range change, the FRR and FAR change.
Figure 8.change of FRR,FAR with the change of iris radius range search for
In the matching stage, we tried multiple thresholds (0.35, 0.38, 0.4, 0.41 .., and 0.45). When threshold of 0.35 in hamming distance used the average of FNMR is 22.9% .When the threshold of 0.45 used the FMR will increase dramatically. So this work shown that, the best suitable threshold is 0.38 which give us 0.241 % FNMR. But on the other hand the average of authorized person used other authorized person has a minimal increase by 0.231% in the closed set, as shown in table 1 user 105 used the ID of user 71.Table 1 shows some of the testing
performances of our methodology with hamming distance matching-based authorized user models.
I(In
put)
T(t
empl
ate)
Thr
esho
ld
Dec
isio
n
Clo
sed
set
1_4 1_1 0.38 1
1_4 1_2 0.38 1
1_4 1_3 0.38 1
37_4 37_1 0.38 1 -
37_4 37_2 0.38 0 -
37_4 37_3 0.38 1 -
105_4 105_1 0.38 0 -
105_4 105_2 0.38 0 -
105_4 105_3 0.38 1 71_2
Table 1: subset of the experimental results
The FNMR has been calculated as follows: FNMR number of authorized person rejected )*p(the number of unauthorized person) / p (authorized persons). FNMR= (10/300 * 24/324) / (300/324) which is 0.241. 6.4 Comparison with Existing Methods In terms of Execution Time. Here, in order to display the efficiency of our proposed approach, we have been implemented series of experiments. These experiments exist in order to provide a comparative analysis of our methodology with some previous methods (in terms of recognition accuracy and feature extraction and matching time).The comparative analysis based on CASIA databases. This paper has been provided the computation complexity comparison between the various known methods and the proposed methods. Salami[5] used SVM classifier which produces excellent FMR value for both open and close set condition with increasing in FNMR. Average time of our methodology is less than [5] methodology. Table 2 shows comparison between this work of iris verification with other iris verification system used the same elevation measures protocol.
Iris radius rang (90‐150)
Iris radius rang (95‐140)
FRR 0.5 0.241
FAR 0 0.231
0
0.1
0.2
0.3
0.4
0.5
0.6
ERROR %
The relationship between the radius and error
GVIP Journal, ISSN 1687-398X, Volume 14, Issue 1, August 2014
35

M
etho
dolo
gy
FR
R%
FA
R%
Ave
rage
tim
e (
sec)
Salami [5] 19.5 0 0.0812
Gorazd[9] 7.7 0 -
Vrček [10] 11.584 0
Proposed 0.241 0.231 0.0624
Table 2 comparison between this work of iris verification with other iris verification system used the same elevation measures protocol. Here, we must declare that, resolution of CASIA-V1 image is 320 × 280 pixels, which is equal to the resolution of CASIA-V3 Interval image. The experimental results reported in Ma et al [19] employed on CASIA-V1 database were achieved in a machine of 128M RAM running at 500MHz speed. Our experimental environment is better than Ma’s the experimental results achieved on at core i3 PC with1GB RAM.
Met
hod
Fea
ture
ex
trac
tion
(se
c) M
atch
ing
(s)
Fea
ture
ex
trac
tion
+ M
atch
ing
(s)
Rec
ogn-
ition
ac
cura
cy
Ma et al. [19]
0.2602 0.0087 0.2689 94.90
Ma et al.[20]
0.2442 0.0065 0.2507 95.54
Chen [21] (CASIA-V3 Interval)
0.0896 0.0487 0.1383 99.9
Proposed 0.01299 0.0343 0.04729 98.3
Table 3: computation complexity comparison
We can see that from table 3, our proposed methods have less computational time (in the feature extraction and encoding level) than the other methods reported. 7. Conclusion In this paper, we presented and empirically evaluated a scheme of iris-based verification system. Experimental study using Chinese Academy of Science Institute of Automation (CASIA) database has been carried out to evaluate the effectiveness of BMHS system and compare it to other systems. The main steps of iris verification have been implemented. These steps are; iris and pupil localization/segmentation, iris normalization, feature/ extraction, and pattern matching. In a segmentation level, Circular Hough Transform with a novel dynamic-based technique in determining iris radius range have been developed. It has been shown that, the proposed BMHS approach is able to reduce the false rejection rate to (0.214%) with a minimal increase in the FAR 0.15 % and is able to reduce the system computational time to 0.0624 sec on CASIA iris images. The experimental results and comparison results demonstrate that, our proposed methods can effectively improve the performance of iris verification system with respect to 8. Acknowledgements This research was supported by the Ministry of Higher Education and Scientific Research, Yemen. We are grateful to the Institute of Automation, Chinese Academy of Sciences for allowing us to use their iris image database. We thank the AL-Hikma, AL- national University in Taiz for their cooperation with us. We thank Libor Masek for his open source iris template generation software. 9. References [1] Tomasz Marciniak, Adam Da˛browski, Agata
Chmie- lewska and Agnieszka Anna Krzykowska, "Selection of parameters in iris recognition system, "Multimedia Tools and Applications , vol.68 , no. 1,pp :193-208,Jan2014.
[2] Adam Czajkaand Krzysztof Piech, "Secure Biometric Verification Station Based on Iris Recognition," Journal of Telecommunication and Information Technology,vol. 2012, no. 3, pp : 40 - 49,March 2012.
[3] LiborMasekandPeter Kovesi ,"MATLAB Source Code for a Biometric Identification System Based on Iris Patterns," The School of Computer Science and Software Engineering, The University of Western Australia. 2003.
[4] Bhawnachouhan and shailjashukla," Iris Recognition System using canny edge detection for Biometric Identification,"Interrnational Journal ofEngineering Sciences and Technology (IJEST), vol. 3, no. I, pp: 31 -35 ,Jan 2011.
[5] Hasimah Ali, Momoh J. E. Salami, H. and Wahyudi, “Iris Recognition System by Using Support Vector Machines,” The 7th. International Conference on Computer and Communication Engineering ICCCE,
GVIP Journal, ISSN 1687-398X, Volume 14, Issue 1, August 2014
36

pp: 516-521, Kuala Lumpur, Malaysia, May 13-15, 2008.
[6] N. PRASANTH, "Importance of Iris Recognition against Technology Failure," The International Conference on Advances in Engineering and Technology, Singapore, pp 55-59 ,Singapore, Mar. 29-30, 2014.
[7] Ying Chen,Yuanning Liu, XiaodongZhu,Fei He, Hongye Wang and NingDeng,"Efficient Iris Recognition Based on Optimal Subfeature Selection and Weighted Subregion Fusion," Scientific World Journal, vol. 2014,no. 1, pp: 1-19 , 2014.
[8] M.Vatsa, R. Singh, and A. Noore" Reducing the False Rejection Rate of Iris Recognition Using Textural and Topological Features,"World Academy of Science, Engineering and Technology ,vol.2, no.2,pp:1045-1051,2008.
[9] CASIA Iris image Databases , http://www.cbsr.ia.ac.cn/IrisDatabase.htm, Last vist Mar 6, 2014.
[10] Gorazd Vrček, and Peter Peer, "Iris-based human verification system," The 16th. International Conference of Systems,Signals and Image Processing, pp : 1-4 , Chalkida, Greece, Jun. 18-20, 2009.
[11] Sudha Gupta ,"Iris Recognition System using Biometric Template Matching Technology," International Journal of Computer Applications , vol. 1, no. 2,pp :1 - 4,2010.
[12] Tomasz Marciniak,Adam Da˛browski,AgataChmie- lewska andAgnieszka Anna Krzykowska,"Selection ofparameters in iris recognition system,"Multimedia Tools and Applications , vol.68 , no. 1,pp :193-208,Jan2012.
[13] Sheeba Jeya Sophia S. and Veluchamy S. ,"Security System based on Iris Recognition", Research journal of Engineering science ,Vol .2 ,PP:16-21 ,March 2013 .
[14] Radu,P. ,Sirlantzis,K. ,Howells,W.G.J. ,Hoque,S. and Deravi, "A Versatile Iris Segmentation Algorithm", BIOSIG Conference on Biometrics and Security, pp : 137-149, Darmstadt, Germany, Sep. 8-9, 2011.
[15] Ms . Aparna G. Gale and DR. S. S. Salankar ,"A Review On Advance Methods Of Feature Extraction In Iris Recognition System," The International Conference on Advances in Engineering and Technology, pp 65-70, Singapore, Mar. 29-30, 2014.
[16] K. Aishwarya Raghavi , M. Vishnu Priya, G. Prowino Madonna Paiva, and Saranya Mohan," HUMAN IRIS RECOGNITION USING FUZZY NEURAL CONCEPTS," The International Conference on Bioscience, Biochemistry and Bioinformatics (IPCBEE), vol. 5, pp : 256-260, Feb. 26-28, 2011.
[17] Pravin S. Patil,"The Comparison of Iris Recognition using Principal Component Analysis, Log Gabor and Gabor Wavelets”, International Journal of Computer Applications (0975 – 8887),vol. 43, no.1,April 2012.
[18] L. Ma, T. Tan, Y. Wang, and D. Zhang, “Personal identification based on iris texture analysis,” IEEE
Transactions on Pattern Analysis and Machine Intelligence, vol. 25, no. 12, pp. 1519–1533, 2003.
[19] L.Ma, T. Tan, Y.Wang, and D. Zhang, “Efficient iris recognition by characterizing key local variations,” IEEE Transactions on Image Processing, vol. 13, no. 6, pp. 739–750, 2004.
[20] Ying Chen, Yuanning Liu, XiaodongZhu,Fei He, Hongye Wang and NingDeng,"Efficient Iris Recognition Based on Optimal Subfeature Selection and Weighted Subregion Fusion," Scientific World Journal, vol. 2014,no. 1, pp: 1-19 , 2014.
[21] Davide Maltoni, Dario Maio, Anil K. Jain, and Salil Prabhakar, Handbook of Fingerprint Recognition. New York: Springer-Verlag, 2009.
Biographies
Prof. Dr. Hesham N. Elmahdy received his B.Sc. in Automobile Engineering (with honor degree) in the Military Technical Collage, Cairo in 1981. He received his first M. Sc. in Computer Science in the Institute of Statistical Studies and Researches, Cairo University,
Cairo in 1992. He received his second M. Sc. in Computer Science in the University of Mississippiin August 1996. He received his Ph. D. in Computer Science in the University of Mississippi in December 1997. He has been a professor in the Information Technology Department, Faculty of Computers and Information, Cairo University since 2012. His current research interests are Wireless Sensor Networks, eLearning, and Multimedia. Hesham was honored "The Best Professor of Information Technology in Africa" award from The African Education Leadership Awards in Dec, 2012. His name was included many times for his contributions in: the 2006-2007 (9th.) Edition of Who’s Who in Science and Engineering, the Outstanding Scientists of The 21st. Century, Cambridge, UK, 2007, and the 2009 (26th.) Edition of Who's Who in The World. He was selected to be the Professor of the Year in 2011 and in 2012. He was awarded and nominated for many prizes (locally and internationaly).
M. A. Wahby Shalaby received the BS and MS degrees incomputer engineering from Cairo University, Egypt, in 1997 and 2002, respectively, and the PhD degree in electrical and computer engineering from Concordia University, Canada in 2012. He is
currently a full time assistant professor at information technology department, faculty of computers and information, Cairo University. His current research interests include biometrics, image processing, pattern recognition, and computer vision.
GVIP Journal, ISSN 1687-398X, Volume 14, Issue 1, August 2014
37

Basma M. ALmezgagi graduated from Faculty of Computers and Information, Cairo University, Egypt, in 2010 , Information Technology Department. She has been a Teacher Assistant at Taiz University, Faculty of Engineering And Information Technology, Yemen. She is currently pursing her M.Sc. degree in Information Technology. Her current areas of interest are pattern recognition, image processing, neural networks, biometric authentication .
GVIP Journal, ISSN 1687-398X, Volume 14, Issue 1, August 2014
38

Employing Simple Connected Pattern Array Grammar for Generation and
Recognition of Connected Patterns on an Image Neighborhood
1Vishnu Murthy. G, 2V. Vijaya Kumar, 3B.V. Ramana Reddy 1,2Anurag Group of Institutions, Hyderabad, AP,India.
3Mekapati Rajamohan Reddy Institute of Technology and Science, Udayagiri, AP,India. [email protected], [email protected], [email protected]
Abstract One of the significant and crucial factors to characterize, classify and analyze the images is the study and generation of patterns. That is the reason many researchers has concentrated in the ability to represent and describe image patterns for various types of studies on image processing and pattern recognition. The study of syntactic methods of describing pictures has been of interest for researchers. Uniquely Parsable Array Grammar (UPAG) is used efficiently to represent syntactic patterns, if the pattern set is properly described by a UPAG. Array Grammars can be used to represent and recognize connected patterns. It is very difficult to represent all connected patterns (CP) even on a small 3 x 3 neighborhood in a pictorial way. The present paper proposes a new model called Simple Connected Pattern Array Grammar (SCPAG) capable of generating any kind of simple or complex pattern in an image neighborhood. Keywords: Connected patterns, Array grammars, Pictorial representation, Characterization, Classification. 1. Introduction Today string grammars are studied widely in the field of computer science, mathematics and linguistics since they describe various forms of language constructs. The string grammar plays a significant and crucial role in the representation of any language especially in high level languages. Similarly the study of syntactic methods of describing pictures considered as connected, digitized finite arrays in a two-dimensional plane [5] have been of great interest for many researchers. There are two different types of models one, puzzle languages [3, 10] and the other, recognizable picture languages [5, 8, 12, 13]. The former introduced to solve certain problems of tiling, is a type of Rosenfeld model [2]. In the context free case, the generative capacity of puzzle grammars is the same as that of context free array grammars [10] but in the case of basic puzzle grammars consisting of an extension of the right linear rules, the generative power is higher than that of regular array grammars [9]. The
second model was introduced in an attempt to extend the notion of recognizebilty in one dimension to two dimensions. In the one-dimensional case, the notions of languages generated by the right linear (left linear) grammars, languages accepted by finite automata (deterministic or non-deterministic), rational languages, recognizable languages all coincide. The new model of recognizable picture language extends to two dimensions. G Siromoney et. al[11] derived parallel/sequential model capable of generating interesting classes of pictures that do not maintain a fixed proportion. Later rectangular models or rectangular kolam arrays [8] which are more powerful and suited to generating patterns that maintain fixed proportion are also introduced [8]. In order to show growth along the edges and to extend Linden mayer systems [1] to arrays, G Siromoney et. al [6] introduced rectangular and radial L-models [7, 11]. These models compare favorably with kolam models in their generative power, but they are easier to operate. The present paper is organized as follows. The section two deals the role of patterns in image processing. In section three the definition of Isometric Array Grammar (IAG) and UPAG are given. The section four gives the definition of Simple Connected Pattern Array Grammar (SCPAG). The section five presents results and discussion. The section six gives the conclusions.
2. Role of Patterns in Image Processing Image analysis and characterization is widely studied over the last three decades in a variety of applications, including medical imaging, pattern recognition, industrial inspection, age classification, face recognition, texture classification, and texture based image retrieval [4, 14, 15, 16, 17, 18, 19, 21, 22]. A Pattern represents contiguous set of pixels with some tonal and/or regional property and can be described by its average intensity, maximum or minimum intensity, size and shape etc. Texture can be characterized not only by the gray value at a given pixel but also by the gray value ‘pattern’ in a neighborhood surrounding the pixel.
GVIP Journal, ISSN 1687-398X, Volume 14, Issue 1, August 2014
39

Any image can be characterized by simple or complex visual patterns composed of entities or sub patterns that have characteristic that represents slope, size, shape and color etc. Image can also be represented using skeletons based on primitive concepts of morphology [20]. The patterns that are evaluated on local neighborhood called local sub patterns. From these local sub patterns one can measure image properties like lightness, uniformity, coarseness, linearity, randomness and granularity etc. Image patterns are used to recognize familiar objects in an Image Retrieval System (IRS), and also used extensively in the visual interpretation of the image data, image analysis and classification domains.
0,0 0,1 0,2 1,0 1,1 1,2 2,0 2,1 2,2
Figure 1: A 3x 3 neighborhood with pixel locations.
1 0 0 0 1 0 0 0 1 0 0 0 0 1 0 0 1 0 0 1 0 0 1 1 0 0 0 0 0 0 0 0 0 0 0 0
0 0 0 0 0 0 0 0 0 0 0 0
0 1 0 0 1 0 0 1 0 1 1 0 0 0 1 0 1 0 1 0 0 0 0 0
Figure 2: Representation of patterns with one grain component on 3X3 neighborhood by assuming always the centre pixel as 1.
1 1 1 1 1 0 1 1 0 0 1 0 0 1 1 0 1 0 0 0 0 0 0 0 0 0 1
1 1 0 1 1 0 1 1 0 0 1 0 0 1 0 1 1 0 0 1 0 1 0 0 0 0 0
Figure 3: Representation of patterns with three grain components on 3X3 neighborhood by fixing two grain components at locations (0, 0) and (0, 1) and by assuming always the centre pixel as 1. 3. Uniquely Parsable Array Grammar (UPAG) A uniquely Parsable Array Grammar (UPAG) is a sub class of isometric array grammars (IAG) proposed by Yamamoto and Morita to investigate the grammar classes that have efficient recognition algorithms. It is a grammar that satisfies the following condition: for any superposition of right hand sides of any two rewriting rules, the overlapping portions do not match except “context portions”. Because of this condition parsing can be done without backtracking. UPAG has two fold
functions: generating a set of patterns, and giving a deterministic recognition algorithm for it. 3.1 Isometric Array Grammar (IAG) An Isometric Array Grammar (IAG) is a system defined by G = ( N, T, P, S, #), Where N is a finite nonempty set of non terminal symbols, T is a finite nonempty set of terminal symbols (N ∩ T = Φ), S (є N) is a start symbol, # (doesn’t belong to NUT) is a special blank symbol, P is a finite set of rewriting rules of the form α→β, where α and β are words over N U T U {#} and satisfy the following conditions: 1. The shapes of α and β are geometrically identical 2. α contains at least one non terminal symbol. 3. Terminal symbols in α are not rewritten by the rule
α→β. 4. The application of the rule α→β preserves the
connectivity of the host array.
Let G = (N, T, P, S, #) be an IAG. The grammar G is called a uniquely parsable Array Grammar (UPAG) if it satisfies the following conditions: The UPAG condition:
1. The right hand side of each rule in P contains a symbol other than # and S.
2. Let r1= α1→β1 and r2 = α2→β2 be any two rules in P (may be r1 = r2). Superpose β1 and β2 at all possible positions variously translating them. For any superposition of β1 and β2, if all the symbols in overlapping portions of them match, then (a) These overlapping portions are contained in
the context portions of β1 and β2, or (b) The whole β1 and β2 are overlapping and r1
= r2.
The UPAG condition 2(a) requires that if some suffix of the right hand side of r1 matches with some prefix of that of r2, then lefthand sides of r1 and r2 also contain them as a suffix and a prefix, respectively. For example, the following pair of rules, A → bA, AC → Ad satisfies the condition 2(a), while A → bA, EC → Ad does not. The pair of rewriting rules aB → ab, Ca → ca satisfies the UPAG condition, while the following #B → ab, Ca → ca does not. 4.Proposed SCPAG The proposed SCPAG is a sub class of isometric array grammars (IAG) useful to represent patterns in a neighborhood of the image. The present paper after studying the significance of pattern representation and also to avoid and to overcome the tedious process of representing patterns as described in section 2.1, derived a new model of grammar called SCPAG, which is little different from the UPAG. The language of an SCPAG is defined as the set of finite, connected terminal arrays, which are continuous and thus capable of forming connected patterns. The digitized finite arrays in a two-dimensional plane have been of great
GVIP Journal, ISSN 1687-398X, Volume 14, Issue 1, August 2014
40
interest for many researchers. Picture languages generated by array grammars or recognized by array automata have been advocated since the 1970s for problems arising in the framework of pattern recognition and image processing [12]. The language of an array grammar has been defined by many researchers as the set of finite connected terminal arrays, surrounded by #’s, that can be derived by an initial/starting symbol S surrounded by #’s [11]. 4.1. Definition and Properties of SCPAG The proposed SCPAG is a formal model of two dimensional pattern generations in a neighborhood and is defined by a 5-tuple form G = (N, T, P, S, #) where N is a finite nonempty set of non terminal symbols, T is a finite nonempty set of terminal symbols (N ∩ T = Φ), S (є N) is a start symbol, # (doesn’t belong to N U T) is a special blank symbol. P is a finite set of rewriting rules of the form α → β where α and β are words over N U T U {#} and satisfy the following conditions:
1. The shapes of α and β are geometrically identical.
2. α contains at least one non terminal symbol. 3. The proposed SCPAG is not restricted by
common prefixes and suffixes of alternatives as given by rule 2a of UPAG. For example the production A# 1A and #A A0 does not satisfy the UPAG production rule. The proposed SCPAG removes this restriction and generates the connected patterns.
5. Results and Discussion The present paper generates a SCPAG that is capable of generating or deriving any pattern or shape on any neighborhood. The results are shown on a 3x3 neighborhood.
5.1 Generation of Connected Patterns by using the proposed SCPAG
The given SCPAG G1 = ({S, A}, {0, 1}, P, S, #) generates all connected patterns in any 3 x 3 neighborhood is given below. Where S and A are the set of non-terminals, 0,1 are the set of terminals, P is the set of production rules, S is the starting non terminal and # is the special blank symbol. The production rules P of the SCPAG, G1 are given below. S# 1A | 0A S 1 A 0 A # A 1 A 0 A # 1A | 0A |#A A 1 A 0 A # # A 1 A 0 A
# A A 0 1 A 1 0 A A #A A1|A# |1A|0A|A0 A 1|0 The initial form of the image according to SCPAG is
S # # # # # # # #
Derivation 1 (D1): Generation of horizontal line at the top row using the production rules of the above SCPAG –G1. S # # 1 A # 1 1 A
# # # → # # # → # # # →
# # # # # # # # #
Initial form of the 3x3 neighborhood
1 1 1 1 1 1 1 1 1
# # A → # # 0 → # # 0 →
# # # # # A # A 0
1 1 1 1 1 1 1 1 1
# # 0 → A # 0 → 0 A 0 →
A 0 0 0 0 0 A 0 0
1 1 1
0 0 0
0 0 0
Derivation 2(D2): Generation of L shape using the production rules of the above SCPAG –G1.
1 1 1
0 0 1
0 0 1
L Shape.
S # # 1 A # 1 1 A
# # # → # # # → # # # →
# # # # # # # # #
Initial form of the 3x3 neighborhood
GVIP Journal, ISSN 1687-398X, Volume 14, Issue 1, August 2014
41

1 1 1 1 1 1 1 1 1
# # A → # # 1 → # # 1 →
# # # # # A # A 1
1
1 1 1 1 1 1 1 1
# # 1 → A # 1 → 0 A 1
A 0 1 0 0 1 0 0 1 →
1 1 1
0 0 1
0 0 1
Derivation 3(D3): Generation of X shape or two diagonal line shape on a 3x3 neighborhood using SCPAG G1.
1 0 1 0 1 0 1 0 1
X Shape. S # # 1 A # 1 0 A # # # → # # # → # # # →# # # # # # # # # Initial form of the 3x3 neighborhood 1 0 1 1 0 1 1 0 1 # # A → # # 0 → # # 0 →# # # # # A # A 1
1
0 1 1 0 1 1 0 1
# # 0 → A # 0 → 0 A 0 →A 0 1 1 0 1 1 0 1 1 0 1 0 1 0 1 0 1 Derivation 4 (D4): Recognition of the blob shape by the SCPAG G1 is given below
1 1 1
1 1 1
1 1 1
Blob shape
S # # 1 A # 1 1 A
# # # → # # # → # # # →
# # # # # # # # #
Initial form of the 3x3 neighborhood
1 1 1 1 1 1 1 1 1
# # A → # # 1 → # # 1 →
# # # # # A # A 1
1
1 1 1 1 1 1 1 1
# # 1 → A # 1 → 1 A 1
A 1 1 1 1 1 1 0 1 →
1 1 1
1 1 1
1 1 1
5.2 Discussion on the above Derived Sample of Shapes 1. From the above 3 derivations, it is clearly evident that to generate any shape or pattern on 3x3 neighborhood, the proposed SCPAG requires 3x3 =9 derivations. 2. The derived SCPAG G1 can also be extended to generate or derive any pattern or shape on any image neighborhood size. 6.Conclusions The proposed SCPAG attempted and overcome the tedious way of representing the connected patterns in an image neighborhood. Since the same production rules are used to generate any kind of connected pattern no necessity of defining new set of production rules for each kind of pattern in SCPAG. The basic property of SCPAG is, it requires V*W derivations to generate any pattern on a neighborhood of V rows and W columns. The proposed SCPAG is similar to UPAG, but it has eliminated the restrictions of UPAG. The proposed SCPAG is easy to understand as it is more or less similar to Context Free class of string grammars and also easy to derive any kind of connected patterns as it is having less number of production rules. The above proposed SCPAG production rules are also well suited to derive any kind of patterns even on any neighborhood. The proposed work can be extended for deriving patterns of signal processing. Also, a recognizing device may be constructed to recognize SCPAG derived patterns. 7. References [1] A Lindenmayaer, “Mathematical models for
cellular interactions in development”, I and II, J. Theoretical Biol, 18, pp: 280-315, 1968.
[2] A Rosenfeld, “Array Grammar Normal Forms”, Information and Control, 23, pp:173-182, 1973.
GVIP Journal, ISSN 1687-398X, Volume 14, Issue 1, August 2014
42

[3] A. Rosenfeld, “Picture Languages (formal models for picture recognition)”, Academic Press, New York 1979.
[4] B.Eswar Reddy, A. Nagaraja Rao, V.Vijaya kumar, “Texture Classification by simple Patterns on Edge Direction Movements”, International Journal of Computer Science and Network Security, Vol 7,pp. 221-225,Nov-2007.
[5] D. Giammarresi, A Rivestivo, “Recognizable picture languages”, Int. Journal of Pattern Recognition, Artificial Intell. 6,pp: 241-256, 1992.
[6] G Siromoney, R Siromoney and K Krithivasan, “Abstract families of matrices and picture languages”, Computer Graphics and Image Processing, 1, pp: 284- 307, 1972.
[7] G Siromoney, R Siromoney, “Radial Grammars and radial L systems”, Computer Graphics and Image Processing, 4, pp: 361-374, 1975.
[8] G Siromoney, R Siromoney, K Krithivasan, “Picture Languages with array rewriting rules”, Inform. Control 22, elsevier-Volume-22, Issue-5, pp: 447-470, 1973.
[9] K G Subrmanian, R Siromoney, V R Dare, A Saoudi, “Basic Puzzle languages”, Int. Journal of Pattern Recognition, Artificial Intell. 9, pp: 763-775,1995.
[10] M. Nivat, A Saoudi, K G Subramanian, R Siromoney, V R Dare, “Puzzle Grammars and Context free array grammars”, International Journal of Pattern Recognition Artificial Intelligence, 5, pp: 663-676, 1991.
[11] R Siromoney and G Siromoney, “Extended Controlled table arrays”, TR-304, Computer Science Centre, University of Maryland, May, 1974.
[12] R Siromoney, K G Subramanian, V R Dare, D G Thomas, “Some results on Picture Languages”, Pattern Recogniton 32, 295-304, 1999.
[13] R. Siromoney, “Array Languages and Linder mayer systems” – a survey in the book of L. G. Rozenberg, A Salomaa (Eds.) Springer, Berlin, 1985.
[14] U Ravi Babu, V Vijaya Kumar & J Sasi Kiranl, “Texture Analysis and Classification Based on Fuzzy Triangular Grey level Pattern and Run- Length Features”, Global Journal of Computer Science and Technology Graphics & Vision ,Volume 12 Issue 15 Version 1.0 Year 2012 .
[15] U Ravi Babu,V .Vijay kumar B Sujatha,”Texture Classification Based on Texton Features”, International Journal of Image, Graphics and Signal Processing (IJIGSP),Vol.4, No.8, August 2012.
[16] V. Vijaya Kumar, M. Radhika Mani, K. Chandra Sekharan, “Classification of Textures by avoiding Complex Pattern”, Journal of Computer Science, Science publication, 4(2),pp. 133-138, Feb-2008.
[17] V.Vijaya Kumar, A.SriKrishna, B.Raveendra Babu and P.Premchand, “ A Method for error free shape reconctruction”, ICGST-GVIP,Vol-9,Issu-1,Feb-2009.
[18] V.Vijaya Kumar,B. Eswar Reddy, USN Raju, “A Measure of Pattern Trends on Various types of
Preprocessed Textures”, International Journal of Computer Science and Network Security,Vol.7,pp. 253-257,Aug 2007.
[19] V.Vijaya Kumar et.al ,” Texture Classification based on Texton Patterns using on various Grey to Grey level Preprocessing Methods “, International Journal of Signal Processing, Image Processing and Pattern Recognition ,Vol. 6, No. 4, August, 2013.
[20] V.Vijaya Kumar, A.Srikrishna et.al ,"An improved iterative morphological decomposition approach for image skeletonization",ICGST-GVIP,Vol-8,Issu-1,June 2008.
[21] V.Vijaya Kumar, B.Eswar Reddy ,USSN Raju, K.Chandra Sekharan, “An Innovative Technique of Texture Classifiaction and Comparision based on Long Linear Patterns”, Journal of Computer Science, Science publication 3(8), pp.633-638,Aug 2007.
[22] Vakulabharanam Vijaya Kumar, U S N Raju, K Chandra Sekaran, V V Krishna, “A New Method of Texture Classification using various Wavelet Transforms based on Primitive Patterns”, ICGST-GVIP,Vol-08,Issu-2,July-2008..
GVIP Journal, ISSN 1687-398X, Volume 14, Issue 1, August 2014
43

Biographies
Vishnu Murthy. G received his Bachelor’s and Master`s Degree in Computer Science & Engineering. He is having 16 years of Teaching experience and Presently Pursuing Ph.D. in Computer Science & Engineering from the Jawaharlal Nehru
Technological University, Hyderabad under the guidance of Dr. Vakulabharanam Vijaya Kumar. He is heading the Department of CSE at Anurag Group of Institutions (Formerly CVSR College of Engineering), Hyderabad. He is Life Member of ISTE, Member of IEEE Computer Society, CRSI, CSI. His research areas include Computer Vision, Array Grammars, Image Processing, Data Mining and Big Data. He has published 5 papers in international journals and two papers in international conferences.
Dr. Vakulabharanam Vijaya Kumar is working as Professor & Dean in Dept. of CSE & IT at Anurag Group of Institutions,(AGOI)(Autonomous), Hyderabad. He received integrated M.S.Engg, in CSE from USSR in 1989. He received his Ph.D. degree in
Computer Science from Jawaharlal Nehru Technological University (JNTU), Hyderabad, India in 1998 and guided 18 research scholars for Ph.D. He has served JNT University for 13 years as Assistant Professor and Associate Professor. He is also acting as Director for Centre for Advanced Computational Research (CACR) at AGOI, Hyderabad where research scholars across the state are working. He has received best researcher and best teacher award from JNT University, Kakinada, India. His research interests include Image Processing, Pattern Recognition, Digital Water Marking, Cloud Computing and Image Retrieval Systems. He is the life member of CSI, ISCA, ISTE, IE (I), IETE, ACCS, CRSI, IRS and REDCROSS. He published more than 120 research publications till now in various National, International journals and conferences. He has also established and also acted as a Head, Srinivasa Ramanujan Research Forum (SRRF) at GIET, Rajahmundry, India from May 2006 to April 2013 for promoting research and social activities.
Dr. B.V.Ramana Reddy received B.Tech Degree from S. V.University, Tirupati, A.P., India in 1991. He completed M.Tech. in Computer Science from IPGSR, JNT University, Masab Tank, Hyderabad, India in 2002 and received PhD from
JNTUA, Anantapur,A.P., India in 2011. He has more than 20 years of teaching and industrial experience. He is currently working as Professor & Principal, Mekapati Raja Mohan Reddy Institute of Technology & Science, Udayagiri, Nellore, A.P. He is a life member of Indian Science Congress Association. He published more than 15 papers in National and International Journals and conferences.
GVIP Journal, ISSN 1687-398X, Volume 14, Issue 1, August 2014
44

Texture Classification based on Binary Cross Diagonal Shape Descriptor
Texture Matrix (BCDSDTM) 1P.Kiran Kumar Reddy, 2Vakulabharanam Vijaya Kumar, 3B.Eswar Reddy
1RGMCET, Nandyal, AP, India, 2Anurag Group of Institutions, Hyderabad, AP, India 3JNTUA College of Engineering, India.
[email protected], [email protected],[email protected]
Abstract The present paper derived shape descriptors on the binary representation of cross and diagonal approach of texture unit elements [1]. For this the present paper represented the four pixels of each cross and diagonal texture unit elements as a 2x2 grid. On this shape descriptors are evaluated instead of texture units. For each shape descriptor a shape index is provided. Based on this binary cross diagonal shape descriptor texture matrix (BCDSDTM) is derived and on this grey level co-occurrence matrix (GLCM) features are evaluated. The co-occurrence features extracted on BCDSDTM provide complete texture information about the images. The performances of these features are used for classification of textures. Keywords: 2x2grid, Texture Unit Element, GLCM features. 1. Introduction Many researchers in the field of computer vision, graphics, remote sensing, pattern recognition and medical imaging etc contributed a lot and still working in the domain of texture analysis. Texture analysis involves into two problems like: texture classification and recognition based on texture content, segmenting an image into regions, synthesizing of textures, identification of shapes and deriving of significant texture features for efficient image retrieval. Texture classification has been widely studied because of its wide range of applications in many fields like age classification, remote sensing, medical imaging, material inspection etc. The statistical methods like co-occurrence matrix [2], filtering based approaches like gabar filters [3, 4, 5 ], wavelet transforms [6, 7], wavelet domains [8], autoregressive model[10], hidden markov model [11,12] and auto correlation model [13] played a significant role in classifying textures. The classification rates are good in some of
the methods [2, 3 4, 5, 6, 7, 8, 17, 18, 19] as long as the training and test samples are identical or similar orientation. Later rotational invariant classification methods are proposed [9, 10, 11, 12, 13, 14, 15] in the literature. A texture analysis method is designed recently by incorporating the properties of both the GLCM and texture spectrum (TS) [1]. This method [1] derived cross diagonal texture matrix (CDTM) by dividing the texture unit elements (TUE) in to cross and diagonal texture unit elements. The CDTM is a two dimensional matrix with dimensions of 0 to 80 x 0 to 80. The co-occurrence features are extracted from CDTM and it results a good classification rate [1]. The disadvantages of CDTM is its dimension is too large and one can generate 16 different ways of CDTM’s on each image i.e. rotationally not invariant [1]. The present paper derives a matrix by representing shape descriptors on cross and diagonal texture unit elements and thus the proposed method reduces the dimensionality of the matrix and the advantage of shape descriptors is, they are rotationally invariant. The present paper is organized as follows. The section 2 and 3 units describe the fundamental concepts of TU and CDTM. The section 4 presents the formation process of the binary cross diagonal shape descriptor texture matrix (BCDSDTM). The section 5 and 6 presents the results and discussions and conclusions.
2.Texture unit representation
The texture unit (TU) and TS approach was introduced by Wang and Liu [16]. The TU approach played a significant role in texture analysis, segmentation and classification. In TU approach the texture image is decomposed into a set of small, significant and essential units called as Texture Unit. The TUs are evaluated on each 3x3 neighborhood. For this the each of the 8-neighboring pixels gray
GVIP Journal, ISSN 1687-398X, Volume 14, Issue 1, August 2014
45

level value of 3x3 grid is compared with center pixel (Pc).Based on this the neighboring pixel value Pni assumes one of the ternary value {0,1,2} as represented in equation 1 and as shown in figure 1.
Figure 1: Transformation process of texture elements on a 3x3
neighborhood. Ti is the ternary value of the neighboring pixel i obtained from equation 1. The transformation process texture unit elements (TUE) are shown in figure 1.
0 if Pni < Pc Ti = 1 if Pni = Pc (1) 2 if Pni > Pc
Where Pni is the neighboring pixel gray level value and Pc is the center pixel gray level value.
Figure 2: Formation of a TU on 3x3 neighborhood.
This indicates that the TU is represented by eight elements Ti, each of which will have one of the three possible values (0, 1 and 2). The combination of all these 8 pixels elements forms 38=6561 texture units as shown in figure 2. The texture units can be labeled by the equation 2.
∑ ∗ 3 2 In the above equation TU is the TU number and Ti is the ith TUE in the 3x3 neighborhood and 3i is the weight associated with ith element TUE (Ti). The TU weights may ordered differently. The figure 1 shows the ordering of TU clock wise around the center pixel stating from the top left most corner. The frequency of occurrences of TU in an image is called texture spectrum (TS). Several textural features are derived using TS for wide range of applications [4, 5]. 3. Cross diagonal texture unit (CDTU) approach In the literature most of the texture analysis methods based on 3x3 neighboring pixels obtained the texture information by forming a relationship between the center pixel and neighboring pixels. One disadvantage
of this approach is they lead to a huge number of texture units 0 to 38-1 if ternary values are considered otherwise 0 to 28-1 if binary values are considered. To overcome this cross diagonal texture unit (CDTU) is proposed in the literature [3, 4, 5, 7]. Based on the CDTU values CDTM is computed [1]. On the CDTM the grey level co-occurrence matrix (GLCM) features are evaluated for efficient classification [5]. In the CDTM approach the 8-neighboring pixels of a 3x3 window are divided into two sets called diagonal and cross TUE’s. Each TUE set contains four pixels. The diagonal TUE’s consists of pixels Pd1, Pd2, Pd3 and Pd4 and the cross set consists of pixels Pc1, Pc2, Pc3 and Pc4 as shown in figure 3.
Figure 3: Division of texture unit elements (TUE) into diagonal andcross texture unit elements (TUE).
The process of evaluation cross and diagonal TU from the 3x3 neighborhood is shown in figure 4, 5 and 6. From figure 5 and 6 it is evident that both cross and diagonal TU ranges from 0 to 34-1 i.e. 0 to 80. The transformation of CDTM is shown with example in figure 7. The dimension of CDTM ranges from 0 to 80 x 0 to 80.
Figure 4: 3x3 neighborhood.
Figure 5: Cross TU representation for figure 4.
Figure 6: Diagonal TU representation for figure 4.
The elements of cross TU and diagonal TU can be ordered differently. Each of the four elements can have any one of the four weights [1]. This leads to a total of 16(4x4) possible positions or leads to a total
GVIP Journal, ISSN 1687-398X, Volume 14, Issue 1, August 2014
46

of 16 different CDTM’s for each image [1]. This is the one of the disadvantage of CDTM. The proposed shape descriptors on CDTM overcome this and reduce the overall dimension of the matrix into 6x6 (0 to 5 x 0 to 5).
Figure 7: Formation of CDTM from 3x3 neighborhood.
4. Proposed binary cross diagonal shape descriptor texture matrix (BCDSDTM)
The CDTM divided the 3x3 neighborhood into two different blocks of four pixels. The first block contains diagonal and the second block contains corner pixels. To derive the shape descriptors, the present paper considers binary representation of TUE’s instead of ternary as in the case of CDTM. The binary representation of TUE’s is given in equation 3 instead of equation 1. The formation of binary cross and binary diagonal TU from a 3x3 neighborhood is shown in figure 8.
0 if Pni < Pc Ti= (3)
1 if Pni >= Pc The BCDTM reduces the dimension of the matrix to 0 to 15 x 0 to 15. Again the elements of binary cross TU and binary diagonal TU can be ordered into 4 different ways as shown in figure 10 and it leads to 16 different ways of forming BCDTM. To overcome this, shape descriptors are derived on BCDTM.
Figure 8: Formation of binary cross diagonal texture matrix (BCDTM).
Figure 9: Formation of binary cross diagonal shape descriptor texture Matrix (BCDSDTM).
GVIP Journal, ISSN 1687-398X, Volume 14, Issue 1, August 2014
47

In the proposed scheme both the binary cross and binary diagonal texture elements are represented as a 2x2 grid as shown in figure 9.
The advantage of shape descriptors is they don’t depend on relative order of texture unit weights. The relative TU will change depending on the order in which it is represented as shown in figure 10, but shape remains the same.
Figure 10: Four different ways of assigning weights to cross and diagonal TU.
4.1 Derivation of shape descriptors on a 2x2 grid
This section presents shape descriptors and also the indexes that are given to shape descriptors. In the proposed shape descriptors the TU weights can be taken in any order. It results the same shape.
Hole shape (Index 0): The all zero’s on a 2x2 grid represents a hole shape as shown in the figure 11. It gives a TU as zero.
Figure 11: Hole shape on 2x2 grid with index value 0.
Dot shape (Index 1): The TU with 1, 2, 4 and 8 represents a dot shape. The dot shape will have only a single one as shown in figure 12.
Figure 12: The four dot shapes on a 2x2 grid with index value 1.
Horizontal or Vertical line shape (Index 2): The TU 3, 6, 9 and 12 represents a horizontal or vertical line. They contain two adjacent ones as shown in figure 13.
Figure 13: Representation of horizontal and vertical lines on a 2x2 grid with index 2.
Diagonal line shape (Index 3): The other two adjacent one’s with TU values 5 and 10 represents diagonal lines as shown in figure 14.
Figure 14: Representation of diagonal line on a 2x2 grid with index
3.
Triangle shape (Index 4): The three adjacent one’s with TU values 7, 11, 13 and 14 represents triangle shape as shown in figure15.
Figure 15: Representation of triangle shape on a 2x2 grid with index 4.
Blob shape (Index 5): All one’s in a 2x2 grid represents a blob shape with TU 15. This is shown in figure 16.
Figure 16: Representation of blob shape on a 2x2 grid with index 5.
The detailed formation process of BCDSDTM is shown in figure 9. There are only six shape descriptors (0 to 5) on a 2x2 image. Therefore the BCDSDTM dimension is reduced to 6x6. On this BCDSDTM the GLCM feature parameters like contrast, correlation, energy and homogeneity are evaluated as given in equation 4, 5, 6 and 7.
Contrast ∑ P, i j (4)
Correlation ∑ P,μ μ
σ (5)
Energy ∑ ln P , (6)
Homogenity ∑ , (7)
5. Results and discussions To test the efficiency of the proposed BCDSDTM the present paper evaluated GLCM features contrast, correlation, energy and homogeneity on Car, Water and Elephant images collected from Google database with a resolution of 256x256. The images are as shown in figure 17. The algorithm 1 is applied on this figures and showing corresponding classification
GVIP Journal, ISSN 1687-398X, Volume 14, Issue 1, August 2014
48

rates in Table 4 and also represented in the form of bar graph in figure 18.
The Table 1, 2 and 3 gives the GLCM feature values for the BCDSDTM for the Car, Water and Elephant textures respectively. Based on the values of GLCM features a classification algorithm1 is derived as shown below.
Algorithm 1: Texture classification algorithm based on the proposed BCDSDTM approach.
Begin if ( contrast >=1000 && contrast <=3500 ) print (“ Car Texture”); else if ( contrast >=100000 && contrast <=200000 ) print(“ Elephant Texture “); else if ( contrast >200000 && contrast <=700000 ) print(“ Water Texture “); End
Table1: GLCM features derived on BCDSDTM of Car texture.
CONTRAST
CORRELATION ENERGY
HOMOGENIETY
CAR_1 3286.01 -0.052396 0.16872 0.450992
CAR_2 1657.61 -0.000268 0.16398 0.454023
CAR_3 2365.34 -0.036785 0.16465 0.446646
CAR_4 2903.01 -0.057671 0.16446 0.443557
CAR_5 2108.99 -0.034149 0.16704 0.453855
CAR_6 1119.07 -0.034042 0.16778 0.463913
CAR_7 3401.36 -0.036562 0.16814 0.453705
CAR_8 2043.27 -0.020839 0.16512 0.451341
CAR_9 2590 -0.011739 0.16829 0.441602
CAR_10 2974.02 -0.045437 0.16685 0.458956
Table 2: GLCM features derived on BCDSDTM of Water texture.
CONTRAST
CORRE LATION ENERGY
HOMOGENIETY
WAT1 253337.3 0.087 0.16398 0.39179
WAT2 258730.7 0.052 0.16398 0.39181
WAT3 284144.6 0.074 0.16398 0.39207
WAT4 335666.2 0.031 0.16398 0.39303
WAT5 424117.4 -0.014 0.16518 0.39499
WAT6 423158.3 0.005 0.63983 0.39335
WAT7 309816.4 0.06 0.16398 0.39219
WAT8 605308.7 -0.049 0.16398 0.3957
WAT9 543582.9 -0.037 0.16398 0.3947
WAT10 258730.7 0.052 0.16398 0.39181
Table 3: GLCM features derived on BCDSDTM of Elephant texture.
CONTR
AST CORREL
ATION ENER
GY HOMOGENI
ETY
ELE_1 139765.1 0.107 0.164 0.391
ELE_2 145291.8 0.101 0.164 0.393
ELE_3 5082.093 0.098 0.164 0.405
ELE_4 172667.8 0.054 0.164 0.391
ELE_5 154911.7 0.088 0.164 0.392
ELE_6 168842.2 0.084 0.165 0.392
ELE_7 148577.1 0.082 0.164 0.393
ELE_8 141394.9 0.049 0.165 0.392
ELE_9 155797.6 0.062 0.165 0.391
ELE_10 143213.1 0.106 0.164 0.392
Figure 17. Car, Water and Elephant textures.
GVIP Journal, ISSN 1687-398X, Volume 14, Issue 1, August 2014
49
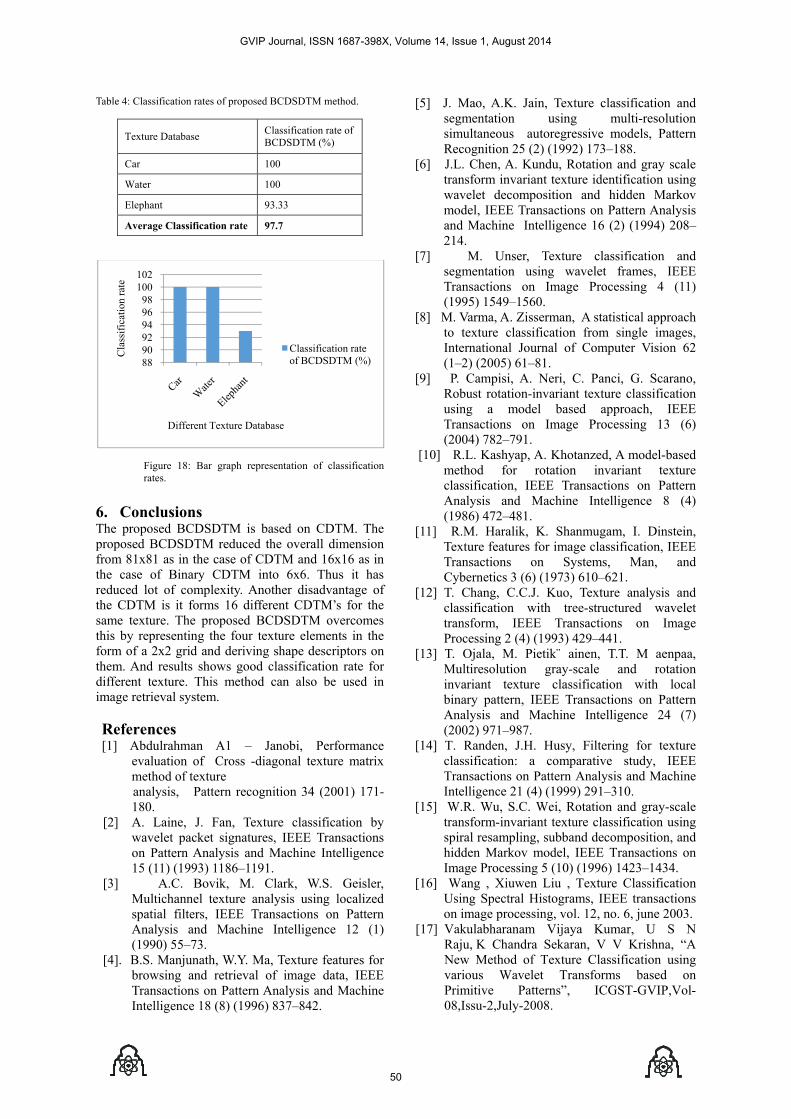
Table 4: Classification rates of proposed BCDSDTM method.
Texture Database Classification rate of BCDSDTM (%)
Car 100
Water 100
Elephant 93.33
Average Classification rate 97.7
Figure 18: Bar graph representation of classification rates.
6. Conclusions The proposed BCDSDTM is based on CDTM. The proposed BCDSDTM reduced the overall dimension from 81x81 as in the case of CDTM and 16x16 as in the case of Binary CDTM into 6x6. Thus it has reduced lot of complexity. Another disadvantage of the CDTM is it forms 16 different CDTM’s for the same texture. The proposed BCDSDTM overcomes this by representing the four texture elements in the form of a 2x2 grid and deriving shape descriptors on them. And results shows good classification rate for different texture. This method can also be used in image retrieval system. References [1] Abdulrahman A1 – Janobi, Performance
evaluation of Cross -diagonal texture matrix method of texture
analysis, Pattern recognition 34 (2001) 171-180.
[2] A. Laine, J. Fan, Texture classification by wavelet packet signatures, IEEE Transactions on Pattern Analysis and Machine Intelligence 15 (11) (1993) 1186–1191.
[3] A.C. Bovik, M. Clark, W.S. Geisler, Multichannel texture analysis using localized spatial filters, IEEE Transactions on Pattern Analysis and Machine Intelligence 12 (1) (1990) 55–73.
[4]. B.S. Manjunath, W.Y. Ma, Texture features for browsing and retrieval of image data, IEEE Transactions on Pattern Analysis and Machine Intelligence 18 (8) (1996) 837–842.
[5] J. Mao, A.K. Jain, Texture classification and segmentation using multi-resolution simultaneous autoregressive models, Pattern Recognition 25 (2) (1992) 173–188.
[6] J.L. Chen, A. Kundu, Rotation and gray scale transform invariant texture identification using wavelet decomposition and hidden Markov model, IEEE Transactions on Pattern Analysis and Machine Intelligence 16 (2) (1994) 208–214.
[7] M. Unser, Texture classification and segmentation using wavelet frames, IEEE Transactions on Image Processing 4 (11) (1995) 1549–1560.
[8] M. Varma, A. Zisserman, A statistical approach to texture classification from single images, International Journal of Computer Vision 62 (1–2) (2005) 61–81.
[9] P. Campisi, A. Neri, C. Panci, G. Scarano, Robust rotation-invariant texture classification using a model based approach, IEEE Transactions on Image Processing 13 (6) (2004) 782–791.
[10] R.L. Kashyap, A. Khotanzed, A model-based method for rotation invariant texture classification, IEEE Transactions on Pattern Analysis and Machine Intelligence 8 (4) (1986) 472–481.
[11] R.M. Haralik, K. Shanmugam, I. Dinstein, Texture features for image classification, IEEE Transactions on Systems, Man, and Cybernetics 3 (6) (1973) 610–621.
[12] T. Chang, C.C.J. Kuo, Texture analysis and classification with tree-structured wavelet transform, IEEE Transactions on Image Processing 2 (4) (1993) 429–441.
[13] T. Ojala, M. Pietik¨ ainen, T.T. M aenpaa, Multiresolution gray-scale and rotation invariant texture classification with local binary pattern, IEEE Transactions on Pattern Analysis and Machine Intelligence 24 (7) (2002) 971–987.
[14] T. Randen, J.H. Husy, Filtering for texture classification: a comparative study, IEEE Transactions on Pattern Analysis and Machine Intelligence 21 (4) (1999) 291–310.
[15] W.R. Wu, S.C. Wei, Rotation and gray-scale transform-invariant texture classification using spiral resampling, subband decomposition, and hidden Markov model, IEEE Transactions on Image Processing 5 (10) (1996) 1423–1434.
[16] Wang , Xiuwen Liu , Texture Classification Using Spectral Histograms, IEEE transactions on image processing, vol. 12, no. 6, june 2003.
[17] Vakulabharanam Vijaya Kumar, U S N Raju, K Chandra Sekaran, V V Krishna, “A New Method of Texture Classification using various Wavelet Transforms based on Primitive Patterns”, ICGST-GVIP,Vol-08,Issu-2,July-2008.
889092949698
100102
Cla
ssif
icat
ion
rate
Different Texture Database
Classification rate of BCDSDTM (%)
GVIP Journal, ISSN 1687-398X, Volume 14, Issue 1, August 2014
50

[18] P.S. Hiremath, Shivashankar,” Texture Classification using Wavelet Packet Decomposition”, ICGST-GVIP,Vol-6,Issu-2,(2006),77-80.
[19] Vakulabharanam Vijaya Kumar , U S N Raju , K Chandra Sekaran and V V Krishna “ Employing Long Linear Patterns for Texture Classification relying on Wavelets”, ICGST-GVIP, Vol-08,Issu-5,(2008) (13-21).
Biographies
P. Kiran Kumar Reddy received his B. Tech and M. Tech degrees in computer science & Engineering from JNT University, Hyderabad, INDIA, in the years 2001 and 2008 respectively. He is pursuing his PhD from JNT University
Anantapuramu, INDIA, under the guidance of Dr V. Vijaya Kumar and Dr B. Eswara Reddy. He is working as an Associate professor in the Department of computer science & Engineering at RGMCET (Autonomous), Nandyal, INDIA. His research interests include Image processing, Pattern recognition and Texture classification.
Dr. Vakulabharanam Vijaya Kumar is working as Professor & Dean in Dept. of CSE & IT at Anurag Group of Institutions,(AGOI)(Autonomous
), Hyderabad. He received integrated M.S.Engg, in CSE from USSR in 1989. He received
his Ph.D. degree in Computer Science from Jawaharlal Nehru Technological University (JNTU), Hyderabad, India in 1998 and guided 18 research scholars for Ph.D. He has served JNT University for 13 years as Assistant Professor and Associate Professor. He is also acting as Director for Centre for Advanced Computational Research (CACR) at AGOI, Hyderabad where research scholars across the state are working. He has received best researcher and best teacher award from JNT University, Kakinada, India. His research interests include Image Processing, Pattern Recognition, Digital Water Marking, Cloud Computing and Image Retrieval Systems. He is the life member of CSI, ISCA, ISTE, IE (I), IETE, ACCS, CRSI, IRS and REDCROSS. He published more than 120 research publications till now in various National, International journals and conferences. He has also established and also acted as a Head, Srinivasa Ramanujan Research Forum (SRRF) at GIET, Rajahmundry, India from May 2006 to April 2013 for promoting research and social activities.
Dr. B. Eswara Reddy Graduated in B.Tech(Computer Science and Engineering) from Sri Krishna Devaraya University in 1995. He received Masters Degree in M.Tech. (Software Engineering) from JNT University, Hyderabad,
in 1999. He received Ph.D in Computer Science & Engineering from JNT University, Hyderabad, in 2008. He served as Assistant Professor from 1996 to 2006 and as Associate Professor from 2006 to 2012. He is working as Professor of CSE Dept., at JNTUA College of Engineering, Anantapuram since 2012 and currently acting as coordinator for Master of Science in Information Technology (MSIT) programme offered at JNTU Anantapuram. He has more than 50 Publications in various International Journals and Conferences. He is one ofthe author’s of the textbooks
GVIP Journal, ISSN 1687-398X, Volume 14, Issue 1, August 2014
51
Recommended


