ISSN: 1524-4636 Copyright © 2009 American Heart Association. All rights reserved. Print ISSN: 1079-5642. Online
7272 Greenville Avenue, Dallas, TX 72514Arteriosclerosis, Thrombosis, and Vascular Biology is published by the American Heart Association.
DOI: 10.1161/ATVBAHA.109.194944 published online Dec 17, 2009; Arterioscler Thromb Vasc Biol
Gerard Pasterkamp Jean-Paul de Vries, Erling Falk, Sai K. Lim, Peter J. van der Spek, Siu Kwan Sze and Schoneveld, Ale Algra, Mat J. Daemen, E. A. Biessen, W. de Jager, Huoming Zhang,Peter de Bruin, Pieter A. Doevendans, Aryan Vink, Louise M. Catanzariti, Arjan H.
Dominique P.V. de Kleijn, Frans L. Moll, Willem E. Hellings, Gonen Ozsarlak-Sozer,Adverse Cardiovascular Events
Local Atherosclerotic Plaques Are a Source of Prognostic Biomarkers for
http://atvb.ahajournals.org/cgi/content/full/ATVBAHA.109.194944/DC1Data Supplement (unedited) at:
http://atvb.ahajournals.org
located on the World Wide Web at: The online version of this article, along with updated information and services, is
http://www.lww.com/reprintsReprints: Information about reprints can be found online at
[email protected]. E-mail:
Fax:Kluwer Health, 351 West Camden Street, Baltimore, MD 21202-2436. Phone: 410-528-4050. Permissions: Permissions & Rights Desk, Lippincott Williams & Wilkins, a division of Wolters
http://atvb.ahajournals.org/subscriptions/Biology is online at Subscriptions: Information about subscribing to Arteriosclerosis, Thrombosis, and Vascular
by on May 19, 2011 atvb.ahajournals.orgDownloaded from

Local Atherosclerotic Plaques Are a Source of PrognosticBiomarkers for Adverse Cardiovascular Events
Dominique P.V. de Kleijn, PhD; Frans L. Moll, MD, PhD; Willem E. Hellings, MD;Gonen Ozsarlak-Sozer, PhD; Peter de Bruin, MD, PhD; Pieter A. Doevendans, MD, PhD;
Aryan Vink, MD, PhD; Louise M. Catanzariti, MSc; Arjan H. Schoneveld, BSc; Ale Algra, MD, PhD;Mat J. Daemen, MD, PhD; E.A. Biessen, PhD; W. de Jager, PhD; Huoming Zhang, PhD;
Jean-Paul de Vries, MD, PhD; Erling Falk, MD, PhD; Sai K. Lim, PhD; Peter J. van der Spek, PhD;Siu Kwan Sze, PhD; Gerard Pasterkamp, MD, PhD
Background—Atherosclerotic cardiovascular disease is a major burden to health care. Because atherosclerosis isconsidered a systemic disease, we hypothesized that one single atherosclerotic plaque contains ample molecularinformation that predicts future cardiovascular events in all vascular territories.
Methods—AtheroExpress is a biobank collecting atherosclerotic lesions during surgery, with a 3-year follow-up. Thecomposite primary outcome encompasses all cardiovascular events and interventions, eg, cardiovascular death,myocardial infarction, stroke, and endovascular interventions. A proteomics search identified osteopontin as a potentialplaque biomarker. Patients undergoing carotid surgery (n�574) served as the cohort in which plaque osteopontin levelswere examined in relation to their outcome during follow-up and was validated in a cohort of patients undergoingfemoral endarterectomy (n�151).
Results—Comparing the highest quartile of carotid plaque osteopontin levels with quartile 1 showed a hazard ratio for theprimary outcome of 3.8 (95% confidence interval, 2.6–5.9). The outcome did not change after adjustment for plaquecharacteristics and traditional risk factors (hazard ratio, 3.5; 95% confidence interval, 2.0–5.9). The femoral validationcohort showed a hazard ratio of 3.8 (95% confidence interval 2.0 to 7.4) comparing osteopontin levels in quartile 4 withquartile 1.
Conclusions—Plaque osteopontin levels in single lesions are predictive for cardiovascular events in other vascularterritories. Local atherosclerotic plaques are a source of prognostic biomarkers with a high predictive value forsecondary manifestations of atherosclerotic disease. (Arterioscler Thromb Vasc Biol. 2010;30:00-00.)
Advanced atherosclerotic cardiovascular disease contin-ues to be a major burden to health care expenditures and
requires exhaustive forms of medical treatment. A pressingneed exists for prognostic biomarkers to identify high-riskpatients for aggressive treatment.
Proteins in the plasma are easily accessible and can serveas a surrogate measure of atherosclerotic disease progression,but existing circulating biomarkers do not provide an accuratevalue of predictive patient risk.1,2 The main focus toward
identifying patients with rapidly progressive advanced ath-erosclerotic disease is based on the known characteristics ofthe vulnerable or recently ruptured plaque with typically alarge lipid core, thin fibrous cap, a high number of inflam-matory cells, and thrombus.3–6 The pathological definition ofthe vulnerable plaque is founded on cross-sectional studies.Subsequently, molecular and cellular features associated withthe vulnerable plaque are considered potential diagnosticimaging markers for plaque rupture and plaque thrombosis.
Received April 29, 2009; revision accepted November 23, 2009.From Experimental Cardiology (D.P.V.d.K., W.E.H., G.O.-S., L.M.C., A.H.S., G.P.), Cardiology, DH&L, UMC Utrecht, the Netherlands;
Interuniversity Cardiology Institute of the Netherlands (D.P.V.d.K., A.H.S.), Utrecht, the Netherlands; Genome Institute of Singapore (D.P.V.d.K.),Singapore; Department of Vascular Surgery (F.L.M., W.E.H.), UMC Utrecht, the Netherlands; Department of Pharmacology (G.O.-S.), Faculty ofPharmacy, Ege University, Izmir, Turkey; Department of Pathology (P.d.B.), St Antonius Hospital, Nieuwegein, the Netherlands; Department. ofCardiology (P.A.D.), DH&L, UMC Utrecht, the Netherlands; Department of Pathology (A.V.), UMC Utrecht, the Netherlands; Julius Center for HealthSciences and Primary Care and Department of Neurology UMC Utrecht (A.A.), the Netherlands; Department of Pathology (M.J.D.), CARIM, UMCMaastricht, the Netherlands; Division of Biopharmaceutics (E.A.B.), Gorlaeus Laboratories, Leiden University, Leiden, the Netherlands and Departmentof Pathology (E.A.B.), MUMC, Maastricht, the Netherlands; Department of Pediatric Immunology (W.d.J.), Wilhelmina Children’s Hospital, UniversityMedical Center Utrecht, Utrecht, the Netherlands; Nanyang Technological University (H.Z., S.K.S.), Singapore; Department of Vascular Surgery(J.-P.d.V.), St Antonius Hospital, Nieuwegein, the Netherlands; Department of Cardiology (E.F.), Aarhus University Hospital, Aarhus, Denmark; Instituteof Medical Biology and Department of Surgery (S.K.L.), Yong Loo Lin School of Medicine, National University of Singapore, Singapore; Departmentof Bioinformatics (P.J.v.d.S.), Erasmus MC, Rotterdam, the Netherlands.
Correspondence to Dominique P.V. de Kleijn and Gerard Pasterkamp, Experimental Cardiology (G02523), UMC, Heidelberglaan 100, 3584 CX,Utrecht, the Netherlands. E-mail [email protected]
© 2009 American Heart Association, Inc.
Arterioscler Thromb Vasc Biol is available at http://atvb.ahajournals.org DOI: 10.1161/ATVBAHA.109.194944
1 by on May 19, 2011 atvb.ahajournals.orgDownloaded from

However, longitudinal studies supporting the predictivepower of these pathological markers have not been executed,and information about the natural history of atheroscleroticdisease is therefore incomplete.
The systemic nature of atherosclerotic disease, however, iswell-established7–9 through histopathologic observationsdemonstrating that inflammation,10 morphology,11 and lipidcontent12 correlate between different arterial segments within1 individual. This gave rise to the hypothesis that localplaques contain molecular information that is predictive foratherothrombotic events in all vascular territories and that thelocal atherosclerotic plaque may act as a source of prognosticbiomarkers that identify the patient at risk.
To provide evidence for the concept that single plaquescontain molecular information that predicts future systemicevents, the AtheroExpress biobank was initiated.13,14 In thislongitudinal biobank study, we compared plaque proteinsfrom patients who had a cardiovascular event to plaqueproteins from patients who remained stable during follow-upusing the complementary power of proteomics. As a proof ofconcept, expression of the identified local plaque proteinosteopontin (OPN) was studied in all carotid samples andvalidated in femoral plaque samples to elucidate its predictivevalue for the occurrence of systemic cardiovascular eventselsewhere in the body.
Materials and MethodsStudy Population and DesignAtheroExpress is a longitudinal vascular biobank study that includesbiomaterials from patients undergoing carotid endarterectomy andfemoral endarterectomy in 2 Dutch hospitals (UMC Utrecht and St.Antonius Hospital, Nieuwegein). The primary objective of the studyis to investigate the relation between single plaque characteristics atbaseline and clinical outcome during follow-up. The study designhas been described previously.13 The study has been approved by theInstitutional Review boards of both hospitals and written informedconsent was obtained from all patients.
All patients undergoing carotid endarterectomy between April 1,2002 and March 1, 2006 in 1 of the 2 hospitals were considered forinclusion in the AtheroExpress study (n�685 carotid endarterectomy,n�200 femoral endarterectomy). Exclusion criteria for follow-upwere unwillingness or physical incapability to participate (eg, severedementia).
The criteria to perform carotid endarterectomy were based on therecommendations by the ACAS study15 for asymptomatic patientsand the NASCET study16 for symptomatic patients. At baseline,clinical parameters including cardiovascular risk factors and medi-cation use were recorded.
Follow-upAll patients underwent clinical follow-up 1 year after surgicalintervention and completed postal questionnaires 1, 2, and 3 yearsafter the operation. When patients did not respond to the question-naire, the general practitioner was contacted by phone. Adjudicationof the outcome events was performed by an outcome event commit-tee consisting of 3 authors (F.L.M., J.P.d.e.V., W.E.H.) who wereblinded to laboratory results. All end points were independentlyassessed by 2 members of the committee; in case of disagreement, athird opinion was obtained.
Clinical OutcomeThe primary outcome was a composite encompassing all cardiovas-cular events and interventions, including vascular death, nonfatal
myocardial infarction, nonfatal stroke, and vascular intervention thatwas not planned at the time of inclusion.
Secondary outcome was any major cardiovascular event, such asvascular death, nonfatal myocardial infarction, nonfatal stroke, andnonfatal aneurysm rupture. Definitions and assessment procedures ofthe outcome events were described previously.13 This end pointencompasses the same end points as the composite primary endpoint, excluding the peripheral surgical interventions.
Protein Extraction, Purification, and ProteomicsAfter dissection, plaques were cut in 0.5-cm segments and processedin a standardized way.13 For the proteomics analyses, plaque proteinswere compared from carotid endarterectomy patients who had aprimary outcome vs patients who were event-free. For this purpose,the first 80 subsequent patients in the cohort who had an event beforeMarch 2006 were selected in the event group. In the same cohort, 80control patients were selected who matched for age, gender, and theduration of follow-up time after the event.
A detailed description of the proteomics is given in the onlineAppendix. In sum, after digestion, the peptides from each of thepooled samples were separated offline on high-performance liquidchromatography using a SCX column in 15 salt fractions. Subse-quently, each salt fraction was injected onto the second dimensionseparation (C18 column) and sprayed online in the LTQ massspectrometer for protein identification.
BioinformaticsFrom the raw mass spectrometry data, Sequest in Bioworks 3.3 wasused to generate a list of identified proteins per salt fraction that wascollected in a Microsoft Excel file. Omniviz was used to combine thelists of identified proteins in the different salt fractions into 1 filewith all different identified proteins (�1200 identified proteins)identified per pooled sample and selected the identified proteins thatwere only in the event or only in the controls (Omniviz list). Toselect from this Omniviz list that included the proteins for validationin the individual patients, we used Ingenuity networks (IngenuitySystems Inc). Ingenuity selected 90 proteins that had a previouslydescribed connection with the other proteins in the literature andvisualized these connections in a large network.
Within this network, OPN was selected based on its previouslydescribed relation with atherosclerosis17–20 and the availability of anassay, as well as macrophage migration inhibitory factor (MIF).21
Osteopontin Enzyme-LinkedImmunosorbent AssayA commercial Osteopontin enzyme-linked immunosorbent assay(DOST00; R&D Systems) was used according to the describedprocedures. From each patient, 1 �g of Tripure (Roche) isolatedprotein was used per well.
Statistical AnalysisFrom all patients who underwent carotid endarterectomy, plaqueswere used to assess the predictive value of plaque OPN levels forreaching the primary and secondary outcome events. Plaques ob-tained from patients undergoing femoral endarterectomy were usedfor external validation. Since part of the carotid artery samples hadbeen used for proteomic analyses, a subgroup analysis was per-formed on those patients whose plaque material had not been usedfor the proteomic analyses.
Plaque OPN levels were divided into quartiles with cut-off valuesat 3.2, 8.2, and 14.9 ng/mL. In all analyses, quartiles 1 and 2 hadsimilar risk implications. Kaplan-Meier survival analysis was used toestimate cumulative event rates after 3 years’ follow-up. Coxregression was used to calculate the hazard ratio (HR) with 95%confidence interval (95% CI) for the association between plaquecharacteristics and follow-up. In multivariable analysis, we adjustedsimultaneously for those potential confounders that had a crude HRsignificant at the P�0.10 in univariate analysis. For the multivariateanalysis, we included all patients and created a specific class of
2 Arterioscler Thromb Vasc Biol March 2010
by on May 19, 2011 atvb.ahajournals.orgDownloaded from

absent for those variables missing. Spearman test was used tocompare OPN plaque and serum data
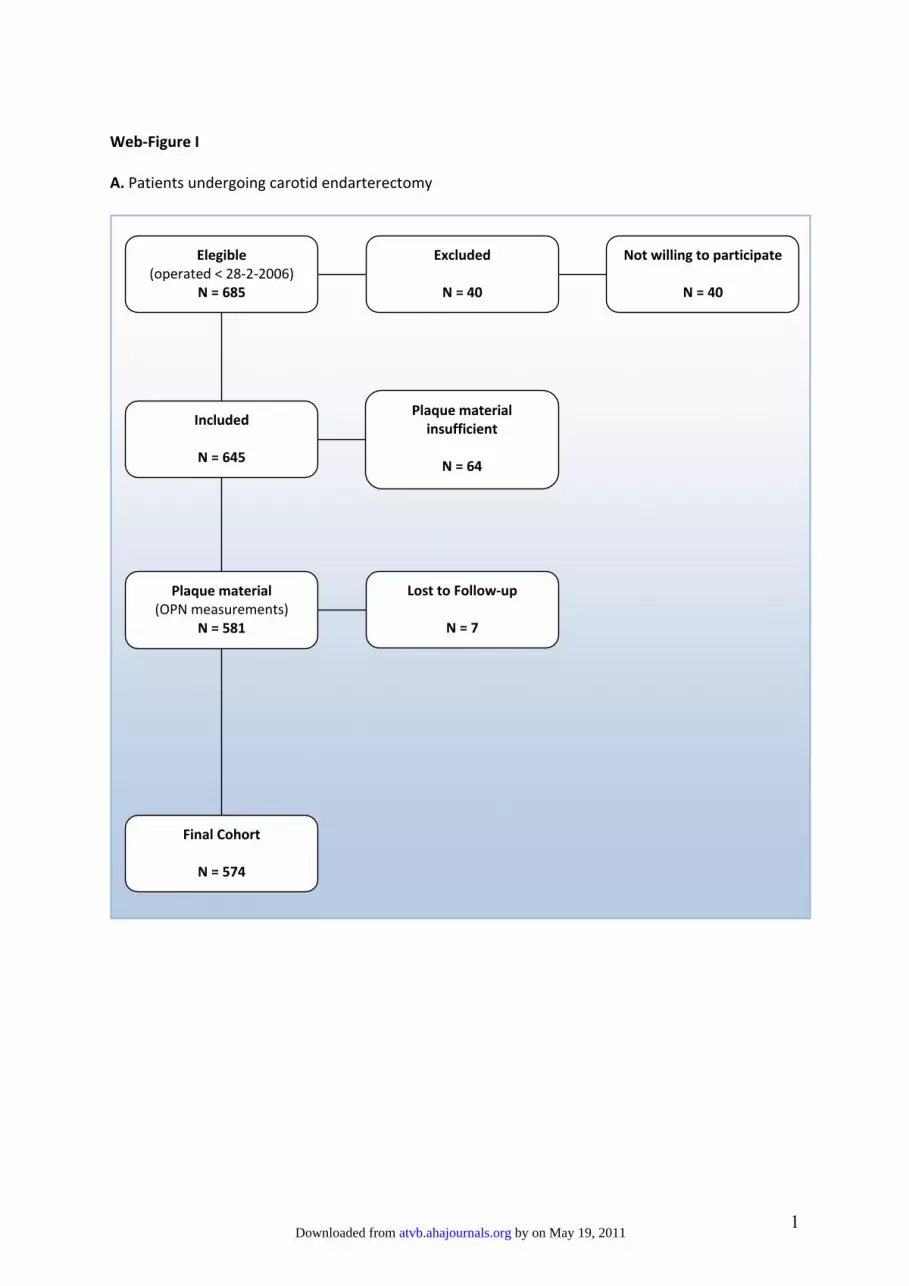
ResultsThe study design is outlined in Figure 1. A total of 685patients undergoing carotid endarterectomy were found to beeligible for inclusion. Forty patients were not willing toparticipate, and in 64 patients no plaque material was avail-able for protein analyses. In the majority of these cases, thedissected plaque sample was formalin-fixed and paraffin-embedded for immunohistochemistry. Seven patients (1.2%)of the remaining 581 patients were lost to follow-up, resultingin a final cohort of 574 patients (Figure IA; Table 1). In thecohort undergoing femoral artery surgery, 200 patients wereeligible, of whom 19 were excluded (17 not willing toparticipate, 2 with severe dementia). In the resulting 181patients, 29 had insufficient plaque material and 1 was lost tofollow-up, yielding a final cohort of 151 patients (Figure IB).Baseline characteristics did not differ between patients of thestudy cohort and patients with insufficient plaque material orwho were lost to follow-up (data not shown).
The proteomics and bioinformatics search revealed a list of90 candidate plaque proteins that could be upregulated inpatients who had a cardiovascular event during follow-up.Next, we selected proteins that have been identified earlier inexperimental set-ups with any cardiovascular phenotype butnot necessarily with atherosclerosis (OPN;17–20 MIF21). Then,we searched whether a detection tool was commerciallyavailable (eg, a commercial enzyme-linked immunosorbentassay or Luminex). OPN was selected for the current proof-of-concept study.
The mean plaque OPN levels differed consistently betweenplaques obtained from patients who had any cardiovascularevent during follow-up (mean level, 15.0�1.0 ng/mL) andpatients who had no event (mean level, 9.2�0.4 ng/mL).Mean OPN levels were 15.1�1.3 ng/mL for patients whohad a secondary outcome, 15.5�1.6 ng/mL for those whohad a stroke, 13.5�1.5 ng/mL for patients with a coronaryevent or intervention, and 15.2�1.6 ng/mL for peripheralinterventions.
Table 2 shows the plaque OPN levels in association withthe baseline clinical characteristics and plaque characteristics(HR, 1.45; 95% CI, 1.28–1.64) per 10 ng/mL increase ofOPN (P�0.0005). The CI for OPN plaque levels are the 95%CI for the OPN plaque levels within each subgroup.
OPN as a Predictive Plaque Marker inCarotid PlaquesDifferential expression of carotid plaque OPN betweenpooled carotid plaques of patients that had a secondary eventand controls without a secondary event was validated inindividual carotid plaque samples. Carotid plaque OPN levels(n�574) were strongly related with the occurrence of theprimary outcome, and this relationship was stronger withhigher levels of OPN. The HR was 2.1 (95% CI, 1.2–3.7) forquartile 3 vs quartile 1 (Table 3) and 3.8 for the highestquartile (quartile 4; 95% CI, 2.3–6.4; Table 3). Adjustmentfor potential confounders did not change these findings: themultiple adjusted HR for quartile 4 vs quartile 1 was 3.5 (95%CI, 2.0–5.9).
Osteopontin levels were also related with the occurrence ofthe secondary outcome (quartile 3 vs quartile 1, adjusted HR,
Figure 1. ●●●.
de Kleijn et al Local Plaque Markers Predictive for Systemic Events 3
by on May 19, 2011 atvb.ahajournals.orgDownloaded from

2.1; 95% CI, 1.0–4.5; quartile 4 vs quartile 1, adjusted HRratio, 3.4 95% CI, 1.6–6.9).
Figure 2A and 2B illustrate the time-to-event curves for theprimary and secondary outcome. Additional curves (Figure2C–F) also demonstrate consistent outcomes for the otherclinical outcomes (Table 3). Almost half of all patients inquartile 4 reached the primary end point within 3 years.Approximately one-quarter in quartile 4 had a major cardio-vascular event during follow-up compared with 6% in quar-tiles 1 and 2. A post hoc analysis among patients who hadasymptomatic carotid artery stenosis (n�118) showed acrude HR for the primary outcome of 7.1 (95% CI, 3.1–16.4)in quartile 4; the multiple adjusted HR was 7.1 (95%CI,2.9–17.2).
External Validation: Predictive Value of OPN inFemoral PlaquesWe validated these observations on basis of carotid plaquematerial in patients who had femoral endarterectomy. Meanfollow-up time in this cohort was 2.3[plminus]0.9 years.Eighty-two patients (54%) reached the primary outcomeduring follow-up. The HR of quartile 3 vs quartile 1 was 2.8(95% CI, 1.5–5.6), and it was 3.8 (95% CI, 2.0–7.4) forquartile 4. The time-to-event curve for the primary outcomein the femoral artery cohort is shown in Figure 2G (Table 3).
Multivariable analyses did not materially change these find-ings (data not shown).
OPN Blood Levels: Predictive Value Of OPNin SerumHaving established that OPN plaque levels are associatedwith future cardiovascular events, we now measured serumOPN in an unbiased subgroup of our plaque cohort. Withinthe cohort of 574 carotid patients, we collected serum from305 patients and measured OPN serum levels. This revealed(Table 4) that for OPN serum levels, the HR of quartile 3 vsquartiles 1 and 2 was 1.4 (95% CI, 0.8–2.7), and for quartile4 vs quartiles 1 and 2 it was 2.2 (95% CI, 1.2–3.8). In thesame group, however, HR was 2.3 for quartile 3 and 4.0 forquartile 4 for plaque OPN levels. Comparison of plaque andserum OPN levels within the patient revealed a correlationcoefficient of 0.149 (P�0.009).
DiscussionOur study indicates that high levels of OPN from atheroscle-rotic plaques strongly predict the risk of new vascularcomplications. These findings pertain to all parts of thevascular bed and were observed for carotid and femoral arteryplaques. Osteopontin confirms our hypothesis that localplaques contain molecular information predictive of newatherothrombotic events elsewhere in the vascular tree inde-pendent of age and any other risk factor for atheroscleroticdisease.
This is in line with previous observations in which thepositive association between carotid artery intima-mediathickness and cardiovascular risk factors7 and events8 hasbeen established. In addition, asymptomatic carotid arterystenosis is an independent predictor of vascular events,9 andcarotid plaque morphology is an independent predictor fornoncerebral events.11
We identified a new concept and strategy in the search forprogressive atherosclerotic disease biomarkers. The follow-ing observations support this view. First, following the notionthat local plaques contain information on the stability of theentire atherosclerotic vascular system, we assumed that thebiomarker should be detectable in every advanced atheroscle-rotic plaque independent of localization. We showed that inaddition to carotid plaque OPN levels, femoral plaque OPNlevels were also predictive for cardiovascular events. Thisstrongly suggests that there is predictive information in everyadvanced plaque for future cardiovascular events in othervascular territories, independent of plaque localization. Sec-ond, the relation of plaque OPN with future adverse eventswas weak or independent of plaque features that are consid-ered the hallmark of the vulnerable plaque, eg, presence ofmacrophages, large areas of lipid, and smooth muscle cellcontent. The current observations do not challenge the valueof the current definitions of the vulnerable plaque for theunderstanding of pathogenesis but rather indicate that thelocal plaque hides strong molecular biomarkers for diseaseprogression that might be independent of the pathologicalcharacterization. The weak association of OPN with a largelipid core and macrophage infiltration is probably attrib-utable to the presence of OPN in only a subgroup of
Table 1. Baseline Characteristics of Patients UndergoingCarotid Endarterectomy
Patient Characteristics N/Total* %*
N of patients 574
Clinical characteristics
Age, mean/SD, yr 68.0 8.8
Male 409/574 71%
Current smoker 153/556 28%
Diabetes 468/570 18%
Hypertension 377/570 66%
Hypercholesterolemia 343/572 60%
History: Vascular intervention 192/572 34%
History: Myocardial infarction 120/569 21%
Body mass index, mean/SD, kg/m2 26.6 3.7
Statin use 420/570 74%
Aspirin use 507/570 89%
Oral anticoagulant use 83/570 15%
Bilateral carotid stenosis 244/574 43%
Symptomatic stenosis 456/574 79%
Plaque characteristics
Large lipid core (�40%) 198/573 35%
Marked macrophage infiltration 329/569 58%
Marked calcifications 331/573 58%
IL-6, mean/SE, ng/g 99 12
IL-8, mean/SE, ng/g 223 24
MMP-2, mean/SE, a.u. 4.1 0.24
MMP-9, mean/SE, a.u. 0.81 0.03
*N/total and percentage unless otherwise specified.MMP indicates matrix metalloproteinase.
4 Arterioscler Thromb Vasc Biol March 2010
by on May 19, 2011 atvb.ahajournals.orgDownloaded from

macrophages (Figure II). Third, the relation between OPNlevels and the outcome measure was evident not only insymptomatic but also in asymptomatic patients. Expres-sion levels were studied in advanced lesions in search formarkers predictive for secondary clinical manifestations.Considering the promising results in asymptomatic pa-tients, the next phase in this biomarker discovery approachcould be a longitudinal study specifically addressingasymptomatic less advanced lesions. The high HR (7.1) forhigh OPN plaque levels in the asymptomatic patient groupwas confirmatory but surprising. Although supportive ofour conclusions, this is a subgroup analyses with lowpatient numbers; therefore, results require verification tobecome conclusive.
Another substudy was performed on MIF plaque levels.MIF is studied in atherosclerotic models and is known tobe involved in the recruitment of inflammatory cells and toinduce matrix degrading enzymes like matrix metallopro-
teinases.21 This revealed (Figure III) that plaque MIFlevels were strongly associated with secondary cardiovas-cular events and showed that the concept not only appliesfor OPN. Also, plaque proteins were found that were notassociated with secondary events, indicating that predic-tive value is only found in a limited group of plaqueproteins (Figures IV, V).
OPN was arbitrarily selected for this proof-of-conceptbiomarker study. The function of OPN has not been exploredin this study. OPN, also known as early T-lymphocyteactivator 1, is a secreted multifunctional glycoprotein.23
Mouse studies provided genetic evidence17–20 for a causal roleof OPN in the development of atherosclerotic plaques. OPNplasma levels have shown to be related to coronary arterydisease24,25 and to be an independent predictor of futurecardiovascular events in patients with chronic stable angina26
with HR of 1.8. The predictive value of OPN plaque levelswas higher than OPN levels in the serum.
Table 2. Relation Between Plaque OPN and Primary End Point, Adjusted for Potential Confounders
OPN Expression HR ofCharacteristicHR (95% CI)
Risk of Primary OutcomeHR of Plaque OPN Adjusted for Characteristic
Q1 % Q2 % Q3 % Q4 % P Q2 vs Q1 (95% CI) Q3 vs Q1 (95% CI) Q4 vs Q1 (95% CI)
Crude HR plaque OPN 0.9 (0.5–1.8) 2.1 (1.2–3.7) 3.8 (2.3–6.4)
Clinical characteristics
Age �70 41.8 46.9 44.9 42.4 0.913 1.5 (1.0–2.1)*† 0.9 (0.5–1.7) 2.1 (1.2–3.6) 3.9 (2.3–6.5)
Male 69.2 67.6 76.6 71.2 0.393 1.8 (1.2–2.8)*† 1.0 (0.5–1.8) 2.1 (1.2–3.5) 3.8 (2.3–6.2)
Current smoker 24.8 20.0 34.0 31.1 0.050 1.4 (1.0–2.0)† 0.8 (0.4–1.6) 1.9 (1.1–3.2) 3.6 (2.2–6.0)
Diabetes 18.1 19.4 17.2 16.8 0.513 0.8 (0.5–1.3) 0.9 (0.5–1.7) 2.1 (1.2–3.6) 3.8 (2.3–6.3)
Hypertension 62.1 64.8 68.8 69.1 0.159 1.0 (0.7–1.5) 0.9 (0.5–1.8) 2.1 (1.2–3.6) 3.7 (2.2–6.2)
Hypercholesterolemia 65.5 55.2 56.3 63.7 0.968 1.2 (0.8–1.7) 1.0 (0.5–1.8) 2.1 (1.2–3.7) 3.8 (2.3–6.3)
History: Vascular intervention 34.5 31.7 33.8 34.4 0.839 1.4 (1.0–2.0)*† 0.9 (0.5–1.8) 2.1 (1.2–3.6) 3.7 (2.2–6.2)
History: Myocardial infarction 20.8 22.9 19.9 20.8 0.997 1.6 (1.1–2.3)*† 0.9 (0.5–1.7) 2.1 (1.2–3.6) 3.7 (2.2–6.1)
BMI �25 kg/m2 64.7 64.9 61.7 66.4 0.959 0.9 (0.6–1.4) 1.0 (0.5–2.0) 2.2 (1.2–3.9) 3.7 (2.1–6.4)
Statin use 76.4 70.1 70.1 79.2 0.618 1.4 (0.9–2.1) 0.9 (0.5–1.7) 2.1 (1.2–3.7) 3.7 (2.3–6.2)
Aspirin use 91.0 89.6 89.8 84.8 0.235 0.6 (0.4–1.0)*† 0.9 (0.5–1.7) 2.1 (1.2–3.6) 3.7 (2.2–6.1)
Oral anticoagulant use 14.6 11.8 16.6 15.2 0.725 1.4 (0.9–2.2) 0.9 (0.5–1.7) 2.1 (1.2–3.6) 3.8 (2.3–6.3)
Bilateral carotid stenosis 30.8 37.2 47.5 56.0 0.000* 2.1 (1.5–3.0)*† 0.9 (0.5–1.7) 1.9 (1.1–3.3) 3.4 (2.0–5.7)
Symptomatic carotidstenosis
76.0 75.2 84.8 81.6 0.070 1.1 (0.7–1.7) 0.9 (0.5–1.8) 2.1 (1.2–3.7) 3.9 (2.3–6.4)
Other plaque characteristics
Large lipid core (�40%) 23.4 36.6 41.1 36.8 0.005* 1.1 (0.8–1.5) 0.9 (0.5–1.8) 2.1 (1.2–3.6) 3.8 (2.3–6.3)
Marked macrophageinfiltration
51.4 59.3 60.9 59.7 0.083 1.0 (0.7–1.4) 0.9 (0.5–1.8) 2.2 (1.2–3.7) 3.8 (2.3–6.3)
Marked calcifications 57.9 54.5 59.5 59.2 0.515 1.0 (0.7–1.4) 0.9 (0.5–1.8) 2.1 (1.2–3.6) 3.8 (2.3–6.3)
IL-6‡ 50.7 52.3 46.5 51.5 0.484 1.4 (1.0–2.1)*† 0.9 (0.4–1.7) 2.3 (1.3–4.0) 4.6 (2.7–7.9)
IL-8‡ 39.6 46.1 61.1 53.5 0.001* 1.2 (0.9–1.7) 0.9 (0.4–1.7) 2.3 (1.3–4.0) 4.7 (2.7–7.9)
MMP-2‡ 48.9 52.2 51.7 46.9 0.810 0.6 (0.4–0.9)*† 0.9 (0.5–1.7) 2.1 (1.2–3.7) 3.9 (2.3–6.6)
MMP-9‡ 46.7 49.3 57.1 47.8 0.044* 1.1 (0.8–1.5) 0.9 (0.5–1.7) 2.1 (1.2–3.6) 3.9 (2.3–6.6)
Multivariable adjustment§ 0.9 (0.5–1.7) 2.1 (1.2–3.6) 3.5 (2.0–5.9)
*P�0.05.†P�0.10 these variables were entered in to the multivariate analysis.‡IL-6, IL-8, MMP-2, MMP-9: �median vs �median.§Adjusted for age, gender, smoking, history of vascular intervention, history of myocardial infarction, aspirin use, bilateral carotid stenosis, IL-6, and MMP-2.Q indicates quartile.
de Kleijn et al Local Plaque Markers Predictive for Systemic Events 5
by on May 19, 2011 atvb.ahajournals.orgDownloaded from
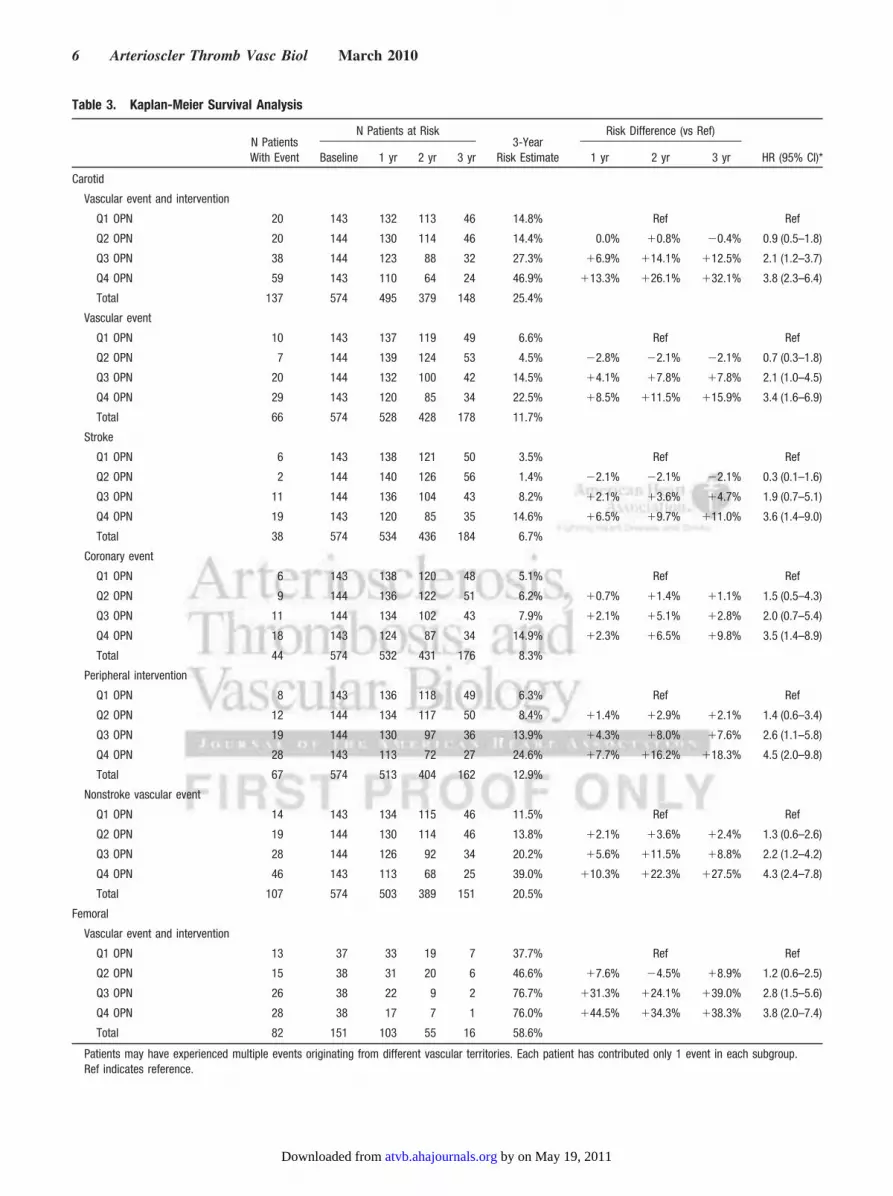
Table 3. Kaplan-Meier Survival Analysis
N PatientsWith Event
N Patients at Risk3-Year
Risk Estimate
Risk Difference (vs Ref)
HR (95% CI)*Baseline 1 yr 2 yr 3 yr 1 yr 2 yr 3 yr
Carotid
Vascular event and intervention
Q1 OPN 20 143 132 113 46 14.8% Ref Ref
Q2 OPN 20 144 130 114 46 14.4% 0.0% �0.8% �0.4% 0.9 (0.5–1.8)
Q3 OPN 38 144 123 88 32 27.3% �6.9% �14.1% �12.5% 2.1 (1.2–3.7)
Q4 OPN 59 143 110 64 24 46.9% �13.3% �26.1% �32.1% 3.8 (2.3–6.4)
Total 137 574 495 379 148 25.4%
Vascular event
Q1 OPN 10 143 137 119 49 6.6% Ref Ref
Q2 OPN 7 144 139 124 53 4.5% �2.8% �2.1% �2.1% 0.7 (0.3–1.8)
Q3 OPN 20 144 132 100 42 14.5% �4.1% �7.8% �7.8% 2.1 (1.0–4.5)
Q4 OPN 29 143 120 85 34 22.5% �8.5% �11.5% �15.9% 3.4 (1.6–6.9)
Total 66 574 528 428 178 11.7%
Stroke
Q1 OPN 6 143 138 121 50 3.5% Ref Ref
Q2 OPN 2 144 140 126 56 1.4% �2.1% �2.1% �2.1% 0.3 (0.1–1.6)
Q3 OPN 11 144 136 104 43 8.2% �2.1% �3.6% �4.7% 1.9 (0.7–5.1)
Q4 OPN 19 143 120 85 35 14.6% �6.5% �9.7% �11.0% 3.6 (1.4–9.0)
Total 38 574 534 436 184 6.7%
Coronary event
Q1 OPN 6 143 138 120 48 5.1% Ref Ref
Q2 OPN 9 144 136 122 51 6.2% �0.7% �1.4% �1.1% 1.5 (0.5–4.3)
Q3 OPN 11 144 134 102 43 7.9% �2.1% �5.1% �2.8% 2.0 (0.7–5.4)
Q4 OPN 18 143 124 87 34 14.9% �2.3% �6.5% �9.8% 3.5 (1.4–8.9)
Total 44 574 532 431 176 8.3%
Peripheral intervention
Q1 OPN 8 143 136 118 49 6.3% Ref Ref
Q2 OPN 12 144 134 117 50 8.4% �1.4% �2.9% �2.1% 1.4 (0.6–3.4)
Q3 OPN 19 144 130 97 36 13.9% �4.3% �8.0% �7.6% 2.6 (1.1–5.8)
Q4 OPN 28 143 113 72 27 24.6% �7.7% �16.2% �18.3% 4.5 (2.0–9.8)
Total 67 574 513 404 162 12.9%
Nonstroke vascular event
Q1 OPN 14 143 134 115 46 11.5% Ref Ref
Q2 OPN 19 144 130 114 46 13.8% �2.1% �3.6% �2.4% 1.3 (0.6–2.6)
Q3 OPN 28 144 126 92 34 20.2% �5.6% �11.5% �8.8% 2.2 (1.2–4.2)
Q4 OPN 46 143 113 68 25 39.0% �10.3% �22.3% �27.5% 4.3 (2.4–7.8)
Total 107 574 503 389 151 20.5%
Femoral
Vascular event and intervention
Q1 OPN 13 37 33 19 7 37.7% Ref Ref
Q2 OPN 15 38 31 20 6 46.6% �7.6% �4.5% �8.9% 1.2 (0.6–2.5)
Q3 OPN 26 38 22 9 2 76.7% �31.3% �24.1% �39.0% 2.8 (1.5–5.6)
Q4 OPN 28 38 17 7 1 76.0% �44.5% �34.3% �38.3% 3.8 (2.0–7.4)
Total 82 151 103 55 16 58.6%
Patients may have experienced multiple events originating from different vascular territories. Each patient has contributed only 1 event in each subgroup.Ref indicates reference.
6 Arterioscler Thromb Vasc Biol March 2010
by on May 19, 2011 atvb.ahajournals.orgDownloaded from

Interestingly, we did not observe a strong correlationbetween blood and plaque OPN levels, which indicates thatthe plaque OPN levels really hide different biomarker prop-erties compared with serological OPN. The predictive valueof plaque OPN levels for future cardiovascular events has notbeen described yet. Furthermore, OPN plaque levels were notrelated to the Framingham risk score. Addition of Framing-
ham risk score to the multivariable model did not change theassociation between plaque OPN and clinical outcome.
Several limitations of this study need to be discussed.Plaque phenotype is associated with the clinical disease statusat baseline. Patients who had a stroke have more plaques withunstable characteristics compared to asymptomatic patients.Although our results were independent of clinical presenta-tion, the heterogeneity of the population merits consideration.The results presented are limited to an elderly atheroscleroticpatient population that makes extrapolation to a populationthat has traditional risk factors but without a clinical mani-festation difficult. Because the plaque used for the localprotein marker measurement associated with secondaryevents is removed from the patient, data regarding treatmentare not collected during follow-up. The predictive value ofOPN plaque levels in asymptomatic patients, however, re-mains high and suggests that these findings might apply to abroader population with advanced atherosclerotic plaques.
The proteomic study included pooled samples of 160patients who were also part of the total group in which weanalyzed OPN and MIF levels on an individual level. There-fore, the full cohort of 574 patients cannot be considered as avalidation group. Outcome data of the 160 patients used in thepooled proteomics data did not differ from the newly added414 patients (Table II). In addition, our results in the carotidpatient group were supported by the data obtained in thepatient group that underwent femoral endarterectomy.
ConclusionDiscovery of new plaque biomarkers that identify patients atrisk for secondary clinical manifestations of advanced ath-erosclerotic disease brings new clinical implementationswithin reach. Imaging modalities like MRI, CT, SPECT, andultrasound27,28 may apply these plaque markers to stratifypatients at risk for secondary events by detection of plaqueprotein levels. Our observations also prove the concept thatlocal plaque material may be used for prognostic screeningand research because predictive plaque proteins can bedetected in material of advanced plaques harvested afteratherectomy, PTCA, CABG,29 and other types of vascularsurgery to further stratify these patient populations for sec-ondary events. In conclusion, using OPN and MIF as anexample, we show that local atherosclerotic plaques are apotential source of highly predictive biomarkers for theoccurrence of adverse cardiovascular events in other vascularterritories.
Plaque OPN quartile 1
0 1 2 3
0%
10%
20%
30%
40%
50%
E
Follow-up (years)
Even
t rat
e
Peripheral intervention
0 1 2 3
0%
10%
20%
30%
40%
50%
Follow-up (years)
F
Even
t rat
e
Non-stroke vascular event
0 1 2 3
0%
10%
20%
30%
40%
50%
Follow-up (years)
A
Even
t rat
e
Vascular event + intervention
0 1 2 3
0%
10%
20%
30%
40%
50%
C
Follow-up (years)
Even
t rat
e
Stroke
0 1 2 3
0%
10%
20%
30%
40%
50%
Follow-up (years)
B
Even
t rat
e
Vascular event
0 1 2 3
0%
10%
20%
30%
40%
50%
D
Follow-up (years)
Even
t rat
eCoronary event
0 1 2 3
0%
20%
40%
60%
80%
100%
G
Follow-up (years)
Even
t rat
e
Vascular event + interventionFEMORAL COHORT
Plaque OPN quartile 2
Plaque OPN quartile 3
Plaque OPN quartile 4
Figure 2. ●●●.
Table 4. Comparison Plaque and Blood OPN Levels
Vascular Event andIntervention
OPN in Plaque OPN in Blood
N Patients at Riskat Baseline
N PatientsWith Event HR (95% CI) P
N Patients at Riskat Baseline
N PatientsWith Event HR (95% CI) P
Q1 OPN 143 20 Ref 64 11 Ref
Q2 OPN 144 20 Ref 77 11 Ref
Q3 OPN 144 38 2.3 (1.4–3.8) 0.001 76 17 1.4 (0.8–2.7) 0.255
Q4 OPN 143 59 4.0 (2.5–6.5) �0.001 88 29 2.2 (1.2–3.8) 0.006
Total 574 137 305 68
de Kleijn et al Local Plaque Markers Predictive for Systemic Events 7
by on May 19, 2011 atvb.ahajournals.orgDownloaded from

AcknowledgmentsThe authors thank A. Stubbs and S. Swagemakers for their contri-bution in bioinformatic analysis, L.W. Stanton, T.T. Aye, and T.Y.Low for their support in the proteomics, and W.M. Peeters forstatistics and database analysis.
Sources of FundingEU FP6-2004-Mobility-6 #021773 (D.d.K.), Ministry of Educationof Singapore (ARC: T206B3211 to S.K.S.), EU FP6-037400Immunath-2006 (to D.d.K. and G.P.), Agency of Science andTechnology of Singapore (BMRC: 08/1/22/19/575 to S.K.S. andD.d.K.), and the UMCU strategic Investment Prevention (to G.P.).
DisclosuresF. Moll, M. Daemen, P. van der Spek, G. Pasterkamp, and D. deKleijn are founders and consultants of a recently established smallbiotech company with a limited amount of shares.
References1. Ware JH The limitations of risk factors as prognostic tools. N Engl J Med.
2006;355:2615–2617.2. Wang TJ, Gona P, Larson MG, Tofler GH, Levy D, Newton-Cheh C,
Jacques PF, Rifai N, Selhub J, Robins SJ, Benjamin EJ, D’Agostino RB,Vasan RS. Multiple biomarkers for the prediction of first major cardio-vascular events and death. N Engl J Med. 2006;355:2631–2639.
3. Kolodgie FD, Gold HK, Burke AP, Fowler DR, Kruth HS, Weber DK,Farb A, Guerrero LJ, Hayase M, Kutys R, Narula J, Finn AV, Virmani R.Intraplaque hemorrhage and progression of coronary atheroma. N EnglJ Med. 2003;349:2316–2325.
4. Burke AP, Farb A, Malcom GT, Liang YH, Smialek J, Virmani R.Coronary risk factors and plaque morphology in men with coronarydisease who died suddenly. N Engl J Med. 1997;336:1276–1282.
5. Shah PK, Falk E, Badimon JJ, Fernandez-Ortiz A, Mailhac A,Villareal-Levy G, Fallon JT, Regnstrom J, Fuster V. Human monocyte-derived macrophages induce collagen breakdown in fibrous caps of ath-erosclerotic plaques. Potential role of matrix-degrading metallopro-teinases and implications for plaque rupture. Circulation. 1995;92:1565–1569.
6. Schwartz SM, Galis ZS, Rosenfeld ME, Falk E. Plaque rupture in humansand mice. Arterioscler Thromb Vasc Biol. 2007;27:705–713.
7. O’Leary DH, Anderson KM, Wolf PA, Evans JC, Poehlman HW. Cho-lesterol and carotid atherosclerosis in older persons: the FraminghamStudy. Ann Epidemiol. 1992;2:147–153.
8. O’Leary DH, Polak JF, Kronmal RA, Manolio TA, Burke GL, WolfsonSK Jr. Carotid-artery intima and media thickness as a risk factor formyocardial infarction and stroke in older adults. Cardiovascular HealthStudy Collaborative Research Group. N Engl J Med. 1999;340:14–22.
9. Goessens BM, Visseren FL, Kappelle LJ, Algra A, van der Graaf Y.Asymptomatic carotid artery stenosis and the risk of new vascular eventsin patients with manifest arterial disease: the SMART study. Stroke.2007;38:1470–1475.
10. Mauriello A, Sangiorgi G, Fratoni S, Palmieri G, Bonanno E, AnemonaL, Schwartz RS, Spagnoli LG. Diffuse and active inflammation occurs inboth vulnerable and stable plaques of the entire coronary tree: a his-topathologic study of patients dying of acute myocardial infarction. J AmColl Cardiol. 2005;45:1585–1593.
11. Rothwell PM, Villagra R, Gibson R, Donders RC, Warlow CP. Evidenceof a chronic systemic cause of instability of atherosclerotic plaques.Lancet. 2000;355:19–24.
12. Vink A, Schoneveld AH, Richard W, de Kleijn DP, Falk E, Borst C,Pasterkamp G. Plaque burden, arterial remodeling and plaque vulnera-
bility: determined by systemic factors? J Am Coll Cardiol. 2001;38:718–723.
13. Verhoeven BA, Velema E, Schoneveld AH, de Vries JP, de Bruin P,Seldenrijk CA, de Kleijn DP, Busser E, van der Graaf Y, Moll F,Pasterkamp G. Athero-express: differential atherosclerotic plaqueexpression of mRNA and protein in relation to cardiovascular events andpatient characteristics. Rationale and design. Eur J Epidemiol. 2004;19:1127–1133.
14. Hellings WE, Moll FL, De Vries JP, Ackerstaff RG, Seldenrijk KA, MetR, Velema E, Derksen WJ, De Kleijn DP, Pasterkamp G. Atheroscleroticplaque composition and occurrence of restenosis after carotid endarter-ectomy. JAMA. 2008;299:547–554.
15. Toole JF. ACAS recommendations for carotid endarterectomy. ACASExecutive Committee. Lancet. 1996;347:12.
16. Coyne TJ, Wallace MC. Surgical referral for carotid artery stenosis–theinfluence of NASCET. North American Symptomatic Carotid Endarter-ectomy Trial. Can J Neurol Sci. 1994;21:129–132.
17. Myers DL, Harmon KJ, Lindner V, Liaw L. Alterations of arterialphysiology in osteopontin-null mice. Arterioscler Thromb Vasc Biol.2003;23:1021–1028.
18. Strom A, Franzen A, Wangnerud C, Knutsson AK, Heinegård D,Hultgårdh-Nilsson A. Altered vascular remodeling in osteopontin-deficient atherosclerotic mice. J Vasc Res. 2004;41:314–322.
19. Matsui Y, Rittling SR, Okamoto H, Inobe M, Jia N, Shimizu T, Akino M,Sugawara T, Morimoto J, Kimura C, Kon S, Denhardt D, Kitabatake A,Uede T. Osteopontin deficiency attenuates atherosclerosis in female Apo-lipoprotein E-deficient mice. Arterioscler Thromb Vasc Biol. 2003;23:1029–1034.
20. Chiba S, Okamoto H, Kon S, Kimura C, Murakami M, Inobe M, MatsuiY, Sugawara T, Shimizu T, Uede T, Kitabatake A. Development ofatherosclerosis in osteopontin transgenic mice. Heart Vessels. 2002;16:111–117.
21. Zernecke A, Bernhagen J, Weber C. Macrophage migration inhibitoryfactor in cardiovascular disease. Circulation. 2008;117:1594–1602.
22. de Jager W, Prakken BJ, Bijlsma JW, Kuis W, Rijkers GT. Improvedmultiplex immunoassay performance in human plasma and synovial fluidfollowing removal of interfering heterophilic antibodies. J ImmunolMethods. 2005;300:124–135.
23. O’Regan A. The role of osteopontin in lung disease. Cytokine GrowthFactor Rev. 2003;14:479–488.
24. Coskun S, Atalar E, Ozturk E, Yavuz B, Ozer N, Goker H, Ovunc K,Aksoyek S, Kes S, Sivri B, Kirazli S, Ozmen F. Plasma osteopontin levelsare elevated in non-ST-segment elevation acute coronary syndromes.J Natl Med Assoc. 2006;98:1746–1750.
25. Ohmori R, Momiyama Y, Taniguchi H, Takahashi R, Kusuhara M,Nakamura H, Ohsuzu F. Osteopontin levels are associated with thepresence and extent of coronary artery disease. Atherosclerosis. 2003;170:333–337.
26. Minoretti P, Falcone C, Calcagnino M, Emanuele E, Buzzi MP, Coen E,Geroldi D. Prognostic significance of plasma osteopontin levels inpatients with chronic stable angina. Eur Heart J. 2006;27:802–807.
27. Sanz J, Fayad ZA. Imaging of atherosclerotic cardiovascular disease.Nature. 2008;451:953–957.
28. Saia F, Schaar J, Regar E, Rodriguez G, De Feyter PJ, Mastik F, Mar-zocchi A, Marrozzini C, Ortolani P, Palmerini T, Branzi A, van der SteenAF, Serruys PW. Clinical imaging of the vulnerable plaque in thecoronary arteries: new intracoronary diagnostic methods. J CardiovascMed (Hagerstown). 2006;7:21–28.
29. Altwegg LA, Neidhart M, Hersberger M, Muller S, Eberli FR, Corti R,Roffi M, Sutsch G, Gay S, von Eckardstein A, Wischnewsky MB,Luscher TF, Maier W. Myeloid-related protein 8/14 complex is releasedby monocytes and granulocytes at the site of coronary occlusion: a novel,early, and sensitive marker of acute coronary syndromes. Eur Heart J.2007;28:941–948.
8 Arterioscler Thromb Vasc Biol March 2010
by on May 19, 2011 atvb.ahajournals.orgDownloaded from
1
Web‐Figure I A. Patients undergoing carotid endarterectomy
Elegible (operated < 28‐2‐2006)
N = 685
Not willing to participate
N = 40
Final Cohort
N = 574
Plaque material(OPN measurements)
N = 581
Included
N = 645
Excluded
N = 40
Plaque material insufficient
N = 64
Lost to Follow‐up
N = 7
by on May 19, 2011 atvb.ahajournals.orgDownloaded from

2
B. Patients undergoing femoral endarterectomy (validation cohort)
Figure I Inclusion flow diagram. (Web‐figure)
Elegible (operated < 28‐2‐2006)
N = 200
Not willing to participate
N = 17
Final Cohort
N = 151
Plaque material(OPN measurements)
N = 152
Included
N = 181
Excluded
N = 19
Plaque material insufficient
N = 29
Lost to Follow‐up
N = 1
Co‐morbidity
N = 2
by on May 19, 2011 atvb.ahajournals.orgDownloaded from

3
Web‐figure 2
Web-figure 2A, Hematoxylin and eosin staining showing calcification in an atherosclerotic
plaque. B, Osteopontin staining at the boundary of the calcified area in the same plaque. C,
CD68 staining showing macrophages around microvessels in the shoulder of an
atherosclerotic plaque. D, Osteopontin staining of consecutive section in which only a subset
of the macrophages and macrophage foam cells show immunoreactivity.
by on May 19, 2011 atvb.ahajournals.orgDownloaded from

4
Web Figure 3
3,002,001,000,00
Cum
Haz
ard
0,5
0,4
0,3
0,2
0,1
0,0
4-censored3-censored2-censored1-censored4321
MIF_new (Binned)
Hazard Function
Web-figure 3 Hazard curves of carotid plaque Macrophage Migration Inhibitory Factor
(MIF) levels in the same cohort as used for OPN carotid plaque measurements. MIF levels
were quantified in 537 out of 574 patients (OPN carotid cohort) since plaque protein was not
available anymore for 37 patients. Carotid plaque MIF levels (n=537) were strongly related
with the occurrence of the primary outcome and this relationship was stronger with higher
levels of MIF. The hazard ratio was 1.8 [95%CI 1.0-3.3] for the third quartile versus quartile
1 and 2.8 for the highest quartile (Q4) [95%CI 1.6-5.0]. Test of equality of survival
distributions for the different levels of MIF gave a p-value of 0.001.
by on May 19, 2011 atvb.ahajournals.orgDownloaded from

5
Web-figure 4 Hazard curves of carotid plaque Interleukin 8 (Il-8) levels in 507 out of 574
patients (OPN carotid cohort). Carotid plaque IL-8 levels (n=507) were not related with the
occurrence of the primary outcome (p=0.729)
by on May 19, 2011 atvb.ahajournals.orgDownloaded from

6
Web-figure 5 Hazard curves of carotid plaque Matrix MetalloProtease 9 (MMP-9) levels in
531 out of 574 patients (OPN carotid cohort). Carotid plaque IL-8 levels (n=531) were not
related with the occurrence of the primary outcome (p=0.557)
Web table I
Relation between femoral plaque OPN expression and clinical and plaque characteristics
OPN expression
Characteristic
absent Characteristic
present
Mean difference [95% CI]
Clinical characteristics
Age ≥ 70 13.9 (1.84) 15.0 (1.85) 1.1 [‐4.5 – 6.7]
Male gender (%) 14.3 (1.87) 14.3 (1.70) ‐0.0 [‐6.1 – 6.1]
Current smoker (%) 13.6 (1.29) 15.7 (3.06) 2.1 [‐3.5 – 7.8]
Diabetes (%) 14.0 (1.21) 15.2 (3.88) 1.2 [‐4.8 – 7.3]
Hypertension (%) 14.3 (1.67) 14.4 (1.92) 0.1 [‐5.4 – 5.6]
Hypercholesterolemia (%) 10.8 (1.33) 16.1 (1.89) 5.3 [0.8 – 9.9]
History: Vascular intervention 13.7 (2.66) 14.8 (1.38) 1.1 [‐4.3 – 6.6]
History: Myocardial infarction 13.1 (1.71) 17.1 (2.07) 4.0 [‐1.7 – 9.8]
BMI ≥ 25 kg/m2 14.0 (1.91) 12.3 (1.24) ‐1.7 [‐6.1 – 2.6]
Statin use 9.9 (1.46) 15.8 (1.72) 5.9 [‐0.2 – 12.0]
Aspirin use 18.3 (2.34) 13.4 (1.57) ‐4.9 [‐11.6 – 1.9]
Oral anticoagulant use 13.3 (1.15) 17.8 (4.30) 4.5 [‐1.7 – 10.7]
Other plaque characteristics
Marked mϕ infiltration 14.3 (1.59) 15.6 (2.59) 1.4 [‐5.7 – 8.4]
Marked Calcifications 10.5 (1.44) 16.5 (1.91) 6.0 [0.3 – 11.6]*
(*) P < 0.05
by on May 19, 2011 atvb.ahajournals.orgDownloaded from
7
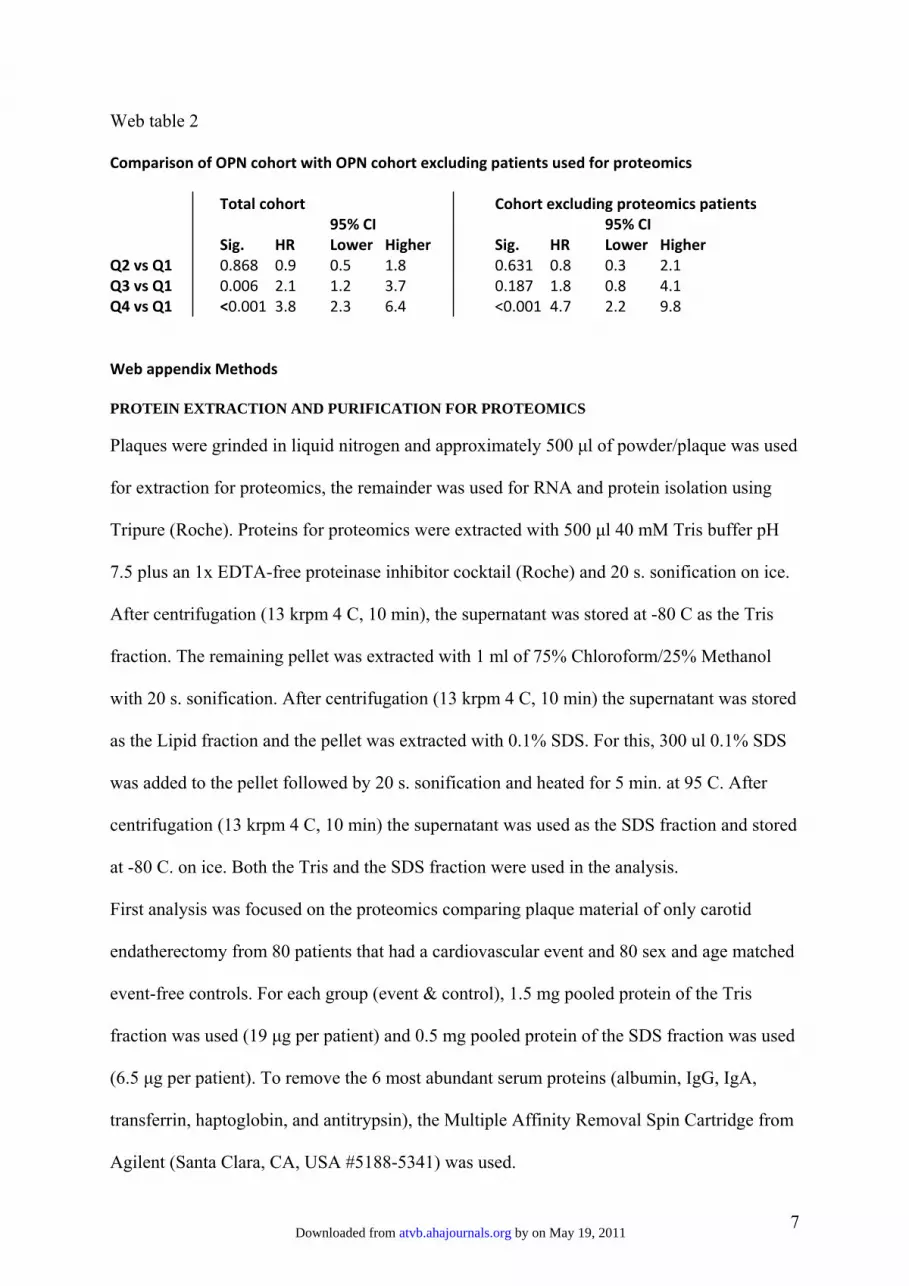
Web table 2
Comparison of OPN cohort with OPN cohort excluding patients used for proteomics
Total cohort Cohort excluding proteomics patients 95% CI 95% CI Sig. HR Lower Higher Sig. HR Lower Higher
Q2 vs Q1 0.868 0.9 0.5 1.8 0.631 0.8 0.3 2.1 Q3 vs Q1 0.006 2.1 1.2 3.7 0.187 1.8 0.8 4.1 Q4 vs Q1 <0.001 3.8 2.3 6.4 <0.001 4.7 2.2 9.8 Web appendix Methods PROTEIN EXTRACTION AND PURIFICATION FOR PROTEOMICS
Plaques were grinded in liquid nitrogen and approximately 500 μl of powder/plaque was used
for extraction for proteomics, the remainder was used for RNA and protein isolation using
Tripure (Roche). Proteins for proteomics were extracted with 500 μl 40 mM Tris buffer pH
7.5 plus an 1x EDTA-free proteinase inhibitor cocktail (Roche) and 20 s. sonification on ice.
After centrifugation (13 krpm 4 C, 10 min), the supernatant was stored at -80 C as the Tris
fraction. The remaining pellet was extracted with 1 ml of 75% Chloroform/25% Methanol
with 20 s. sonification. After centrifugation (13 krpm 4 C, 10 min) the supernatant was stored
as the Lipid fraction and the pellet was extracted with 0.1% SDS. For this, 300 ul 0.1% SDS
was added to the pellet followed by 20 s. sonification and heated for 5 min. at 95 C. After
centrifugation (13 krpm 4 C, 10 min) the supernatant was used as the SDS fraction and stored
at -80 C. on ice. Both the Tris and the SDS fraction were used in the analysis.
First analysis was focused on the proteomics comparing plaque material of only carotid
endatherectomy from 80 patients that had a cardiovascular event and 80 sex and age matched
event-free controls. For each group (event & control), 1.5 mg pooled protein of the Tris
fraction was used (19 μg per patient) and 0.5 mg pooled protein of the SDS fraction was used
(6.5 μg per patient). To remove the 6 most abundant serum proteins (albumin, IgG, IgA,
transferrin, haptoglobin, and antitrypsin), the Multiple Affinity Removal Spin Cartridge from
Agilent (Santa Clara, CA, USA #5188-5341) was used.
by on May 19, 2011 atvb.ahajournals.orgDownloaded from

8
After purification, 400 μg of the purified Tris protein and 100 μg of purified SDS protein
were used for digestion.
Before digestion the sample was split into two to obtain two technical replicates.
Samples were reduced, alkylated, and tryptic digested as described (Washburn et al 2001).
The samples were then desalted by passing the digested mixture through a conditioned Sep-
Pak C-18 SPE cartridge (Waters, Milford, MA, USA), washed twice with a 3% acetonitrile
(ACN) (JT Baker, Phillipsburg, NJ) and 0.1% formic acid (FA) buffer, and eluted with a 70%
ACN and 0.1% FA buffer. The eluted samples were then dried to about 20 ul by removing
organic solvent in a speedvac concentrator.
LIQUID CHROMATOGRAPHY MASS SPECTROMETRY PROTEOMICS
The samples were kept at 4 oC before analysis and fractionated off-line on a BioBasic SCX
column (5μm, Thermo Electron, San Jose, USA) with an Agilent 1100 HPLC system. The
Tris fractions were separated in 10 salt fractions (0, 2, 4, 6, 10, 18, 26, 45, 100, 1000 mM
ammoniumchloride) loading 80 μl sample or salt with a flow of 10 μl/min (4% Acetonitril,
0.1% Formic Acid) for 30 min. The SDS fraction was separated in 5 fractions (0, 4, 18, 100,
1000 mM). Each salt-fraction was concentrated with a speedvac concentrator and injected
separately onto the second dimension for mass spectrometry (MS) analysis.
The second dimensional chromatographic separation was carried out with a home-packed
nanobored C18 column (75μm i.d x 10cm, 5μm particles) directly into a pico-frit nanospray
tip (New Objective, Wubrun, MA, USA), operating at a flow rate of 200 nL/min with a 65
min gradient. The LTQ was operated in a data-dependent mode by performing MS/MS scans
for the 5 most intense peaks from each MS scan. The MS was operated at an nanospray
by on May 19, 2011 atvb.ahajournals.orgDownloaded from

9
voltage of 1.8 kV; without shealth gas and auxiliary gas flow; ion transfer tube temperature of
180°C; collision gas pressure of 0.85 mTorr and normalized collision energy at 35% for
MS/MS. Ion selection threshold was set to 500 counts for initiating MS/MS while activation
q was set to 0.25 and activation time to 30 ms. The MS scan range was 400-1800 m/z.
Dynamic exclusion was activated with an exclusion duration of 1 min. For each salt-step
experiment, MS/MS (dta) spectra were extracted from the raw data files with the Biowork 3.3
program (ThermoFinnigan, San Jose, CA, USA).
Protein identification was achieved by searching the data from each salt-step against the IPI
human protein database (version 3.15, 58009 entries) using Sequest (Bioworks 3.3) allowing
a maximum of 3 missed cleavages with trypsin. Fixed modification was
carbaminomethylation and variable modification was oxidation of methionine. Results filters
used: for peptides XCorr set for z=1 at 1.5, z=2 at 2.5 and z=3 at 3.5 and for proteins protein
probability set at 1.00E-3.
Osteopontin was found as 1 of the proteins that was present in both technical replicas in the
event group and not present in both technical replicas of the event free control group.
PLAQUE PROCESSING
All carotid plaques were carefully dissected in the laboratory a dedicated technician into
0.5cm-thick cross-sectional segments along the longitudinal axis of the vessel. The plaque
segment showing the largest plaque burden was called the culprit lesion and was used for
histological analysis to determine plaque morphology. The definitions of each staining
category (H&E, Elastin von Gieson, picrosirius red, α-actin and CD68) have been described
previously13.
Levels of interleukin (IL)-6 and IL-8 were measured by a multiplex suspension array system
according to the manufacturer’s protocol (Bender Med Systems, Vienna, Austria). Matrix
by on May 19, 2011 atvb.ahajournals.orgDownloaded from

10
metalloproteinase (MMP)-2 and MMP-9 activities were measured using the Biotrak activity
assays RPN 2631 and RPN 2634 (Amersham Biosciences, Buckinghamshire, UK),
respectively.
IMMUNOHISTOCHEMISTRY
To make the OPN and CD68 epitopes accessible for the antibodies, sections were boiled in
citrate buffer. Mouse anti-human OPN (IBL, Gunma, Japan; dilution 1 : 250) and CD68
(NovaCastra, Newcastle, UK; dilution 1 : 400) monoclonal antibodies were used.
PowerVision Poly-AP-anti mouse IgG (Immunologic, Duiven, the Netherlands) and New-
Fuchsin solution were used to visualize the signal. All sections were counterstained with
hematoxylin. Isotype antibodies were used as negative control.
MIF IMMUNOASSAY
Macrophage Migration Inhibitory Factor (MIF) plaque levels were measured using a
multiplex immunoassay using recombinant MIF (R&D Systems, Abingdon, United
Kingdom), capture antibody: mouse monoclonal clone 12302.2 (R&D Systems, Abingdon,
United Kingdom) and a goat polyclonal detection antibody (R&D Systems, Abingdon,
United Kingdom). Assay conditions were as described before 22
by on May 19, 2011 atvb.ahajournals.orgDownloaded from
Recommended