
Ecological Applications, 16(5), 2006, pp. 1986–1999� 2006 by the Ecological Society of America
PATTERNS OF ANIMAL DIVERSITY IN DIFFERENT FORMSOF TREE COVER IN AGRICULTURAL LANDSCAPES
CELIA A. HARVEY,1 ARNULFO MEDINA,2 DALIA MERLO SANCHEZ,2 SERGIO VILCHEZ,2 BLAS HERNANDEZ,3
JOEL C. SAENZ,4 JEAN MICHEL MAES,3 FERNANDO CASANOVES,5 AND FERGUS L. SINCLAIR6,7
1Department of Agriculture and Agroforestry, Apdo. 7170, Centro Agronomico Tropical de Investigacion y Ensenanza,Turrialba, Costa Rica
2Fundacion Nicaraguense para la Conservacion, Apdo. C-212, Managua, Nicaragua3Museo Entomologico de Leon, Nicaragua, Apdo. 527 Leon, Nicaragua
4Instituto Internacional en Manejo y Conservacion de Vida Silvestre, Universidad Nacional de Costa Rica,Apdo. 1350–3000 Heredia, Costa Rica
5Department of Biometry, Apdo. 7170, Centro Agronomico Tropical de Investigacion y Ensenanza, Turrialba, Costa Rica6School of Agricultural and Forest Sciences, University of Wales, Bangor, Gwynedd LL57 2UW United Kingdom
Abstract. As tropical regions are converted to agriculture, conservation of biodiversitywill depend not only on the maintenance of protected forest areas, but also on the scope forconservation within the agricultural matrix in which they are embedded. Tree cover typicallyretained in agricultural landscapes in the neotropics may provide resources and habitats foranimals, but little is known about the extent to which it contributes to conservation of animalspecies. Here, we explore the animal diversity associated with different forms of tree cover forbirds, bats, butterflies, and dung beetles in a pastoral landscape in Nicaragua. We measuredspecies richness and abundance of these four animal taxa in riparian and secondary forest,forest fallows, live fences, and pastures with high and low tree cover. We recorded over 20 000individuals of 189 species including 14 endangered bird species. Mean abundance and speciesrichness of birds and bats, but not dung beetles or butterflies, were significantly differentamong forms of tree cover. Species richness of bats and birds was positively correlated withtree species richness. While the greatest numbers of bird species were associated with riparianand secondary forest, forest fallows, and pastures with .15% tree cover, the greatest numbersof bat species were found in live fences and riparian forest. Species assemblages of all animaltaxa were different among tree cover types, so that maintaining a diversity of forms of treecover led to conservation of more animal species in the landscape as a whole. Overall, thefindings indicate that retaining tree cover within agricultural landscapes can help conserveanimal diversity, but that conservation efforts need to target forms of tree cover that conservethe taxa that are of interest locally. Preventing the degradation of remaining forest fragmentsis a priority, but encouraging farmers to maintain tree cover in pastures and along boundariesmay also make an important contribution to animal conservation.
Key words: agricultural matrix; bat, bird, butterfly, and dung beetle diversity; biodiversity assessment;farming systems; forest fragments; live fences; Nicaragua; riparian forests; species richness; trees in pastures.
INTRODUCTION
With agriculture dominating many tropical regions
and rapidly encroaching on the last remaining forests
(Achard et al. 2002, Lambin et al. 2003), the conserva-
tion of biodiversity will depend not only on the
establishment of protected areas and reserves, but also
on the management of agricultural landscapes (Perfecto
and Vandermeer 1997, Daily 2001, Daily et al. 2001,
Brooks et al. 2004, Schroth et al. 2004, Green et al.
2005). Active management of the agricultural matrix is
important for conserving what biodiversity remains
within fragmented landscapes and for buffering the
effects of agriculture on nearby forests (Janzen 1983,
Glor et al. 2001, Naughton-Treves et al. 2003). Land
management options that seek to combine conservation
and production goals within agricultural landscapes
must be based on a clear understanding of what plant
and animal diversity remains in these landscapes, and
how the composition and structure of the agricultural
matrix influence its conservation potential. The con-
servation value of agricultural landscapes may vary for
different taxa (Burel et al. 2004), so multitaxa compar-
isons are urgently needed to evaluate the impacts of
different land uses on animal diversity. But because they
are difficult and costly to conduct (Lawton et al. 1998),
few have been published.
The conservation value of the tree cover that is
retained within agricultural matrices has generally been
overlooked. In the neotropics, tree cover in agricultural
landscapes typically occurs in the form of riparian
forests, forest fallows, live fences, and dispersed trees in
Manuscript received 25 August 2005; revised 3 February2006; accepted 24 February 2006. Corresponding Editor: S. L.Brown.
7 Corresponding author. E-mail: [email protected]
1986
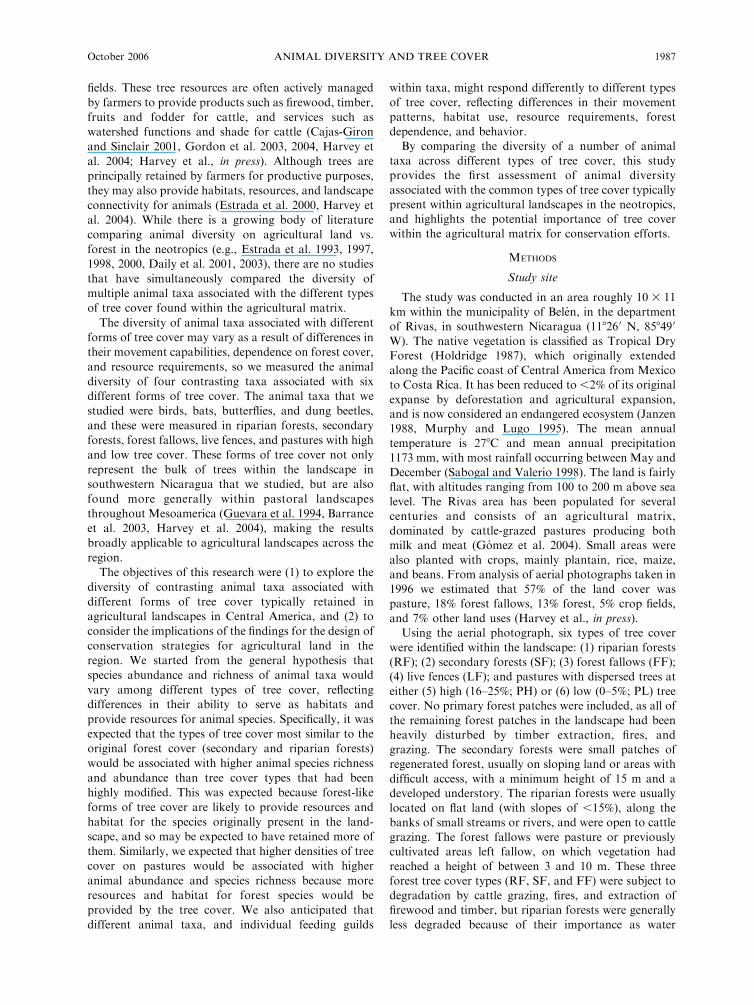
fields. These tree resources are often actively managed
by farmers to provide products such as firewood, timber,
fruits and fodder for cattle, and services such as
watershed functions and shade for cattle (Cajas-Giron
and Sinclair 2001, Gordon et al. 2003, 2004, Harvey et
al. 2004; Harvey et al., in press). Although trees are
principally retained by farmers for productive purposes,
they may also provide habitats, resources, and landscape
connectivity for animals (Estrada et al. 2000, Harvey et
al. 2004). While there is a growing body of literature
comparing animal diversity on agricultural land vs.
forest in the neotropics (e.g., Estrada et al. 1993, 1997,
1998, 2000, Daily et al. 2001, 2003), there are no studies
that have simultaneously compared the diversity of
multiple animal taxa associated with the different types
of tree cover found within the agricultural matrix.
The diversity of animal taxa associated with different
forms of tree cover may vary as a result of differences in
their movement capabilities, dependence on forest cover,
and resource requirements, so we measured the animal
diversity of four contrasting taxa associated with six
different forms of tree cover. The animal taxa that we
studied were birds, bats, butterflies, and dung beetles,
and these were measured in riparian forests, secondary
forests, forest fallows, live fences, and pastures with high
and low tree cover. These forms of tree cover not only
represent the bulk of trees within the landscape in
southwestern Nicaragua that we studied, but are also
found more generally within pastoral landscapes
throughout Mesoamerica (Guevara et al. 1994, Barrance
et al. 2003, Harvey et al. 2004), making the results
broadly applicable to agricultural landscapes across the
region.
The objectives of this research were (1) to explore the
diversity of contrasting animal taxa associated with
different forms of tree cover typically retained in
agricultural landscapes in Central America, and (2) to
consider the implications of the findings for the design of
conservation strategies for agricultural land in the
region. We started from the general hypothesis that
species abundance and richness of animal taxa would
vary among different types of tree cover, reflecting
differences in their ability to serve as habitats and
provide resources for animal species. Specifically, it was
expected that the types of tree cover most similar to the
original forest cover (secondary and riparian forests)
would be associated with higher animal species richness
and abundance than tree cover types that had been
highly modified. This was expected because forest-like
forms of tree cover are likely to provide resources and
habitat for the species originally present in the land-
scape, and so may be expected to have retained more of
them. Similarly, we expected that higher densities of tree
cover on pastures would be associated with higher
animal abundance and species richness because more
resources and habitat for forest species would be
provided by the tree cover. We also anticipated that
different animal taxa, and individual feeding guilds
within taxa, might respond differently to different types
of tree cover, reflecting differences in their movementpatterns, habitat use, resource requirements, forest
dependence, and behavior.By comparing the diversity of a number of animal
taxa across different types of tree cover, this studyprovides the first assessment of animal diversity
associated with the common types of tree cover typicallypresent within agricultural landscapes in the neotropics,and highlights the potential importance of tree cover
within the agricultural matrix for conservation efforts.
METHODS
Study site
The study was conducted in an area roughly 10 3 11
km within the municipality of Belen, in the departmentof Rivas, in southwestern Nicaragua (118260 N, 858490
W). The native vegetation is classified as Tropical DryForest (Holdridge 1987), which originally extended
along the Pacific coast of Central America from Mexicoto Costa Rica. It has been reduced to ,2% of its original
expanse by deforestation and agricultural expansion,and is now considered an endangered ecosystem (Janzen1988, Murphy and Lugo 1995). The mean annual
temperature is 278C and mean annual precipitation1173 mm, with most rainfall occurring between May and
December (Sabogal and Valerio 1998). The land is fairlyflat, with altitudes ranging from 100 to 200 m above sea
level. The Rivas area has been populated for severalcenturies and consists of an agricultural matrix,
dominated by cattle-grazed pastures producing bothmilk and meat (Gomez et al. 2004). Small areas were
also planted with crops, mainly plantain, rice, maize,and beans. From analysis of aerial photographs taken in
1996 we estimated that 57% of the land cover waspasture, 18% forest fallows, 13% forest, 5% crop fields,
and 7% other land uses (Harvey et al., in press).Using the aerial photograph, six types of tree cover
were identified within the landscape: (1) riparian forests(RF); (2) secondary forests (SF); (3) forest fallows (FF);
(4) live fences (LF); and pastures with dispersed trees ateither (5) high (16–25%; PH) or (6) low (0–5%; PL) treecover. No primary forest patches were included, as all of
the remaining forest patches in the landscape had beenheavily disturbed by timber extraction, fires, and
grazing. The secondary forests were small patches ofregenerated forest, usually on sloping land or areas with
difficult access, with a minimum height of 15 m and adeveloped understory. The riparian forests were usually
located on flat land (with slopes of ,15%), along thebanks of small streams or rivers, and were open to cattle
grazing. The forest fallows were pasture or previouslycultivated areas left fallow, on which vegetation had
reached a height of between 3 and 10 m. These threeforest tree cover types (RF, SF, and FF) were subject to
degradation by cattle grazing, fires, and extraction offirewood and timber, but riparian forests were generally
less degraded because of their importance as water
October 2006 1987ANIMAL DIVERSITY AND TREE COVER

sources. The live fences were anthropogenic features
consisting of single lines of trees that had been planted
to divide paddocks, prevent cattle movement, or to
delimit farm boundaries (Harvey et al. 2005). Pastures
were dominated by Jaragua grass (Hyperrhenia rufa) and
were extensively grazed by cattle (1.4 6 0.8 livestock
units/ha; mean 6 SE [Gomez et al. 2004]). Most of the
dispersed trees in pastures had regenerated after initial
clearance, but there were a few relicts of the original
forest.
Data collection
For each type of tree cover, eight replicate sample
areas were randomly chosen from the aerial photograph.
Each of these 48 sample areas was visited to ensure that
it was of sufficient size for the monitoring protocol to be
established. This required establishment of a square 1-ha
plot for secondary forests, forest fallows, and pastures, a
rectangular 1-ha plot of 5003 20 m for riparian forests,
and a linear plot of 350 m 3 2 m for live fences. Live
fences were not selected if they were next to a busy road.
Sample areas that did not fulfill these criteria were
replaced with another randomly chosen area.
Each plot was sampled for two days between April
and December 2002 for trees, birds, bats, dung beetles,
and butterflies. The mean distance between all combi-
nations of plots was 4.84 6 0.077 km, and because of
the fine-grained fragmentation of the landscape, there
was no observable spatial pattern in the distribution of
sample areas for any tree cover type. In each sampling
excursion, one plot of each type of tree cover was
sampled in random order. The methods for sampling
each taxon are explained below.
Trees
To characterize tree cover, a subplot was established
within each plot. In the secondary forests, forest fallows,
and pastures, trees were surveyed in a 203 50 m subplot
(0.1 ha), located randomly in one of the four corners of
the main plot. In the riparian forests, a subplot of 1003
10 m (0.1 ha) was established, because the linear nature
of the riparian forest did not permit wider plots. Live
fences were characterized by doing a complete inventory
of trees present within a 350 m length of live fence.
In the subplots, all trees with dbh .10 cm (stem
diameter at 1.3 m height) were identified and their dbh
measured. When trees could not be identified in the field,
a botanical sample was collected for later identification
in the National Herbarium of the Universidad Cen-
troamericana (UCA), Nicaragua using the Flora of
Nicaragua (Stephens et al. 2001).
Birds
Four point count stations were located in each plot,
100 m apart. In the square plots, the point counts were
located in the four corners of the 1-ha plot, whereas in
the linear plots, the point counts were located in a line.
Birds were observed at each point count during 10
minutes, with observations being conducted between
06:00 and 07:40 hours during two consecutive days per
plot. This gave a total of eight point counts (80 minutes
of observation) per plot and 64 point counts (four point
counts 3 2 days 3 8 replicates; or 640 minutes of
observation) per type of tree cover. All observed birds
were recorded and identified and classified by their
feeding guild using Stiles and Skutch (1989). A settling
period of five minutes was used before observations
commenced, and days with heavy rain or high winds
were avoided.
Bats
Bats were sampled using eight mist nets (each 123 2.5
m wide, with mesh size of 1.5 cm) positioned at a distance
of 50 m apart. In the secondary forests, forest fallows,
and two types of pastures, the nets were positioned in a
circle with a 55-m radius, whereas in the linear tree cover
types (riparian forests and live fences) mist nets were in a
line. Each mist net was located at a distance of 50 m from
the nearest net. Mist nets were open from 18:30 to 01:00
hours during two nights in each plot, for a total of 104
mist net hours per plot and 832 hours per type of tree
cover. All captured bats were removed from the mist nets
and identified to species level using keys by Laval and
Rodriguez (2002) and Reid (1997). The hair on the bats’
heads was cut to enable recognition in subsequent
captures and avoid counting the same bat twice. Each
bat species was also classified by feeding guild using
Laval andRodriguez (2002) andReid (1997). Nights with
heavy rain, high winds, or a full moon were avoided.
Dung beetles
Dung beetle populations were surveyed using 32
pitfall traps per plot baited with pig dung. In the
secondary forests, forest fallows, and two types of
pastures, the 32 traps were located in two square grids of
16 traps, with traps 7 m apart. In the linear tree cover
types (riparian forests and live fences), the 32 traps were
placed in a line, with traps 7 m apart. Each pitfall trap
consisted of a 355-mL plastic cup, 17 cm in diameter at
the top, filled with soapy water and buried in the soil,
with a wire mesh on top supporting the dung. In each
plot, the pitfall traps were left outside for two
consecutive nights. All beetles were collected and taken
to the Museo Entomologico de Leon for identification
by B. Hernandez and J. M. Maes.
Butterflies
In each plot, three transects were established for
trapping butterflies. Each transect was 100 m long and
separated from the other transects by 50 m, except in live
fences where they were contiguous. Each transect was
walked for 30 minutes each day for two days, during
which time all butterflies seen were collected with a
collecting net. This resulted in a sampling effort of 3
hours in each plot and 24 hours in each type of tree cover.
To avoid possible misidentification of species, only
CELIA A. HARVEY ET AL.1988 Ecological ApplicationsVol. 16, No. 5

butterflies that were captured were recorded. Butterflies
were identified using DeVries (1987, 1997) and by J. M.Maes at the Museo Entomologico de Leon, Nicaragua.
Each species was characterized as either a frugivore ornectarivore according to DeVries (1987, 1997), Maes and
Brabant (2000), and local experience. Days with heavyrain and high winds were avoided.
Data analysis
For each taxon we compared the total species richness
and abundance per plot across the six types of tree coverusing ANOVA for normally distributed data (followed
by Duncan comparisons) or Kruskal-Wallis for non-normally distributed data (followed by pairwise compar-
isons). For the taxa where feeding guild data wereavailable (birds, bats, and butterflies), we similarly
compared differences in species richness and abundanceof different guilds, among the forms of tree cover.
Differences across tree cover forms were only comparedfor guilds that represented .10% of the total abundance
of a particular taxon (for birds, frugivores, insectivores,and omnivores; for bats, frugivores and insectivores; for
butterflies, frugivores and nectarivores), to ensuresufficient data for comparisons across tree cover types.The sampling effort for birds, bats, butterflies, and
beetles was identical across the six types of tree cover, soall comparisons weremade using the total abundance and
species richness (of all species or of a particular feedingguild) recorded in each plot. Because the total area of
vegetation sampled for live fences differed from the othertypes of tree cover, live fences were not included in the
analyses comparing tree species richness or abundance.The degree of similarity in species composition among
pairs of tree cover types was calculated using the Jaccardsimilarity index (Magurran 2004). In addition, cluster
analyses of species were conducted in Biodiversity Prov7 (Biodiversity Pro 1997) using Bray-Curtis similarity
and average linkage method to explore similarity inspecies assemblages across tree cover types. To explore
relationships among the species richness of trees, birds,bats, butterflies, and dung beetles we used pairwise
Pearson’s correlations (Sokal and Rohlf 1995). For eachtaxon, the total number of species expected to be presentin the landscape was estimated by creating species–area
accumulation curves for the entire landscape in EcoSimv5 (EcoSim 2000), and then applying the Clench
equation (Clench 1979) to estimate expected speciesrichness. Species–area curves were constructed on the
basis of individuals sampled, rather than the number ofplots, as recommended by Gotelli and Colewell (2001).
All statistical analyses were conducted in InfoStat v1.4(2004).
RESULTS
Floristic and structural comparison of different formsof tree cover
The different forms of tree cover found in the Rivaslandscape varied in their tree species richness and
abundance (Table 1). The mean number of individual
trees and tree species per plot was higher for all forest
forms of tree cover than for pastures. Among forest
forms, riparian forest had more trees than forest fallows
and more species than both secondary forest and forest
fallows. While not statistically comparable because of
different sampling effort, live fences were closer to forest
fallows than pasture in terms of tree abundance and
species richness. Riparian forests, secondary forests, and
forest fallows were characterized by tree species typical
of tropical dry forest (Gillespie et al. 2000), whereas
pastures with high and low tree cover tended to be
dominated by species deliberately planted or retained by
farmers for timber or fodder. Live fences were domi-
nated by planted species (Gliricidia sepium and Pachira
quinata), but also included a few individuals of 32 other
tree species that had naturally regenerated. The different
forms of tree cover also varied in their structure, with
taller trees in riparian forests and secondary forests than
in all other forms of tree cover. Trees in the riparian
forests and live fences had larger diameters than those in
pastures with high tree cover.
Animal abundance and species richness associated
with different forms of tree cover
More than 20 000 individual animals were sampled,
comprising a particularly large number of dung beetles,
many birds and bats, but fewer butterflies. There were
generally more individuals and species of birds and dung
beetles sampled in forest forms of tree cover than in
pastures or live fences (Table 2). Bats were sampled in
greatest numbers in riparian forests and live fences,
while butterflies were most abundant, but least species
rich, in pastures with low tree cover (Table 2). Modeled
estimates of total landscape species richness were higher
than the numbers of species that we recorded for birds
(89), bats (26), and butterflies (61).
Mean abundance and species richness per plot were
significantly different among forms of tree cover for
birds and bats but not for dung beetles and butterflies
(Fig. 1). While abundance was correlated with species
richness for birds, dung beetles, and butterflies, use of
abundance as a covariate did not change the results.
Riparian forest had significantly higher abundance of
both birds and bats than all other forms of tree cover,
whereas pastures with low tree cover hosted the smallest
number of individuals of both taxa. For birds, both
abundance and species richness were higher in the forest
forms of tree cover than in live fences and pastures with
low tree cover, but pastures with high tree cover were
not different from any forest forms in species richness,
or from forest fallows in abundance. For bats, live
fences were important, hosting the second highest
number of individuals and species, and bat species
richness was significantly higher in riparian forests and
live fences than secondary forest and pastures with low
tree cover.
October 2006 1989ANIMAL DIVERSITY AND TREE COVER

When taxa were classified into feeding guilds, some
guilds followed the same pattern of abundance and
species richness as their parent taxon, while others did
not, and for the same guilds, different taxa were favored
by different forms of tree cover (Fig. 1; Table 3).
Abundance and species richness of frugivorous bats
(83.2% of all bats) and birds (12% of all birds) showed
the same pattern in relation to tree cover as their parent
taxa. In contrast, frugivorous butterflies (24.3% of all
butterflies) were more abundant and species rich in
forest fallows and secondary forests than in the more
open pastures, whereas the undivided butterfly taxon
was not significantly different among tree cover types.
So, the various frugivorous taxa responded differently
from one another to the different forms of tree cover.
Riparian forest had the highest abundance and species
richness of frugivorous birds and bats but not butter-
flies, and live fences were particularly important for
frugivorous bat species richness but not for frugivorous
birds or butterflies.
Nectarivorous bats (11.7% of all bats) showed similar
patterns of abundance to the overall bat community, but
did not significantly differ in species richness (Fig. 1;
Table 3) whereas nectarivorous butterflies (75.7% of all
butterflies) showed no significant differences across
different forms of tree cover in either abundance or
species richness from that of their parent taxon.
Insectivorous birds (40.8% of all birds) showed similar
responses to all birds in both abundance and species
richness (Table 3), whereas omnivorous birds (16.7% of
all birds) showed no differences in either abundance or
species richness across different forms of tree cover.
Species composition of animal taxa associated with
different forms of tree cover
There are no definitive species lists for any of the taxa
that we studied for tropical dry forest in Nicaragua, but
TABLE 1. Structural and floristic characteristics of six forms of tree cover in Rivas, Nicaragua.
Tree characteristics RF SF
Total no. individuals 298 251Total no. species 69 51Mean no. species/0.1 ha� 18.9a 6 0.33 12.4b 6 0.35Mean no. individuals/0.1 ha� 37.3a 6 0.34 31.4ab 6 0.85Mean dbh (cm) 31.25a 6 2.33 26.52ab 6 2.90Mean tree height (m) 15.41a 6 0.89 14.87a 6 1.29Five most abundant tree species(in order of decreasing abundance)
Thouinidium decandrum,Guazuma ulmifolia,Simarouba amara,Calycophyllum candidissimum,Spondias mombin
Cochlospermum vitifolium,Guazuma ulmifolia,Calycophyllum candidissimum,Spondias mombin,Gliricidia sepium
Notes: Forest cover types: RF, riparian forests; SF, secondary forests; FF, forest fallows; LF live fences; PH, pastures with hightree cover; PL, pastures with low tree cover. Trees with dbh . 10 cm were measured in eight subplots in each tree cover type. Valueswith error terms are means 6 SE. Different superscript letters in the same row indicate significant differences (P , 0.05), byANOVA or Kruskal-Wallis analyses.
� Subplots were 0.1 ha except for live fences (LF), where they were 350 3 2 m (700 m2). Live fences were not included in thestatistical comparisons of species richness or abundance because of the difference in sampling effort.
TABLE 2. Total number of individuals and species sampled across the different tree cover types for four animal taxa in Rivas,Nicaragua.
Taxon
No. samplesTotal
(48 plots)RF SF FF LF PH PL
Birds
Individuals 486 369 340 199 253 193 1840Species 42 49 42 32 41 35 83
Bats
Individuals 770 290 283 440 296 220 2299Species 19 14 14 18 15 14 24
Dung beetles
Individuals 2565 3626 2867 2522 2288 1759 15 627Species 23 29 28 24 24 20 32
Butterflies
Individuals 97 74 96 68 79 145 559Species 27 22 26 25 22 18 50
Notes: Forest cover types: RF, riparian forests; SF, secondary forests; FF, forest fallows; LF, live fences; PH, pastures with hightree cover; PL, pastures with low tree cover (n¼8 plots per tree cover type). Sampling effort was identical across all six types of treecover for each animal taxon.
CELIA A. HARVEY ET AL.1990 Ecological ApplicationsVol. 16, No. 5

all the species that we recorded have been also been
observed in tropical dry forest elsewhere in Central
America. We recorded 14 endangered bird species, 13 on
CITES Appendix 2 and one on Appendix 3 (IUCN
1999). Most of these were recorded in very low numbers
(,20 individuals), four of which (Asturina nitida,
Ciccaba virgata, Otus cooperi, and Phaethornis longue-
mareus) were only observed in forest forms of tree cover.
Three of the four species more frequently encountered
(Amazilia rutila, Amazona albifrons, and Brotogeris
jugularis) were found in all forms of tree cover, while
Aritinga nana was found in all cover types except
secondary forest. There is not enough information about
the conservation status of butterfly, bat, and dung beetle
species in Nicaragua to identify whether the species
recorded are of conservation concern (Martınez Sanchez
et al. 2001).
The majority of the 10 most common species in all
taxa were generalist species that were observed in all
types of tree cover: all 10 of the most common dung
beetle and bat species, 8 of the most common birds, and
7 of the most common butterflies (Table 4). In contrast,
the species of all taxa that were found only in forest
forms of tree cover (RF, SF, and FF) were present only
at low abundances. We observed 27 bird species (437
individuals) in Rivas that have been classified as forest
dependent (Stiles 1983), of which we saw only 16 in
forest forms of tree cover, 10 in both forest and
nonforest forms of tree cover, and one, Lophornis
helenae, only once in a pasture with low tree cover.
FIG. 1. Abundance of individuals and species richness of (A) birds, (B) bats, (C) dung beetles, and (D) butterflies in six types oftree cover: riparian (RF) and secondary (SF) forests, forest fallows (FF), live fences (LF), and pastures with high (PH), and low(PL) tree cover in the agricultural matrix of Rivas, Nicaragua. Bars show the mean (6SE) abundance (open bars) and speciesrichness (gray bars) per plot (1 ha for all forms except the live fences [LF], which were 350 m long) for n¼8 plots in each type of treecover. Different letters in the same column series indicate significant differences among tree cover types (P , 0.05), from ANOVA(F ) or Kruskal-Wallis (H ) analyses. Details on sampling effort per group can be found in the Methods section.
TABLE 1. Extended.
FF LF� PH PL
196 305 62 2545 34 20 17
9.9b 6 0.40 9.1 6 0.12 4.5c 6 0.30 2.9c 6 0.6924.5b 6 1.09 38.1 6 0.54 7.8c 6 0.42 3.13c 6 0.79
23.31ab 6 2.40 29.32a 6 4.20 18.99b 6 1.92 26.66ab 6 5.4010.20bc 6 1.12 11.94b 6 0.82 10.61bc 6 0.62 8.87c 6 0.84
Guazuma ulmifolia,Cochlospermum vitifolium,Dalbergia retusa,Myrospermum frutescens,Calycophyllum candidissimum
Gliricidia sepium,Cordia dentata,Pachira quinata,Myrospermum frutescens,Tabebuia rosea
Cordia alliodora,Gliricidia sepium,Karwinskia calderonii,Byrsonima crassifolia,Guazuma ulmifolia
Guazuma ulmifolia,Tabebuia rosea,Cordia alliodora,Gliricidia sepium,Diphysa americana
October 2006 1991ANIMAL DIVERSITY AND TREE COVER

Four of the bat species, observed only once each in
Rivas, are considered highly forest dependent. These
were Chrotopterus auritus and Micronycteris hirsuta
observed in riparian forest, Natalus stramineus in a
secondary forest, and Saccopteryx leptura in a live fence.
Forest dependency of most of the dung beetle and
butterfly species is not known (Martınez Sanchez et al.
2001), but at least one dung beetle species that we
captured in all habitats, Magioniella astyanax, has been
previously reported as a forest species (Escobar 1997).
The species composition of all taxa (birds, bats, dung
beetles, and butterflies) varied among different forms of
tree cover, with pairs of different types of tree cover
sharing 32.7–54.5% of all bird species, 52–81% of all bat
species, 63–88% of the dung beetle species, and 27–65%
of all butterfly species. In all taxa, less than half of the
species were found in all six forms of tree cover (12 of 83
bird species, 11 of 24 bat species, 15 of 32 dung beetle
species, and 5 of 50 butterfly species).
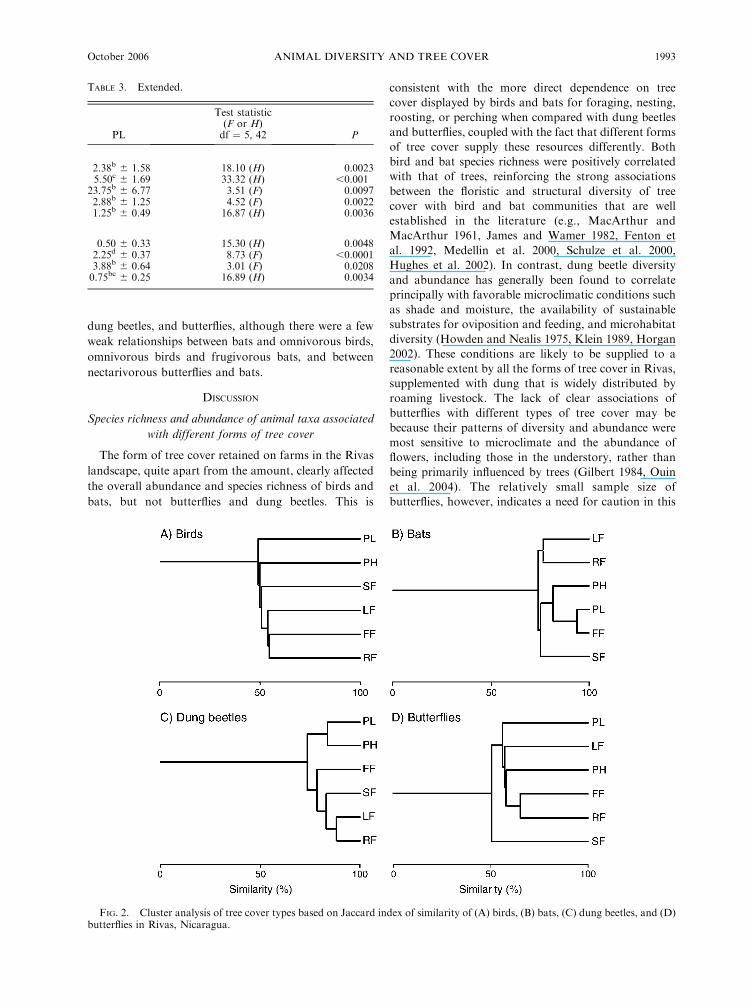
When the forms of tree cover were grouped using
dendrograms of Bray-Curtis similarity indices, that take
both species richness and abundance into account,
distinct patterns for different animal taxa emerged
(Fig. 2). For birds, riparian forests, forest fallows, and
live fences were the most similar tree cover types and
were distinct from other forms of tree cover. Bats, in
contrast, showed three main groups of tree cover: (1) live
fences and riparian forests; (2) pastures with high tree
cover, pastures with low tree cover, and forest fallows;
and (3) secondary forests. Dung beetle composition
differed between the pastures and other types of tree
cover, while butterflies had a distinct composition in
secondary forests compared to all other forms of tree
cover.
Correlations in species richness and diversity among taxa
The total number of tree species was positively
correlated with the species richness of all birds,
frugivorous birds, insectivorous birds, all bats, frugivo-
rous bats, and frugivorous butterflies, but not with
omnivorous birds, insectivorous bats, nectarivorous
bats, dung beetles, all butterflies, or nectarivorous
butterflies (Table 5). There were no clear general
associations between species richness of birds, bats,
TABLE 4. Lists of the 10 most common bird, bat, butterfly, and dung beetle species recorded at Rivas, Nicaragua, and thepercentage of total observations in each taxon that they represented.
Birds (n ¼ 1840) Bats (n ¼ 2299) Butterflies (n ¼ 559) Dung beetles (n ¼ 15 627)
Species % Species % Species % Species %
Thryothorus pleurostictus 10.6 Artibeus jamaicensis 40.4 Phoebis sennae 23.1 Onthophagus championi 23.3Calocitta formosa 9.2 Artibeus lituratus 12.9 Heliconius charithonius 6.4 Canthon cyanellus sallei 19.7Amazona albifrons 7.3 Carollia perspicillata 11.1 Euptoieta hegesia 5.2 Canthon deyrollei 14.8Campylorhynchus rufinucha 7.1 Glossophaga soricina 10.9 Eurema daira 5.2 Copris lugubris 8.1Crotophaga sulcirostris 5.8 Sturnira lilium 6.2 Dryas iulia 4.5 Ateuchus rodriguezi 7.8Dendroica petechia 5.0 Desmodus rotundus 4.2 Heliconius hecale zuleika 4.5 Onthophagus marginicollis 6.5Brotogeris jugularis 4.0 Artibeus intermedius 4.0 Myscelia pattenia 3.9 Onthophagus batesi 6.1Myiarchus tuberculifer 3.8 Carollia subrufa 2.6 Siproeta stelenes 3.9 Deltochilum lobipes 2.5Melanerpes hoffmannii 3.5 Phyllostomus discolor 2.4 Vareuptychia similis 3.8 Onthophagus landolti 1.9Aimophila ruficauda 3.1 Artibeus phaeotis 1.7 Junonia evarete 3.6 Dichotomius yucatanus 1.9
TABLE 3. Abundance and species richness of animal feeding guilds in six tree cover types in the agricultural matrix of Rivas,Nicaragua.
Guild RF SF FF LF PH
Abundance (no. individuals)
Frugivorous birds 11.75a 6 2.93 4.38ab 6 1.28 3.38b 6 1.00 1.38b 6 0.56 3.13b 6 0.79Insectivorous birds 28.25a 6 1.94 23.12a 6 2.80 18.50ab 6 2.57 8.13c 6 1.08 10.38bc 6 2.31Frugivorous bats 77.63 a 6 19.01 29.75b 6 7.49 29.38b 6 8.17 46.13b 6 7.88 32.28b 6 9.43Nectarivorous bats 13.00a 6 3.21 5.13b 6 1.72 4.38b 6 1.21 5.50b 6 1.24 2.88b 6 1.04Frugivorous butterflies 2.73ab 6 0.94 5.13a 6 1.46 4.38a 6 1.00 2.50ab 6 0.87 0.63b 6 0.32
Species richness (no. species)
Frugivorous birds 2.25a 6 0.37 1.25ab 6 0.31 1.38ab 6 0.18 0.50b 6 0.19 1.25ab 6 0.31Insectivorous birds 6.13ab 6 0.44 6.38a 60.42 5.25ab 6 0.59 3.38cd 6 0.32 4.63bc 6 0.94Frugivorous bats 7.13a 6 0.58 4.50b 6 0.57 5.63ab 6 0.86 6.75a 6 0.65 5.50ab 6 1.00Frugivorous butterflies 2.25ab 6 0.62 2.88a 6 0.64 3.50a 6 0.89 2.13ab 6 0.64 0.50c 6 0.27
Notes: Forest cover types: RF, riparian forests; SF, secondary forests; FF, forest fallows; LF, live fences; PH, pastures with hightree cover; PL, pastures with low tree cover (n ¼ 8 plots per tree cover type). Only guilds with significant differences among treecover types, based on ANOVA (F ) or Kruskal-Wallis (H ) analyses, are shown (P , 0.05), with different superscript letters in thesame row indicating these differences. Details on sampling effort per group can be found in Methods. Values with error terms aremeans 6 SE.
CELIA A. HARVEY ET AL.1992 Ecological ApplicationsVol. 16, No. 5
dung beetles, and butterflies, although there were a few
weak relationships between bats and omnivorous birds,
omnivorous birds and frugivorous bats, and between
nectarivorous butterflies and bats.
DISCUSSION
Species richness and abundance of animal taxa associated
with different forms of tree cover
The form of tree cover retained on farms in the Rivas
landscape, quite apart from the amount, clearly affected
the overall abundance and species richness of birds and
bats, but not butterflies and dung beetles. This is
consistent with the more direct dependence on tree
cover displayed by birds and bats for foraging, nesting,
roosting, or perching when compared with dung beetles
and butterflies, coupled with the fact that different forms
of tree cover supply these resources differently. Both
bird and bat species richness were positively correlated
with that of trees, reinforcing the strong associations
between the floristic and structural diversity of tree
cover with bird and bat communities that are well
established in the literature (e.g., MacArthur and
MacArthur 1961, James and Wamer 1982, Fenton et
al. 1992, Medellin et al. 2000, Schulze et al. 2000,
Hughes et al. 2002). In contrast, dung beetle diversity
and abundance has generally been found to correlate
principally with favorable microclimatic conditions such
as shade and moisture, the availability of sustainable
substrates for oviposition and feeding, and microhabitat
diversity (Howden and Nealis 1975, Klein 1989, Horgan
2002). These conditions are likely to be supplied to a
reasonable extent by all the forms of tree cover in Rivas,
supplemented with dung that is widely distributed by
roaming livestock. The lack of clear associations of
butterflies with different types of tree cover may be
because their patterns of diversity and abundance were
most sensitive to microclimate and the abundance of
flowers, including those in the understory, rather than
being primarily influenced by trees (Gilbert 1984, Ouin
et al. 2004). The relatively small sample size of
butterflies, however, indicates a need for caution in this
FIG. 2. Cluster analysis of tree cover types based on Jaccard index of similarity of (A) birds, (B) bats, (C) dung beetles, and (D)butterflies in Rivas, Nicaragua.
TABLE 3. Extended.
PL
Test statistic(F or H)df ¼ 5, 42 P
2.38b 6 1.58 18.10 (H) 0.00235.50c 6 1.69 33.32 (H) ,0.001
23.75b 6 6.77 3.51 (F) 0.00972.88b 6 1.25 4.52 (F) 0.00221.25b 6 0.49 16.87 (H) 0.0036
0.50 6 0.33 15.30 (H) 0.00482.25d 6 0.37 8.73 (F) ,0.00013.88b 6 0.64 3.01 (F) 0.02080.75bc 6 0.25 16.89 (H) 0.0034
October 2006 1993ANIMAL DIVERSITY AND TREE COVER

interpretation and suggests that further research using
complementary techniques to those in the present study,
such as baited traps, would be merited to evaluate more
thoroughly the possible associations between butterfly
populations and tree cover (Sparrow et al. 1994).
For the birds and bats, where significant associations
were found with different tree cover types, there were
differences in which forms of tree cover hosted most
species and individuals. Whereas the greatest bird
species richness and abundance was associated with
high tree cover forms (secondary forests and riparian
forests, forest fallows and pastures with high tree cover),
bat species richness and abundance was greatest in linear
tree features (riparian forests and live fences). There
were also some common patterns across the two taxa:
riparian forests were important for both birds and bats,
and pastures with low tree cover had the lowest
abundance of both these taxa. Our sampling spanned
several months, so differences in mean species richness
among tree cover types may reflect not only how many
species are present at any point in time, but also the
species turnover through time. Animal species turnover
through time has been found to vary markedly in
different vegetation types within fragmented landscapes
(Moreno and Halffter 2001, Arellano and Halffter
2003).
The high abundance and species richness of birds
associated with high tree cover was largely explained by
the presence of many frugivorous and insectivorous
species, reflecting the availability of foraging, nesting,
and perching sites provided by these structurally and
floristically diverse types of tree cover. In contrast,
pastures with low tree cover and live fences hosted less
diverse bird communities than areas with higher tree
cover, as has been reported elsewhere (Saab and Petit
1992, Estrada et al. 1993, 1997). This low bird
abundance and species richness in more open forms of
tree cover may not only reflect less resources provided
by trees, but also a greater exposure to raptors (Estrada
et al. 1997) and to weather extremes (Wilson et al. 2005).
The number of bird species in live fences depends on
their composition and structure, with taller, denser live
fences supporting higher species richness (Harvey et al.
2005). Live fences at Rivas might support more forest-
dependent bird species if they were denser and more
structurally and floristically complex (Hinsley and
Bellamy 2000). In particular, the abundance and species
richness of frugivorous birds within live fences might be
increased by inclusion of more tree species that produce
edible fruits for birds.
For bats, the two most important types of tree cover
were linear features, the riparian forests and live fences.
Riparian forests have been reported to be key habitats
for bats and other animal species in tropical dry forest
ecosystems, particularly during dry months when many
animals retreat to these areas to find refuge, seasonal
food, and water (Ceballos 1995, Stoner 2001). In the
Rivas landscape, the riparian forests were the most
floristically diverse forms of tree cover, and presumably
offered a wide range of food resources for bats. From
observations during the research, the hollow trees and
cavernous rooting systems along the river banks also
appeared to be important roosting sites for some bat
species. The high species richness and abundance of bats
found in live fences could be explained by a number of
factors, such as enhanced insect availability on the
leeward side of live fences (Epila 1986, Dix and
Leatherman 1988, Estrada and Coates-Estrada 2001),
the availability of fruits attractive to frugivorous bats
(e.g., Cordia dentata, Mangifera indica, Spondias mom-
bin, and Spondias purpurea), the presence of tree species
pollinated by bats (e.g., Pachira quinata), the preference
for bats to travel along live fences to reduce energy costs
and avoid predation by nocturnal birds (Estrada and
Coates-Estrada 2001), and the use of linear elements as
sonar guidelines that facilitate movement across the
TABLE 5. Relationships between species richness of trees, birds, bats, dung beetles, butterflies, and their feeding guilds.
GroupBirds(all)
Fbirds
Ibirds
Obirds
Bats(all)
Fbats
Ibats
Nbats
Dungbeetles (all)
Butterflies(all)
Fbutterflies
Nbutterflies
Trees 0.44** 0.41** 0.39** 0.35 0.43** 0.36** 0.22 0.22 0.12 0.13 0.37** 0.07Birds (all) 0.23 0.40** 0.22 0.23 0.21 0.14 0.12 0.11 0.13 0.32* 0.11F birds 0.40** 0.44** 0.19 0.22 0.14 0.04 0.05 �0.12 0.12 �0.15I birds 0.16 0.07 0.05 0.14 0.04 0.11 0.03 0.24 0.04O birds 0.33* 0.39** �0.04 0.26 �0.06 0.06 0.14 �0.004Bats (all) 0.96*** 0.18 0.59*** 0.11 0.17 0.14 0.32*F bats �0.01 0.52*** 0.06 0.15 0.08 0.31*I bats �0.07 0.24 �0.01 0.10 �0.07N bats 0.04 0.22 0.24 0.18Dung beetles(all)
0.17 0.04 0.25
Butterflies(all)
0.34* 0.79***
F butterflies �0.08
Notes: Feeding guilds are: F, frugivorous; I, insectivorous; O, omnivorous; N, nectarivorous. The numbers represent thecorrelations of species richness (Pearson’s r), and asterisks indicate the levels of significance of the correlations: *P , 0.05; **P ,0.01; ***P , 0.001. Values without asterisks were not statistically significant. See Correlations in species richness and diversityamong taxa.
CELIA A. HARVEY ET AL.1994 Ecological ApplicationsVol. 16, No. 5

landscape (Limpens and Kapteyn 1989, Verboom and
Huitema 1997).
In most cases, the feeding guilds within taxa followed
the same patterns of abundance and species richness as
their parent taxon, but frugivorous butterflies had
higher abundance and species richness in the forest
forms of tree cover than in pastures, while butterflies as
a whole showed no significant differences among forms
of tree cover. This probably reflects the greater depend-
ence on fruiting plants and trees present in the more
forest-like forms of tree cover, for frugivorous as
compared with nectarivorous butterflies.
The same feeding guilds in different taxa showed
different patterns of species richness and abundance
across tree cover types, indicating that they either feed
on different tree species, or that provision of food
resources by trees was not the dominant influence on the
use of the tree cover by these species. So, while
frugivorous birds and bats were most abundant and
species rich in riparian forest, frugivorous bats but not
birds were also abundant and species rich in live fences.
In even more marked contrast, frugivorous butterflies
were most abundant in forest fallows and secondary
forests. These differences reflect the fact that dietary
overlap between frugivorous birds and bats is low, as
each taxon selects different types of fruits with varying
sizes, shapes, colors, and location (Palmeirin et al. 1989,
Gorchov et al. 1995). Because the availability of the fruit
resources within a given tree cover type is distinct for
different animal groups, similar feeding guilds of one
taxon are unlikely to be good indicators for those of
another. Tree dependence of species is clearly complex,
involving interactions among several factors, including
the provision of food sources, shelter, and appropriate
resting and breeding sites. Grouping organisms in terms
of their reliance or preference for particular tree
configurations would, therefore, cut across conventional
animal taxonomy and commonly used feeding guilds.
Species composition of animal communities associated
with different forms of tree cover
Most of the common species of all taxa that we
recorded in Rivas were generalists capable of using all
forms of tree cover, but some-forest dependent species of
birds and bats were observed, albeit in low numbers.
Even though the landscape was largely deforested and
the remaining tree cover highly fragmented, 14 endan-
gered bird species were observed, indicating a potential
contribution to conservation from the agricultural
matrix. Other studies have reported that highly modified
landscapes of low habitat quality for many forest species
of birds, bats, dung beetles, and butterflies, are never-
theless used by some of these species, and can be
strategically important in facilitating movement and
gene flow between remaining areas of high habitat
quality (Estrada et al. 1993, 1998, Daily et al. 2001,
Haddad and Tewksbury 2005).
All species that we recorded in Rivas are also found in
tropical dry forest of the region. This makes a
comparison of the species richness at Rivas with that
of a nearby national park of some relevance to
conservation planning. The Rivas agricultural landscape
contained almost 40% of the bird species found in the
nearest area of protected Tropical Dry Forest for which
data were available (the Santa Rosa National Park, 65
km to the south in Costa Rica) and more than half of the
tree, bat, and dung beetle species found there. Care is
required in interpreting this static comparison of species
numbers, because there may be a time lag between
landscape modification and changes in diversity, and
because the composition of species may change over
time (e.g., Brooks et al. 1999, Sekercioglu et al. 2002,
Ferraz et al. 2003). It is likely, however, that the species
that we found there now are able to persist in the
modified agricultural landscape because most are native
to the region, and land cover in Rivas has been
predominantly agricultural for more than a century.
Similar conclusions about the potential importance of
tree cover within agricultural landscapes for conserva-
tion efforts are emerging from other studies in land-
scapes in the neotropics, such as in Coto Brus, Costa
Rica (e.g., Daily et al. 2001, 2003, Ricketts et al. 2001,
Hughes et al. 2002, Horner-Devine et al. 2003),
Veracruz, Mexico (Estrada et al. 1993, 1997, 1998,
2000, Estrada and Coates-Estrada 2001, 2002), and
elsewhere (Petit and Petit 2003).
All four animal taxa showed clear distinctions in
species composition among the different tree cover
types, but the nature of these relationships varied among
taxa. Dung beetle assemblages were distinct in pastures
compared to other tree cover types, whereas the
butterfly assemblages were most distinct in secondary
forests. Bats showed three distinct types of assemblages
(live fences and riparian forests, pastures, and forest
fallows), whereas bird assemblages were only weakly
associated with tree cover types.
Species composition was generally distinct across the
different types of tree cover, with no form of cover
containing all species of any animal taxon. This
indicates that the different types of tree cover are likely
to contribute to the conservation of different species,
even within those taxa for which overall species richness
and abundance were similar among forms of tree cover.
It also suggests that the relatively high species richness at
a landscape scale is achieved by retaining a diversity of
forms of tree cover, as each contains a somewhat distinct
species assemblage.
The importance of the density of dispersed tree cover
on pastures for conservation
Among the general patterns of diversity across tree
cover types, there was some evidence that pastures with
high tree cover (16–25% tree cover) had greater
conservation potential than pastures with low tree cover
(,5% tree cover). Pastures with high tree cover had
October 2006 1995ANIMAL DIVERSITY AND TREE COVER

significantly more bird species and more insectivorous
bird species per plot than pastures with low tree cover.
Similarly, the total number of species found in
pastures with high tree cover was consistently higher
than the total found in pastures with low tree cover (41
vs. 35 bird species, 15 vs. 14 bat species, 24 vs. 20 dung
beetle species, and 22 vs. 18 butterfly species). These
patterns probably reflect the higher availability of sites
for foraging, perching, calling, roosting, and shelter
within pastures with higher tree densities, and add to the
growing recognition that tree density within pastures
may be critical for bird and bat conservation (Estrada et
al. 1997, Law and Lean 1999, Fischer and Lindenmayer
2002 a, b, Luck and Daily 2003, Lumsden and Bennett
2005).
Conservation implications
These results provide several key insights into the role
of tree cover within an agricultural matrix for animal
conservation. First, conservation strategies that involve
retaining trees need to be sensitive about which animal
taxa are favored by which forms of tree cover; one
animal group cannot be used as a surrogate indicator for
another, as they may have very different responses to
changes within a landscape. This implies that forms of
tree cover will be valued differently as conservation tools
in different contexts depending on the taxa of concern.
While some studies have shown significant correlations
in species richness of different taxa across different land-
use systems (birds and butterflies [Blair 1999]; birds,
trees, butterflies, and dung beetles [Schulze et al. 2004]),
most studies agree with our findings that different
animal taxa are not closely correlated (Flather et al.
1997, Lawton et al. 1998, Burel et al. 2004), consistent
with differences in the way that individual taxa and
species perceive and use different vegetation types and
landscapes. Consequently, unless there is evidence to the
contrary for a particular landscape, it is best to assume
that no animal taxa serve as adequate indicators of
others.
Second, because different animal taxa are favored by
different forms of tree cover, conservation efforts
focused on specific taxa may need to target the
conservation of specific types of tree cover within the
agricultural landscape. In Rivas, for example, the
retention of linear tree cover in the form of riparian
forests and live fences appears particularly important for
bat conservation, while areas of high tree cover are
important for bird conservation. Further research would
be required to determine how general the patterns
observed in Rivas are for tropical agricultural land-
scapes, but some site specificity is anticipated, associated
with the particular characteristics of the tree cover types
found at different sites, as well as the composition and
structure of different landscapes (Steffan-Dewenter
2002, Bergman et al. 2004, Burel et al. 2004).
Third, it is clear from the present study that
maintaining a diversity of forms of tree cover in the
agricultural matrix is important for maintaining diver-
sity among and within animal taxa. Heterogeneity of
vegetation on farms is emerging as a key factor for
animal conservation within agricultural landscapes both
in the tropics (e.g., Estrada et al. 1997, Harvey et al.
2004) and in temperature regions (e.g., Weibull et al.
2000, Benton et al. 2003, Wilson et al. 2005). Farmers,
however, make frequent alterations to tree cover on
their farms (e.g., Arnold and Dewees 1998, Villanueva et
al. 2003) in ways that may have profound impacts on the
conservation value of the agricultural landscape as a
whole (Tscharntke et al. 2005). For example, gradual
shifts from the more forest-like tree cover types, such as
riparian and secondary forests, to more open forms of
tree cover, such as dispersed trees in pastures, would be
likely to reduce the animal diversity within a landscape.
Even small changes, such as the reduction or increase of
tree densities within pastures, or a change in the
diversity of tree species within them, may lead to
profound changes in bird species richness and compo-
sition. Consequently, any efforts to actively manage the
tree cover within agricultural landscapes need to be
closely coordinated with farmers to ensure that a
diversity of tree cover is maintained over sufficiently
large spatial and temporal scales.
There is a clear need for conservation organizations
working in the neotropics to recognize the importance of
maintaining and, where necessary, restoring or recreat-
ing, a diversity of tree cover within agricultural land-
scapes. Given the generally high levels of animal
diversity in forest-like forms of tree cover, particular
emphasis should be placed on conserving the remaining
riparian and secondary forests, and protecting them
from degradation by cattle incursion, fire, and extrac-
tion of firewood and timber. As found in other studies
(e.g., Fischer and Lindenmayer 2002c), even small
patches of forest and narrow riparian strips hold
considerable value for conservation efforts and merit
inclusion in conservation plans. There are also clear
conservation gains possible through adopting strategies
and incentives that encourage farmers to make marginal
enhancements to tree cover in their fields, such as
increases in the density of dispersed trees in pastures, the
number of live fences along field boundaries, and the
tree diversity within them. These are all incremental
changes that are compatible with agricultural produc-
tion (Gordon et al. 2003, Harvey et al. 2005), and hence
readily adoptable by farmers.
ACKNOWLEDGMENTS
The authors thank P. Hernandez, M. Jones, H. Brenes, andR. Taylor for support in preparing the manuscript, S. Kunthfor help in the characterization of the satellite images, and twoanonymous reviewers for helpful comments on the originalmanuscript. This research was conducted as part of theFRAGMENT project ‘‘Developing methods and models forassessing the impacts of trees on farm productivity and regionalbiodiversity in fragmented landscapes,’’ funded by the Euro-pean Community Fifth Framework Programme ‘‘Confirmingthe International Role of Community Research’’ (INCO-DEV
CELIA A. HARVEY ET AL.1996 Ecological ApplicationsVol. 16, No. 5
ICA4-CT-2001-10099). The authors are solely responsible forthe material reported here; this publication does not representthe opinion of the Community, and the Community is notresponsible for any use of the data appearing herein.
LITERATURE CITED
Achard, F. H., D. Eva, H. J. Stibig, P. Mayaux, J. Gallego, T.Richards, and J. P. Malingreau. 2002. Determination ofdeforestation rates of the world’s humid tropical forests.Science 297:999–1002.
Arellano, L., and G. Halffter. 2003. Gamma diversity: derivedfrom and a determinant of alpha diversity and beta diversity.An analysis of three tropical landscapes. Acta ZoologicaMexicana 90:27–76
Arnold, J. E. M., and P. A. Dewees. 1998. Trees in managedlandscapes: factors in farmer decision making. Pages 277–294in L. E. Buck, J. P. Lassoie, and E. C. M. Fernandes, editors.Agroforestry in sustainable agricultural systems. CRC Press,New York, New York, USA.
Barrance, A. J., L. Flores, E. Padilla, J. E. Gordon, and K.Schreckenberg. 2003. Trees and farming in the dry zone ofsouthern Honduras. I. Campesino tree husbandry. Agro-forestry Systems 59:97–106.
Benton, T. G., J. A. Vickery, and J. D. Wilson. 2003. Farmlandbiodiversity: Is habitat heterogeneity the key? Trends inEcology and Evolution 18:182–188.
Bergman, K. O., J. Askling, O. Ekberg, H. Ingnell, H.Wahlman, and P. Milberg. 2004. Landscape effects onbutterfly assemblages in an agricultural region. Ecography27:619–628.
Biodiversity Pro v2, 1997. The National History Museum andthe Scottish Association for Marine Sciences, Oban, UK.Available online hhttp://www.sams.ac.uki
Blair, R. B. 1999. Birds and butterflies along an urban gradient:surrogate taxa for assessing biodiversity? Ecological Appli-cations 9:164–170.
Brooks, T. M., M. I. Bakarr, T. Boucher, G. A. B. da Fonseca,C. Hilton-Taylor, J. M. Hoekstra, T. Moritz, S. Olivier, J.Parrish, R. L. Pressey, A. S. L. Rodrigues, W. Sechrest, A.Stattersfield, W. Strahm, and S. N. Stuart. 2004. Coverageprovided by the global protected-area system: is it enough?BioScience 54:1081–1091.
Brooks, T. M., S. L. Pimm, and J. O. Oyugi. 1999. Time lagbetween deforestation and bird extinction in tropical forestfragments. Conservation Biology 13:1140–1150.
Burel, F., A. Butet, Y. R. Delettre, and N. M. de la Pena. 2004.Differential response of selected taxa to landscape contextand agricultural intensification. Landscape and UrbanPlanning 67:195–204.
Cajas-Giron, Y. S., and F. L. Sinclair. 2001. Characterizationof multistrata silvopastoral systems on seasonally drypastures in the Caribbean Region of Colombia. AgroforestrySystems 53:215–225.
Ceballos, G. 1995. Vertebrate diversity, ecology and conserva-tion in neotropical dry forests. Pages 195–220 in S. H.Bullock, H. A. Mooney, and E. Medina, editors. Seasonallydry tropical forests. Cambridge University Press, Cambridge,UK.
Clench, H. 1979. How to make a regional list of butterflies:some thoughts. Journal of the Lepidopteran Society 33:216–231.
Daily, G. C. 2001. Ecological forecasts. Nature 411:245.Daily, G. C., G. Ceballos, J. Pacheco, G. Suzan, and A.Sanchez-Azofeifa. 2003. Countryside biogeography of neo-tropical mammals: conservation opportunities in agriculturallandscapes of Costa Rica. Conservation Biology 17:1814–1826.
Daily, G. C., P. R. Ehrlich, and G. A. Sanchez-Azofeifa. 2001.Countryside biogeography: use of human-dominated hab-itats by the avifauna of southern Costa Rica. EcologicalApplications 11:1–13.
DeVries, P. J. 1987. The butterflies of Costa Rica and theirnatural history. Volume I: Papilionidae, Pieridae, Nympha-lidae. Princeton University Press, Princeton, New Jersey,USA.
DeVries, P. J. 1997. The butterflies of Costa Rica and theirnatural history. Volume II: Riodinidae. Princeton UniversityPress, Princeton, New Jersey, USA.
Dix, M. E., and D. Leatherman. 1988. Insect management inwindbreaks. Agriculture, Ecosystems and Environment22–23:231–240.
EcoSim. 2000. Null models software for ecology. AcquiredIntelligence Inc. and Kesey-Bear, Jericho, Vermont, USA.
Epila, J. S. O. 1986. The case of insect pest management inagroforestry systems. Agricultural Systems 19:37–52.
Escobar, F. 1997. Estudio de la comumidad de coleopteroscoprofagos (Escarabaeidae) en un remanente de bosque secoal norte del Tolima, Colombia. Caldasia 19:419–430.
Estrada, A., P. Cammarano, and R. Coates-Estrada. 2000. Birdspecies richness in vegetation fences and in strips of residualrain forest vegetation at Los Tuxtlas, Mexico. Biodiversityand Conservation 9:1399–1416.
Estrada, A., and R. Coates-Estrada. 2001. Bat species richnessin live fences and in corridors of residual rain forestvegetation at Los Tuxtlas, Mexico. Ecography 24:94–102.
Estrada, A., and R. Coates-Estrada. 2002. Dung beetles incontinuous forest, forest fragments and in an agriculturalmosaic habitat island at Los Tuxtlas, Mexico. Biodiversityand Conservation 11:1903–1918.
Estrada, A., R. Coates-Estrada, A. Anzures Dadda, and P.Cammarano. 1998. Dung and carrion beetles in tropical rainforest fragments and agricultural habitats at Los Tuxtlas,Mexico. Journal of Tropical Ecology 14:577–593.
Estrada, A., R. Coates-Estrada, and D. Meritt. 1993. Batspecies richness and abundance in tropical rain forestfragments and in agricultural habitats at Los Tuxtlas,Mexico. Ecography 16:309–318.
Estrada, A., R. Coates-Estrada, and D. A. Meritt. 1997.Anthropogenic landscape changes and avian diversity at LosTuxtlas, Mexico. Biodiversity and Conservation 6:19–43.
Fenton, M. B., L. Acharya, D. Audet, M. B. C. Hickey, C.Marriman, M. K. Obrist, and D. M. Syme. 1992. Phyllos-tomid bats (Chiroptera: Phyllostomidae) as indicators ofhabitat disruption in the Neotropics. Biotropica 24:440–446.
Ferraz, G., G. J. Russell, P. C. Stouffer, R. O. Bierregaard, S.L. Pimm, and T. E. Lovejoy. 2003. Rates of species loss fromAmazonian forest fragments. Proceedings of the NationalAcademy of Sciences (USA) 100:14069–14073.
Fischer, J., and D. B. Lindenmayer. 2002a. The conservationvalue of paddock trees for birds in a variegated landscape insouthern New South Wales. 1. Species composition and siteoccupancy patterns. Biodiversity and Conservation 11:807–832.
Fischer, J., and D. B. Lindenmayer. 2002b. The conservationvalue of paddock trees for birds in a variegated landscape insouthern New South Wales. 2. Paddock trees as steppingstones. Biodiversity and Conservation 11:833–849.
Fischer, J., and D. B. Lindenmayer. 2002c. Small patches canbe valuable for biodiversity conservation: two case studies onbirds in southeastern Australia. Biological Conservation 106:129–136.
Flather, C. H., K. R. Wilson, D. J. Ean, and W. C. McComb.1997. Identifying gaps in conservation networks: of indica-tors and uncertainty in geographic-based analyses. EcologicalApplications 7:531–542.
Gilbert, L. E. 1984. The biology of butterfly communities.Pages 41–54 in R. L. Vane-Wright and P. R. Ackery, editors.The biology of butterflies. Princeton University Press,Princeton, New Jersey, USA.
Gillespie, T. W., A. Grijalva, and C. N. Farris. 2000. Diversity,composition and structure of tropical dry forests in CentralAmerica. Plant Ecology 147:37–47.
October 2006 1997ANIMAL DIVERSITY AND TREE COVER

Glor, R. E., A. S. Flecker, M. F. Benard, and A. G. Power.2001. Lizard diversity and agricultural disturbance in aCaribbean forest landscape. Biodiversity and Conservation10:711–723.
Gomez, R., M. Lopez, C. A. Harvey, and C. Villanueva. 2004.Caracterizacion de las fincas ganaderas y relaciones con lacobertura arborea en potreros en el municipio de Belen,Rivas, Nicaragua. Encuentro (Universidad Centroamericanade Nicaragua) 36:94–113.
Gorchov, D. L., F. Cornejo, F. Ascorra, and J. Jaramillo. 1995.Dietary overlap between frugivorous birds and bats in thePeruvian Amazon. Oikos 74:235–250.
Gordon, J. E., W. D. Hawthorne, A. Reyes-Garcıa, G.Sandoval, and A. J. Barrance. 2004. Assessing landscapes:a case study of tree and shrub diversity in the seasonally drytropical forests of Oaxaca, Mexico and southern Honduras.Biological Conservation 117:429–442.
Gordon, J. E., W. D. Hawthorne, G. Sandoval, and A. J.Barrance. 2003. Trees and farming in the dry zone ofsouthern Honduras II: the potential for tree diversityconservation. Agroforestry Systems 59:107–117.
Gotelli, N. J., and R. K. Colwell. 2001. Quantifying biodiver-sity: procedures and pitfalls in the measurement andcomparison of species richness. Ecology Letters 4:379.
Green, R. E., S. J. Cornell, J. P. W. Scharlemann, and A.Balmford. 2005. Farming and the fate of wild nature. Science307:550–555.
Guevara, S., J. Meave, P. Moreno-Casasola, J. Laborde, and S.Castillo. 1994. Vegetacıon y flora de potreros en la sierra deLos Tuxtlas, Mexico. Acta Botanica Mexicana 28:1–27.
Haddad, N. M., and J. J. Tewksbury. 2005. Low-qualityhabitat corridors as movement conduits of two butterflyspecies. Ecological Applications 15:250–257.
Harvey, C. A., N. I. J. Tucker, and A. Estrada. 2004. Livefences, isolated trees, and windbreaks: tools for conservingbiodiversity in fragmented tropical landscapes. Pages 261–289 in G. Schroth, G. A. B. da Fonseca, C. A. Harvey, C.Gascon, H. L. Vasconcelos, and A.-M. N. Izac, editors.Agroforestry and biodiversity conservation in tropical land-scapes. Island Press, Washington, D.C., USA.
Harvey, C. A., C. Villanueva, M. Ibrahim, R. Gomez, M.Lopez, S. Kunth, and F. L. Sinclair. In press. Productores,arboles y ganado en paisajes agropecuarios en Mesoamerica:implicaciones para la conservacion de biodiversidad. In C. A.Harvey and J. Saenz, editors. Evaluacion y conservacion debiodiversidad en paisajes fragmentados de MesoAmerica.EUNA, UNA, Costa Rica.
Harvey, C. A., et al. 2005. Contribution of live fences to theecological integrity of agricultural landscapes. Agriculture,Ecosystems and Environment 111:200–230.
Hinsley, S. A., and P. E. Bellamy. 2000. The influence of hedgestructure, management and landscape context on the value ofhedgerows to birds: a review. Journal of EnvironmentalManagement 60:33–49.
Holdridge, L. R. 1987. Ecologıa basada en las zonas de vida.Instituto Interamericano de Cooperacion para la Agricultura(IICA), San Jose, Costa Rica.
Horgan, F. B. 2002. Shady field boundaries and the coloniza-tion of dung by coprophagous beetles in Central Americanpastures. Agriculture, Ecosystems and Environment 91:25–36.
Horner-Devine, M. C., G. C. Daily, P. R. Ehrlich, and C. L.Boggs. 2003. Countryside biogeography of tropical butter-flies. Conservation Biology 17:168–177.
Howden, H. F., and V. G. Nealis. 1975. Effects of clearing in atropical rain forest on the composition of the coprophagousscarab beetle fauna (Coleoptera). Biotropica 7:77–83.
Hughes, J. B., G. C. Daily, and P. R. Ehrlich. 2002.Conservation of tropical forest birds in countryside habitats.Ecology Letters 5:121–129.
InfoStat. 2004. Version 1.6. Grupo Infostat, FCA, UniversidadNacional de Cordoba, Cordoba, Argentina.
IUCN (International Union for the Conservation of Natureand Natural Resources). 1999. Lista de fauna de importanciapara la conservacion en Centroamerica y Mexico: listas rojas,listas oficiales y especies en apendices CITES. IUCN, SanJose, Costa Rica.
James, F. C., and N. O. Wamer. 1982. Relationships betweentemperate forest bird communities and vegetation structure.Ecology 63:159–171.
Janzen, D. H. 1983. No park is an island: increase ininterference from outside as park size decreases. Oikos 41:402–410.
Janzen, D. H. 1988. Tropical dry forests: the most endangeredmajor tropical ecosystem. Pages 130–137 in E. O. Wilson,editor. Biodiversity. National Academy Press, Washington,D.C., USA.
Klein, B. C. 1989. Effects of forest fragmentation on dung andcarrion beetle communities in Central Amazonia. Ecology70:1715–1723.
Lambin, E. F., H. J. Geist, and E. Lepers. 2003. Dynamics ofland-use and land-cover change in tropical regions. AnnualReview of Environment and Resources 28:205–241.
Laval, R., and B. Rodrıguez. 2002. Murcielagos de Costa Rica.Instituto Nacional de Biodiversidad, Santo Domingo deHeredia, Costa Rica.
Law, B. S., and M. Lean. 1999. Common blossom bats(Syconycteris australis) as pollinators in a fragmentedAustralian tropical rainforest. Biological Conservation 91:201–212.
Lawton, J. H., et al. 1998. Biodiversity inventories, indicatortaxa and effects of habitat modification in tropical forest.Nature 391:72–76.
Limpens, H. J. G. A., and K. Kapteyn. 1989. Bats, theirbehaviour and linear landscape elements. Myotis 29:63–71.
Luck, G. W., and G. C. Daily. 2003. Tropical countryside birdassemblages: richness, composition, and foraging differ bylandscape context. Ecological Applications 13:235–247.
Lumsden, L. F., and A. F. Bennett. 2005. Scattered trees inrural landscapes: foraging habitat for insectivorous bats insoutheastern Australia. Biological Conservation 122:205–222.
MacArthur, R. H., and J. W. MacArthur. 1961. On bird speciesdiversity. Ecology 42:594–598.
Maes, J. M., and R. Brabant. 2000. Mariposas de Nicaragua.(CD ROM). Museo Entomologico de Leon, Leon, Nicar-agua.
Magurran, A. E. 2004. Measuring biological diversity. Black-wells, Oxford, UK.
Martınez Sanchez, J. C., J. M. Maes, E. van den Berghe, S.Morales, and E. A. Casteneda. 2001. Biodiversidad zoologicaen Nicaragua. MARENA/PNUD, Manaugua, Nicaragua.
Medellın, R. A., M. Equihua, and M. A. Amin. 2000. Batdiversity and abundance as indicators of disturbance inneotropical rainforests. Conservation Biology 14:1666–1675.
Moreno, C. E., and G. Halffter. 2001. Spatial and temporalanalysis of a, b and c diversities of bats in a fragmentedlandscape. Biodiversity and Conservation 10:367–382.
Murphy, P. G., and A. E. Lugo. 1995. Dry forests of CentralAmerica and the Caribbean. Pages 9–34 in S. H. Bullock, H.A. Mooney, and E. Medina, editors. Seasonally dry tropicalforests. Cambridge University Press, Cambridge, UK.
Naughton-Treves, L., J. L. Mena, A. Treves, N. Alvarez, andV. C. Radeloff. 2003. Wildlife survival beyond parkboundaries: the impact of slash-and-burn agriculture andhunting on mammals in Tambopath, Peru. ConservationBiology 17:1106–1117.
Ouin, A., S. Aviron, J. Dover, and F. Burel. 2004. Comple-mentation/supplementation of resources for butterflies inagricultural landscapes. Agriculture, Ecosystems and Envi-ronment 103:473–479.
CELIA A. HARVEY ET AL.1998 Ecological ApplicationsVol. 16, No. 5

Palmeirim, J. M., D. L. Gorchov, and S. Stoleson. 1989.Trophic structure of a neotropical frugivore community: isthere competition between birds and bats? Oecologia 79:403–411.
Perfecto, I., and J. Vandermeer. 1997. The agroecosystem: aneed for the conservation biologist’s lens. ConservationBiology 11:591–592.
Petit, L. J., and D. R. Petit. 2003. Evaluating the importance ofhuman-modified lands for neotropical bird conservation.Conservation Biology 17:687–694.
Reid, F. 1997. A field guide to the mammals of Central Americaand Southeast Mexico. Oxford University Press, New York,New York, USA.
Ricketts, T. H., G. C. Daily, P. R. Ehrlich, and J. P. Fay. 2001.Countryside biogeography of moths in a fragmented land-scape: biodiversity in native and agricultural habitats.Conservation Biology 15:378–388.
Saab, V., and D. R. Petit. 1992. Impact of pasture developmenton winter bird communities in Belize, Central America.Condor 94:66–71.
Sabogal, C., and L. Valerio. 1998. Forest composition,structure and regeneration in a dry forest of the NicaraguanPacific Coast. Pages 187–221 in F. Dallmeier and J. A.Comiskey, editors. Forest biodiversity in North, Central andSouth America and the Caribbean. Parthenon PublishingGroup, London, UK.
Schroth, G., et al. 2004. Conclusion. Pages 487–502 in G.Schroth, A. B. da Fonseca, C. A. Harvey, C. Gascon, H. L.Vasconcelos, and A.-M. N. Izac, editors. Agroforestry andbiodiversity conservation in tropical landscapes. Island Press,Washington, D.C., USA.
Schulze, C. H., M. Walter, P. J. A. Kessler, R. Pitopang, D.Shadbuddin, M. Veddeler, S. Muhlenberg, R. Gradstein, C.Leuschner, I. Steffan-Dewenter, and T. Tscharntke. 2004.Biodiversity indicator groups of tropical land-use systems:comparing plants, birds and insects. Ecological Applications14:1321–1333.
Schulze, M. D., N. E. Seavy, and D. F. Whitacre. 2000. Acomparison of the Phyllostomid bat assemblages in undis-turbed neotropical forest and in forest fragments of a slash-and-burn farming mosaic in Peten, Guatemala. Biotropica32:174–184.
Sekercioglu, C. H., P. R. Ehrlich, G. C. Daily, D. Aygen, D.Goehring, and R. F. Sandi. 2002. Disappearance of
insectivorous birds from tropical forest fragments. Proceed-ings of the National Academy of Sciences (USA) 99:263–267.
Sokal, R. R., and F. Rohlf. 1995. Biometry. Third edition. W.H. Freeman, New York, New York, USA.
Sparrow, H. R., T. D. Sisk, P. R. Ehrlich, and D. D. Murphy.1994. Techniques and guidelines for monitoring neotropicalbutterflies. Conservation Biology 8:800–809.
Steffan-Dewenter, I. 2002. Landscape context affects trap-nesting bees, wasps and their natural enemies. EcologicalEntomology 27:631–637.
Stephens, W., C. Ulloa, A. Pool, and O. Montiel. 2001. Florade Nicaragua. Missouri Botanical Garden, St. Louis,Missouri, USA.
Stiles, F. G. 1983. Birds. Pages 502–544 in D. H. Janzen, editor.Costa Rican natural history. University of Chicago Press,Chicago, Illinois, USA.
Stiles, F. G., and A. F. Skutch. 1989. A guide to the birds ofCosta Rica. Cornell University Press, Ithaca, New York.
Stoner, K. 2001. Differential habitat use and reproductivepatterns of frugivorous bats in tropical dry forest ofnorthwestern Costa Rica. Canadian Journal of Zoology 79:1626–1633.
Tscharntke, T., A. M. Klein, A. Kruess, I. Steffan-Dewenter,and C. Thies. 2005. Landscape perspectives on agriculturalintensification and biodiversity–ecosystem service manage-ment. Ecology Letters 8:857–874.
Verboom, B., and H. Huitema. 1997. The importance of linearlandscape elements for the pipistrelle Pipistrellus pipistrellusand the serotine bat Eptesicus serotinus. Landscape Ecology12:117–125.
Villanueva, C., M. Ibrahim, C. A. Harvey, F. Sinclair, and D.Munoz. 2003. Estudio de las decisiones claves que influyensobre la cobertura arborea en fincas ganaderas de Canas,Costa Rica. Agroforesterıa en las Americas 10:69–77.
Weibull, A. C., J. Bengtsson, and E. Nohlgren. 2000. Diversityof butterflies in the agricultural landscape: the role of thefarming system and landscape heterogeneity. Ecography 23:743–750.
Wilson, J. D., M. J. Whittingham, and R. B. Bradbury. 2005.The management of crop structure: a general approach toreversing the impacts of agricultural intensification on birds?Ibis 147:453–463.
October 2006 1999ANIMAL DIVERSITY AND TREE COVER
Recommended


