
Current Biology 18, 81–90, January 22, 2008 ª2008 Elsevier Ltd All rights reserved DOI 10.1016/j.cub.2007.12.019
ArticlePericentric Chromatin Is Organizedinto an Intramolecular Loop in Mitosis
Elaine Yeh,1,2 Julian Haase,1,2 Leocadia V. Paliulis,1
Ajit Joglekar,1 Lisa Bond,1 David Bouck,1 E.D. Salmon,1
and Kerry S. Bloom1,*1Department of Biology623 Fordham Hall CB#3280University of North Carolina at Chapel HillChapel Hill, North Carolina 27599-3280
Summary
Background: Cohesin proteins link sister chromatids and pro-vide the basis for tension between bioriented sister chomatidsin mitosis. Cohesin is concentrated at the centromere region ofthe chromosome despite the fact that sister centromeres canbe separated by 800 nm in vivo. The function of cohesin at sitesof separated DNA is unknown.Results: We provide evidence that the kinetochore promotesthe organization of pericentric chromatin into a cruciform inmitosis such that centromere-flanking DNA adopts an intra-molecular loop, whereas sister-chromatid arms are pairedintermolecularly. Visualization of cohesin subunits by fluores-cence microscopy revealed a cylindrical structure that encir-cles the central spindle and spans the distance between sisterkinetochores. Kinetochore assembly at the apex of the loopinitiates intrastrand loop formation that extends approximately25 kb (12.5 kb on either side of the centromere). Two centro-mere loops (one from each sister chromatid) are stretchedbetween the ends of sister-kinetochore microtubules alongthe spindle axis. At the base of the loop there is a transitionto intermolecular sister-chromatid pairing.Conclusions: The C loop conformation reveals the structuralbasis for sister-kinetochore clustering in budding yeast andfor kinetochore biorientation and thus resolves the paradoxof maximal interstrand separation in regions of highest cohe-sin concentration.
Introduction
During mitosis, the eukaryotic cell constructs a bipolar array ofmicrotubules (MTs) that serves as the machinery to segregateduplicated chromosomes. The centromere on each sister chro-matid specifies the assembly of the kinetochore, a DNA-proteincomplex that interacts with the plus ends of kinetochore MTs(kMTs). Sister kinetochores can attach to MTs emanatingfrom either pole, leading to configurations in which sister kinet-ochores are attached to opposite poles (amphitelic), sisterkinetochores are attached to same poles (syntelic), or onekinetochore is attached to both poles (merotelic). The correctMT arrangement that persists is the one in which sister kineto-chores are attached to opposite poles. Tension produced byamphitelic attachment is the probable basis for the stabilityof this configuration. The budding yeast S. cerevisiae hasonly one MT attachment per kinetochore and is an ideal system
*Correspondence: [email protected] authors contributed equally to this work.
to characterize the force-producing mechanisms and tensionelements that reside at the interface of kinetochore-MTattachments.
The physical linkage of sister chromatids is the mechanismfor generation of tension for amphitelic attachment. This linkageis mediated by a multisubunit complex, cohesin, composed oftwo members of the structural maintenance of chromosomes(SMC) family of ATPases, Smc1 and Smc3, and two non-SMCsubunits, Mcd1/Scc1 and Scc3 [1, 2]. Cohesin is associatedwith chromosomes from G1 in the cell cycle until the onset ofanaphase. It has been assumed that cohesin promotes associ-ation between sister chromatids (intermolecular linkage), andthat is the basis for tension when sister chromatids are orientedto opposite spindle-pole bodies (SPBs). The Scc1 subunit dis-appears from chromosomes when sisters separate at the meta-phase/anaphase transition. Scc1 is cleaved by separase uponanaphase onset. The discovery of cohesin dispelled the viewthat sister chromatids might be held via intercatenation of sis-ter DNAs that was resolved at anaphase due to microtubule-pulling forces.
Cohesins can form ring-shaped structures in vitro, leading toseveral hypotheses that describe how these proteins connectsister chromatids [1, 2]. These include the embrace model, inwhich the complex forms a ring around sister DNA helices;the snap model, in which each cohesin complex binds a singleDNA helix and linkage occurs through the association of twocomplexes; and the bracelet model, in which cohesin com-plexes oligomerize to wrap around sister DNA helices.
Genome-wide chromatin immunoprecipitation (ChIP) inbudding yeast has revealed the predominant sites of cohesinbinding [3, 4]. Most notable is the finding that cohesin is en-riched w3-fold in a 20–50 kb domain flanking the centromere,relative to the concentration of cohesin on chromosome arms.Although the location of cohesin along the length of the yeastchromosome has been established, little is known about howthe concentration of cohesin within pericentric chromatin con-tributes to the fidelity of chromosome segregation.
The ability to visualize budding-yeast chromosomes in livecells revealed that sister kinetochores are separated beforeanaphase, as occurs in mammalian cells. Repeated arrays ofthe lac operator (E. coli lacO) were inserted into the yeast ge-nome. Introduction of lac repressor-GFP allowed visualizationof specific chromosomal domains [5]. Placement of the lacOarray at varying distances from the centromere revealed thatchromosome arms were closely apposed, whereas pericentricchromatin is stretched poleward in mitosis, prior to anaphaseonset (Figure 1) [6–9]. Sister centromeres on a single chromo-some oscillate relative to each other and often are separatedby distances of up to 800 nm. The oscillation in separation dis-tance suggests that the pericentromere regions of the chro-mosome are elastic, stretching in response to their dynamickMT attachments. With GFP-fusion proteins used to mark cen-tromeres of all chromosomes (centromeric histone H3 variantCse4 [9, 10], and the inner kinetochore component Mtw1 [6]), itwas found that sister kinetochores are organized into twolobes on either side of the equator of the metaphase spindle.This bipolar alignment is indicative of sister-centromere sepa-ration prior to anaphase. Subsequent visualization of a number

Current Biology Vol 18 No 282
Figure 1. Organization of a Mitotic Chromosome
Chromosome arms are closely apposed and held together via cohesin
(black rings). Sister kinetochores (yellow) are attached to kinetochore
microtubules (red), and the pericentric chromatin is stretched toward
the spindle poles. There are 16 chromosomes in yeast and 16 kineto-
chore microtubules in each spindle half. Cohesion between sister chro-
matids provides a mechanism to resist microtubule-pulling forces and
generate tension at centromeres. The function of cohesin in pericentric
chromatin is not well understood.
(transverse plane, Figures 2F and 2H). The distance be-tween the two peaks is constant through the entire heightof the cylinder (3D stacks of transverse sections at 100 nmsteps, Figure 2D). The decreased width measurementthrough the short axis of the bilobed fluorescence in thesagittal section (Figures 2A, 2C, and 2E) reflects variationthat arises from off-centered sections. If the aperture ofthe cylindrical array was less than 350 nm in diameter, theobjective point-spread function (Airy disk) would precludethe appearance of a hole in the cohesin fluorescence (FigureS1B). This pattern of cohesin fluorescence is indicative ofa cylindrical array w350 nm in width and w600 nm in height.
To determine the relationship of the cylindrical array of
of kinetochore proteins and examination of their behavior afterphotobleaching [11] have substantiated the finding that sistercentromeres are pulled apart by sister-kinetochore pullingforces in metaphase. The major paradox in the field is the ac-cumulation and function of cohesin at sites of sister-chromatidseparation.
Results
A Cylindrical Array of Cohesin in MitosisWe have determined the three-dimensional (3D) distribution ofcohesin in mitotic cells by using two core cohesin components,Smc3 and Mcd1/Scc1, and a SPB protein (Spc29) expressedfrom their endogenous promoters and fused to green or redfluorescent protein, respectively (GFP, RFP). In the sagittalsection (side view of the mitotic spindle, Figure 2A, schematic),Smc3-GFP and Scc1-GFP are concentrated in two fluorescentlobes between the poles of the mitotic spindle (Smc3-GFP,Spc29-RFP, Figure 2A; Scc1-GFP, Spc29-CFP, Figure S1Aavailable online). The peak intensity of fluorescence is 2.23 60.43 times the intensity of cohesin in nuclear regions awayfrom the spindle. In the transverse section (end-on view ofthe mitotic spindle, Figure 2B, schematic), Smc3-GFP formsan apparently hollow ring centered about the spindle axis(Smc3-GFP, Spc29-RFP, Figure 2B). There are numerous co-hesin subunits concentrated in a cylindrical array around themitotic spindle. To determine the height of the cylindrical array,we drew linescans through the long axis of fluorescence in Fig-ure 2A. The distance between the half-maximum positions ofthe fluorescence intensity from one end of the cylinder to theother is 586 6 105 nm (Figure 2A, n = 42, schematic in Fig-ure 2G). The width of the cylindrical array was determined bytaking 3D stacks of images through sagittal (Figure 2C) andtransverse (Figure 2D) planes and measuring the distance be-tween maximal fluorescence values of each peak (sagittal, Fig-ures 2E and 2G; transverse, Figures 2F and 2H). The distancebetween the bilobed peaks of fluorescence is 293 6 56 nm(sagittal plane, Figures 2E and 2G) versus 365 6 51 nm
cohesin with respect to kinetochore microtubules and the
metaphase spindle, we examined strains containing Smc3-GFP and Ndc80-Cherry (Ndc80, an outer-kinetochore-com-plex member) (Figures 3A and 3B) or Tub1-CFP (Figures 3Cand 3D). In the sagittal view, clusters of Ndc80-Cherry capthe fluorescent cohesin lobes (Figure 3A) and the valleyof SMC3-GFP fluorescence coincides with the position ofinterpolar microtubules (Figure 3C). In the transverse view,Ndc80-Cherry is surrounded by a ring of Smc3-GFP (Figure 3B)and the spindle is centrally aligned (Figure 3D). Thus Smc3-GFP is distributed cylindrically around central spindle interpo-lar microtubules and spans w75% of the distance betweenseparated clusters of kinetochores in metaphase (w600 nmcohesin versus 800 nm kinetochore clusters).
Cohesin is associated with chromosomes from G1, promot-ing cohesion upon replication and persisting until the onset ofanaphase. In live cells, Smc3-GFP is seen to accumulate nearthe SPB in S phase (Figures S1D–S1F). However, the cylindri-cal array is only apparent after DNA replication and bipolar-spindle formation. To address the extent of DNA replicationrequired for the cylindrical array, we examined Smc3-GFP incells treated with hydroxyurea (HU) (Figure 3E). In the presenceof HU, only early origins of replication are activated, and thebulk of chromosome replication is severely delayed or ar-rested [12]. Centromere-DNA replication is under the controlof early-firing origins. Upon HU treatment, cells arrest withbipolar spindles and bioriented chromosomes, visualized bytwo centromere-proximal lacO spots, reflecting the replicationof centromere DNA (Figure S2) [6]. The dimensions and inten-sity of Smc3-GFP are indistinguishable in HU-treated versusnontreated cells (Figure 3E). Replication of centromeric re-gions and subsequent biorientation is therefore sufficient forestablishment of cohesin into a cylindrical array surroundingthe central spindle.
Stability of Pericentric Cohesin
Upon anaphase onset, a subunit of cohesin (Scc1) is cleaved byseparase [13], the spindleelongates (anaphase B), and sisterki-netochores migrate to opposite poles (anaphase A). Anaphase

Cylindrical Array of Pericentric Cohesin83
Figure 2. Distribution of Smc3-GFP in Metaphase
(A) Smc3-GFP is concentrated between the spindle-pole bodies in metaphase. Two oblongate lobes of fluorescence (arrows in Smc3-GFP image, green in
overlay) with a dimmer area between are aligned between the spindle poles in a sagittal view of the spindle (Spc29-RFP, red in overlay). The schematic (right)
illustrates the image plane of cohesin relative to the mitotic spindle in the sagittal view. Spindle length = 1.2 mm. Scale bar represents 1 mm.
(B) A cylindrical array of Smc3-GFP is visible in a transverse view of the spindle. Note the circular distribution Smc3-GFP (green in overlay) relative to the
spindle-pole body (Spc29-RFP, red in overlay). The schematic (right) illustrates the image plane of cohesin in transverse view.
(C) Confocal serial sagittal sections of Smc3-GFP.
(D) Confocal serial transverse sections of Smc3-GFP. The bilobed fluorescence is qualitatively visible above background through w600 nm (on average
6.4 6 0.9 100 nm steps, n = 8) from the sagittal view and w1000 nm (on average 7.8 6 1.9 100 nm steps, n = 10) from the transverse view. A cylinder
with a diameter of w350 nm and height of w600 nm would be seen through greater than 4 100 nm steps in the sagittal view, and greater than 7 100 nm steps
in the transverse view when the decreased resolution due to the point-spread function (PSF) of the microscope objective in the z axis is taken into account.
The number of steps in the sagittal and transverse views is consistent with the fluorescence measurements of the cylinder’s height and diameter.
(E) Linescan through the oblongate lobes of Smc3-GFP fluorescence in the sagittal view. Error bars are standard error of the mean (SEM) (average of
53 cells).
(F) Linescan through Smc3-GFP fluorescence in the transverse view. Error bars are SEM (average of 22 cells). Arbitrary fluorescence units (y axis) are plotted
versus distance in pixels (x axis, 65 nm/pixel).
(G) Model for pericentric cohesin in sagittal view. The mitotic spindle comprises 32 kinetochore MTs (16 in each half spindle, light green) and eight interpolar
MTs (four from each pole, dark green), 250 nm in diameter. The distribution of cohesin is depicted as a transparent cylinder 600 nm in height and 300 nm in
width. Pericentric DNA associated with cohesin is depicted as springs (orange) that span the distance between kinetochore microtubules.
(H) Model for pericentric cohesin in transverse view. Spindle microtubules (green) are surrounded by the cylindrical array of cohesin (transparent green). The
position of pericentric DNA (orange) is based upon cohesin binding pericentric chromatin. The diameter of the cylindrical array in the transverse section is
w350 nm.
onset is defined as spindle elongation (13214 min, Figure 4A).The fluorescence intensity of pericentric and arm cohesinwas plotted as a function of time from metaphase to anaphase(Figure 4A, graph). Cohesin fluorescence decreased on aver-age 66% between 2 and 6 min upon the onset of anaphase
(n = 6). Pericentric cohesin is lost at or slightly before pole sep-aration (Figure 4A, top). No overall change in Smc3 arm fluores-cence is detected from metaphase to the end of anaphase.
The number of cohesin complexes holding the pericentricDNA structure together is crucial for understanding the

Current Biology Vol 18 No 284
Figure 3. Position and Functional Requirements for the Cylindrical Array
of Cohesin
(A) Colocalization of Smc3-GFP (left), Ndc80-Cherry (arrows), and
Spc29-RFP (asterisks) (middle) in the sagittal section. The overlay (right)
is a merge of both channels: Smc3-GFP, green; Spc29-RFP and Ndc80-
Cherry, red.
(B) Colocalization of Smc3-GFP, Ndc80-Cherry, and Spc29-RFP in the
transverse section. Smc3-GFP appears as a cylinder. Ndc80-Cherry re-
sides within the cohesin cylindrical array.
(C) Colocalization of Smc3-GFP and Tub1-CFP in the sagittal section.
The bilobed fluorescence of Smc3-GFP encircles Tub1-CFP (red in
merge).
(D) Colocalization of Smc3-GFP and Tub1-CFP in the transverse sec-
tion. The cylindrical array of Smc3-GFP encircles Tub1-CFP (red in
merge).
(E) Smc3-GFP and Spc29-RFP localization after incubation with hy-
droxyurea (HU) for 3 hr. A bipolar spindle is formed (middle), and
Smc3-GFP is concentrated in a bilobed structure (left) that lies between
the two spindle poles. Smc3-GFP is shown in green and Spc29-RFP in
red in the merge.
(F) Smc3-GFP distribution in the absence of functional kinetochores.
Cells containing a temperature-sensitive allele of ndc10-1 were grown
at the restrictive temperature. There is no structural organization of
Smc3-GFP. Smc3-GFP is shown green and Spc29-RFP in red in the
merge.
(G) Smc3-GFP distribution after 2 hr incubation in 20 mg/ml nocodazole
(NOC). The spindle has collapsed, as evidenced by the appearance of
adjacent spindle pole bodies that mark the former spindle axis (middle,
asterisks in red). Smc3-GFP remains concentrated proximal to the spin-
dle poles in nocodazole-arrested cells (arrows in GFP panel and over-
lay). Two lobes of Smc3-GFP flank a dimmer area in which the collapsed
spindle poles lie. Linescan through Smc3-GFP after spindle collapse is
similar in shape to linescans of Smc3-GFP in untreated cells (see
Figure S4). The fluorescence intensity of Smc3-GFP lobes in cells with
collapsed spindles is 2–33 brighter than in untreated cells (see
Figure S4). Smc3-GFP is shown in green and Spc29-RFP in red in the
merge.
absence of tension to 222 6 103 molecules/pericentric re-gion (n = 11). These measurements translate to a minimumof 3.5 cohesin complexes per C loop (108 Smc3 molecules/32 centromeres). On the basis of centromere dynamics todeduce the amount of DNA in each C loop under tensionin metaphase [9], we estimate that there is one cohesincomplex every 4 kb, or one complex every 20 nucleosomes.The measurements are consistent with distribution of co-hesin from chromatin-immunoprecipitation experiments[4, 15] and the w2.5 fold increase in cohesin along pericen-tric chromatin in the absence of tension [16].
Considering that sister-kinetochore separation is dy-namic, we have addressed whether cohesin within the peri-centric chromatin is stably bound. Fluorescence recoveryafter photobleaching (FRAP) was used to quantitativelymonitor cohesin stability in metaphase cells expressingSmc3-GFP (Figure 4B). In metaphase, one lobe of the GFP-cohesin cylinder was selectively targeted with a 200 mslaser exposure, whereas the other lobe retained fluores-cence. Fluorescence of the bleached area was measuredat 30 s intervals for 5 min. Comparison of integrated intensity
dynamic extension-relaxation behavior of pericentric chroma-tin observed during metaphase centromere movements. Us-ing a comparative measurement of Smc3p-GFP fluorescencesignal (to a known number of two Cse4 molecules per kineto-chore [14]), we estimate that there are 108 6 40 (n = 7) mole-cules in the pericentric region of cells containing Smc3-GFP(Table S1). The concentration of cohesin increases in the
measurements from the two sides of the cylinder revealed thatcohesin fluorescence recovered above the background in onlytwo of 20 cells analyzed. No significant fluorescence loss in theunbleached lobe was detected (data not shown). These resultssuggest that once assembled, cohesin is stably bound to peri-centric chromatin. In contrast, FRAP of histone H2B-GFP (anexchangeable component of the nucleosome [17]), revealed

Cylindrical Array of Pericentric Cohesin85
Figure 4. Cohesin Stability
(A) Loss of the cylindrical array in early anaphase.
A time-lapse series of Smc3-GFP is shown as
cells progress from metaphase to anaphase.
The concentration of Smc3-GFP fluorescence is
visible in metaphase between the spindle poles
(2 min, top left, Smc3-GFP; bottom left, Spc29-
RFP) (minutes indicated in bottom left corner).
The fluorescence intensity between the two poles
decreases between 13 and 14 min as the spindle
elongates in anaphase (increase in distance be-
tween Spc29-RFP spindle poles, bottom panel).
The difference in fluorescence intensity of spin-
dle poles reflects the maturation time for RFP
fluorescence in the new pole (to the right, bottom
panel). Fluorescence intensity of Smc3-GFP was
determined as described in the Experimental
Procedures and plotted as a function of time in
the bottom graph (left axis in arbitrary units, fluo-
rescence intensity; right axis in microns, spindle
length). Slightly before or concomitant with spin-
dle elongation, the fluorescence intensity be-
tween the spindle poles decreases.
(B) Stability of cohesin in the cylindrical array.
Fluorescence recovery after photobleaching
(FRAP) was measured to determine cohesin sta-
bility in the pericentric region in cells expressing
Smc3p-GFP. An argon laser attached to an in-
verted fluorescence microscope was directed
to a portion of Smc3-GFP between the spindle
poles (prebleach). GFP within a diffraction-lim-
ited spot (w0.25 mm) was bleached (postbleach).
Images were acquired every 30 s for 5 min follow-
ing photobleaching. As shown in the graph no re-
covery of Smc3-GFP fluorescence was detected.
Cohesin fluorescence recovery above the back-
ground was apparent in only two of 17 cells.
due to thermal motion, ligation was alsoperformed in the absence of crosslink-ing. Primer pairs from the chromosomearm (Au + Ad) provide a control templateto account for template yield in each
that 37% 6 12% of H2B was dynamic in ten out of ten cells an-alyzed (exchanging with t1/2 = 67 6 16 s) (data not shown).
Chromosome Conformation at the Centromere
If the cylindrical distribution of cohesin reflects the geometricarray of bioriented sister chromatids in mitosis, then separatedsister kinetochores and flanking pericentric chromatin may bepaired via intramolecular rather than intermolecular contacts[18]. To examine the conformation of pericentric DNA in vivo,we utilized an inverse-PCR strategy to map chromosomeconformation (3C) [19]. Inverse primer pairs used to map theconformation of chromatin are shown in Figure 5A (pericentricchromatin P1, P2, and P3; arm chromatin A, 75 kb from the cen-tromere). Upstream and downstream primer pairs P1u + P1d andAu + Ad are separated by the same physical distance (15 kb) inthe genome. Chromatin was fixed by treatment of cells withformaldehyde, and the chromatin was digested with XbaI andligated under dilute conditions to minimize intermolecular reac-tions. Each primer is w200 bp downstream from an XbaI siteresulting in PCR products of 400 bp when fragments containingsites complementary to the respective oligonucleotides (P1u +P1d and Au + Ad) ligate. For quantitation of random association
experimental preparation.
In the absence of crosslinking, the ratio of PCR productsfrom the pericentric versus arm chromatin (primer pairs P ver-sus A) was 1.25 6 0.15 (Figure S3B). This ratio could reflectgreater ligation efficiency between fragments spanning theXbaI junction flanked by P1u + P1d versus Au + Ad, or it could re-flect a more efficient PCR reaction with primer pairs P1u + P1d
versus Au + Ad. To address the source of the difference andto ensure that the PCR reactions were linear over the range ofinput DNA, we constructed the template for inverse primerpairs P1u + P1d and Au + Ad. Templates were constructed by am-plification of DNA from each primer to its respective XbaI site(P1u / XbaI, P1d / XbaI; and Au / XbaI, Ad / XbaI, as shownin Figure 5A). The fragments were digested with XbaI and ap-propriate fragment pairs were ligated (P1u + P1d; Au + Ad) andamplified with primer pairs P1u + P1d or Au + Ad. The yield ofeach product was quantitated by gel electrophoresis and ab-sorbance at A260. PCR was performed over a range of templateDNA concentration (Figure S3A). At an input ratio of 1:1 P:Atemplate, the mean ratio of PCR products was 1.21. This valuewas constant over a 10-fold range of input DNA concentration(Figure S3A). The ratio of the PCR products with primer pairs Pversus A in the uncrosslinked sample (above) reflect equal

Current Biology Vol 18 No 286
Figure 5. 3C Assay for Intramolecular Looping
(A) The schematic shows the position of oligonucleotide primers on chromosome III (arrows) relative to the centromere (filled circle). Each pair of oligonu-
cleotides (P1u + P1d and Au + Ad; pericentric versus arm chromatin) extend away from each other on the linear chromosome. XbaI sites are indicated by (X)
downstream of each oligonucleotide primer. In the linear chromosomal configuration, these oligonucleotides will not prime DNA synthesis after the 3C as-
say. If there is intramolecular looping (as diagrammed in [B], left), the P1u + P1d oligonucleotides will prime DNA synthesis. The products from PCR reactions
following crosslinking, restriction digestion, and ligation were quantified as described in the Experimental Procedures.
(B) Left: schematic representation of the extent of the intramolecular loop. Right: looping index for each experimental sample. The looping index accounts
for differential efficiency of PCR reactions with primer set P versus A at an equivalent ratio of input template (see complete description in Figure S3). A loop-
ing index of 1 indicates equal concentration of input template for pericentric and arm products, respectively. Experimental samples (wild-type [WT], aF,
ndc10-1, and uncrosslinked) were prepared as described in the Experimental Procedures.
concentration of the respective pericentric (P) or arm (A) tem-plates after the sample preparation.
The experimental pericentric:arm (P:A) product ratios plot-ted against reconstructed P:A input ratios over the range of0.3–5.0 are shown in Figure S3A. There is a linear relationshipover a 10-fold range (6.6–66 picograms) of template DNA. Allsubsequent analysis was performed within the linear rangeof these 3C PCR reactions. The plot accounts for the differentPCR efficiency of the primer sets and provides a standard forcalibrating the degree of intramolecular looping from the ex-perimental sample. We thus define a ‘‘looping index’’ as theratio of P:A normalized for differences in PCR efficiency. Alooping index of w1.0 reflects an equal concentration of inputpericentric and arm products, indicative of an equal propensityfor arm or pericentric chromatin to loop (uncrosslinked sam-ple, Figure 5B; P:A product ratio of 1.25, Figure S3B). Forexample, in the crosslinked samples amplified with the 15 kbprimer pair (7.5 kb on either side of CEN3), there is a P:A prod-uct ratio of 1.96 (Figure S3B) and a looping index of 2.41(Figure 5B). Thus pericentric chromatin DNA is 2.43 moreprone to adopt an intramolecular loop (C loop) relative to
arm DNA (Figure 5B). This increase in looping index (2.41) iscomparable to the increased crosslinking efficiency reportedby Dekker et al. [19] for the chromosome III centromere.
To determine the physical length of the intramolecular loop,we designed additional primer pairs spanning 23 kb (P2u + P2d)and 50 kb (P3u + P3d) of pericentric DNA (w11.5 and 25 kb oneither side of CEN3, respectively) (Figures 5A and 5B). The peri-centric:arm product ratio of uncrosslinked DNA varies witheach primer pair (1.04 6 0.03 and 2.16 6 0.3 for the 23 kb and50 kb primer pairs, respectively, see Figure S3B). After cross-linking, the Cen:arm product ratio increased by 24% (1.64 loop-ing index) for the 23 kb primer pair and decreased 43% (0.25looping index) for the 50 kb primer pair. The looping index forthe 50 kb primer pair in the absence of DNA replication is 1.01(aF 50 kb, Figure 5B). The 0.25 looping index obtained in loga-rithmic-phase growth indicates that the conformation of chro-matin 25 kb on either side of the centromere is anticorrelatedwith intramolecular looping and may be constrained in its abil-ity to adopt certain conformations. These results extend con-clusions from examination of sister chromatids with lacO oper-ators at various positions from the centromere [9] and indicate
Cylindrical Array of Pericentric Cohesin87
that intramolecular looping extends beyond 11.5 kb but not25 kb on either side of the centromere.
The intramolecular pericentric loop is completely dependentupon kinetochore function. Ndc10 is one of the centromere-DNA binding factors (CBF3) and is essential for kinetochoreformation [20]. The looping index for pericentric chromatinin ndc10-1 mutant cells at the restrictive growth temperatureis 1.15, equivalent to the uncrosslinked sample (Figure 5B andFigure S3). Because Ndc10 has been shown to bind additionalsites in the genome [21], we utilized an alternative strategy todisrupt kinetochore function. Induction of a transcriptionalpromoter adjacent to the centromere results in loss of segre-gation function [22]. Cells containing a conditionally functionalcentromere (GALCEN3) were transferred to media containinggalactose to activate the GAL1 promoter. The looping indexof pericentric chromatin flanking an inactive centromere was1.18 (Table 1 and Figure S3A). Ndc10 is depleted at the GAL-CEN locus [23], and therefore intramolecular looping of peri-centric chromatin is dependent upon a functional kinetochore.
Upon loss of kinetochore function, there is concomitant lossof the cylindrical cohesin array. ndc10-1 mutants at restrictivetemperature no longer organize cohesin into a cylinder aroundthe mitotic spindle (Figure 3F). Likewise, upon disruption of mi-crotubule attachment in the Ndc80 outer kinetochore complex(nuf2-45 mutants), Smc3-GFP is randomly distributed in thenucleus and visible as puncta of various sizes and positionsrelative to the spindle poles (Figure S1C).
To determine whether sister chromatids are required for Cloop formation, we examined the structure of pericentric chro-matin in cells arrested prior to DNA replication (via aF treat-ment). The looping index for the 15 kb primer pair (7.5 kb oneither side of the centromere) was 2.31 in cells treated with aF(Table 1, Figure 5B, and Figure S3A), and the loop extendsa physical distance comparable to that observed in logarithmicgrowing cells (Figure 5B, wild-type [WT] 23 kb 1.64, aF 23 kb1.67). In contrast, the looping index for 50 kb of pericentricDNA (0.25) increased to 1.01 in aF-treated cells (Figure 5Band Figure S3B). Thus DNA sequences 25 kb on either side ofCEN3 exhibit prior to DNA replication random associationscomparable to those measured in uncrosslinked controls at50 kb (Figure S3B). Upon replication, chromatin at the base ofthe C loop is held via cohesin-mediated sister-chromatid link-ages, and the efficiency of ligation 25 kb on either side ofCEN3 drops precipitously (Figure 5B).
An alternative strategy to address the role of sister chroma-tids is through the use of mutations in cohesin subunit Mcd1/
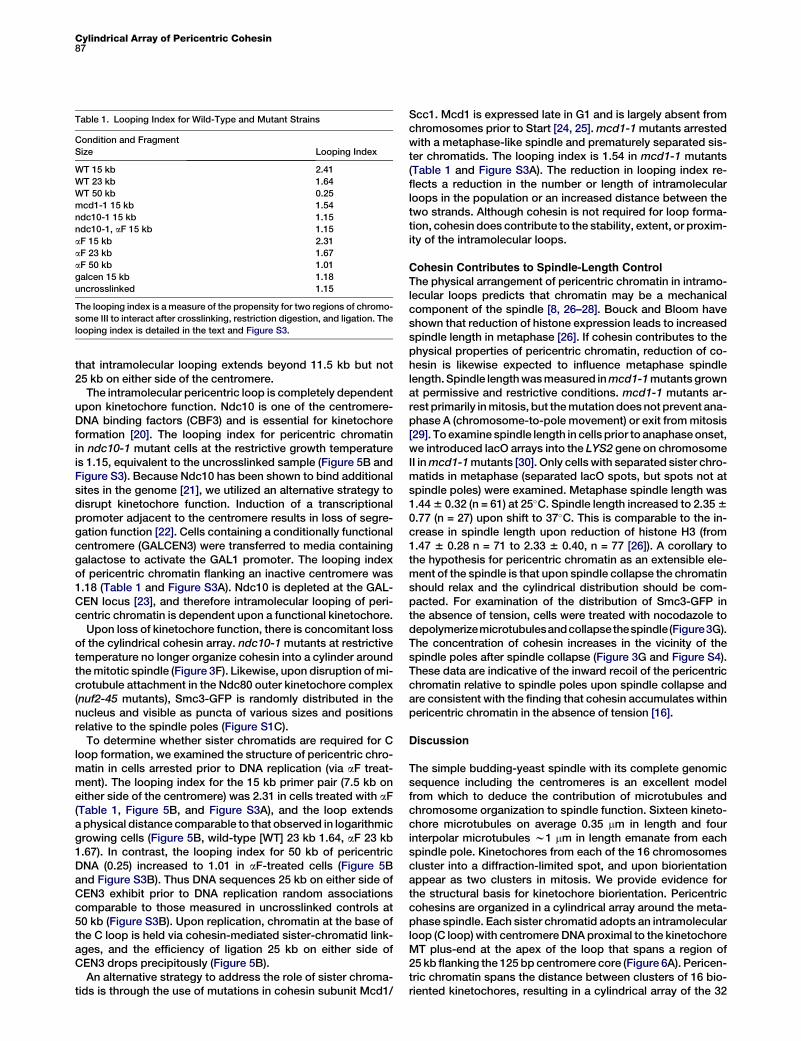
Table 1. Looping Index for Wild-Type and Mutant Strains
Condition and Fragment
Size Looping Index
WT 15 kb 2.41
WT 23 kb 1.64
WT 50 kb 0.25
mcd1-1 15 kb 1.54
ndc10-1 15 kb 1.15
ndc10-1, aF 15 kb 1.15
aF 15 kb 2.31
aF 23 kb 1.67
aF 50 kb 1.01
galcen 15 kb 1.18
uncrosslinked 1.15
The looping index is a measure of the propensity for two regions of chromo-
some III to interact after crosslinking, restriction digestion, and ligation. The
looping index is detailed in the text and Figure S3.
Scc1. Mcd1 is expressed late in G1 and is largely absent fromchromosomes prior to Start [24, 25]. mcd1-1 mutants arrestedwith a metaphase-like spindle and prematurely separated sis-ter chromatids. The looping index is 1.54 in mcd1-1 mutants(Table 1 and Figure S3A). The reduction in looping index re-flects a reduction in the number or length of intramolecularloops in the population or an increased distance between thetwo strands. Although cohesin is not required for loop forma-tion, cohesin does contribute to the stability, extent, or proxim-ity of the intramolecular loops.
Cohesin Contributes to Spindle-Length Control
The physical arrangement of pericentric chromatin in intramo-lecular loops predicts that chromatin may be a mechanicalcomponent of the spindle [8, 26–28]. Bouck and Bloom haveshown that reduction of histone expression leads to increasedspindle length in metaphase [26]. If cohesin contributes to thephysical properties of pericentric chromatin, reduction of co-hesin is likewise expected to influence metaphase spindlelength. Spindle length was measured in mcd1-1 mutants grownat permissive and restrictive conditions. mcd1-1 mutants ar-rest primarily in mitosis, but the mutation does not prevent ana-phase A (chromosome-to-pole movement) or exit from mitosis[29]. To examine spindle length in cells prior to anaphase onset,we introduced lacO arrays into the LYS2 gene on chromosomeII in mcd1-1 mutants [30]. Only cells with separated sister chro-matids in metaphase (separated lacO spots, but spots not atspindle poles) were examined. Metaphase spindle length was1.44 6 0.32 (n = 61) at 25�C. Spindle length increased to 2.35 60.77 (n = 27) upon shift to 37�C. This is comparable to the in-crease in spindle length upon reduction of histone H3 (from1.47 6 0.28 n = 71 to 2.33 6 0.40, n = 77 [26]). A corollary tothe hypothesis for pericentric chromatin as an extensible ele-ment of the spindle is that upon spindle collapse the chromatinshould relax and the cylindrical distribution should be com-pacted. For examination of the distribution of Smc3-GFP inthe absence of tension, cells were treated with nocodazole todepolymerizemicrotubulesandcollapsethespindle (Figure3G).The concentration of cohesin increases in the vicinity of thespindle poles after spindle collapse (Figure 3G and Figure S4).These data are indicative of the inward recoil of the pericentricchromatin relative to spindle poles upon spindle collapse andare consistent with the finding that cohesin accumulates withinpericentric chromatin in the absence of tension [16].
Discussion
The simple budding-yeast spindle with its complete genomicsequence including the centromeres is an excellent modelfrom which to deduce the contribution of microtubules andchromosome organization to spindle function. Sixteen kineto-chore microtubules on average 0.35 mm in length and fourinterpolar microtubules w1 mm in length emanate from eachspindle pole. Kinetochores from each of the 16 chromosomescluster into a diffraction-limited spot, and upon biorientationappear as two clusters in mitosis. We provide evidence forthe structural basis for kinetochore biorientation. Pericentriccohesins are organized in a cylindrical array around the meta-phase spindle. Each sister chromatid adopts an intramolecularloop (C loop) with centromere DNA proximal to the kinetochoreMT plus-end at the apex of the loop that spans a region of25 kb flanking the 125 bp centromere core (Figure 6A). Pericen-tric chromatin spans the distance between clusters of 16 bio-riented kinetochores, resulting in a cylindrical array of the 32

Current Biology Vol 18 No 288
Figure 6. Model of the Organization of Cohesin and Pericentric Chromatin in Metaphase
(A) DNA of each sister chromatid is held together via intramolecular bridges that extend approximately 11.5 kb on either side of the centromere. A transition
from intra- to intermolecular linkages results in a cruciform structure.
(B) Five (of 16) bioriented sister chromatids are shown with two (of eight) interpolar microtubules. We have proposed that the transition between intramo-
lecular looping and intermolecular cohesion is mobile and on average 7 kb from the centromere core [18]. DNA adjacent to the centromere may extend to its
B form length in vivo (as described in text, depicted as red lines), thereby linking the centromere at kinetochore-microtubule plus ends to strands of intra-
molecularly paired pericentric chromatin and cohesin that are displaced radially from spindle microtubules. Microtubules and spindle-pole bodies are rep-
resented by green and black rods, respectively. The 125 bp centromere is wrapped around the Cse4-containing histone in yellow. Nucleosomal chromatin is
depicted as green histone cores wrapped around DNA in red. Cohesin is depicted as black circles. The fluorescence distribution of cohesin is depicted in
transparent green. Pericentric chromatin from each of the 16 chromosomes is displaced 70–90 nm radially from the central spindle microtubules. The entire
spindle is composed of 32 kinetochore microtubules and eight pole-pole microtubules.
pericentric regions within the mitotic spindle (Figure 6B). Thisresults in a cruciform configuration between sites of microtu-bule attachment and sister-chromatid pairing (Figure 6A).These loops of pericentric DNA together with cohesin may
provide the mechanical linkage between separated sisterkinetochores.
The discovery of intramolecular looping at the centromereprovides a solution to the major paradox in understanding

Cylindrical Array of Pericentric Cohesin89
the accumulation of cohesin at sites of separated sister DNAstrands. Cohesin is organized into a supramolecular cylindricalarray encompassing the mitotic spindle. From the fluorescencedistribution and the spread of light through the objective (point-spread function), we estimate the dimensions of the cylindricalarray to be approximately 350 nm in diameter by 600 nm inlength. The diameter of the cohesin cylinder is approximately70–80 nm larger than measured for the diameter of the spindlemicrotubules in yeast by electron microscopy [31] and 200 nmshorter than the distance between clusters of microtubule plusends (w800 nm) [32]. This difference in diameter is the basis fordepicting cohesin and the pericentric C loops radially dis-placed from the spindle microtubules (Figure 6B). A questionraised by these findings is how the pericentric chromatin isphysically linked to the microtubule plus end. The centromericnucleosome cluster, as visualized by Cse4 fluorescence,shows no such cylindrical array, and the cluster is very closeto the microtubule plus end [33]. We can reconcile these find-ings by proposing that the plus ends of the kinetochore micro-tubules are very close to the Cse4 nucleosome, and the adja-cent 70–90 bp of DNA flanking the Cse4 nucleosome spansthe distance to the flanking chromatin (Figure 6B). Several fea-tures of the DNA flanking the 125 bp centromere are consistentwith the idea that this DNA is in a B form configuration anddevoid of protein. First, the concentration of cohesin is reducedat the centromere core and does not increase until 50–100 bpaway from the centromere [15]. Second, nuclease-hypersensi-tive sites (70–90 bp) have been mapped to the region immedi-ately flanking the 125 bp CEN [34]. Third, the region of pericen-tric chromatin is hyperstretched relative to chromosome armsin mitosis [9]. These data suggest that the 70–90 bp of DNA ad-jacent to the centromere may extend to its B form length in vivo(24–30 nm long), linking the centromere at kinetochore microtu-bule plus ends to strands of intramolecularly paired pericentricchromatin that are displaced radially from spindle microtu-bules (Figure 6B).
Cohesin deposition is dependent upon kinetochore function[3]. However cohesin is not essential for intramolecular looping(mcd1-1, Table 1), nor is tension (aF, Figure 5B and Table 1). Incontrast, the loss of the inner centromere binding complexndc10-1 results in loss of the intramolecular loop. Ndc10,along with the other proteins that constitute the core centro-mere-DNA binding factor (CBF3), bends centromere DNAapproximately 60� [35]. This deflection in DNA curvature mayfavor intramolecular loop formation. Cohesin contributes tothe stability and/or extent of pericentric loop formation as evi-denced by the fractional decrease in looping index (2.41 to1.54 in mcd1-1). Cohesin remains concentrated in the vicinityof the spindle poles after spindle collapse with nocodazole(Figure 3G, Figure S4). The fluorescence intensity per pixel is2–3 times brighter after spindle collapse (Figure S4), indicatingthat rather than pericentric chromatin unraveling into the nu-cleus, the chromatin is further condensed or compressed. Ifpericentric chromatin were inelastic, DNA strands would notbe expected to remain aligned tightly with the two collapsedspindle poles. Alternatively, if pericentric chromatin were elas-tic, then upon loss of tension generated by microtubules, thechromatin would condense and retract adjacent to the col-lapsed spindle poles. The latter is observed experimentallyand supports the view that this region behaves as spring-likeelement that generates an inward force [26–28].
Although individual strands of DNA may be quite weaksprings, the spring constant of parallel arrays of springs isthe sum of the individual spring constants. In addition, the
intramolecular pairing of pericentric chromatin confers uniquestructural properties that may be important during mitosis. Atwo-fold increase in the radius of a filament increases its resis-tance to bending 16-fold. The additional loading of cohesin isvery likely to reinforce the tensile strength of these loops, asdemonstrated for the role of condensin in organizing rigid elas-tic chromosomes axes [36].
The depiction of the 16 microtubule attachment sites clus-tered around the mitotic spindle (Figure 6B) may be relevantto understanding the organization of regional kinetochores.Centromeres in budding yeast are small (125 bp) comparedto those in other fungi (30–40 kb in S. pombe) and mammaliancells (w5 Mb). In contrast, the number of microtubules perchromosome is 1 in budding yeast, 2–3 in fission yeast, and25–30 in mammalian cells. Why such a large disparity in centro-mere DNA content, and not in microtubule number? This rangeof DNA sequences specifying kinetochore formation has led tothe classification of point versus regional centromeres [37]. Ifone considers that the centromere comprises the site for kinet-ochore-protein binding as well as pericentric flanking DNA, theratio of pericentric DNA to microtubule may indeed scalethroughout phylogeny (20 kb of pericentric chromatin per mi-crotubule attachment site in yeast versus 1 Mb of centromericchromatin per 30 microtubule attachment sites in mammaliancells = w30 kb per attachment site). Furthermore, sister-cen-tromere pairs are separated by similar distances when undertension (w2 mm, newt lung cell [38], versus w0.8 mm, buddingyeast [9]) despite extreme disparity in spindle size. The viewof a cylindrical arrangement of pericentric chromatin and clus-tered kinetochores in yeast may reflect the structural basis forkinetochore function that is conserved throughout phylogeny.The basic subunit organization of the eukaryotic kinetochore isthe single attachment site. However, multiple attachment sitescan be clustered whether they are on separate chromosomes(as in yeast) or within a single chromosome (as in mammals).There is evolutionary and experimental precedence for theidea that kinetochores are clusters of individual attachmentsites. Indian muntjac kinetochores (2n = 6) are thought to rep-resent a centromere fusion evolved from the smaller Chinesemuntjac progenitor (2n = 46) [39]. On the experimental side, Zin-kowski et al. [40] were able to fragment kinetochores by induc-ing mitosis with unreplicated genomes. This led to the idea thatthe mammalian kinetochore is based on a repeat-subunitstructure. The single microtubule binding site in budding yeastmay be the conserved repeat subunit, and the cluster of16 yeast kinetochores may be comparable to one mammaliankinetochore consisting of multiple attachment sites.
In summary, the cylindrical array of two cohesin subunits,Smc3 and Scc1, observed in vivo and the state of pericentricDNA as mapped by chromatin conformation indicate that peri-centric chromatin is organized into an intramolecular loop thatforms the basis of bioriented sister chromatids. The C loopstructure reveals the geometrical basis for kinetochore bio-rientation and resolves the paradox of maximal interstrandseparation in regions of highest cohesin concentration. Thedata indicate that the chromosome segregation apparatus isa composite structure of two biopolymers, centromere DNAloops and microtubules. C loops provide the compliant linkagebetween stiffer kinetochore microtubules. Cohesin contrib-utes to the stability of the C loops, whereas the kinetochoreprovides the mechanical linkage between C loop DNA andmicrotubules. This intramolecular loop provides a physicalmechanism for biorientation of sister kinetochores. Chromatinbuffers mitotic forces on the chromosome throughout cycles

Current Biology Vol 18 No 290
of microtubule growth and shortening. The chromatin loopsdescribed herein are reminiscent of DNA loops in mammaliankinetochores and may define the fundamental unit for microtu-bule attachment [40].
Supplemental Data
Additional Experimental Procedures, four figures, and one table are available
at http://www.current-biology.com/cgi/content/full/18/2/81/DC1/.
Acknowledgments
This work was supported by a grant from the National Institutes of Health
GM-32238 to K.S.B. We thank members of the laboratory for critical reading
of the manuscript.
Received: November 1, 2007
Revised: November 28, 2007
Accepted: December 7, 2007
Published online: January 17, 2008
References
1. Huang, C.E., Milutinovich, M., and Koshland, D. (2005). Rings, bracelet
or snaps: Fashionable alternatives for Smc complexes. Philos. Trans.
R. Soc. Lond. B Biol. Sci. 360, 537–542.
2. Nasmyth, K., and Haering, C.H. (2005). The structure and function of
SMC and kleisin complexes. Annu. Rev. Biochem. 74, 595–648.
3. Weber, S.A., Gerton, J.L., Polancic, J.E., DeRisi, J.L., Koshland, D., and
Megee, P.C. (2004). The kinetochore is an enhancer of pericentric cohe-
sin binding. PLoS Biol. 2, E260.
4. Blat, Y., and Kleckner, N. (1999). Cohesins bind to preferential sites
along yeast chromosome III, with differential regulation along arms
versus the centric region. Cell 98, 249–259.
5. Straight, A.F., Marshall, W.F., Sedat, J.W., and Murray, A.W. (1997).
Mitosis in living budding yeast: Anaphase A but no metaphase plate.
Science 277, 574–578.
6. Goshima, G., and Yanagida, M. (2000). Establishing biorientation occurs
with precocious separation of the sister kinetochores, but not the arms,
in the early spindle of budding yeast. Cell 100, 619–633.
7. He, X., Asthana, S., and Sorger, P.K. (2000). Transient sister chromatid
separation and elastic deformation of chromosomes during mitosis in
budding yeast. Cell 101, 763–775.
8. Tanaka, T., Fuchs, J., Loidl, J., and Nasmyth, K. (2000). Cohesin ensures
bipolar attachment of microtubules to sister centromeres and resists
their precocious separation. Nat. Cell Biol. 2, 492–499.
9. Pearson, C.G., Maddox, P.S., Salmon, E.D., and Bloom, K. (2001).
Budding yeast chromosome structure and dynamics during mitosis.
J. Cell Biol. 152, 1255–1266.
10. Chen, Y., Baker, R.E., Keith, K.C., Harris, K., Stoler, S., and Fitzgerald-
Hayes, M. (2000). The N terminus of the centromere H3-like protein
Cse4p performs an essential function distinct from that of the histone
fold domain. Mol. Cell. Biol. 20, 7037–7048.
11. Pearson, C.G., Yeh, E., Gardner, M., Odde, D., Salmon, E.D., and Bloom, K.
(2004). Stable kinetochore-microtubule attachment constrains
centromere positioning in metaphase. Curr. Biol. 14, 1962–1967.
12. McCarroll, R.M., and Fangman, W.L. (1988). Time of replication of yeast
centromeres and telomeres. Cell 54, 505–513.
13. Uhlmann, F., Lottspeich, F., and Nasmyth, K. (1999). Sister-chromatid
separation at anaphase onset is promoted by cleavage of the cohesin
subunit Scc1. Nature 400, 37–42.
14. Joglekar, A.P., Bouck, D.C., Molk, J.N., Bloom, K.S., and Salmon, E.D.
(2006). Molecular architecture of a kinetochore-microtubule attachment
site. Nat. Cell Biol. 8, 581–585.
15. Glynn, E.F., Megee, P.C., Yu, H.G., Mistrot, C., Unal, E., Koshland, D.E.,
DeRisi, J.L., and Gerton, J.L. (2004). Genome-wide mapping of the
cohesin complex in the yeast Saccharomyces cerevisiae. PLoS Biol.
2, E259.
16. Eckert, C.A., Gravdahl, D.J., and Megee, P.C. (2007). The enhancement
of pericentromeric cohesin association by conserved kinetochore
components promotes high-fidelity chromosome segregation and is
sensitive to microtubule-based tension. Genes Dev. 21, 278–291.
17. Jamai, A., Imoberdorf, R.M., and Strubin, M. (2007). Continuous histone
H2B and transcription-dependent histone H3 exchange in yeast cells
outside of replication. Mol. Cell 25, 345–355.
18. Bloom, K., Sharma, S., and Dokholyan, N.V. (2006). The path of DNA in
the kinetochore. Curr. Biol. 16, R276–R278.
19. Dekker, J., Rippe, K., Dekker, M., and Kleckner, N. (2002). Capturing
chromosome conformation. Science 295, 1306–1311.
20. Goh, P.Y., and Kilmartin, J.V. (1993). NDC10: A gene involved in chromo-
some segregation in Saccharomyces cerevisiae. J. Cell Biol. 121,
503–512.
21. Espelin, C.W., Simons, K.T., Harrison, S.C., and Sorger, P.K. (2003).
Binding of the essential Saccharomyces cerevisiae kinetochore protein
Ndc10p to CDEII. Mol. Biol. Cell 14, 4557–4568.
22. Hill, A., and Bloom, K. (1987). Genetic manipulation of centromere
function. Mol. Cell. Biol. 7, 2397–2405.
23. Collins, K.A., Castillo, A.R., Tatsutani, S.Y., and Biggins, S. (2005). De
novo kinetochore assembly requires the centromeric histone H3 variant.
Mol. Biol. Cell 16, 5649–5660.
24. Ciosk, R., Shirayama, M., Shevchenko, A., Tanaka, T., Toth, A.,
Shevchenko, A., and Nasmyth, K. (2000). Cohesin’s binding to chromo-
somes depends on a separate complex consisting of Scc2 and Scc4
proteins. Mol. Cell 5, 243–254.
25. Laloraya, S., Guacci, V., and Koshland, D. (2000). Chromosomal ad-
dresses of the cohesin component Mcd1p. J. Cell Biol. 151, 1047–1056.
26. Bouck, D.C., and Bloom, K. (2007). Pericentric chromatin is an elastic
component of the mitotic spindle. Curr. Biol. 17, 741–748.
27. Nicklas, R.B. (1963). A quantitative study of chromosomal elasticity and
its influence on chromosome movement. Chromosoma 14, 276–295.
28. Nicklas, R.B. (1988). The forces that move chromosomes in mitosis.
Annu. Rev. Biophys. Biophys. Chem. 17, 431–449.
29. Guacci, V., Koshland, D., and Strunnikov, A. (1997). A direct link between
sister chromatid cohesion and chromosome condensation revealed
through the analysis of MCD1 in S. cerevisiae. Cell 91, 47–57.
30. Lobachev, K., Vitriol, E., Stemple, J., Resnick, M.A., and Bloom, K.
(2004). Chromosome fragmentation after induction of a double-strand
break is an active process prevented by the RMX repair complex.
Curr. Biol. 14, 2107–2112.
31. Winey, M., Mamay, C.L., O’Toole, E.T., Mastronarde, D.N., Giddings,
T.H., Jr., McDonald, K.L., and McIntosh, J.R. (1995). Three-dimensional
ultrastructural analysis of the Saccharomyces cerevisiae mitotic
spindle. J. Cell Biol. 129, 1601–1615.
32. Gardner, M.K., Pearson, C.G., Sprague, B.L., Zarzar, T.R., Bloom, K.,
Salmon, E.D., and Odde, D.J. (2005). Tension-dependent regulation of
microtubule dynamics at kinetochores can explain metaphase congres-
sion in yeast. Mol. Biol. Cell 16, 3764–3775.
33. Pearson, C.G., Gardner, M.K., Paliulis, L.V., Salmon, E.D., Odde, D.J.,
and Bloom, K. (2006). Measuring nanometer scale gradients in spindle
microtubule dynamics using model convolution microscopy. Mol.
Biol. Cell 17, 4069–4079.
34. Bloom, K.S., and Carbon, J. (1982). Yeast centromere DNA is in a unique
and highly ordered structure in chromosomes and small circular
minichromosomes. Cell 29, 305–317.
35. Pietrasanta, L.I., Thrower, D., Hsieh, W., Rao, S., Stemmann, O.,
Lechner, J., Carbon, J., and Hansma, H. (1999). Probing the Saccharo-
myces cerevisiae centromeric DNA (CEN DNA)-binding factor 3 (CBF3)
kinetochore complex by using atomic force microscopy. Proc. Natl.
Acad. Sci. USA 96, 3757–3762.
36. Almagro, S., Riveline, D., Hirano, T., Houchmandzadeh, B., and
Dimitrov, S. (2004). The mitotic chromosome is an assembly of rigid
elastic axes organized by structural maintenance of chromosomes
(SMC) proteins and surrounded by a soft chromatin envelope. J. Biol.
Chem. 279, 5118–5126.
37. Pluta, A.F., Mackay, A.M., Ainsztein, A.M., Goldberg, I.G., and
Earnshaw, W.C. (1995). The centromere: Hub of chromosomal activities.
Science 270, 1591–1594.
38. Waters, J.C., Skibbens, R.V., and Salmon, E.D. (1996). Oscillating
mitotic newt lung cell kinetochores are, on average, under tension and
rarely push. J. Cell Sci. 109, 2823–2831.
39. He, D., and Brinkley, B.R. (1996). Structure and dynamic organization of
centromeres/prekinetochores in the nucleus of mammalian cells. J. Cell
Sci. 109, 2693–2704.
40. Zinkowski, R.P., Meyne, J., and Brinkley, B.R. (1991). The centromere-
kinetochore complex: A repeat subunit model. J. Cell Biol. 113, 1091–
1110.
Recommended


