
Proteomic characterization of early changes induced bytriiodothyronine in rat liver
Valeria Severino1, Joseph Locker2, Giovanna M. Ledda-Columbano3, AmedeoColumbano3, Augusto Parente1,†, and Angela Chambery1,†,§
1 Department of Life Science, Second University of Naples, Via Vivaldi 43, I-81100 Caserta, Italy2 Department of Pathology, Albert Einstein College of Medicine, 1300 Morris Park Ave., Bronx,NY, 10461, USA3 Department of Toxicology, Oncology and Molecular Pathology Unit, University of Cagliari, ViaPorcell 4, I-09124 Cagliari, Italy
AbstractHigh doses of T3 are mitogenic in liver, causing hyperplasia that has numerous differences fromthe compensatory regeneration induced by partial hepatectomy (PH). T3 binds to the thyroidhormone receptor (TR), which directly regulates transcription, while PH acts indirectly throughsignal transduction pathways. We therefore carried out proteomic analysis to compare early effectsof the two treatments. Transcriptome analysis by DNA microarray also confirmed the observedproteomic changes demonstrated that they were caused by transcriptional regulation. Among thedifferentially expressed proteins, many are directly or indirectly involved in energy metabolism orthe response to oxidative stress. Several enzymes of lipid metabolism (e.g., Acaa2, Acads, Hadh,and Echs1) were differentially regulated by T3. In addition, altered expression levels of severalmitochondrial proteins (e.g. Hspa9, Atp5b, Cps1, Glud1, Aldh2, Ak2, Acads) demonstrated theknown increase of mitochondrial biogenesis mediated by T3. The present results provide insightsin changes in metabolic balance occurring following T3-stimulation and define a basis fordissecting the molecular pathways of hepatocyte hyperplasia.
KeywordsTriiodothyronine; proteomic profiling; hepatectomy; liver regeneration
INTRODUCTIONThe liver carries out many essential body functions. It regulates numerous metabolicprocesses, and acts as the gateway for all chemical substances absorbed through thegastrointestinal tract. Despite its large metabolic load, the liver is almost quiescent in termsof cell proliferation, with very few hepatocytes (<0.01%) undergoing mitosis1–4. This lowcell turnover in healthy liver can be altered by toxic liver injury or surgical resection, whichresults in the sudden and massive proliferation of hepatocytes. Surgical removal of 2/3 of theliver (2/3 PH) represents the most widely used model for studying the molecular changesresponsible for the re-entry of hepatocytes into the cell cycle5, 6. Indeed, several studies of
§To whom correspondence should be addressed: Mailing address: Dipartimento di Scienze della Vita, Seconda Università di Napoli,Via Vivaldi 43, I-81100 Caserta, Italy, Phone: +39 0823 274535; Fax: +39 0823 274571., [email protected].†Equal contribution as co-last author
NIH Public AccessAuthor ManuscriptJ Proteome Res. Author manuscript; available in PMC 2011 July 2.
Published in final edited form as:J Proteome Res. 2011 July 1; 10(7): 3212–3224. doi:10.1021/pr200244f.
NIH
-PA Author Manuscript
NIH
-PA Author Manuscript
NIH
-PA Author Manuscript

liver regeneration following PH have characterised their associated gene expressionpatterns7–10.
Although DNA microarray technology provides insight on genes expression changesassociated with liver regeneration, it fails to detect changes that occur at the translational andpost-translational levels. Furthermore, in human liver and yeast cells, mRNA and proteinlevels may correlate poorly11, 12. Thus, proteomics, a complementary tool for assessingglobal changes in cellular protein expression, provides unique insight into cellular responses.Unfortunately, despite the numerous studies of the gene expression profiles associated withliver regeneration following PH, only a few pioneering works have characterized thecorresponding proteomic expression patterns 13–18. These studies revealed that the earlyresponse to PH showed differential expression of proteins involved in biotransformation,carbohydrate metabolism, lipid metabolism, the respiratory chain and oxidation–phosphorylation13–18. Proteins involved in mitochondrial energy metabolism are ofparticular interest since this process is impaired immediately after PH with overproductionof reactive oxygen species (ROS) and an increase in the mitochondrial GSSG/GSH ratio,along with decreases in the respiratory control index and the rate of the oxidativephosphorylation19, 20. Furthermore, accumulation of Ca2+ in mitochondria is concomitantwith oxidative stress. Despite these biochemical events, usually regarded as pro-apoptotic,neither release of cytochrome c nor appearance of apoptotic nuclei are observed. Thus, thechanges in mitochondria apparently serve to maintain their structural and functionalintegrity.
Recent studies have identified an increasing number of primary mitogens—peroxisomeproliferators (PP), halogenated hydrocarbons, retinoic acids (RA), and thyroid hormone (T3)—able to induce hepatocyte proliferation without causing liver injury, i.e., directhyperplasia21. Among these agents, T3 is a physiological hormone that has considerablepotential for therapy of liver injury22. Liver gene expression changes between hypothyroidand hyperthyroid status after T3 administration were previously investigated23–26.Moreover, a microarray analysis of mitogenic effects of T3 on the rat liver were alsoperformed on euthyroid rats within 3 hr after stimulation27. Complex changes in thetranscripts levels of enzymes involved in intermediary metabolism were observed revealingthe key role of T3 in the regulation of these processes. Nevertheless, the proteomic changescaused by a mitogenic dose of T3 have not been compared to those of liver regeneration. Wetherefore investigated whether protein changes in the early phases of liver regeneration weresimilar to those that occurred during liver hyperplasia induced by T328–30. To this aim, theproteomic profiling of rat liver samples following hepatocyte proliferation induced by amitogenic dose of T3 was performed shortly after treatment and compared to liverregeneration after PH. Moreover, to correlate changes in protein content with mRNA levels,transcriptome analysis by DNA microarray was coupled to proteomic analysis.
EXPERIMENTAL SECTIONMaterials
Chemical reagents and TPCK-treated trypsin were obtained from Sigma (Milan, Italy).Immobilized pH gradient (IPG) buffers, IPG strips, and electrophoresis apparatus werepurchased from Amersham-Biosciences (Milan, Italy). BioRad (Milan, Italy) was the sourceof electrophoresis reagents, including acrylamide, N,N′-methylenebisacrylamide, N,N,N′,N′tetramethylethylenediamine, ammonium persulfate and sodium dodecylsulfate (SDS). Allother reagents were of analytical grade.
Severino et al. Page 2
J Proteome Res. Author manuscript; available in PMC 2011 July 2.
NIH
-PA Author Manuscript
NIH
-PA Author Manuscript
NIH
-PA Author Manuscript

AnimalsMale Wistar rats (175–200 g) purchased from Charles River (Milano, Italy) were treated aspreviously described 31. Briefly, the animals were provided with food and water ad libitumwith a 12 h light/dark daily cycle and were acclimated for one week before the start of theexperiment. Institutional Guidelines for the Care and Use of Laboratory Animals during theinvestigation were followed. Three rats were used for each condition. T3 (Sigma ChemicalCo., St. Louis, Mo.) was administered intraperitoneally as a single mitogenic dose of 20 μg/100 g body weight31. Two-thirds PH was performed according to Higgins and Anderson5.Livers harvested without surgery (controls), or at 6 h after PH- and T3-treatment, were snap-frozen in liquid nitrogen and stored at −80° C until use.
Microarray analysisTotal mRNA was isolated from livers using the guanidium isothiocyanate method (TRIzol;Invitrogen, Carlsbad, CA), followed by precipitation with LiCl 9. 20 μg total RNA waslabelled with the Superscript Plus Direct cDNA Labelling System with Alexa Fluor aha-dUTP (Invitrogen). Labelled product was purified and concentrated with a Microcon YM-50column (Millipore). Two-color hybridization was carried out with red-labelled experimentalsample and green-labelled pooled normal rat liver. The labelled cDNAs were hybridizedovernight at 50° C on aminosilane-coated Corning (Corning, NY) glass slides spotted with33,000 selected oligonucleotide sequences (70-mer Operon mouse 3.0 series), which wereprinted by the Microarray Core Facility of Albert Einstein College of Medicine. Themicroarrays were scanned with a GenePix 4000A scanner (Axon, Burlingame, CA), anddata were acquired through GenePix Pro 6.0 software (Molecular Devices, Sunnyvale, CA).Hybridization data were further normalized without background subtraction, using locallyweighted linear regression (LOWESS) analysis via an in-house program. RNA was isolatedfrom three to four livers in each experimental group, following treatment with T3 or partialhepatectomy, each hybridized to a separate array. The averaged datasets were then compiledin Microsoft Access for further analysis. The analysis in this paper focuses on 6 h treatmentwith T3, except for cell cycle regulators Cyclin D1 and E1, which were characterized fromsequential studies of both treatments.
Sample preparation for two-dimensional electrophoresisThe frozen tissue samples were transferred into quartz mortars and manually grounded inliquid nitrogen. Equal amounts (300 mg) of powdered tissue (100 mg pooled from threebiological replicates) were lysed with 0.5 ml lysis buffer (40 mM Tris-HCl containing 8.3 Murea, 2M thiourea, 2% CHAPS, 1% DTT, and 1 mM PMSF), sonicated, and ultracentrifugedat 20000·g for 15 min at 4° C. The supernatants were collected and protein concentrationdetermined by the Bradford method, according to manufacturer’s instructions (Biorad,Milan, Italy). Lysates were aliquoted and stored at −80 °C until use.
Two-dimensional electrophoresisA total of 700 μg of proteins per gel was analyzed in duplicate by two-dimensionalelectrophoresis (2DE), according to previously reported procedure s32, 33. Samples to beprocessed by isoelectrofocusing (IEF) were mixed with rehydration buffer (8 M urea, 0.5%CHAPS, 0.2% DTT, 0.5% IPG ampholytes and 0.002% bromophenol blue) to a finalvolume of 340 μl. The precast IPG strips (3–10 linear pH gradient, 18 cm long), used for thefirst dimension, were passively rehydrated and loaded with the sample at room temperaturefor 12 h under low-viscosity paraffin oil. IEF was then performed using an IPGphorisoelectric focusing cell, according to the following protocol: 500 V for 700 Vh, 1000 V for1400 Vh, and 8000 V for 34500 Vh. Strips were then equilibrated twice for 15 min withgentle shaking in equilibration solution (6 M urea, 50 mM Tris-HCl buffer, 30% glycerol,
Severino et al. Page 3
J Proteome Res. Author manuscript; available in PMC 2011 July 2.
NIH
-PA Author Manuscript
NIH
-PA Author Manuscript
NIH
-PA Author Manuscript

2% SDS, 0.002% bromophenol blue, and 1% DTT), to reduce disulfide bonds, in the firstequilibration step, and 2.5% iodoacetamide, to alkylate thiols, in the second. Separation byprotein molecular mass was performed in an Ettan DALTsix Electrophoresis Unit onhomogeneous polyacrylamide gels (12% T, 1% C). The equilibrated strips were sealed to thetop of the vertical gel with agarose solution (agarose 0.5% and 0.002% bromophenol bluedissolved in SDS/Tris running buffer) and electrophoresis was carried out at constant power(2.5 W/gel for 30 min followed by 100 W/gel for about 4 h and 30 min) and temperature (20°C), until the blue dye reached the bottom of the gel. At the end of the electrophoresis, thegels were fixed in 50% methanol/ 10% acetic acid for 2 h, and the protein spots visualizedby incubating overnight with colloidal Coomassie blue stain (2% phosphoric acid, 10%ammonium sulphate, 20% methanol, 0.1% Coomassie brilliant blue G-250), followed bythree two-hours washes with deionised water.
Gel scanning and image analysisStained 2D gels were scanned and analysed to compare matching spots. Gels were scannedusing a Molecular Dynamics densitometer, model 375–557 (Amersham Biosciences, Milan,Italy). Gel images were processed for spot detection, background subtraction, and matching,using Melanie Image Master 2D Platinum 7.04 software (GE Healthcare, Milan, Italy). Forimage analysis, the proteomic profile of control rat liver was used as reference pattern andall conditions (T3-induced and PH samples) were matched to the reference pattern. Briefly,relative intensity (RI= vi/vt) of each spot was calculated by dividing volume of the spot bythe total volume of the detected spots on the gels, multiplied by the total area of all the spots.Spots were considered to be differentially expressed if they were either present in differentamount or absent in comparison with the reference gel, and quantitatively different tocorresponding controls when their normalized total volume values differed significantly (P≤0.05) based on ANOVA analysis. Expression intensity ratios of PH/control and T3-treated/control ≥ 1.5 and ≤ 0.5 were set as thresholds indicating significant change.
In-gel tryptic digestionSelected protein spots by 2DE gel image analysis were excised from gels and destained bywashing twice with 100 μl of water, followed by a further washing step with 50%acetonitrile. The gel pieces were then dried in a SpeedVac Vacuum (Savant Instruments,Holbrook, NY) and rehydrated with 15 μl of 50 mM ammonium bicarbonate, followed bythe addition of 1 μl of 70 ng/ml TPCK-treated bovine trypsin solution33. Digestion wasperformed by incubation at 37 °C for 3 h. Further amounts of buffer solution without trypsinwere added when necessary to keep the gel pieces wet during the digestion. Peptides wereextracted in two steps by sequential addition of 1% trifluoroacetic acid (TFA) and then of2% TFA/ 50% acetonitrile for 10 min in a sonication bath. The combined supernatants wereconcentrated in the SpeedVac Vacuum for mass spectrometry (MS) analysis32, 33.
Protein identification by MALDI-TOF mass spectrometryProtein identification by matrix-assisted laser desorption/ionization time-of-flight massspectrometry (MALDI-TOF MS) was performed according to Severino et al.32. Briefly,after in situ tryptic digestion, aliquots of tryptic peptides (1 μl) were mixed with an equalvolume of saturated α-cyano-4-4-hydroxycinnamic acid matrix solution (10 mg/ml inacetonitrile 50% in water) and spotted onto a MALDI-TOF target plate. The droplet wasdried at room temperature. Once the liquid was completely evaporated, the sample wasloaded into the mass spectrometer and analyzed. Peptide spectra were collected in positiveion reflectron mode on a MALDI-TOF micro MX (Waters Co., Manchester, UK), equippedwith a pulsed nitrogen laser (λ=337 nm). The instrument source voltage was set to 12 kV.The pulse voltage was optimized at 1999 V, the detector and reflectron voltages were set to5200 V and 2350 V, respectively. Measurements were performed in the mass range m/z
Severino et al. Page 4
J Proteome Res. Author manuscript; available in PMC 2011 July 2.
NIH
-PA Author Manuscript
NIH
-PA Author Manuscript
NIH
-PA Author Manuscript

850–3000 with a suppression mass gate set to m/z 500 to prevent detector saturation frommatrix cluster peaks and an extraction delay of 600 ns. The instrument was externallycalibrated using a tryptic alcohol dehydrogenase digest (Waters, Milford, MA USA) asstandard. A mass accuracy near to the nominal (50 ppm) was achieved for each standard.The protonated monoisotopic mass of ACTH peptide (m/z 2465.199) was used as internallock mass to further improve the peptide mass accuracy. All spectra were processed andanalyzed using MassLynx 4.1 software (Waters, Milford, MA USA). The obtained spectrawere used to identify proteins by searching a Rattus norvegicus species-specific Swiss-Protdatabase (release 57.0, number of entries 7314) by using Protein Lynx Global Server 2.3software (Waters Co., Manchester, UK). The following searching parameters were used:trypsin specificity for protein cleavage; mass tolerance 100 ppm; allowed number of missedcleavage sites up to 1; cysteine residues modified as carbamidomethyl-cys; minimumnumber of matched peptides 3.
Pathway analysisThe pathway analysis for differentially identified proteins was performed using IngenuityPathways Analysis (IPA) software, version 6.3 (Ingenuity Systems,http://www.ingenuity.com). The lists of differentially expressed proteins were imported intothe IPA platform for batch analysis and identification of the canonical pathways that differbetween the analysed conditions was performed as previously reported32, 34.
RESULTSBoth high dose T3 treatment (200 μg/kg) and PH induce DNA synthesis and cell division inthe rat. Both high dose T3 treatment (200 μg/kg) and PH induce DNA synthesis and celldivision in the rat. Microarray analysis of mRNA for Cyclins D1 (Ccnd1) and E1 (CcnE1)highlights differences between the two proliferative responses (Figure 1). In both cases, thepeak of cyclin E1 precedes the G1-S interface, and occurs 6 h after T3 treatment and 12 hafter PH. Being a direct ligand of a nuclear receptor transcription factor, T3 exerts a rapideffect on gene expression, likely explaining the more rapid increase observed in T3 treatedrats. As expected, PH induces a stronger proliferative response than T3, with 1.8- and 3.2-fold greater peak values of Ccnd1 and CcnE1, respectively. Although the PH and T3responses at 6 h are not synchronous at cell cycle level, we focused on this time point sinceit precedes the restriction point in G1 phase14 and the induction of direct T3 target genes isstrong. At an almost identical time point (7 h) after PH, prominent expression changes atprotein level were previously observed14.
Total liver proteins were extracted from control, PH and T3-treated (T3) samples andseparated by 2D-PAGE using IPG strips with a linear 3–10 pH gradient. A representative2D-PAGE map obtained from control sample is shown in Figure 2A, while those derivedfrom PH- and T3-treated samples at 6 h are shown in Figure 3A and B, respectively. Forreliable analysis of protein expression, 2D gel maps of each sample were performed andanalyzed in duplicate. These showed high correlation coefficients, indicating a highreproducibility. A representative scatter plot for a control sample is shown in Figure 2B,demonstrating a correlation coefficient of 0.98. Similar plots were obtained for PH and T3samples with correlation coefficients of 0.99 and 0.85, respectively. For the control set,310±28 spots were detected, while for the PH and T3 samples 252±2 and 322±23 spots weredetected, respectively. Both PH and T3 samples were compared with the control sample forspot matching. A high number of matched spots was detected for both PH (192 spots,coverage 72%) and T3 (186 spots, coverage 58%). A high matching percentage (67%) wasrevealed when T3-treated rat liver samples were compared to the PH model. An overview ofthe differentially expressed proteins was obtained by comparing the 2D gels of the twoanalysed conditions to the control map. Gel image analysis yielded lists of differentially
Severino et al. Page 5
J Proteome Res. Author manuscript; available in PMC 2011 July 2.
NIH
-PA Author Manuscript
NIH
-PA Author Manuscript
NIH
-PA Author Manuscript

expressed proteins that showed qualitative or quantitative differences between the twotreatments. In particular, 84 spots were quantitatively differentially expressed (ratio ≥ 1.5and ≤ 0.5) in at least one condition (Table 1). In addition, 15 spots were uniquely revealedunder a given condition (Table 2), most corresponding to differentially expressed isoformsof proteins reported in Table 1.
We then used an independent approach to confirm the expression changes of a subset ofdifferentially regulated proteins (Table 3). To this aim, microarray analysis determined themRNA levels of the proteins listed in Table 1 following T3 stimulation. Simple linearregression (p<0.0001, R2 = 0.285; not illustrated) showed strong correlation of mRNA andprotein levels, with only a single outlier, argininosuccinate synthase (Ass1). There were twocomplexities in this correlation. First was the presence of isoforms. Each isoform spot, andthe sum of all isoforms for a particular protein, were compared to mRNA levels (notillustrated). The principal spots gave an excellent correlation (p = 0.0002), but the levels ofmany isoforms were much higher and did not correlate with mRNA levels. This mayindicate that many of the isoforms resulted from post-transcriptional modifications thatprotected the protein from normal turnover. Second, the appearance of the distributionsuggested two populations with different relationships between the RNA and proteinexpression levels (Figure 4). Further analysis showed that the values could be fitted to twoparallel regression lines, with different y intercepts (population 1, p<0.0001, R2 = 0.65;population 2, p<0.0001, R2 = 0.68). These lines suggest classes of mRNA with differenttranslation efficiencies, or proteins with different turnover rates. Alternatively, they mightsimply reflect a technical difference, since Coomassie detection of individual proteins mayvary. Despite these complexities, the mRNA analysis independently confirmed the proteinquantifications, and further demonstrated that both increases and decreases in proteinabundance resulted from transcriptional regulation, the expected mechanism for regulationby a nuclear receptor transcription factor. The analysis also demonstrates that by 6 hr aftertreatment, the synthesis and turnover rates of mRNA and protein have both equilibrated to apoint where global correlations can be observed.
A classification of the differentially expressed proteins was performed according to thecanonical pathways in which they are involved by using Ingenuity Pathways Analysis (IPA)software. These pathways mainly include proteins related to amino acid, lipid andcarbohydrate metabolism, oxidative stress response, energy production, cell-to-cellsignalling, and cell interactions. In all networks, the highest number of identified proteinswas cytosolic, including the organellar proteins. Additional cluster analysis of thedifferentially expressed proteins was also performed on the basis of their molecularfunctions. The greatest number of identified proteins in both conditions were enzymes,including kinases, e.g., adenylate kinase 2 (Ak2, spot 36) and phosphoglycerate kinase 1(Pgk11, spot 54). Six transcription regulators, e.g., calreticulin (Calr, spot 33),nucleophosmin 1 and alpha enolase 1 (Eno1, spots from 8 to 8c), were also differentiallyexpressed in PH and T3 samples.
In addition, many molecular chaperones and folding catalysts were found differentiallyexpressed following PH and T3 treatment (Supplementary Figure 1, SupportingInformation). Among proteins involved in protein folding, peptidylprolyl cis-trans isomerase(Ppia, cyclophilin A, spots 65 and 65a) was found slightly up-regulated in T3-treated rats,showing also the presence of a second acidic isoform (Supplementary Figure 1E) withrespect to control and PH samples. Members of the heat shock protein 70 family (HSPs)were differentially regulated, including 78 kDa glucose regulated protein (Hspa5 spot 1,Supplementary Figure 1A), stress 70 protein mitochondrial (Hspa9 spots from 3 to 3bSupplementary Figure 1B), heat shock related 70 kDa (Hspa2 spot 41, Supplementary
Severino et al. Page 6
J Proteome Res. Author manuscript; available in PMC 2011 July 2.
NIH
-PA Author Manuscript
NIH
-PA Author Manuscript
NIH
-PA Author Manuscript

Figure 1C) and heat shock 70 kDa (Hspa1b spot 47, Supplementary Figure 1D). For severalHSPs, a common response was revealed for both PH and T3 treatment.
In addition, proteins involved in the oxidative stress response were differentially expressed(Supplementary Figure 2, Supporting Information), such as the superoxide dismutase 1(Sod1, spots 26 and 26a). The main Sod1 isoform showed increased expression levels inboth conditions. For the liver arginase 1 (Arg1, spots 28 and 28a), involved in the urea cycleand in nitric oxide response, the increasing of a strong acidic isoform was observed in bothPH and T3 stimulated samples (Supplementary Figure 2H).
Many differentially expressed proteins were involved in energy metabolism (SupplementaryFigure 3, Supporting Information), in particular, enzymes involved in fatty acid beta-oxidation. These included enoyl CoA hydratase (Echs1, spots 19 and 19a), hydroxyacyl-coenzyme A dehydrogenase (Hadh, spot 69), 3-ketoacyl CoA thiolase (Acaa2, spots 10 and10a), and acyl CoA dehydrogenase (Acads, spots 38 and 38a). To further investigate thelipid metabolism response following T3 treatment, we used microarrays to detect expressionchanges of additional lipid regulators that were below the threshold of proteomic detection(Table 4). T3 stimulated expression of several enzymes involved in lipolysis includingpatatin-like phospholipase domain-containing protein 2 (Pnpla2), monoglyceride lipase(Mgll), and lysophospholipase 2 (Lypla2). Genes coding for the “carnitine shuttle” enzymes—carnitine-acylcarnitine translocase (Crat) and carnitine palmitoyltransferase (Cpt1a)—were also up-regulated following T3 stimulation.
Lipid metabolism is closely connected to the metabolism of carbohydrates that may beconverted to fats. Therefore it is not surprising that proteomic analysis also showedsignificant differences of several metabolic enzymes (e.g. fructose 1,6 bisphosphatase)between PH and T3 samples (see discussion). Significantly enriched categories fordifferentially expressed proteins upon T3 stimulation were related to biological functionsand tissue related pathologies using IPA software (Figure 5). The significantly enrichedcategories under biological function of differentially expressed proteins revealed that mostof them were involved in oxidative stress and fatty acid metabolism (Figure 5A). Inparticular, a significant number of proteins was involved in the oxidative stress responsemediated by Nrf2. This transcription factor is a crucial player in the defence againstoxidative stress whose role in liver regeneration has been recently proposed based on theregulation of the ROS-mediated insulin/IGF-1 resistance35. As expected, with regard thebiological effects of treatment, the largest category was related to liver hyperplasia/hyperproliferation for both PH and T3 stimulated samples (Figure 5B).
To better understand the mutual interactions of differentially identified proteins, networkmaps were constructed using the in silico IPA software. The pathways obtained for PH arereported in Supplementary Figure 4, Supporting Information. The first two pathwaysconverged on NFκB-p38MAPK and TNFα-INFγ networks with twenty-four and thirteenproteins, respectively. It is well known that NFkB is activated by TNFα after PH, leading tothe priming of hepatocytes and enhancing their sensitivity to mitogens (e.g. HGF, EGF,TGFα)36. In addition, two additional pathways—converging on MYC-ERK-AKT andGLUT4 (SLC2A4)-Hepatocyte nuclear factor 4α (HNF4A) signalling—were identified inPH (Supplementary Figure 5, Supporting Information). Both pathways are known to beinvolved in a variety of functions related with apoptosis, proliferation, and cell-cycleprogression37. In particular, HNF4A, a transcription factor of the nuclear hormone receptorsuperfamily, defines the expression of liver-specific genes encoding apolipoproteins, serumfactors, cytochrome P-450 isoforms and proteins involved in the metabolism of glucose,fatty acids, and amino acids essential for hepatocyte differentiation and liver development36.The differentially expressed proteins after T3 stimulation converged on pathways involving
Severino et al. Page 7
J Proteome Res. Author manuscript; available in PMC 2011 July 2.
NIH
-PA Author Manuscript
NIH
-PA Author Manuscript
NIH
-PA Author Manuscript

similar core molecules, i.e., NFkB-p38MAPK and GLUT4-Leptin networks,(Supplementary Figure 6, Supporting Information). Indeed, twenty-four proteins wereinvolved in the NFkB-p38MAPK pathway, while seventeen proteins were mapped on theGLUT4-Leptin network. It should be noted that although the resulting pathways are verysimilar, the occurrence of common activation signalling cascade cannot be inferred on thebasis of present data. Indeed, several differentially expressed proteins among T3 and PHconditions could have a different effects, (i.e., activation or inhibition), on the pathways.These mechanisms, however, are highly complex and their proper interpretation wouldrequire further investigation which lies outside the scope of the present study.
DISCUSSIONThe finding that many hepatomitogens are ligands of nuclear receptors led us to hypothesizethat signal transduction pathways in hyperplasia were different from those of in liverregeneration, since the latter are mediated by classical membrane-receptors21, 31. Amonghepatomitogens, T3 is of particular interest, since its administration causes a rapidregression of carcinogen-induced hepatic nodules, and reduces the incidence ofhepatocellular carcinoma and lung metastasis38. Thus, precise knowledge of the mechanismscausing the mitogenic effect of T3 could lead to therapies for liver cancer, as well astherapies that stimulate liver repopulation after injury or transplantation.
The present work focuses on early molecular events occurring after treatment with T3, toinvestigate specific changes of gene and protein expression patterns. The differentiallyexpressed proteins were involved in pathways related to energy metabolism, carbohydrates,lipids, and amino acids (Figure 6). In addition, pathways of oxidative stress, xenobioticdetoxification, and urea metabolism were also altered after T3 treatment.
As a vital organ, the liver must maintain metabolic homeostasis and energy supply duringthe regenerative process. Thus it is not surprising that several proteins associated withglycolysis/gluconeogenesis pathways were differentially expressed between PH and T3treatment. One is fructose 1,6 bisphosphatase, a key enzyme involved in gluconeogenesis.This enzyme was slightly down-regulated in PH but up-regulated after T3 treatment.Gluconeogenesis, together with glycogen breakdown, contributes to both to glucosehomeostasis, and synthetic pathways39, 40. Similarly, some glycolytic enzymes—e.g.,fructose bisphosphate/ aldolase B (Fbp1) and glyceraldehyde-3-phosphate dehydrogenase(Gapdh)—were down-regulated in both conditions. Despite the loss of two thirds of itsfunctional mass, the liver is capable of stabilizing the blood glucose by increasinggluconeogenesis and glycogenolysis. It also shifts energy substrate utilization from glucoseto free fatty acids (FFA). Intracellular energy demand increases during the early PH phaseswhen glycolysis is preferentially utilized for ATP supply by the surviving hepatocytes.Subsequently FFA are the main energy substrate41. Accordingly, induction of enzymesisoforms involved in lipid metabolism (e.g., Acaa2, Acads, Hadh, and Echs1) weredifferentially expressed upon T3 stimulation. Among these, acyl-CoA dehydrogenase(Acads) is involved in the beta-oxidation of short chain fatty acids. This finding is ofparticular interest as it has been reported that liver regeneration process is impaired whenfatty acid oxidation is inhibited by inhibitors of beta-oxidation42.
Beyond their roles in energy storage and as membrane constituents, fatty acids are alsobioactive molecules that regulate a multitude of physiological processes. Thus, the increasedβ-oxidation might change intracellular signalling by peroxisome proliferator-activatedreceptors (PPAR)43. PPAR are the major regulators of lipid and fatty acid metabolism andregulate transport, oxidation, storage, and synthesis. Furthermore, responses mediated byseveral other transcription factors are regulated by fatty acid regulation, including sterol
Severino et al. Page 8
J Proteome Res. Author manuscript; available in PMC 2011 July 2.
NIH
-PA Author Manuscript
NIH
-PA Author Manuscript
NIH
-PA Author Manuscript

regulatory element binding protein-1c (SREBP1c), hepatic nuclear factor 4 (HNF4), theretinoid X receptor (RXR), and the liver X receptor (LXR)44–46.
Several lines of evidence suggest that fatty acids generated from intracellular triacylglycerolhydrolysis may have important roles in signalling by PPAR43, and our data show thatsignalling by TR also affects these pathways. In this framework, lipolysis is an importantmetabolic pathway controlling energy homeostasis through degradation of triglyceridesstored in lipid droplets and release of fatty acids. Lipid droplets include a neutral lipid corecomposed largely of triglycerides, surrounded by a phospholipid monolayer and coated withsurface proteins. Triglyceride hydrolysis represents a significant source of intracellular fattyacids. T3 stimulates enzymes that regulate these droplets, including the adiposedifferentiation related protein (Adfp) and patatin-like phospholipase domain-containingprotein 2 (Pnpla2; also known as adipose triglyceride lipase, ATGL). Pnpla2 catalyzes theinitial hydrolysis of triglycerides into diglycerides while Adfp is a major component of thelipid droplet surface. T3 also stimulates up-regulation of the apoliprotein A-IV, a majorlipid-transporter. Two genes coding for “carnitine shuttle” enzymes (carnitine-acylcarnitinetranslocase, carnitine palmitoyltransferase), used by the cell to facilitate the import ofhydrophobic long-chain fatty acids from the cytosol into the mitochondrial matrix, were alsoup-regulated following T3 stimulation.
Other metabolic pathways play a key role in the regulation of events that are necessary forliver regeneration, including the transsulfuration pathway—that utilizes methionine for GSHsynthesis—is particularly active in the liver47. This pathway also links to metabolism of S-adenosine methionine (SAM) a methyl donor and a key metabolite that regulates hepatocytegrowth, death, and differentiation48–51. Several differences between PH and T3 treatmentrelated to arginine metabolism. Arginine functions as a precursor for the synthesis not onlyof proteins, but also of nitric oxide, urea, polyamines, proline, glutamate and creatine52,53.Two isoforms of arginase 1 (Arg1) were identified in both T3 and PH samples. Although anoverall up-regulation was revealed for the arginase isoforms, their regulation levels wereslightly different for T3 and PH samples. Similarly, two other enzymes involved in thearginine metabolism—carbamoyl-P synthase (Cps1) and argininosuccinate synthase (Ass1)—showed different regulation after T3 and PH treatment. In particular, Ass1, whichcatalyzes the synthesis of argininosuccinate from citrulline and aspartate, is strongly up-regulated by T3 but down-regulated following hepatectomy. Taken together these resultssuggest differences in arginine metabolism that can be related to the production of nitricoxide, a well known inducer of oxidative stress. Moreover, treatment with T3 has beendemonstrated to induce oxidative stress in rat liver54.
Intracellular antioxidant enzyme activities, and exogenously administered antioxidants, canmodulate liver proliferation20, 55,42. Oxidative stress can also lead to damage of thiols,lipids, proteins, and nucleic acids56. Thus, it is not surprising that several differentiallyexpressed proteins induced by both PH and T3 were modulators of oxidative stress. Amongthese cellular protective enzymes, glutathione S-transferase protects against oxidant toxicityand contributes to the regulation of stress-mediated apoptosis57. Two other differentiallyexpressed proteins involved in the oxidative stress response are superoxide dismutase (Sod1)and peroxiredoxin 1 (Pdx1). The latter, involved in the detoxification of hydrogen peroxide,was strongly and selectively up-regulated after T3 treatment.
CONCLUSIONSThis study represents the first attempt to identify, by a proteomic approach, differencesbetween the hepatic proliferative responses induced by T3 and liver regeneration.Microarray analysis of mRNA confirmed the proteomic findings, and demonstrated that the
Severino et al. Page 9
J Proteome Res. Author manuscript; available in PMC 2011 July 2.
NIH
-PA Author Manuscript
NIH
-PA Author Manuscript
NIH
-PA Author Manuscript

changes in protein levels were caused by transcriptional regulation. A more comprehensivetranscriptomic characterization of the T3-induced mRNA expression is in progress butoutside of the scope of the present study. We mapped a highly orchestrated series ofmolecular events that can derive and/or influence cellular proliferation. Several expressedproteins showed similar effects after both PH and T3 treatment. Those showing differentialeffects of T3 treatment were mainly metabolic enzymes, and this paper provides the firstproteomic characterization of these metabolic changes. The differential regulation oftranscripts and proteins involved in lipid and energy metabolism following T3 stimulationdeserves further investigation since it is known that changes in cellular energy metabolismare associated with liver regeneration. Cell proliferation and metabolic regulation mustoccur in a synchronous manner as recently highlighted in cancer model systems58. Themetabolic changes related to regeneration and hyperplasia are therefore of fundamentalimportance for understanding the coordination of DNA synthesis and mitosis that drive livercell proliferation. The regulation of metabolic pathways often occurs by covalentmodification of key hepatic enzymes (e.g., phosphorylation/dephosphorylation oracetylation/deacetylation). Although the deeper characterization of post-translationalmodification of metabolic enzymes is beyond the scope of this work, the occurrence ofmultiple isoforms for several enzymes suggests the occurrence of enzyme regulation at thepost-translational level. This study has demonstrated proteomic changes that distinguish T3treatment from liver regeneration. Further studies that characterize the specific modificationsof these proteins will provide unique insight into the mechanism by which T3 induceshepatocyte proliferation.
Supplementary MaterialRefer to Web version on PubMed Central for supplementary material.
AcknowledgmentsThis study was supported by funds from the Second University of Naples, AIRC (Grant IG-5925), Italy; and NIHgrant CA104292, USA.
References1. Starzl TE, Porter KA, Francavilla JA, Benichou J, Putnam CW. A hundred years of the
hepatotrophic controversy. Ciba Found Symp. 1977; 55:111–29. [PubMed: 207494]2. Fausto N, Webber EM. Control of liver growth. Crit Rev Eukaryot Gene Expr. 1993; 3 (2):117–35.
[PubMed: 8324292]3. Diehl AM, Rai R. Review: regulation of liver regeneration by pro-inflammatory cytokines. J
Gastroenterol Hepatol. 1996; 11 (5):466–70. [PubMed: 8743919]4. Michalopoulos GK, DeFrances MC. Liver regeneration. Science. 1997; 276 (5309):60–6. [PubMed:
9082986]5. Higgins AR. Experimental pathology of the liver. I. Restoration of the liver of the white rat
following surgical removal. Archives of Pathology and Laboratory Medicine. 1931; (12):186–206.6. Palmes D, Spiegel HU. Animal models of liver regeneration. Biomaterials. 2004; 25 (9):1601–11.
[PubMed: 14697862]7. White P, Brestelli JE, Kaestner KH, Greenbaum LE. Identification of transcriptional networks
during liver regeneration. J Biol Chem. 2005; 280 (5):3715–22. [PubMed: 15546871]8. Fukuhara Y, Hirasawa A, Li XK, Kawasaki M, Fujino M, Funeshima N, Katsuma S, Shiojima S,
Yamada M, Okuyama T, Suzuki S, Tsujimoto G. Gene expression profile in the regenerating ratliver after partial hepatectomy. J Hepatol. 2003; 38 (6):784–92. [PubMed: 12763372]
9. Locker J, Tian J, Carver R, Concas D, Cossu C, Ledda-Columbano GM, Columbano A. A commonset of immediate-early response genes in liver regeneration and hyperplasia. Hepatology. 2003; 38(2):314–25. [PubMed: 12883475]
Severino et al. Page 10
J Proteome Res. Author manuscript; available in PMC 2011 July 2.
NIH
-PA Author Manuscript
NIH
-PA Author Manuscript
NIH
-PA Author Manuscript
10. Cressman DE, Greenbaum LE, DeAngelis RA, Ciliberto G, Furth EE, Poli V, Taub R. Liver failureand defective hepatocyte regeneration in interleukin-6-deficient mice. Science. 1996; 274 (5291):1379–83. [PubMed: 8910279]
11. Gygi SP, Rochon Y, Franza BR, Aebersold R. Correlation between protein and mRNA abundancein yeast. Mol Cell Biol. 1999; 19 (3):1720–30. [PubMed: 10022859]
12. Anderson L, Seilhamer J. A comparison of selected mRNA and protein abundances in human liver.Electrophoresis. 1997; 18 (3–4):533–7. [PubMed: 9150937]
13. Cao H, Yu J, Xu W, Jia X, Yang J, Pan Q, Zhang Q, Sheng G, Li J, Pan X, Wang Y, Li L.Proteomic analysis of regenerating mouse liver following 50% partial hepatectomy. Proteome Sci.2009; 7:48. [PubMed: 20040084]
14. Guo F, Nian H, Zhang H, Huang L, Tang Y, Xiao X, He D. Proteomic analysis of the transitionfrom quiescent to proliferating stages in rat liver hepatectomy model. Proteomics. 2006; 6 (10):3075–86. [PubMed: 16619303]
15. Hsieh HC, Chen YT, Li JM, Chou TY, Chang MF, Huang SC, Tseng TL, Liu CC, Chen SF.Protein profilings in mouse liver regeneration after partial hepatectomy using iTRAQ technology.J Proteome Res. 2009; 8 (2):1004–13. [PubMed: 19099420]
16. Strey CW, Winters MS, Markiewski MM, Lambris JD. Partial hepatectomy induced liver proteomechanges in mice. Proteomics. 2005; 5 (1):318–25. [PubMed: 15602770]
17. Sun Q, Miao M, Jia X, Guo W, Wang L, Yao Z, Liu C, Jiao B. Subproteomic analysis of themitochondrial proteins in rats 24 h after partial hepatectomy. J Cell Biochem. 2008; 105 (1):176–84. [PubMed: 18523981]
18. Sun Y, Deng X, Li W, Yan Y, Wei H, Jiang Y, He F. Liver proteome analysis of adaptive responsein rat immediately after partial hepatectomy. Proteomics. 2007; 7 (23):4398–407. [PubMed:17979177]
19. Guerrieri F, Pellecchia G, Lopriore B, Papa S, Esterina Liquori G, Ferri D, Moro L, Marra E,Greco M. Changes in ultrastructure and the occurrence of permeability transition in mitochondriaduring rat liver regeneration. Eur J Biochem. 2002; 269 (13):3304–12. [PubMed: 12084072]
20. Lee FY, Li Y, Zhu H, Yang S, Lin HZ, Trush M, Diehl AM. Tumor necrosis factor increasesmitochondrial oxidant production and induces expression of uncoupling protein-2 in theregenerating mice [correction of rat] liver. Hepatology. 1999; 29 (3):677–87. [PubMed: 10051468]
21. Columbano A, Shinozuka H. Liver regeneration versus direct hyperplasia. Faseb J. 1996; 10 (10):1118–28. [PubMed: 8751714]
22. Columbano A, Simbula M, Pibiri M, Perra A, Deidda M, Locker J, Pisanu A, Uccheddu A, Ledda-Columbano GM. Triiodothyronine stimulates hepatocyte proliferation in two models of impairedliver regeneration. Cell Prolif. 2008; 41 (3):521–31. [PubMed: 18422700]
23. Weitzel JM, Hamann S, Jauk M, Lacey M, Filbry A, Radtke C, Iwen KA, Kutz S, Harneit A,Lizardi PM, Seitz HJ. Hepatic gene expression patterns in thyroid hormone-treated hypothyroidrats. J Mol Endocrinol. 2003; 31 (2):291–303. [PubMed: 14519097]
24. Weitzel JM, Radtke C, Seitz HJ. Two thyroid hormone-mediated gene expression patterns in vivoidentified by cDNA expression arrays in rat. Nucleic Acids Res. 2001; 29 (24):5148–55. [PubMed:11812848]
25. Feng X, Jiang Y, Meltzer P, Yen PM. Thyroid hormone regulation of hepatic genes in vivodetected by complementary DNA microarray. Mol Endocrinol. 2000; 14 (7):947–55. [PubMed:10894146]
26. Flores-Morales A, Gullberg H, Fernandez L, Stahlberg N, Lee NH, Vennstrom B, Norstedt G.Patterns of liver gene expression governed by TRbeta. Mol Endocrinol. 2002; 16 (6):1257–68.[PubMed: 12040013]
27. Bungay A, Selden C, Brown D, Malik R, Hubank M, Hodgson H. Microarray analysis ofmitogenic effects of T3 on the rat liver. J Gastroenterol Hepatol. 2008; 23 (12):1926–33.[PubMed: 18717759]
28. Francavilla A, Carr BI, Azzarone A, Polimeno L, Wang Z, Van Thiel DH, Subbotin V, Prelich JG,Starzl TE. Hepatocyte proliferation and gene expression induced by triiodothyronine in vivo and invitro. Hepatology. 1994; 20 (5):1237–41. [PubMed: 7927257]
Severino et al. Page 11
J Proteome Res. Author manuscript; available in PMC 2011 July 2.
NIH
-PA Author Manuscript
NIH
-PA Author Manuscript
NIH
-PA Author Manuscript

29. Malik R, Habib M, Tootle R, Hodgson H. Exogenous thyroid hormone induces liver enlargement,whilst maintaining regenerative potential--a study relevant to donor preconditioning. Am JTransplant. 2005; 5 (8):1801–7. [PubMed: 15996226]
30. Kowalik MA, Perra A, Pibiri M, Cocco MT, Samarut J, Plateroti M, Ledda-Columbano GM,Columbano A. TRbeta is the critical thyroid hormone receptor isoform in T3-induced proliferationof hepatocytes and pancreatic acinar cells. J Hepatol. 2010; 53 (4):686–92. [PubMed: 20638743]
31. Pibiri M, Ledda-Columbano GM, Cossu C, Simbula G, Menegazzi M, Shinozuka H, ColumbanoA. Cyclin D1 is an early target in hepatocyte proliferation induced by thyroid hormone (T3). FasebJ. 2001; 15 (6):1006–13. [PubMed: 11292661]
32. Severino V, Chambery A, Vitiello M, Cantisani M, Galdiero S, Galdiero M, Malorni L, Di MaroA, Parente A. Proteomic analysis of human U937 cell line activation mediated by Haemophilusinfluenzae type b P2 porin and its surface-exposed loop 7. J Proteome Res. 2010; 9 (2):1050–62.[PubMed: 20043682]
33. Chambery A, Farina A, Di Maro A, Rossi M, Abbondanza C, Moncharmont B, Malorni L, CacaceG, Pocsfalvi G, Malorni A, Parente A. Proteomic analysis of MCF-7 cell lines expressing the zinc-finger or the proline-rich domain of retinoblastoma-interacting-zinc-finger protein. J ProteomeRes. 2006; 5 (5):1176–85. [PubMed: 16674107]
34. Mendelsohn BA, Malone JP, Townsend R, Gitlin J. Proteomic analysis of anoxia tolerance in thedeveloping zebrafish embryo. Comparative Biochemistry and Physiology, Part D. 2009; 4 (1):21–31.
35. Beyer TA, Xu W, Teupser D, auf dem Keller U, Bugnon P, Hildt E, Thiery J, Kan YW, Werner S.Impaired liver regeneration in Nrf2 knockout mice: role of ROS-mediated insulin/IGF-1resistance. Embo J. 2008; 27 (1):212–23. [PubMed: 18059474]
36. Taub R. Liver regeneration 4: transcriptional control of liver regeneration. Faseb J. 1996; 10 (4):413–27. [PubMed: 8647340]
37. Wierstra I, Alves J. The c-myc promoter: still MysterY and challenge. Adv Cancer Res. 2008;99:113–333. [PubMed: 18037408]
38. Ledda-Columbano GM, Perra A, Loi R, Shinozuka H, Columbano A. Cell proliferation induced bytriiodothyronine in rat liver is associated with nodule regression and reduction of hepatocellularcarcinomas. Cancer Res. 2000; 60 (3):603–9. [PubMed: 10676643]
39. Rosa JL, Bartrons R, Tauler A. Gene expression of regulatory enzymes of glycolysis/gluconeogenesis in regenerating rat liver. Biochem J. 1992; 287 (Pt 1):113–6. [PubMed: 1329724]
40. Haber BA, Chin S, Chuang E, Buikhuisen W, Naji A, Taub R. High levels of glucose-6-phosphatase gene and protein expression reflect an adaptive response in proliferating liver anddiabetes. J Clin Invest. 1995; 95 (2):832–41. [PubMed: 7860767]
41. Lai HS, Chen WJ, Chen KM. Energy substrate for liver regeneration after partial hepatectomy inrats: effects of glucose vs fat. JPEN J Parenter Enteral Nutr. 1992; 16 (2):152–6. [PubMed:1556811]
42. Nakatani T, Ozawa K, Asano M, Ukikusa M, Kamiyama Y, Tobe T. Differences in predominantenergy substrate in relation to the resected hepatic mass in the phase immediately afterhepatectomy. J Lab Clin Med. 1981; 97 (6):887–98. [PubMed: 7229515]
43. Sapiro JM, Mashek MT, Greenberg AS, Mashek DG. Hepatic triacylglycerol hydrolysis regulatesperoxisome proliferator-activated receptor alpha activity. J Lipid Res. 2009; 50 (8):1621–9.[PubMed: 19304987]
44. Pegorier JP, Le May C, Girard J. Control of gene expression by fatty acids. J Nutr. 2004; 134 (9):2444S–2449S. [PubMed: 15333740]
45. Dhe-Paganon S, Duda K, Iwamoto M, Chi YI, Shoelson SE. Crystal structure of the HNF4 alphaligand binding domain in complex with endogenous fatty acid ligand. J Biol Chem. 2002; 277(41):37973–6. [PubMed: 12193589]
46. Ou J, Tu H, Shan B, Luk A, DeBose-Boyd RA, Bashmakov Y, Goldstein JL, Brown MS.Unsaturated fatty acids inhibit transcription of the sterol regulatory element-binding protein-1c(SREBP-1c) gene by antagonizing ligand-dependent activation of the LXR. Proc Natl Acad Sci US A. 2001; 98 (11):6027–32. [PubMed: 11371634]
Severino et al. Page 12
J Proteome Res. Author manuscript; available in PMC 2011 July 2.
NIH
-PA Author Manuscript
NIH
-PA Author Manuscript
NIH
-PA Author Manuscript

47. Lu SC. Regulation of hepatic glutathione synthesis: current concepts and controversies. Faseb J.1999; 13 (10):1169–83. [PubMed: 10385608]
48. Corrales FJ, Perez-Mato I, Sanchez Del Pino MM, Ruiz F, Castro C, Garcia-Trevijano ER, LatasaU, Martinez-Chantar ML, Martinez-Cruz A, Avila MA, Mato JM. Regulation of mammalian livermethionine adenosyltransferase. J Nutr. 2002; 132 (8 Suppl):2377S–2381S. [PubMed: 12163696]
49. Huang ZZ, Mao Z, Cai J, Lu SC. Changes in methionine adenosyltransferase during liverregeneration in the rat. Am J Physiol. 1998; 275 (1 Pt 1):G14–21. [PubMed: 9655679]
50. Martinez-Chantar ML, Vazquez-Chantada M, Garnacho M, Latasa MU, Varela-Rey M, Dotor J,Santamaria M, Martinez-Cruz LA, Parada LA, Lu SC, Mato JM. S-adenosylmethionine regulatescytoplasmic HuR via AMP-activated kinase. Gastroenterology. 2006; 131 (1):223–32. [PubMed:16831604]
51. Cai J, Mao Z, Hwang JJ, Lu SC. Differential expression of methionine adenosyltransferase genesinfluences the rate of growth of human hepatocellular carcinoma cells. Cancer Res. 1998; 58 (7):1444–50. [PubMed: 9537246]
52. Wu G, Morris SM Jr. Arginine metabolism: nitric oxide and beyond. Biochem J. 1998; 336 (Pt 1):1–17. [PubMed: 9806879]
53. Lancaster JR Jr, Xie K. Tumors face NO problems? Cancer Res. 2006; 66 (13):6459–62. [PubMed:16818612]
54. Fernandez V, Tapia G, Varela P, Castillo I, Mora C, Moya F, Orellana M, Videla LA. Redox up-regulated expression of rat liver manganese superoxide dismutase and Bcl-2 by thyroid hormone isassociated with inhibitor of kappaB-alpha phosphorylation and nuclear factor-kappaB activation. JEndocrinol. 2005; 186 (3):539–47. [PubMed: 16135673]
55. Gavino VC, Dillard CJ, Tappel AL. Effect of dietary vitamin E and Santoquin on regenerating ratliver. Life Sci. 1985; 36 (18):1771–7. [PubMed: 2858807]
56. Aslam S, Santha T, Leone A, Wilcox C. Effects of amlodipine and valsartan on oxidative stressand plasma methylarginines in end-stage renal disease patients on hemodialysis. Kidney Int. 2006;70 (12):2109–15. [PubMed: 17063175]
57. Sharma R, Yang Y, Sharma A, Awasthi S, Awasthi YC. Antioxidant role of glutathione S-transferases: protection against oxidant toxicity and regulation of stress-mediated apoptosis.Antioxid Redox Signal. 2004; 6 (2):289–300. [PubMed: 15025930]
58. Cairns RA, Harris IS, Mak TW. Regulation of cancer cell metabolism. Nat Rev Cancer. 2011; 11(2):85–95. [PubMed: 21258394]
Severino et al. Page 13
J Proteome Res. Author manuscript; available in PMC 2011 July 2.
NIH
-PA Author Manuscript
NIH
-PA Author Manuscript
NIH
-PA Author Manuscript

Figure 1.Expression of cell cycle regulators Cyclin D1 and E1. The plots show the patterns of changebetween the minimum (0) and maximum (1.0) level of expression for each mRNA. Datawere averaged from 3 – 4 microarrays from each time point.
Severino et al. Page 14
J Proteome Res. Author manuscript; available in PMC 2011 July 2.
NIH
-PA Author Manuscript
NIH
-PA Author Manuscript
NIH
-PA Author Manuscript
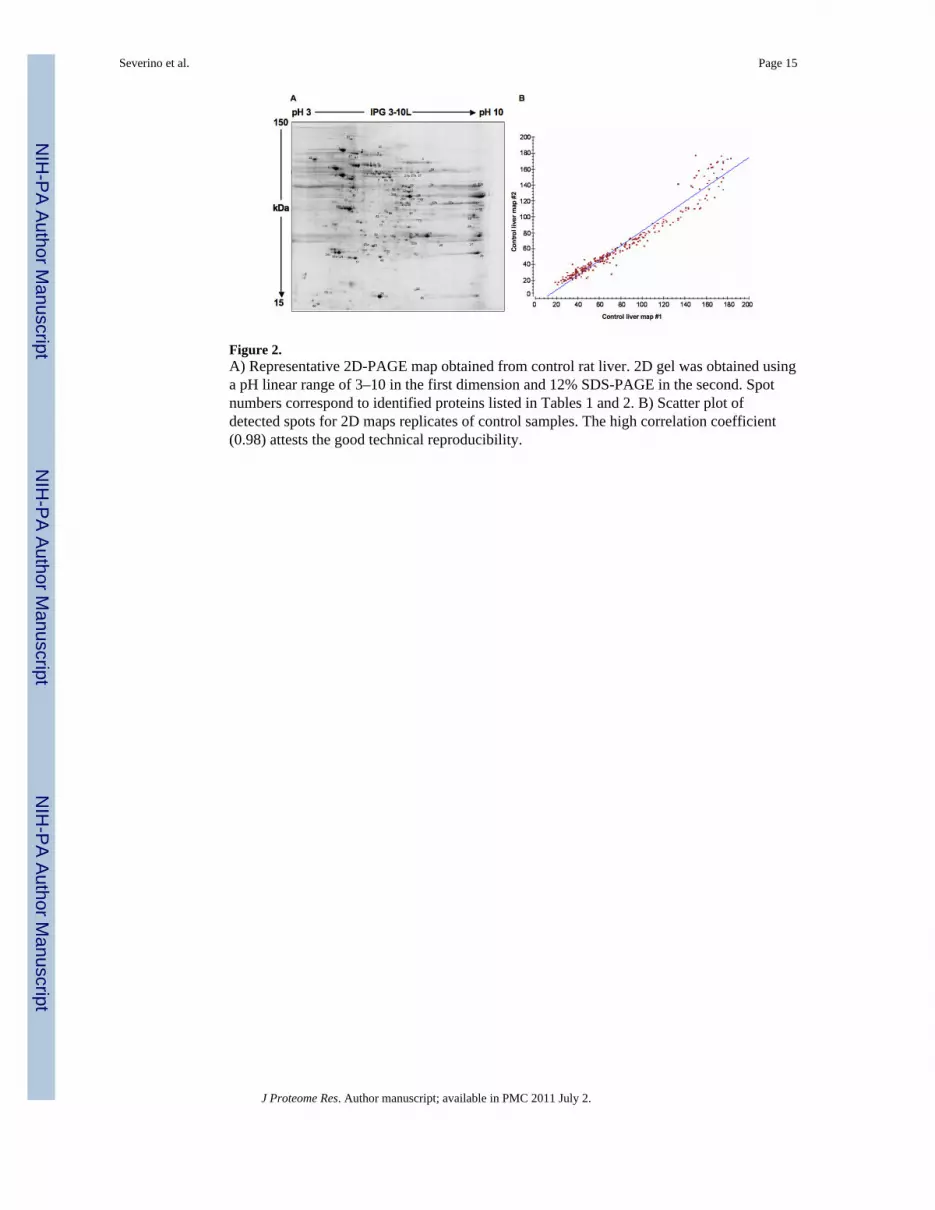
Figure 2.A) Representative 2D-PAGE map obtained from control rat liver. 2D gel was obtained usinga pH linear range of 3–10 in the first dimension and 12% SDS-PAGE in the second. Spotnumbers correspond to identified proteins listed in Tables 1 and 2. B) Scatter plot ofdetected spots for 2D maps replicates of control samples. The high correlation coefficient(0.98) attests the good technical reproducibility.
Severino et al. Page 15
J Proteome Res. Author manuscript; available in PMC 2011 July 2.
NIH
-PA Author Manuscript
NIH
-PA Author Manuscript
NIH
-PA Author Manuscript

Figure 3.Representative 2D-PAGE map obtained from PH- (A) and T3-treated (B) samples. Forexperimental details see legend of Figure 1. Spot numbers correspond to identified proteinslisted in Tables 1 and 2.
Severino et al. Page 16
J Proteome Res. Author manuscript; available in PMC 2011 July 2.
NIH
-PA Author Manuscript
NIH
-PA Author Manuscript
NIH
-PA Author Manuscript
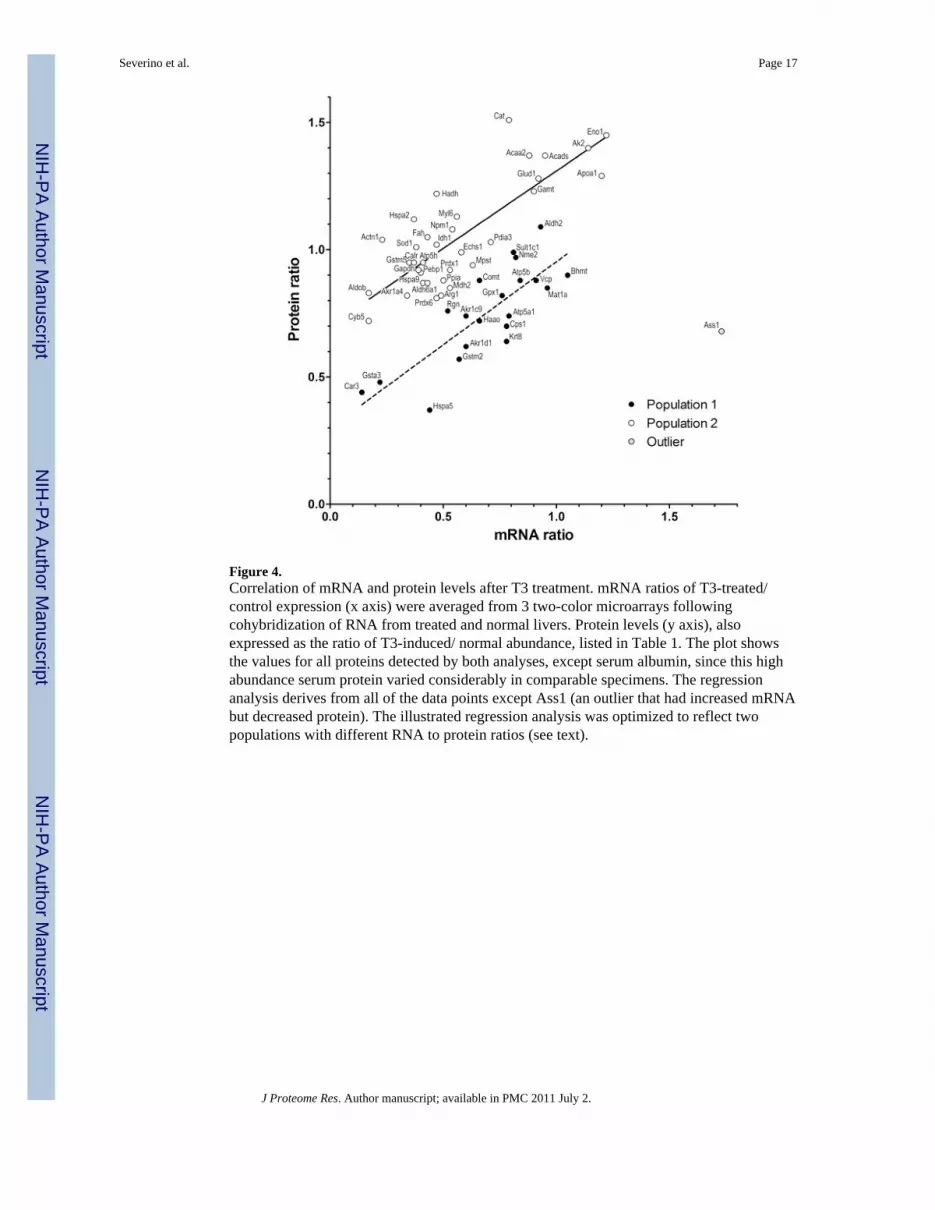
Figure 4.Correlation of mRNA and protein levels after T3 treatment. mRNA ratios of T3-treated/control expression (x axis) were averaged from 3 two-color microarrays followingcohybridization of RNA from treated and normal livers. Protein levels (y axis), alsoexpressed as the ratio of T3-induced/ normal abundance, listed in Table 1. The plot showsthe values for all proteins detected by both analyses, except serum albumin, since this highabundance serum protein varied considerably in comparable specimens. The regressionanalysis derives from all of the data points except Ass1 (an outlier that had increased mRNAbut decreased protein). The illustrated regression analysis was optimized to reflect twopopulations with different RNA to protein ratios (see text).
Severino et al. Page 17
J Proteome Res. Author manuscript; available in PMC 2011 July 2.
NIH
-PA Author Manuscript
NIH
-PA Author Manuscript
NIH
-PA Author Manuscript

Figure 5.Significantly enriched categories of differentially expressed proteins after T3 treatmentsamples were classified by IPA software on the basis of biological functions (A), or tissuerelated pathologies classification (B).
Severino et al. Page 18
J Proteome Res. Author manuscript; available in PMC 2011 July 2.
NIH
-PA Author Manuscript
NIH
-PA Author Manuscript
NIH
-PA Author Manuscript

Figure 6.Overview of the metabolic pathways of differentially expressed proteins (marked in red)following T3 treatment. The regulation level is indicated by the arrows. Asterisks indicatethe detection of multiple isoforms for a given enzyme. For protein annotation and foldchange, see Table 1.
Severino et al. Page 19
J Proteome Res. Author manuscript; available in PMC 2011 July 2.
NIH
-PA Author Manuscript
NIH
-PA Author Manuscript
NIH
-PA Author Manuscript

NIH
-PA Author Manuscript
NIH
-PA Author Manuscript
NIH
-PA Author Manuscript
Severino et al. Page 20
Tabl
e 1
Diff
eren
tially
exp
ress
ed p
rote
ins i
n ra
t liv
er sa
mpl
es fo
llow
ing
PH a
nd T
3 tre
atm
ent c
ompa
red
to th
e co
ntro
l sam
ple.
Pro
tein
theo
retic
al re
lativ
e m
asse
s(M
r) a
nd p
I are
repo
rted
alon
g w
ith th
e nu
mbe
r of m
atch
ing
pept
ides
, the
cov
erag
e pe
rcen
tage
s and
pro
babi
lity
scor
es (P
r) fo
r ide
ntifi
catio
ns. I
n bo
ld a
rere
porte
d th
e si
gnifi
cant
ly re
gula
ted
prot
eins
(fol
d ch
ange
≤0.
5 or
≥1.
5) in
at l
east
one
con
ditio
n. S
pots
und
etec
ted
in o
ne c
ondi
tion
(np)
are
als
o lis
ted.
Spot
#A
cces
sion
#D
escr
iptio
nM
r/pI
Cov
erag
e (%
)#
Pept
ides
Pr. (
%)
Rat
io P
H/ C
ontr
olR
atio
T3/
Con
trol
1P0
6761
78 k
Da
gluc
ose
regu
late
d pr
otei
n (H
spa5
)72
.302
/4.9
57.8
4410
00.
640.
44
2P0
2770
Seru
m a
lbum
in p
recu
rsor
(Alb
)68
.774
/6.0
69.6
5310
00.
992.
69
3P4
8721
Stre
ss 7
0 pr
otei
n m
itoch
ondr
ial (
Hsp
a9)
73.8
13/5
.957
.450
100
0.48
0.41
4P0
4762
Cat
alas
e (C
at)
59.5
88/7
.156
.133
100
0.91
0.79
5P1
1598
Prot
ein
disu
lfide
isom
eras
e (P
dia3
)56
.587
/5.8
66.3
3899
0.49
0.71
5aP1
1598
Prot
ein
disu
lfide
isom
eras
e (P
dia3
)56
.587
/5.8
66.3
3810
00.
87np
5bP1
1598
Prot
ein
disu
lfide
isom
eras
e (P
dia3
)56
.587
/5.8
66.3
3810
00.
88np
5cP1
1598
Prot
ein
disu
lfide
isom
eras
e (P
dia3
)56
.587
/5.8
66.3
3810
00.
50np
6P0
4785
Prot
ein
disu
lfide
isom
eras
e (P
4hb)
56.9
15/4
.663
.340
100
0.72
0.70
7Q
1075
8K
erat
in ty
pe II
cyt
oske
leta
l 8 (K
rt8)
53.8
54/5
.761
.828
100
0.49
0.50
7aQ
1075
8K
erat
in ty
pe II
cyt
oske
leta
l 8 (K
rt8)
53.8
54/5
.761
.827
100
0.40
0.78
8P0
4764
Alp
ha e
nola
se (E
no1)
46.9
55/6
.173
3910
01.
071.
22
8aP0
4764
Alp
ha e
nola
se (E
no1)
46.9
55/6
.173
3999
0.72
0.76
8bP0
4764
Alp
ha e
nola
se (E
no1)
46.9
55/6
.173
3910
00.
760.
56
9P1
0719
ATP
synt
hase
bet
a ch
ain
(Atp
5b)
56.3
18/5
.059
.216
100
0.43
0.84
10P1
3437
3 ke
toac
yl C
oA th
iola
se (A
caa2
)41
.844
/7.9
82.9
3510
00.
310.
57
10a
P134
373
keto
acyl
CoA
thio
lase
(Aca
a2)
41.8
44/7
.982
.935
980.
300.
66
11O
0917
1B
etai
ne h
omoc
yste
ine
S-m
ethy
ltran
sfer
ase
1(B
hmt)
44.9
47/7
.879
.136
100
0.60
1.05
11a
O09
171
Bet
aine
hom
ocys
tein
e S-
met
hyltr
ansf
eras
e 1(
Bhm
t)44
.947
/7.8
79.1
3610
02.
011.
99
12P2
5093
Fum
aryl
acet
oace
tate
hyd
rola
se (F
ah)
45.9
46/6
.756
.327
100
0.47
0.43
12a
P250
93Fu
mar
ylac
etoa
ceta
te h
ydro
lase
(Fah
)45
.946
/6.7
56.3
2710
01.
462.
13
13P0
0884
Fruc
tose
-bis
phos
phat
e al
dola
se B
(Ald
ob)
39.4
62/8
.445
.527
100
0.07
0.17
15Q
0333
6Se
nesc
ence
mar
ker p
rote
in 3
0 (R
egn)
33.3
67/5
.276
.328
100
0.61
0.52
15a
Q03
336
Sene
scen
ce m
arke
r pro
tein
30
(Reg
n)33
.367
/5.2
76.3
2810
01.
481.
22
15b
Q03
336
Sene
scen
ce m
arke
r pro
tein
30
(Reg
n)33
.367
/5.2
76.3
2810
00.
710.
83
16P4
6953
3-hy
drox
yant
hran
ilate
3,4
-dio
xyge
nase
(Haa
o)32
.561
/5.5
67.1
2787
0.58
0.66
17P9
7532
3-m
erca
ptop
yruv
ate
sulfu
rtran
sfer
ase
(Mps
t)32
.788
/5.8
44.6
1510
00.
460.
63
J Proteome Res. Author manuscript; available in PMC 2011 July 2.

NIH
-PA Author Manuscript
NIH
-PA Author Manuscript
NIH
-PA Author Manuscript
Severino et al. Page 21
Spot
#A
cces
sion
#D
escr
iptio
nM
r/pI
Cov
erag
e (%
)#
Pept
ides
Pr. (
%)
Rat
io P
H/ C
ontr
olR
atio
T3/
Con
trol
18P1
4141
Car
boni
c an
hydr
ase
III (
Ca3
)29
.281
/7.0
8318
100
0.23
0.14
19P1
4604
Enoy
l CoA
hyd
rata
se (E
chs1
)31
.496
/8.2
56.6
2510
00.
700.
58
19a
P146
04En
oyl C
oA h
ydra
tase
(Ech
s1)
31.4
96/8
.256
.625
840.
560.
54
20P0
4904
Glu
tath
ione
S tr
ansf
eras
e Y
c 1
(Gst
a3)
25.1
72/9
.147
.716
100
0.33
0.22
21P0
4905
Glu
tath
ione
S tr
ansf
eras
e Y
b1 (G
stm
1)25
.766
/8.4
75.1
2210
00.
280.
35
22P0
8010
Glu
tath
ione
S tr
ansf
eras
e Y
b2 (G
stm
2)25
.554
/7.2
94.5
3810
00.
370.
57
22a
P080
10G
luta
thio
ne S
tran
sfer
ase
Yb2
(Gst
m2)
25.5
54/7
.294
.538
100
1.25
2.29
23O
3524
4A
ntio
xida
nt p
rote
in 2
(Prd
x6)
24.6
71/5
.587
.427
990.
490.
47
23a
O35
244
Ant
ioxi
dant
pro
tein
2 (P
rdx6
)24
.671
/5.5
87.4
2710
00.
910.
90
24P2
2734
Cat
echo
l O m
ethy
ltran
sfer
ase
(Com
t)29
.578
/5.3
51.1
1710
00.
620.
66
24a
P227
34C
atec
hol O
met
hyltr
ansf
eras
e (C
omt)
29.5
78/5
.351
.117
100
0.54
0.52
24b
P227
34C
atec
hol O
met
hyltr
ansf
eras
e (C
omt)
29.5
78/5
.351
.117
100
0.65
0.20
25P0
7756
Car
bam
oyl-p
hosp
hate
synt
hase
(Cps
1)16
4.47
4/6.
338
.872
100
0.38
0.78
26P0
7632
Supe
roxi
de d
ism
utas
e (S
od1)
15.7
70/5
.953
.611
100
0.55
0.38
27P1
0860
Glu
tam
ate
dehy
drog
enas
e (G
lud1
)61
.389
/8.0
49.1
3210
00.
470.
92
27a
P108
60G
luta
mat
e de
hydr
ogen
ase
(Glu
d1)
61.3
89/8
.049
.132
990.
310.
76
27b
P108
60G
luta
mat
e de
hydr
ogen
ase
(Glu
d1)
61.3
89/8
.049
.132
100
0.57
1.16
28P0
7824
Arg
inas
e 1
liver
type
(Arg
1)34
.951
/6.9
71.8
2410
00.
660.
49
28a
P078
24A
rgin
ase
1 liv
er ty
pe (A
rg1)
34.9
51/6
.971
.824
100
2.67
3.41
29Q
6371
6Pe
roxi
redo
xin
1 (P
rdx1
)22
.095
/8.2
55.8
1698
0.18
0.53
31P4
6462
Tran
sitio
nal e
ndop
l ret
ATP
ase
(Vcp
)89
.292
/4.9
4748
100
0.58
0.91
32P1
1884
Ald
ehyd
e de
hydr
ogen
ase,
mito
chon
dria
l (A
ldh2
)56
.452
/6.7
52.8
3510
01.
160.
93
32a
P118
84A
ldeh
yde
dehy
drog
enas
e, m
itoch
ondr
ial (
Ald
h2)
56.4
52/6
.752
.835
100
0.63
0.99
33P1
8418
Cal
retic
ulin
(Cal
r)47
.965
/4.1
5124
100
0.48
0.37
34P0
9034
Arg
inin
osuc
cina
te sy
ntha
se (A
ss1)
46.4
66/7
.751
.725
100
0.32
1.73
35P1
9112
Fruc
tose
1, 6
bis
phos
phat
ase
(Fbp
1)39
.453
/5.4
42.8
1410
00.
891.
69
36P2
9410
Ade
nyla
te k
inas
e (A
k2)
26.2
31/6
.366
.418
100
1.04
1.14
37P0
4041
Glu
tath
ione
per
oxid
ase
(Gpx
1)22
.244
/7.8
69.7
1610
00.
810.
76
38P1
5651
Acy
l CoA
deh
ydro
gena
se (A
cads
)44
.736
/8.4
48.3
2187
0.84
0.95
38a
P156
51A
cyl C
oA d
ehyd
roge
nase
(Aca
ds)
44.7
36/8
.448
.321
100
0.65
2.63
39P4
1562
Isoc
itrat
e de
hydr
ogen
ase
[NA
DP]
(Idh
1)46
.704
/6.6
65.9
4110
00.
380.
47
J Proteome Res. Author manuscript; available in PMC 2011 July 2.

NIH
-PA Author Manuscript
NIH
-PA Author Manuscript
NIH
-PA Author Manuscript
Severino et al. Page 22
Spot
#A
cces
sion
#D
escr
iptio
nM
r/pI
Cov
erag
e (%
)#
Pept
ides
Pr. (
%)
Rat
io P
H/ C
ontr
olR
atio
T3/
Con
trol
39a
P415
62Is
ocitr
ate
dehy
drog
enas
e [N
AD
P] (I
dh1)
46.7
04/6
.665
.941
100
0.70
1.13
40P3
1399
ATP
synt
hase
D c
hain
(Atp
5h)
18.6
20/6
.277
.516
840.
500.
41
41P1
4659
Hea
t sho
ck re
late
d 70
kD
a (H
spa2
)69
.485
/5.3
49.1
2610
00.
180.
37
43P5
1635
Alc
ohol
deh
ydro
gena
se [N
AD
P+] (
Akr
1a1)
36.3
51/7
.046
.316
100
0.72
0.34
44P2
3457
3-al
pha-
hydr
oxys
tero
id d
ehyd
roge
nase
(Akr
1c9)
37.0
03/6
.742
.910
100
1.63
0.60
47Q
0743
9H
eat s
hock
70
kDa
(Hsp
a1b)
70.1
20/5
.341
.926
100
0.43
np
49P3
1210
3-ox
o-5
beta
ster
oid
4 de
hydr
ogen
ase
(Akr
1d1)
37.3
54/6
.252
.120
990.
260.
60
49a
P312
103-
oxo-
5 be
ta st
eroi
d 4
dehy
drog
enas
e (A
kr1d
1)37
.354
/6.2
52.1
2010
00.
330.
64
50P1
0868
Gua
nidi
noac
etat
e (G
AA
) N-m
ethy
ltran
sfer
ase
(Gam
t)26
.259
/5.6
74.5
2010
00.
950.
90
51P3
1044
Phos
phat
idyl
etha
nol b
indi
ng p
rote
in (P
epb1
)20
.788
/5.4
72.2
1010
00.
610.
40
52P1
9804
Nuc
leos
ide
diph
osph
ate
kina
se B
(Nm
e2)
17.2
71/7
.384
.915
100
0.75
0.82
55P0
0173
Cyt
ochr
ome
B5
(Cyb
5a)
15.2
14/4
.741
.44
100
1.15
0.17
56P0
4636
Mal
ate
dehy
drog
enas
e (M
dh2)
35.6
32/8
.869
.231
100
0.47
0.53
57P0
4797
Gly
cera
ldeh
yde-
3-ph
osph
ate
dehy
drog
enas
e (G
apdh
)35
.682
/8.3
48.8
1510
00.
210.
39
57a
P047
97G
lyce
rald
ehyd
e-3-
phos
phat
e de
hydr
ogen
ase
(Gap
dh)
35.6
82/8
.348
.815
990.
210.
66
57b
P047
97G
lyce
rald
ehyd
e-3-
phos
phat
e de
hydr
ogen
ase
(Gap
dh)
35.6
82/8
.348
.815
100
0.75
0.93
58Q
0225
3M
alon
ate-
sem
iald
ehyd
e de
hydr
ogen
ase
(Ald
h6a1
)57
.770
/8.2
61.9
3310
00.
450.
43
60Q
9Z1P
2A
lpha
act
inin
1 (A
ctn1
)10
2.89
5/5.
136
.932
100
0.18
0.23
61P1
3444
S-ad
enos
ylm
ethi
onin
e (S
AM
) syn
thet
hase
(Mat
a1)
43.6
70/5
.548
.918
981.
190.
96
64P1
5999
ATP
synt
hase
A c
hain
(Atp
5a1)
58.7
90/9
.554
.728
100
0.57
0.79
65P1
0111
Pept
idyl
pro
lyl c
is tr
ans i
som
eras
e (P
pia)
17.7
31/8
.384
1610
01.
040.
50
66Q
6411
9M
yosi
n lig
ht c
hain
(Myl
6)16
.833
/4,3
5610
830.
430.
56
68P5
0237
Sulfo
trans
fera
se 1
C1
(Sul
t1c1
)35
.740
/6.1
52.5
1384
0.75
0.81
69Q
9WV
K7
Hyd
roxy
acyl
-coe
nzym
e A
deh
ydro
gena
se (H
adh)
34.4
25/9
.271
.516
100
0.40
0.47
70P1
3084
Nuc
leop
hosm
in (N
pm1)
32.5
39/4
.443
.814
810.
890.
54
71P0
4639
Apo
lipop
rote
in A
1 (A
poa1
)30
.069
/5.4
67.6
3110
00.
831.
20
J Proteome Res. Author manuscript; available in PMC 2011 July 2.

NIH
-PA Author Manuscript
NIH
-PA Author Manuscript
NIH
-PA Author Manuscript
Severino et al. Page 23
Tabl
e 2
Prot
ein
spot
s uni
quel
y re
veal
ed u
nder
a g
iven
ana
lyse
d co
nditi
ons.
See
Tabl
e 1
for h
eadi
ng d
etai
ls.
Spot
#A
cces
sion
#D
escr
iptio
nM
r/pI
Cov
erag
e (%
)#
Pept
ides
Pr. (
%)
Con
ditio
n
3aP4
8721
Stre
ss 7
0 pr
otei
n m
itoch
ondr
ial (
Hsp
a9)
73.8
13/5
.957
.450
100
PH/T
3
3bP4
8721
Stre
ss 7
0 pr
otei
n m
itoch
ondr
ial (
Hsp
a9)
73.8
13/5
.957
.450
100
PH/T
3
5dP1
1598
Prot
ein
disu
lfide
isom
eras
e (P
dia3
)56
.587
/5.8
66.3
3810
0T3
16a
P469
533-
hydr
oxya
nthr
anila
te 3
,4-d
ioxy
gena
se (H
aao)
32.5
61/5
.567
.127
100
PH/T
3
16b
P469
533-
hydr
oxya
nthr
anila
te 3
,4-d
ioxy
gena
se (H
aao)
32.5
61/5
.567
.127
100
PH/T
3
17a
P975
323-
mer
capt
opyr
uvat
e su
lfurtr
ansf
eras
e (M
pst)
32.7
88/5
.844
.615
99PH
/T3
20a
P049
04G
luta
thio
ne S
tran
sfer
ase
Yc
1 (G
sta3
)25
.172
/9.1
47.7
1610
0T3
26a
P076
32Su
pero
xide
dis
mut
ase
(Sod
1)15
.770
/5.9
53.6
1110
0PH
/T3
32b
P118
84A
ldeh
yde
dehy
drog
enas
e (A
ldh2
)56
.452
/6.7
52.8
3510
0T3
32c
P118
84A
ldeh
yde
dehy
drog
enas
e (A
ldh2
)56
.452
/6.7
52.8
3510
0T3
37a
P040
41G
luta
thio
ne p
erox
idas
e (G
px1)
22.2
44/7
.869
.716
100
PH/T
3
54P1
6617
Phos
phog
lyce
rate
kin
ase
(Pgk
1)44
.394
/7.6
44.2
1987
PH/T
3
65a
P101
11Pe
ptid
yl p
roly
l cis
tran
s iso
mer
ase
(Ppi
a)17
.731
/8.3
8416
100
PH/T
3
42Q
0324
8B
eta
urei
dopr
opio
nase
(Ubp
1)44
.013
/6.5
53.7
2510
0C
ontro
l
62P1
4669
Ann
exin
III -
Lip
ocor
tin II
I (A
nxa3
)36
.299
/6.0
54.6
1784
Con
trol
J Proteome Res. Author manuscript; available in PMC 2011 July 2.

NIH
-PA Author Manuscript
NIH
-PA Author Manuscript
NIH
-PA Author Manuscript
Severino et al. Page 24
Table 3
Relative mRNA levels after T3 treatment. Ratios were calculated from dual hybridization of RNA livers 6 hrafter T3 treatment / untreated control liver. The data were averaged from three arrays.
Description Ratio T3/ Control SD
Catalase (Cat) 1.51 1.11
Alpha enolase (Eno1) 1.45 0.24
Adenylate kinase (Ak2) 1.40 0.19
Acyl CoA dehydrogenase (Acads) 1.37 0.26
3 ketoacyl CoA thiolase (Acaa2) 1.37 0.58
Apolipoprotein A1 (Apoa1) 1.29 0.24
Glutamate dehydrogenase (Glud1) 1.28 0.06
Guanidinoacetate (GAA) N-methyltransferase (Gamt) 1.23 0.32
Hydroxyacyl-coenzyme A dehydrogenase (Hadh) 1.22 0.41
Myosin light chain (Myl6) 1.13 0.21
Heat shock related 70 kDa (Hspa2) 1.12 0.01
Aldehyde dehydrogenase, mitochondrial (Aldh2) 1.09 0.64
Nucleophosmin (Npm1) 1.08 0.11
Fumarylacetoacetate hydrolase (Fah) 1.05 0.27
Alpha actinin 1 (Actn1) 1.04 0.25
Protein disulfide isomerase 3 (Pdia3) 1.03 0.15
Fructose 1, 6 bisphosphatase (Fbp1) 1.02 0.08
Isocitrate dehydrogenase [NADP] (Idh1) 1.02 0.15
Superoxide dismutase (Sod1) 1.01 0.10
Sulfotransferase 1C1 (Sult1c1) 0.99 0.08
Enoyl CoA hydratase (Echs1) 0.99 0.14
Nucleoside diphosphate kinase B (Nme2) 0.97 0.31
Glutathione S transferase Yb1 (Gstm1) 0.95 0.15
Serum albumin precursor (Alb) 0.95 0.15
ATP synthase D chain (Atp5h) 0.95 0.45
Calreticulin (Calr) 0.95 0.22
3-mercaptopyruvate sulfurtransferase (Mpst) 0.94 0.22
Peroxiredoxin 1 (Prdx1) 0.92 0.28
Glyceraldehyde-3-phosphate dehydrogenase (Gapdh) 1.12 0.26
Phosphatidylethanol binding protein (Pepb1) 0.91 0.40
Betaine homocysteine S-methyltransferase 1(Bhmt) 0.90 0.43
Peptidyl prolyl cis trans isomerase (Ppia) 0.96 0.32
ATP synthase beta chain (Atp5b) 0.88 0.18
Catechol O methyltransferase (Comt) 0.88 0.12
Transitional endopl ret ATPase (Vcp) 0.88 0.13
Malonate-semialdehyde dehydrogenase (Aldh6a1) 0.87 0.10
J Proteome Res. Author manuscript; available in PMC 2011 July 2.
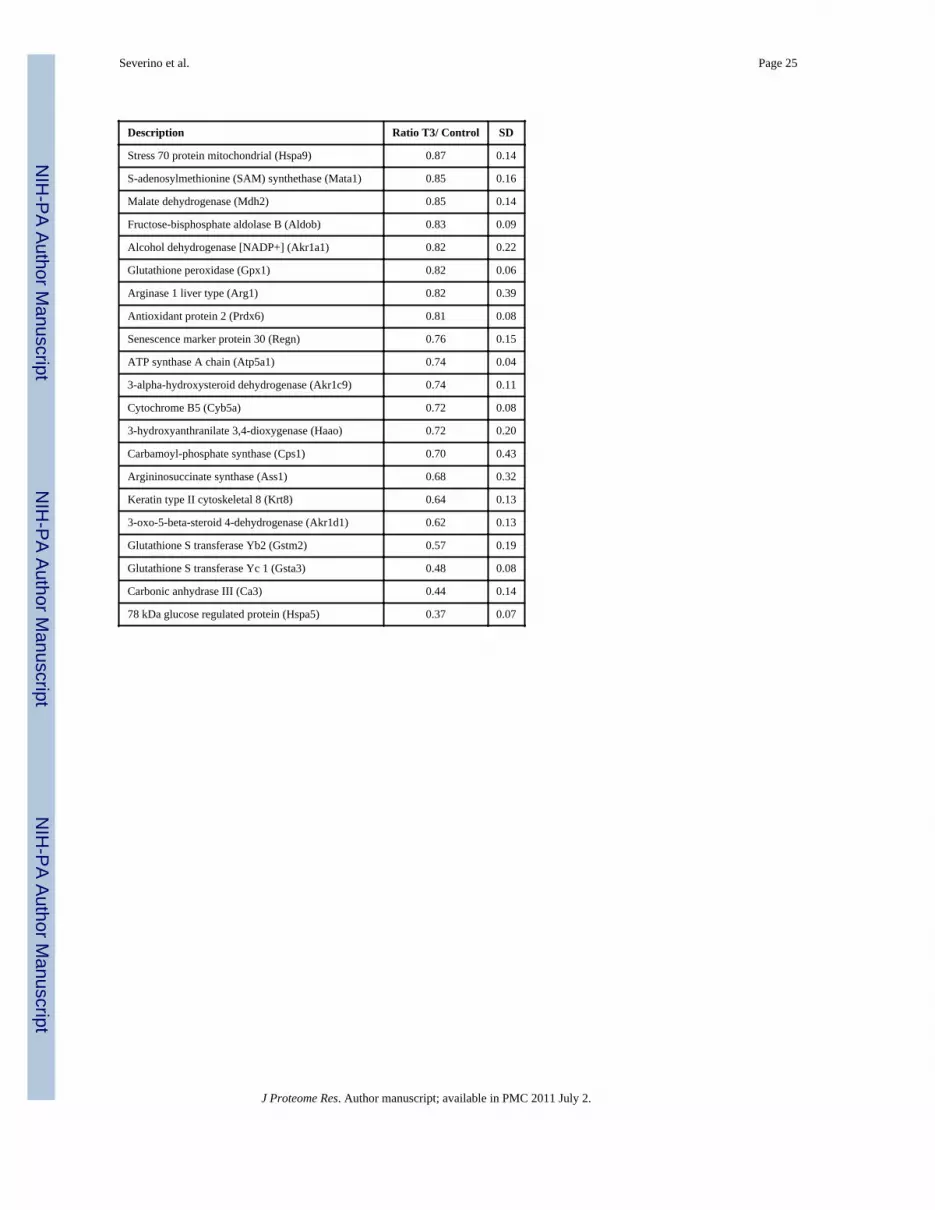
NIH
-PA Author Manuscript
NIH
-PA Author Manuscript
NIH
-PA Author Manuscript
Severino et al. Page 25
Description Ratio T3/ Control SD
Stress 70 protein mitochondrial (Hspa9) 0.87 0.14
S-adenosylmethionine (SAM) synthethase (Mata1) 0.85 0.16
Malate dehydrogenase (Mdh2) 0.85 0.14
Fructose-bisphosphate aldolase B (Aldob) 0.83 0.09
Alcohol dehydrogenase [NADP+] (Akr1a1) 0.82 0.22
Glutathione peroxidase (Gpx1) 0.82 0.06
Arginase 1 liver type (Arg1) 0.82 0.39
Antioxidant protein 2 (Prdx6) 0.81 0.08
Senescence marker protein 30 (Regn) 0.76 0.15
ATP synthase A chain (Atp5a1) 0.74 0.04
3-alpha-hydroxysteroid dehydrogenase (Akr1c9) 0.74 0.11
Cytochrome B5 (Cyb5a) 0.72 0.08
3-hydroxyanthranilate 3,4-dioxygenase (Haao) 0.72 0.20
Carbamoyl-phosphate synthase (Cps1) 0.70 0.43
Argininosuccinate synthase (Ass1) 0.68 0.32
Keratin type II cytoskeletal 8 (Krt8) 0.64 0.13
3-oxo-5-beta-steroid 4-dehydrogenase (Akr1d1) 0.62 0.13
Glutathione S transferase Yb2 (Gstm2) 0.57 0.19
Glutathione S transferase Yc 1 (Gsta3) 0.48 0.08
Carbonic anhydrase III (Ca3) 0.44 0.14
78 kDa glucose regulated protein (Hspa5) 0.37 0.07
J Proteome Res. Author manuscript; available in PMC 2011 July 2.

NIH
-PA Author Manuscript
NIH
-PA Author Manuscript
NIH
-PA Author Manuscript
Severino et al. Page 26
Table 4
mRNA levels of genes related to lipid metabolism. Ratios were calculated as in Table 3.
Description Ratio T3/Control SD
Carnitine palmitoyltransferase 1a liver (Cpt1a) 2.34 0.91
Patatin-like phospholipase domain containing 2 (Pnpla2) 2.26 0.99
Apolipoprotein A-IV (Apoa4) 1.95 1.15
Dodecenoyl-Coenzyme A delta isomerase (3 2 trans-enoyl-Coenyme A isomerase; Dci) 1.83 0.86
Carnitine acetyltransferase (Crat) 1.81 0.43
Adipose differentiation related protein (Adfp) 1.75 0.53
Peroxisomal acyl-CoA thioesterase 2B (Pte2b) 1.66 0.63
Cytochrome P450 4a14 (Cyp4a14) 1.62 0.60
Sphingosine phosphate lyase 1 (Sgpl1) 1.49 0.58
Lysophospholipase 2 (Lypla2) 1.48 0.23
Low-density lipoprotein receptor-related protein 10 (Lrp10) 1.42 0.46
Monoglyceride lipase (Mgll) 1.39 0.07
Lipocalin 10 (Lcn10) 0.67 0.18
Glycerophosphodiester phosphodiesterase domain containing 5 (Gdpd5) 0.66 0.33
Acyl-CoA wax alcohol acyltransferase 2 (Awat2) 0.58 0.18
Lipin 2 (Lpin2) 0.58 0.10
Phosphatidylglycerophosphate synthase 1 (Pgs1) 0.58 0.12
Apolipoprotein B (Apob) 0.51 0.19
StAR-related lipid transfer (START) domain containing 6 (Stard6) 0.47 0.25
DDHD domain containing 2 (Ddhd2) 0.44 0.10
Lipase, member I (Lipi) 0.42 0.11
Propionyl coenzyme A carboxylase beta polypeptide (Pccb) 0.30 0.04
Lipase-like abhydrolase domain containing 3 (Lipl3) 0.24 0.04
J Proteome Res. Author manuscript; available in PMC 2011 July 2.
Recommended


