
Raman spectra of lignin model compounds
UMESH P AGARWAL, RICHARD S REINER, ASHOK K PANDEY1. SALLY A RALPH, KOLBY C HIRTH, AND RAJAI H ATALLA
USDAFS-Forest Products Laboratory, Madison WI 53726 USA 1Tropical Forest Research Institute, P.O. RFRC, Mandla Road, Jabalpur 482 021 India
ABSTRACT
spectroscopy for analyzing lignins and lignin- containing materials, a detailed understanding of lignins’ Raman spectra needs to be achieved. Although advances made thus far have led to significant growth in application of Raman techniques, further developments are needed to improve upon the existing knowledge. Considering that lignin’s heterogeneous structure consists not only of inter-phenylpropane-unit linkages of carbon-to- carbon and carbon-to-oxygen, but also of side chains with various substituent and functional groups, a study of a large number of representative models is essential. In the present work, 40 lignin models were investigated in the neat state (near-IR FT-Raman and FT-IR), in solution (near-IR FT-Raman), and on cellulose (near-IR FT-Raman). These models represent a large number of substituent/functional groups and sub-structures in lignin - aliphatic and phenolic OH, C=O, CHO, COOH, CH3, OCH3, α,β C=C, furan, and interunit C-O-C and C-C linkages. Raman band positions associated with various groups were identified and Raman frequencies and intensities were compared between the models. For example, for the phenyl group, some of the noteworthy findings were as follows. The intensities of the 1600 (aromatic ring stretch) and 3070 (aromatic C-H stretch) cm-1 bands varied significantly between the models. The position of the 1600 cm-1-Raman-mode was found to be only minimally sensitive to substituents because in about 70 % of the models, including those containing more than 1 phenyl group, the vibrational frequency was confined between 1594 and 1603 cm-1. Similar information was obtained on other functional groups as well. It is hoped that the findings from this study will greatly aid in developing a better understanding of the Raman spectra of lignins and lignocellulosic materials.
To fully exploit the value of Raman
INTRODUCTION Raman spectroscopy is increasingly used to
analyze lignin containing materials [1-8]. Although significant progress has been made in interpreting the contribution of lignin to a spectrum [9], the need exists to further improve upon this understanding. This can be accomplished by carrying out a
systematic broad-based investigation of lignin models. Earlier work in this area focused on a few models that were deemed relevant to the study at hand. However, such investigations and resultant advances in understanding were not sufficient. Considering that lignin is a heterogeneous polymer that consists of many different types of inter-unit linkages, substituents, and side chains with various functional groups, a study incorporating a large number of representative models is essential In the present work, using near-IR FT-Raman and FT-IR techniques, 40 lignin models (nearly half of them tri- substituted aromatics) were investigated in neat state. Additionally, near-IR FT-Raman was used to study these models in solution and on cellulose.
EXPERIMENTAL Chemicals
were purchased from Aldrich, Eastman, Fluka, and Lancaster. Additionally, a significant number were synthesized by an FPL staff chemist (Larry Landucci). Model structures and their ID numbers are shown in Fig. 1
Raman- and IR– neat
pure models were obtained, respectively, using the RFS 100 (Bruker) and Galaxy-5000 (Mattson) instruments.
Raman- solution Appropriate amounts of compounds were
weighed in 1, 2 or 3 mL Class A volumetric flasks and dissolved in methanol, dioxane:water or dimethyl sulfoxide (DMSO) with most solutions near 0.5 M. For solution studies, most models were dissolved in methanol. For those few that were not soluble, dioxane:water or DMSO was used. The solvent background was subtracted from the raw data prior to determining peak positions and intensities. Peak intensity was calculated on a molar basis and for those models that contained more than one group per molecule the band intensity was adjusted by ratioing to the appropriate number of such groups.
Raman- cellulose
16 and 19) were measured in a 1 mL GlenCo Precision Bore ampoule and &luted with the appropriate solvent to make 0.5 mL of 0.1 M solutions. This was poured onto a 55 mm round Whatman #1 filter paper and allowed to evaporate for 2-5 days. The papers were folded into 16 layers and placed on the sampling bench in the instrument with a mirror behind them. Model peaks that occurred in essentially the same place as cellulose peaks were not included in the results because there would be significant uncertainty regarding the peak position and amplitude
A large number of lignin models (Fig. 1)
Near-IR FT-Raman and FT-IR spectra of the
Solutions used above (with exceptions: 10,
Appita 2005 - 1

Fig. 1: Molecular structures of 40 lignin models used in the present study
2 - Appita 2005

Appita 2005 - 3
4 - Appita 2005

Appita 2005 - 5
RESULTS AND DISCUSSION
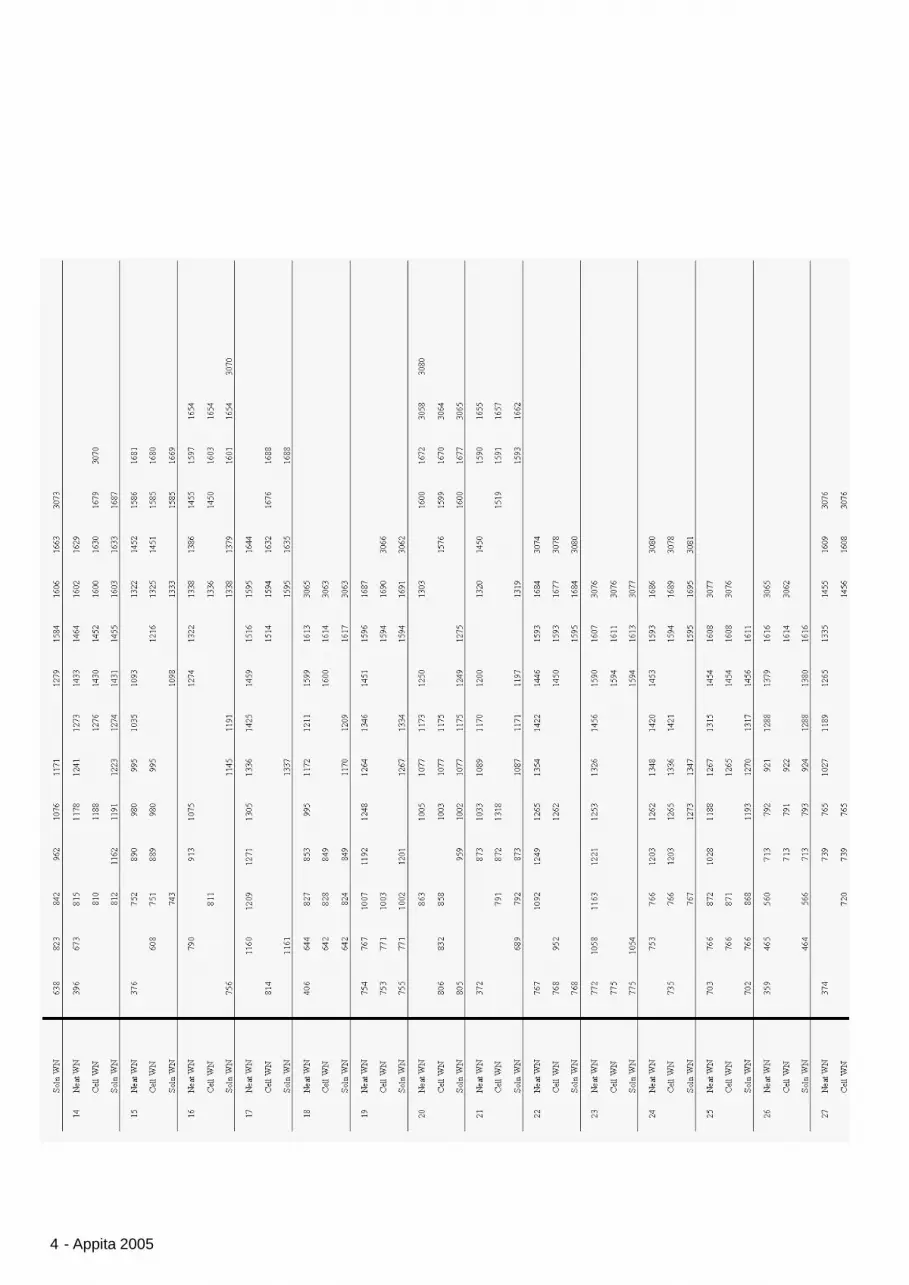
of various inter-unit linkages, substituents and functional groups found in lignin. The models collectively represent aliphatic and phenolic OH, C=O, CHO, COOH, CH3, OCH3, α,β C=C, furan, and interunit C-O-C and C-C linkages. In addition, there are models that contain more than 1 group of the same kindintheir structure (e.g., models 7, 16, 19, 20, 22-24 contain at least 2 phenyl groups).
Structures of models shown in Fig. 1 consist
In neat state, model spectra were obtained using both near-IR Raman and FT-IR, whereas models in solution and on cellulose were analyzed only by Raman. From the model spectra obtained in three different environments, 10 most prominent Raman bands were selected for listing in Table 1. In general, due to low concentration of the models, sampling in the solution and on cellulose resulted in fewer than 10 bands.
Raman vs. IR
complementary vibrational spectroscopic techniques. This aspect was illustrated in the present study as well. In neat state, of the total detected Raman bands, only about 60% were also detected in the IR, implying that 40% of the bands could only be detected by Raman. Moreover, there were band intensity differences between the two techniques. Therefore, to obtain the most detailed chemical information, both IR and Raman analyses should to be carried out.
As is well known, Raman and IR are
Effect of the Environment
on cellulose, several Raman band positions shifted compared to the value in the neat state. A Table summarizing this data is not shown here due to lack of space but bands were classified according to the extent of the shift. Shifts between 3 and 5 cm-1 were designated as small, 5 and 9 cm-1 as medium and more than 9 cm-1 as large. Total numbers of bands in small, medium, and large categories were, respectively, 48, 47 and 24. Considering that some of the functional groups are capable of H-bonding in solution and with cellulose, shifts associated with the bands of such groups can be readily explained. On the other hand, there were several instances where band shifts are not easily interpreted.
Band Intensity Differences 1510, 1600, and 3070 cm-1 phenyl group modes
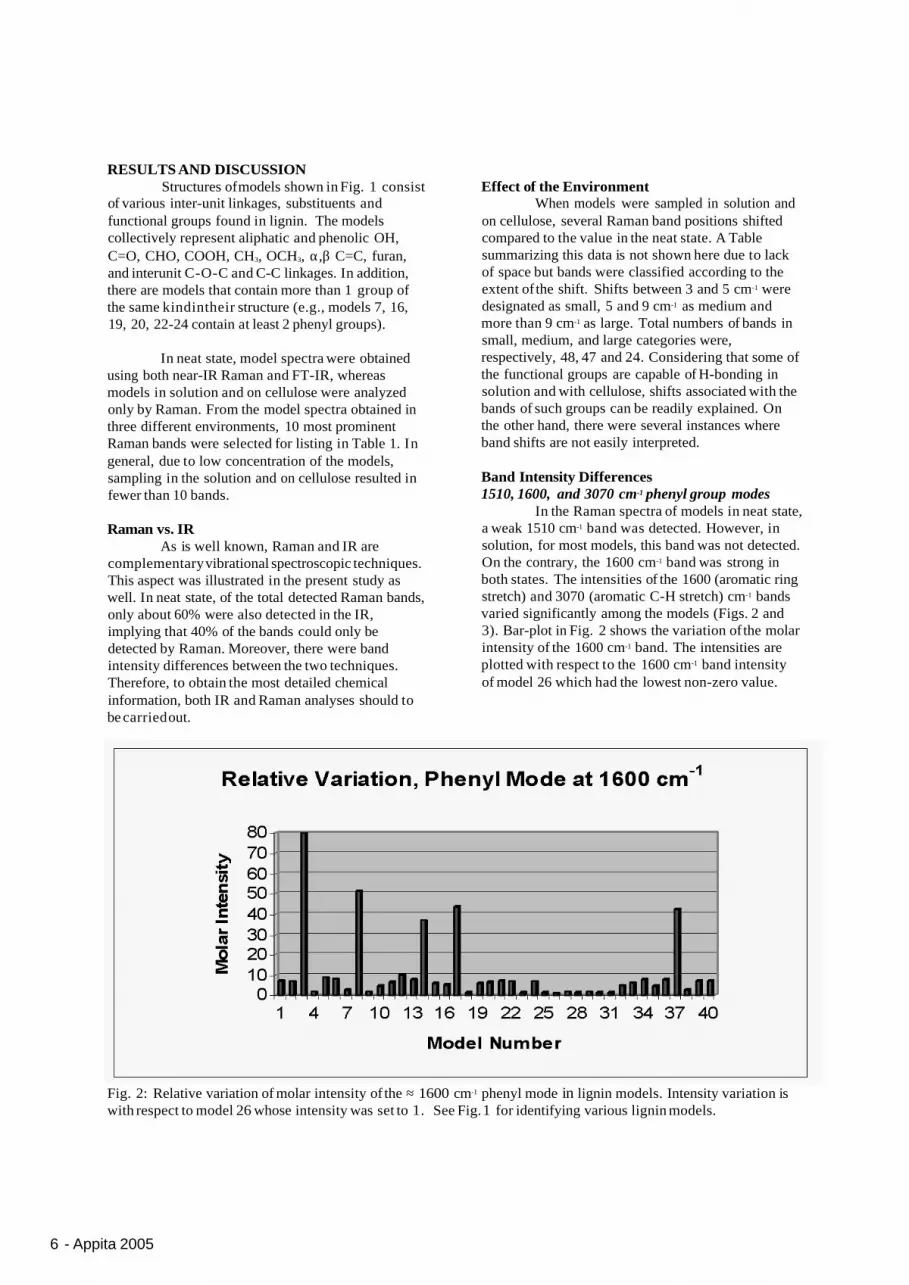
In the Raman spectra of models in neat state, a weak 1510 cm-1 band was detected. However, in solution, for most models, this band was not detected. On the contrary, the 1600 cm-1 band was strong in both states. The intensities of the 1600 (aromatic ring stretch) and 3070 (aromatic C-H stretch) cm-1 bands varied significantly among the models (Figs. 2 and 3). Bar-plot in Fig. 2 shows the variation of the molar intensity of the 1600 cm-1 band. The intensities are plotted with respect to the 1600 cm-1 band intensity of model 26 which had the lowest non-zero value.
When models were sampled in solution and
Fig. 2: Relative variation of molar intensity of the ≈ 1600 cm-1 phenyl mode in lignin models. Intensity variation is with respect to model 26 whose intensity was set to 1. See Fig. 1 for identifying various lignin models.
6 - Appita 2005
Previously, such intensity variation was observed [9] when a number of models were investigated by conventional Raman spectroscopy (514.5 nm laser excitation). As discussed earlier [9], the 1600 cm-1 band intensity enhancement was reported to be due to both pre-resonance Raman and conlugation effects. Considering the long wavelength nature (1064 nm) of the laser excitation in the present work, which makes excitation far removed from any electronic absorption in the models, the pre- resonance Raman is not expected to play a role in intensity enhancement. Therefore, the intensity of the
the absence of steric hindrance from substituents on the 2 and 6 positions of the phenyl ring.
While the intensity was very sensitive to the model structure, the position of the 1600 cm-1 Raman band was found to be only minimally sensitive. In about 70% of the models, including those containing more than one phenyl group, the vibrational frequency was confined between 1594 to 1603 cm-1
(Table 1).
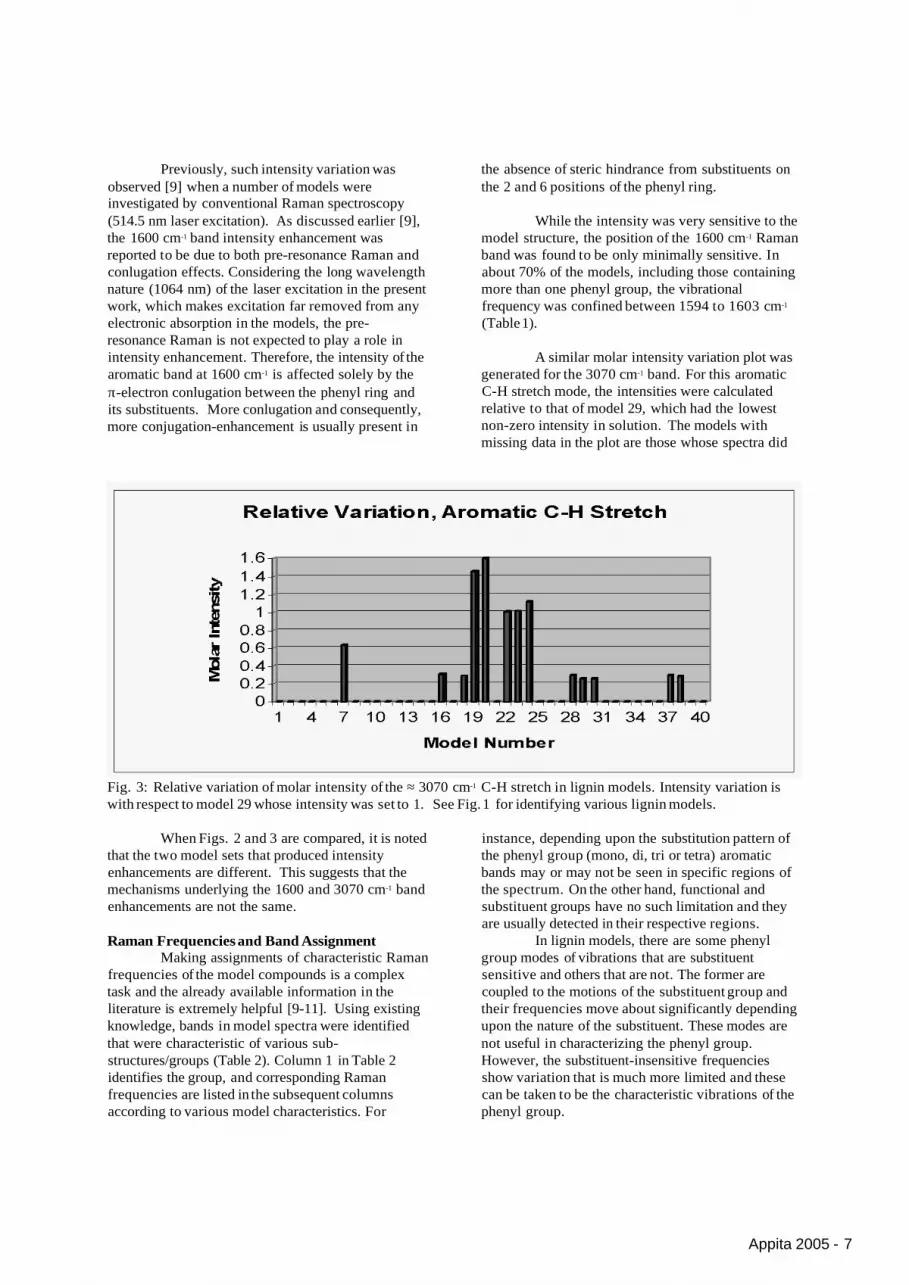
A similar molar intensity variation plot was aromatic band at 1600 cm-1 is affected solely by the π -electron conlugation between the phenyl ring and its substituents. More conlugation and consequently, more conjugation-enhancement is usually present in
generated for the 3070 cm-1 band. For this aromatic C-H stretch mode, the intensities were calculated relative to that of model 29, which had the lowest non-zero intensity in solution. The models with missing data in the plot are those whose spectra did
Fig. 3: Relative variation of molar intensity of the ≈ 3070 cm-1 C-H stretch in lignin models. Intensity variation is with respect to model 29 whose intensity was set to 1. See Fig. 1 for identifying various lignin models.
When Figs. 2 and 3 are compared, it is noted that the two model sets that produced intensity enhancements are different. This suggests that the mechanisms underlying the 1600 and 3070 cm-1 band enhancements are not the same.
Raman Frequencies and Band Assignment
frequencies of the model compounds is a complex task and the already available information in the literature is extremely helpful [9-11]. Using existing knowledge, bands in model spectra were identified that were characteristic of various sub- structures/groups (Table 2). Column 1 in Table 2 identifies the group, and corresponding Raman frequencies are listed in the subsequent columns according to various model characteristics. For
Making assignments of characteristic Raman
instance, depending upon the substitution pattern of the phenyl group (mono, di, tri or tetra) aromatic bands may or may not be seen in specific regions of the spectrum. On the other hand, functional and substituent groups have no such limitation and they are usually detected in their respective regions.
group modes of vibrations that are substituent sensitive and others that are not. The former are coupled to the motions of the substituent group and their frequencies move about significantly depending upon the nature of the substituent. These modes are not useful in characterizing the phenyl group. However, the substituent-insensitive frequencies show variation that is much more limited and these can be taken to be the characteristic vibrations of the phenyl group.
In lignin models, there are some phenyl
Appita 2005 - 7
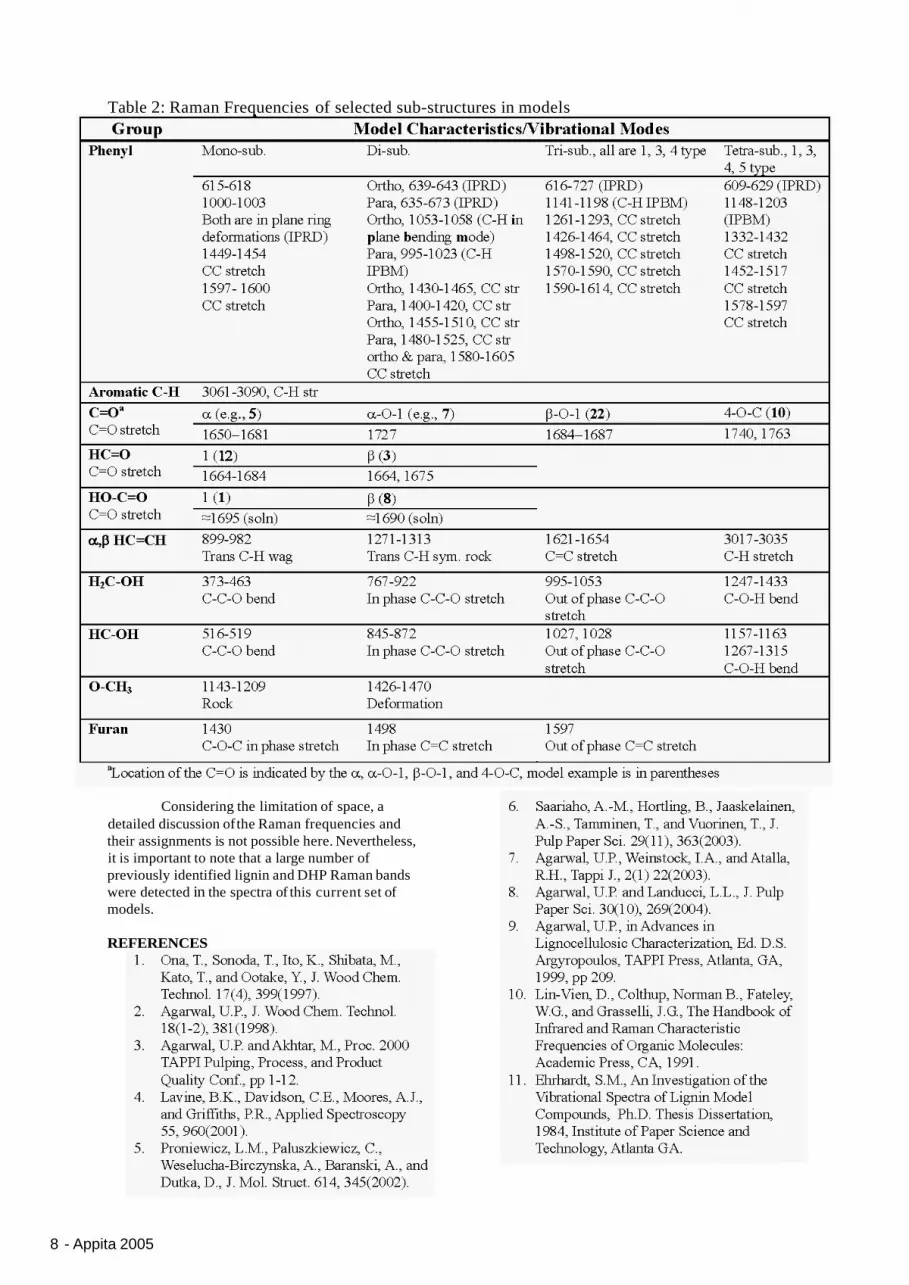
Table 2: Raman Frequencies of selected sub-structures in models
Considering the limitation of space, a detailed discussion of the Raman frequencies and their assignments is not possible here. Nevertheless, it is important to note that a large number of previously identified lignin and DHP Raman bands were detected in the spectra of this current set of models.
REFERENCES
8 - Appita 2005

In: Proceedings of the 59th APPITA Annual Conference and Exhibition incorporating the 13th ISWFPC (International Symposium on Wood, Fibre, and Pulping Chemistry), held in Auckland, New Zealand (May 16-19, 2005). [Carlton, Victoria, Australia]: APPITA, c2005. Both print and CD versions are available. pp. 1-8.
Recommended


![Raman spectra of tetraoxa[8]circulenes. p-dinaphthalenodiphenylenotetrafuran and its tetraalkyl derivatives (DFT study and experiment)](https://img.pdfslide.net/doc/110x75/6335e0d3a1ced1126c0afb94/raman-spectra-of-tetraoxa8circulenes-p-dinaphthalenodiphenylenotetrafuran-and.jpg)


