Embed Size (px)
Citation preview

Infrared and Raman spectra, conformational stability, ab initio
calculations, and vibrational assignment of 5-chloropent-2-yneq
Gamil A. Guirgis, Barry R. Drew, Nida J. Luangjamekorn, Shiyu Shen, James R. Durig*
Department of Chemistry, University of Missouri-Kansas City, 5100 Rochill Road, 64110-2499 Kansas City, MO, USA
Received 8 January 2002; accepted 31 January 2002
Abstract
The infrared (3400–50 cm21) and/or Raman (3400–10 cm21) spectra of gaseous, xenon solution, liquid and solid 5-
chloropent-2-yne, CH2ClCH2CCCH3, have been recorded. These data indicate that the molecule exists in the anti (the C–Cl
bond is trans to the CxC bond) and the gauche conformations in the vapor and liquid but only the anti conformer remains in the
solid state. From a variable temperature infrared study of the xenon solution, the anti conformation has been determined to be
more stable than the gauche form by 233 ^ 23 cm21 (2.79 ^ 0.28 kJ/mol) and it is estimated that 39% of the sample is in the
gauche form at ambient temperature. The optimized geometries, conformation stabilities, harmonic force fields, Raman
activities, depolarization ratios, and infrared intensities have been obtained from ab initio MP2/6-31G(d) calculations with full
electron correlation. These predicted quantities are compared to the corresponding experimental quantities when appropriate.
Equilibrium geometries and energies for both conformers have been obtained from ab initio MP2/6-311G(d,p), MP2/6-
311G(2d,2p) and MP2/6-311G(2df,2pd) calculations. Vibrational assignments for the 24 normal modes for the anti conformer
are proposed and several of the fundamentals for the gauche conformer are assigned. The sub-band structure on the pseudo-
degenerate vibrations of the methyl group indicates that it is almost free internal rotation. From this fine structure, the Coriolis
coupling constants, j, have been determined. These experimental and theoretical results are compared to the corresponding
quantities of some similar molecules. q 2002 Elsevier Science B.V. All rights reserved.
Keywords: Infrared and Raman spectra; Conformational stability; Xenon solutions; Ab initio calculations; 5-Chloropent-2-yne
1. Introduction
The 1,2-disubstituted ethane molecules, XCH2-
CH2Y, have been of interest to chemists for a number
of years both because of their structural parameters as
well as their conformational stabilities. For example,
when X and Y are the same atoms or groups, there are
significant differences in their conformational stab-
ilities. If X and Y are both a chlorine atom,
ClCH2CH2Cl, or a methyl group, CH3CH2CH2CH3
(n-butane), which have similar sizes, then the more
stable conformer is the trans form [1,2]. However, if
X is a chlorine atom and Y is a methyl group,
ClCH2CH2CH3 (1-chloropropane), then the gauche
conformer is the more stable form [3] by 52 ^ 3 cm21
(0.62 ^ 0.04 kJ/mol). In contrast, the 1,2-difluor-
oethane, FCH2CH2F [4], and 1-fluoropropane, FCH2-
CH2CH3 [5], molecules both have the gauche
0022-2860/02/$ - see front matter q 2002 Elsevier Science B.V. All rights reserved.
PII: S0 02 2 -2 86 0 (0 2) 00 1 25 -4
Journal of Molecular Structure 613 (2002) 15–35
www.elsevier.com/locate/molstruc
q Taken in part from the dissertation of B.R. Drew, which has
been submitted to the Department of Chemistry in partial fulfillment
of the PhD degree.* Corresponding author. Tel.: þ1-816-235-6038; fax: þ1-816-
235-2290.
E-mail address: [email protected] (J.R. Durig).
conformer as the more stable form whereas 1-fluoro-
2-chloroethane, FCH2CH2Cl [6], has the trans con-
former as the more stable form by 126 ^ 8 cm21
(1.51 ^ 0.09 kJ/mol). It is clear that the size of the X
or Y substituent is not the dominant factor in
determining the stability of the 1,2-disubstituted
ethanes since FCH2CH2Cl and FCH2CH2CH3 have
nearly the same size substituents, yet they have
different conformers as their more stable rotamers.
As a continuation of our conformational studies we
have investigated the conformational stability of 5-
chloropent-2-yne, ClCH2CH2CCCH3, with Y the
propyne group, CxCCH3. To the best of our knowl-
edge, there have been no previous spectroscopic
studies reported for this molecule. Therefore, we have
recorded the Raman spectra of the liquid and solid
along with the infrared spectra of the gas, solid and
xenon solution using variable temperatures. We have
also carried out ab initio calculations employing the 6-
31G(d) basis set at the level of Moller–Plesset to the
second order (MP2) by the perturbation method with
full electron correlation to obtain equilibrium geome-
tries, force constants, vibrational frequencies, infrared
and Raman intensities, and conformational stabilities.
Structural parameters and conformational stabilities
have also been obtained from the larger basis sets of 6-
311G(d,p), 6-311G(2d,2p), and 6-311G(2df,2pd) at
the MP2 level also with full electron correlation. The
results of this spectroscopic and theoretical study are
reported herein.
2. Experimental section
The sample of 5-chloropent-2-yne was prepared by
the reaction of 2-pentyn-5-ol with thionyl chloride,
SO2Cl2, in pyridine at 70 8C for 2 h. The sample was
frozen with boiling liquid nitrogen and degassed. It
was then warmed to room temperature and the volatile
material was collected, washed first with 5% sodium
bicarbonate, then with distilled water. The sample was
finally purified by a low-temperature and low-
pressure sublimation column. The purity of the
sample was checked with NMR and mass spectral
data.
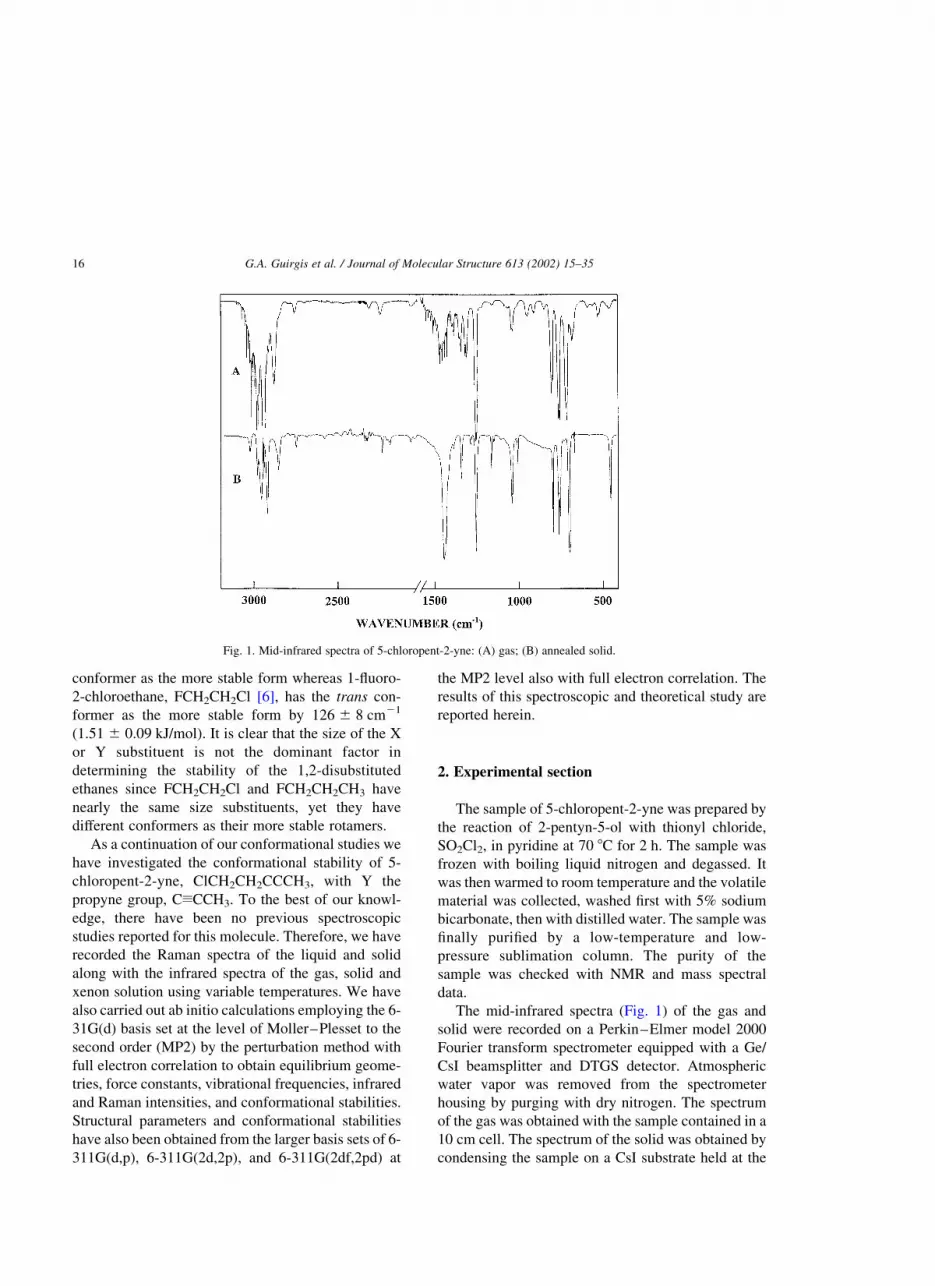
The mid-infrared spectra (Fig. 1) of the gas and
solid were recorded on a Perkin–Elmer model 2000
Fourier transform spectrometer equipped with a Ge/
CsI beamsplitter and DTGS detector. Atmospheric
water vapor was removed from the spectrometer
housing by purging with dry nitrogen. The spectrum
of the gas was obtained with the sample contained in a
10 cm cell. The spectrum of the solid was obtained by
condensing the sample on a CsI substrate held at the
Fig. 1. Mid-infrared spectra of 5-chloropent-2-yne: (A) gas; (B) annealed solid.
G.A. Guirgis et al. / Journal of Molecular Structure 613 (2002) 15–3516

temperature of boiling liquid nitrogen, housed in a
vacuum cell fitted with CsI windows. The sample was
condensed as an amorphous solid and repeatedly
annealed until no further changes were observed in the
spectra.
The mid-infrared spectrum of the sample dissolved
in liquified xenon (Fig. 2) was recorded as a function
of temperature on a Bruker model IFS Fourier
transform spectrometer equipped with a globar
source, a Ge/KBr beamsplitter and a DTGS detector.
For all spectra, 100 interferograms were collected at
1.0 cm21 resolution, averaged and transformed with a
boxcar truncation function. For these studies, a
specially designed cryostat cell was used. It consists
of a copper cell with a path length of 4 cm with a
wedged silicon windows sealed to the cell with
indium gasket. The cell was cooled by boiling liquid
nitrogen and the temperature was monitored with two
Pt thermoresistors. The complete cell was connected
to a pressure manifold, allowing the filling and
evacuation of the cell. After the cell has cooled to
the desired temperature, a small amount of the
compound was condensed into the cell. Next, the
pressure manifold and the cell were pressurized with
the noble gas, which immediately started to condense
in the cell, allowing the compound to dissolve.
The Raman spectra were recorded on a SPEX
model 1403 spectrometer equipped with a Spectra-
Physics model 164 argon ion laser operating on the
514.5 nm line. The laser power used was 0.5 W for the
liquid and the solid with a spectral band pass of
3 cm21. The spectrum of the liquid was recorded with
the sample sealed in a Pyrex glass capillary.
Depolarization measurements were obtained for the
liquid sample using a standard Ednalite 35 mm
camera polarizer with 38 mm of free aperture affixed
to the SPEX instrument. Depolarization ratio
measurements were checked by measuring the state
of polarization of the Raman bands of carbon
tetrachloride immediately before depolarization
measurements were made on the liquid sample. The
Raman frequencies are expected to be accurate to
^2 cm21 and typical spectra are shown in Fig. 3.
The far infrared spectrum of gaseous 5-chloropent-
2-yne (Fig. 4) was recorded on a Bomem model
DA3.002 Fourier transform spectrometer equipped
with a vacuum bench, 6.25 and 12.5 m mylar
beamsplitters, and a liquid helium-cooled Si bol-
ometer. The spectrum was obtained with an effective
resolution of 0.10 cm21 from the sample contained in
a 1 m folded path cell equipped with mirrors coated
with gold, and fitted with polyethylene windows. The
spectra of the amorphous and crystalline solids (Fig.
4) were obtained with a Perkin–Elmer model 2000
infrared Fourier transform spectrometer equipped
with a metal grid beamsplitter and a DTGS detector.
The sample was deposited on a Si substrate held at
77 K with boiling liquid nitrogen which was con-
tained in a cryostat cell equipped with polyethylene
windows. All of the bands of significant intensity
observed in the infrared and Raman spectra with their
proposed assignments are available from the authors
and the wavenumbers for the fundamentals for both
the anti and gauche forms in the gaseous, solution in
liquid xenon, liquid and solid states are listed in
Tables 1 and 2.
Fig. 2. Infrared spectra of 5-chloropent-2-yne: (A) experimental
spectrum of 5-chloropent-1-yne in liquified xenon at 275 8C; (B)
MP2/6-31G(d) ab initio calculated spectrum of the anti and gauche
mixture with a DH of 233 cm21 (C) calculated for the pure gauche
conformer; and (D) calculated for the pure anti conformer.
G.A. Guirgis et al. / Journal of Molecular Structure 613 (2002) 15–35 17

3. Ab initio calculations
Ab initio calculations were performed with the
GAUSSIAN 98 program [7] using Gaussian-type basis
functions. The energy minima with respect to nuclear
coordinates were obtained by simultaneous relaxation
of the geometry parameters using the gradient method
of Pulay [8]. The structural optimizations for the anti
and gauche conformers were carried out with initial
parameters taken from those obtained from the ab
initio MP2/6-31G(d) calculations of 1-butyne [9] and
1-chloropropane [3]. The structural parameters as
determined by different basis sets for the anti and
gauche conformers of 5-chloropent-2-yne are listed in
Table 3.
The energies obtained by these ab initio calcu-
lations of the anti and gauche conformers are given in
Table 3. The anti conformer is the more stable form in
every case, with the gauche conformer having higher
energy by 393 cm21 than the anti form from the MP2/
6-31G(d) calculation. The lowest estimate of this
energy difference is 292 cm21 which was obtained
from the MP2/6-311 (2df,2pd) calculation.
The force fields in Cartesian coordinates were
obtained by the GAUSSIAN 98 program [7] from the
MP2/6-31G(d) calculation. Internal coordinates (Fig.
5) were used to calculate the G and B matrices using
the structural parameters given in Table 3. Using the B
matrix [10], the force fields in Cartesian coordinates
were then converted to force fields in internal
coordinates, and the pure ab initio vibrational
frequencies were reproduced. The force constants
for the two conformers can be obtained from the
authors. Subsequently, scaling factors of 0.88 for C–
H stretches, 0.9 for heavy atom stretches and C–H
bends, 1.4 for the CxC–C in-plane bend, 1.5 for
CxC–C out-of-plane bend and 1.0 for CxC stretch
Fig. 3. Raman spectra of 5-chloropent-2-yne: (A) liquid and (B) solid.
Fig. 4. Far infrared spectra of 5-chloropent-2-yne: (A) gas; (B)
amorphous solid; and (C) polycrystalline solid. Bands marked with
an asterisk are due to HCl impurity.
G.A. Guirgis et al. / Journal of Molecular Structure 613 (2002) 15–3518
Table 1
Observed and calculated frequencies (cm21) and PEDs for the anti conformer of 5-chloropent-2-yne
Species Vib.
No.
Fundamentala Ab
initiob
Fixed
scaledc
IR
int.dRaman
act.dIR
gas
IR solid Raman
liquid
Raman
solid
Xe
soln.
PED
A0 n1 CH3 antisymmetric
stretch
3190 2992 8.0 85.2 2976 2976 2965 2977 2977 100S1
n2pCH2 symmetric stretch 3166 2970 13.1 58.3 2971 2960 2962 2963 2962 100S2
n3 CH2 symmetric stretch 3108 2916 10.2 94.2 2937 2917 2922 2917 2937 99S3
n4 CH3 symmetric stretch 3104 2912 18.1 222.2 2922 2917 2922 2922 2923 99S4
n5 CxC stretch 2311 2289 1.9 138.3 2241 2233 2236 2233 2241 83S5
n6pCH2 deformation 1552 1473 4.9 3.9 1458 1446 1449 1447 1450 80S6, 20S8
n7 CH3 antisymmetric
deformation
1546 1466 7.7 20.2 1453 1431 1439 1431 1441 93S7
n8 CH2 deformation 1543 1465 0.9 24.5 – 1431 1439 1431 1441 79S8, 20S6
n9 CH3 symmetric defor-
mation
1472 1396 2.5 35.0 1377 1383 1380 1381 1379 97S9
n10 CH2 wag 1419 1347 3.9 10.7 1334 1338 1339 1335 1336 45S10, 46S11
n11pCH2 wag 1320 1253 28.1 5.6 1247 1254 1248 1250 1244 55S11, 39S10
n12 C4C5 stretch 1203 1142 0.8 0.3 1143 1142 1142 1143 1144 41S12, 42S16, 12S10
n13 C1C2 stretch 1089 1043 2.4 4.3 1035 1032 1025 1032 1027 64S13, 19S14
n14 CH3 rock 1073 1023 1.5 1.1 1027 – 1025 1019 1027 71S14, 18S13
n15 CCl stretch 833 806 31.4 20.6 794 796 795 794 794 38S15, 19S17, 15S16,
14S18
n16 C2C3 stretch 757 722 22.4 6.0 712 699 705 701 708 25S16, 44S15, 22S12,
10S5
n17 C1C2C3 bend 417 434 4.4 6.8 451 451 458 452 456 33S17, 40S20, 11S15
n18 CCCl bend 281 279 3.7 3.6 – 301 294 298 – 68S18, 10S15
n19 C2C3C4 in-plane bend 232 269 7.0 2.7 268 279 274 279 – 100S19
n20 C3C4C5 in-plane bend 84 93 0.01 1.1 – – – – – 63S20, 34S17
A00 n21pCH2 antisymmetric
stretch
3237 3036 5.6 33.9 3010 3019 3009 3018 3006 98S21
n22 CH3 antisymmetric
stretch
3191 2993 7.8 92.0 2976 2976 2965 2977 2977 100S22
n23 CH2 antisymmetric
stretch
3159 2964 4.2 77.4 – 2953 2950 2950 2938 99S23
n24 CH3 antisymmetric
deformation
1545 1466 6.6 20.9 1453 1431 1439 1431 1441 93S24
n25 CH2 twist 1348 1279 0.02 14.1 – 1281 1278 1281 1283 48S25, 40S26
n26pCH2 twist 1214 1154 1.2 1.6 1150 1158 1158 1158 1147 48S26, 43S25
(continued on next page)
G.A
.G
uirg
iset
al.
/Jo
urn
al
of
Mo
lecula
rS
tructu
re6
13
(20
02
)1
5–
35
19

and all other coordinates along with the geometric
average of the scaling factors for interaction force
constants were used to obtain the fixed scaled force
field and resultant wavenumbers (Tables 1 and 2). The
set of symmetry coordinates is given in Table 4 and
they were used to determine the corresponding
potential energy distribution (PED). The calculated
infrared intensities, Raman activities and PEDs are
also given in Tables 1 and 2.
Infrared spectra were calculated based on the
dipole moment derivatives with respect to the
Cartesian coordinates. The derivatives were taken
from the ab initio calculations at the MP2/6-31G(d)
level and transformed to normal coordinates by
›mu
›Qi
� �¼X
j
›mu
›Xj
!Lij
where Qi is the ith normal coordinate, Xj is the jth
Cartesian displacement coordinate and the Lji is the
transformation matrix between Cartesian displace-
ment coordinates and normal coordinates. The
infrared intensities were then calculated by:
Ii ¼Np
3c2
›mx
›Qi
� �2
þ›my
›Qi
� �2
þ›mz
›Qi
� �2" #
:
The predicted infrared spectra of the pure anti and the
gauche conformers are shown in Fig. 2D and C,
respectively. The combination of the two spectra for
the conformers with DH of 233 cm21 between the
most stable anti conformer and the less stable gauche
rotamer is shown in Fig. 2B. The DH value used was
taken from the temperature dependent measurements
of the xenon solution performed in this study. The
predicted infrared spectrum was very useful for
identifying the bands due to the two conformers in
the infrared spectrum of the sample dissolved in liquid
xenon.
The predicted Raman spectra (Fig. 6) for the two
conformers of 5-chloropent-2-yne and the room
temperature mixture were calculated using scattering
activities determined from the MP2/6-31G(d) ab initio
calculations. The GAUSSIAN 98 program [7] with the
option of calculating the polarizability derivatives
was used. The evaluation of Raman activity by using
the analytical gradient methods has been developedTab
le1
(co
nti
nued
)
Sp
ecie
s
Vib
.
No
.F
un
dam
enta
la
Ab
init
iob
Fix
ed
scal
edc
IR int.
d
Ram
an
act.
d
IR gas
IRso
lid
Ram
an
liq
uid
Ram
an
soli
d
Xe
soln
.P
ED
n27
CH
3ro
ck1
08
41
03
60
.50
.41
03
51
03
7–
––
64S
27,
12S
28,
11S
29
n28
pC
H2
rock
10
56
10
05
1.3
2.2
99
91
00
0–
10
00
99
93
2S
28,
30S
29,
25S
27
n29
CH
2ro
ck7
94
75
51
.80
.87
53
76
1/7
53
74
97
52
75
04
5S
29,
43S
28
n30
C3C
4C
5o
ut-
of-
pla
ne
ben
d
28
43
35
0.9
11
.6–
–3
74
38
0–
66S
30,
20S
31,
12S
32
n31
C2C
3C
4o
ut-
of-
pla
ne
ben
d
21
52
55
9.2
0.4
22
32
47
–2
41
–7
9S
31,
10S
32
n32
Asy
mm
etri
cto
rsio
n8
08
41
.10
.16
6–
––
–7
5S
32,
23S
30
n33
CH
3to
rsio
n1
31
30
.03
0.1
––
––
–1
00S
33
aT
he
aste
risk
on
the
CH
2g
rou
pin
dic
ates
the
gro
up
wit
hth
eC
lat
om
atta
ched
.b
Fro
mM
P2/6
-31(d
)ca
lcula
tion.
cS
cali
ng
fact
or
of
0.8
8fo
rC
–H
stre
tch
es,
0.9
for
hea
vy
ato
mst
retc
hes
and
C–
Hb
end
s,1
.4fo
rth
eCx
C–
Cin
-pla
ne
ben
d,
1.5
for
Cx
C–
Co
ut-
of-
pla
ne
ben
dan
d1
.0fo
rCx
C
stre
tch
and
all
oth
erco
ord
inat
es.
dIn
frar
edin
tensi
ties
inkm
/mol
and
Ram
anac
tivit
ies
inA
4/a
mu
from
MP
2/6
-31(d
)ca
lcula
tion.
G.A. Guirgis et al. / Journal of Molecular Structure 613 (2002) 15–3520

Table 2
Observed and calculated frequencies (cm21) and PEDs for the gauche conformer of 5-chloropent-2-yne
Species Vib. No. Fundamentala Ab initiob Fixed
scaledc
IR int.d Raman act.d IR gas Raman liquid Xe soln. PED
A0 n1 CH3 antisymmetric stretch 3189 2992 8.7 88.6 2976 2965 2977 51S1, 49S22
n2pCH2 symmetric stretch 3156 2961 22.2 87.9 – 2952 2962 85S2, 14S23
n3 CH2 symmetric stretch 3090 2899 14.7 139.4 – 2908 2900 93S3
n4 CH3 symmetric stretch 3104 2911 20.6 175.3 – 2922 2938 100S4
n5 CxC stretch 2314 2292 2.1 107.7 2241 2292 2241 83S5
n6pCH2 deformation 1543 1465 5.1 9.1 – 1439 1441 97S6
n7 CH3 antisymmetric deformation 1546 1466 6.1 22.6 – 1439 1441 69S7, 22S24
n8 CH2 deformation 1531 1452 5.7 17.9 – 1425 1424 98S8
n9 CH3 symmetric deformation 1472 1396 2.2 31.4 1377 1380 1379 97S9
n10 CH2 wag 1414 1343 15.1 20.7 1305 – 1330 64S10, 14S26
n11pCH2 wag 1396 1325 31.5 2.2 1297 1299 1300 86S11, 12S25
n12 C4C5 stretch 1204 1143 1.2 1.1 1143 1144 1147 34S12, 35S16
n13 C1C2 stretch 1088 1040 1.9 2.6 1034 1025 1027 18S13, 37S14, 16S28, 12S29
n14 CH3 rock 1070 1019 2.2 2.0 1027 1025 1027 50S14, 19S13, 12S28
n15 CCl stretch 732 698 10.9 5.6 682 – 680 46S15, 13S12, 12S16, 11S29
n16 C2C3 stretch 705 675 9.9 8.2 669 659 666 16S16, 37S15, 20S12
n17 C1C2C3 bend 504 511 8.1 3.1 515 514 512 40S17, 15S20, 11S18
n18 CCCl bend 318 334 2.1 5.0 341 346 – 27S18, 27S20, 16S32, 10S30
n19 C2C3C4 in-plane bend 231 266 3.7 3.5 268 – – 92S19
n20 C3C4C5 in-plane bend 131 146 4.6 1.7 130 – – 64S20, 23S32, 15S17
n21pCH2 antisymmetric stretch 3225 3026 7.9 64.5 – 3015 – 98S21
n22 CH3 antisymmetric stretch 3190 2993 7.7 79.6 – 2965 2977 51S22, 49S1
n23 CH2 antisymmetric stretch 3144 2949 3.6 106.4 – 2951 – 80S23, 14S2
n24 CH3 antisymmetric deformation 1546 1466 6.5 21.2 – 1439 1441 71S24, 23S7
n25 CH2 twist 1285 1222 0.6 14.5 – 1220 1222 43S25, 28S26
n26pCH2 twist 1230 1168 0.6 4.4 – 1170 1168 41S26, 32S25, 10S10
n27 CH3 rock 1077 1029 2.3 0.5 1027 – 1027 86S27
n28pCH2 rock 940 904 3.8 2.0 899 894 896 29S28, 30S29, 10S17, 10S18
n29 CH2 rock 991 942 8.7 3.7 936 937 935 25S29, 33S13, 16S28
n30 C3C4C5 out-of-plane bend 257 298 1.4 8.5 – – – 21S30, 56S31, 16S18
n31 C2C3C4 out-of-plane bend 203 234 3.9 0.2 213 210 – 47S31, 20S18, 17S30
(continued on next page)
G.A
.G
uirg
iset
al.
/Jo
urn
al
of
Mo
lecula
rS
tructu
re6
13
(20
02
)1
5–
35
21

[11,12] and the activity Sj can be expressed as
Sj ¼ gj 45a2j þ 7b2
j
� where gj is the degeneracy of the vibrational mode j,
aj is the derivative of the isotropic polarizability, and
bj is that of the anisotropic polarizability. The Raman
scattering cross sections, ›s/›V which are pro-
portional to the Raman intensities, can be calculated
from the scattering activities and the predicted
frequencies for each normal mode using the relation-
ship [13,14]
›sj
›V¼
24p4
45
!ðn0 2 njÞ
4
1 2 exp2hcnj
kT
�0BBB@
1CCCA h
8p2cnj
!Sj
where n0 is the exciting frequency, nj is the vibrational
frequency of the jth normal mode, h, c and k are the
universal constants, and Sj is the corresponding
Raman scattering activity. To obtain the polarized
Raman scattering cross section, the polarizabilities are
incorporated in Sj by Sjð1 2 rjÞ=ð1 þ rjÞ where rj is
the depolarization ratio of the jth normal mode. The
Raman scattering cross section and calculated fre-
quencies were used together with a Lorentzian line
shape function to obtain the calculated spectrum. The
predicted Raman spectra of the anti and the gauche
conformers individually are shown in Fig. 6D and C,
respectively, along with the combination of the two
spectra with DH of 233 cm21 (Fig. 6B). The
agreement between the predicted spectrum (Fig. 6B)
and the observed one (Fig. 6A) is not as good as
usually found, partially because the DH value may be
significantly different in the liquid. Thus the predicted
intensities of several of the lines is obviously very
poor.
4. Vibrational assignment
The assignment of the carbon–hydrogen stretches
is rather challenging since the CH3 stretches are
predicted at nearly the same frequencies as the CH2
stretches, whereas those for the pCH2 group (methyl-
ene group with the chlorine atom attached) are
predicted at significantly different frequencies. How-
ever, because of the nearly free rotation of the methylTab
le2
(co
nti
nu
ed)
Sp
ecie
sV
ib.
No
.F
und
amen
tala
Ab
init
iob
Fix
ed
scal
edc
IRin
t.d
Ram
anac
t.d
IRg
asR
aman
liq
uid
Xe
soln
.P
ED
n32
Asy
mm
etri
cto
rsio
n6
67
21
.43
.15
6–
–4
5S
32,
37
S30,
14S
17
n33
CH
3to
rsio
n1
61
60
.10
.0–
––
10
0S
33
aT
he
aste
risk
on
the
CH
2gro
up
indic
ates
the
gro
up
wit
hth
eC
lat
om
atta
ched
.b
Fro
mM
P2
/6-3
1(d
)ca
lcu
lati
on
.c
Sca
ling
fact
or
of
0.8
8fo
rC
–H
stre
tches
,0.9
for
hea
vy
atom
stre
tches
and
C–
Hben
ds,
1.4
for
the
Cx
C–
Cin
-pla
ne
ben
d,
1.5
for
Cx
C–
Co
ut-
of-
pla
ne
ben
dan
d1
.0fo
rCx
C
stre
tch
and
all
oth
erco
ord
inat
es.
dIn
frar
edin
ten
siti
esin
km
/mo
lan
dR
aman
acti
vit
ies
inA
4/a
mu
fro
mM
P2
/6-3
1(d
)ca
lcu
lati
on
.
G.A. Guirgis et al. / Journal of Molecular Structure 613 (2002) 15–3522

Table 3
Structural parameters (bond distances in A, angles in degrees, rotational constants in MHz, dipole moments in Debye, and energies in Hartree) for anti and gauche 5-chloropent-2-
yne from ab initio calculations
MP2/6-31G(d) MP2/6-311G(d,p) MP2/6-311G(2d,2p) MP2/6-311G(2df,2pd)
anti gauche anti gauche anti gauche anti gauche
r(C1–C2) 1.524 1.523 1.525 1.524 1.519 1.518 1.517 1.517
r(C2–C3) 1.462 1.460 1.462 1.461 1.461 1.460 1.454 1.453
r(C3xC4) 1.221 1.220 1.219 1.219 1.214 1.214 1.212 1.212
r(C4–C5) 1.461 1.461 1.462 1.461 1.461 1.461 1.454 1.454
r(C1–Cl) 1.786 1.783 1.783 1.781 1.796 1.793 1.780 1.778
r(C1–H1) 1.090 1.090 1.090 1.090 1.082 1.082 1.085 1.085
r(C1–H2) 1.090 1.091 1.090 1.091 1.082 1.082 1.085 1.085
r(C2–H3) 1.095 1.096 1.095 1.095 1.088 1.088 1.089 1.087
r(C2–H4) 1.095 1.098 1.095 1.097 1.088 1.090 1.089 1.087
r(C5–H5) 1.094 1.093 1.093 1.093 1.086 1.086 1.087 1.087
r(C5–H6) 1.093 1.093 1.093 1.093 1.086 1.086 1.087 1.087
r(C5–H7) 1.093 1.093 1.093 1.093 1.086 1.086 1.087 1.087
/C1C2C3 110.5 113.2 110.8 113.0 110.1 112.7 110.4 112.7
/C2C3C4 180.0 179.3 180.0 178.6 180.0 179.4 180.0 179.3
/C3C4C5 180.0 179.8 180.0 179.7 180.0 179.8 180.0 179.8
/C2C1Cl 110.8 111.7 110.6 111.0 110.7 111.3 110.6 111.3
/C2C1H1 110.9 110.7 110.6 110.5 111.1 111.1 111.0 111.0
/C2C1H2 110.9 110.4 110.6 110.4 111.1 110.8 111.0 110.8
/H1C1H2 109.0 109.2 109.5 109.8 109.2 109.7 109.1 109.5
/ClC1H1 107.6 107.4 107.8 107.6 107.3 106.9 107.4 107.0
/ClC1H2 107.6 107.2 107.8 107.4 107.3 106.9 107.4 107.0
/C1C2H3 109.2 109.1 109.2 108.9 109.3 109.1 109.2 109.0
/C1C2H4 109.2 107.4 109.2 107.7 109.3 107.6 109.2 107.8
/H3C2H4 106.9 106.8 107.2 107.4 107.2 107.2 107.0 107.1
/C4C5H5 110.9 111.1 110.8 110.9 110.8 111.0 110.9 110.9
/C4C5H6 110.9 110.8 110.8 110.7 110.8 110.7 110.9 110.8
/C4C5H7 110.9 110.9 110.8 110.7 110.8 110.8 110.9 111.0
/H5C5H6 108.0 108.0 108.2 108.2 108.1 108.1 108.0 108.0
/H5C5H7 107.9 108.0 108.1 108.2 108.1 108.1 108.0 108.0
/H6C5H7 107.9 107.9 108.1 108.1 108.1 108.0 108.0 108.0
(continued on next page)
G.A
.G
uirg
iset
al.
/Jo
urn
al
of
Mo
lecula
rS
tructu
re6
13
(20
02
)1
5–
35
23

group, one observes the strong, weak, weak alterna-
tions of the Q-branches (Fig. 7) for the essentially
degenerate CH3 antisymmetric stretch. The K ¼ 0
transitions must be either the 3010 or 2981 cm21 Q-
branch, since these are the two strongest ones (Fig. 7)
in this spectral region. The infrared spectrum of the
xenon solution seems more consistent with the choice
of the 2981 cm21 band as the K ¼ 0 transition. The
corresponding symmetric stretch, n4, is predicted to be
the strongest Raman line in this region with it being
observed at 2922 cm21 (2923 cm21 in the xenon
solution). With these assignments for the CH3 group,
the possible assignments for the two CH2 stretches are
significantly reduced to 2962 or 2950 cm21 for the
CH2 antisymmetric stretch. However, the 2962 cm21
seems more appropriately assigned as the pCH2
symmetric stretch based on the ab initio predictions,
particularly since the corresponding antisymmetric
stretch is observed at a rather high frequency of
3009 cm21 in the Raman spectrum of the liquid. This
leaves the CH2 symmetric stretch assigned at
2937 cm21, which appears to shift to a considerably
lower frequency in the solid.
There are some uncertainties in the assignments for
the CH3 and CH2 deformations. The pCH2 defor-
mation can be clearly assigned to the Q-branch at
1458 cm21, but the K ¼ 0 transition is either at
1460.4 or 1418.5 cm21 since these are the strongest
Q-branches. In the infrared spectrum of the xenon
solution there are bands at 1450, 1441, 1437 and
1424 cm21, so one is left with the problem of taking
the 1418.5 as the K ¼ 0 transition with a shift to
1424 cm21 in the xenon solution, or the 1460.4 Q-
branch as the K ¼ 0 transition which gives a rather
small difference with the ab initio predicted value of
1466 cm21. We have chosen this latter alternative
since the predicted infrared intensities of n7 and n24
indicate that they should give rise to the strongest
infrared band in this spectral region. Since the band
center will be below the K ¼ 0 transition Q-branch
(Table 5) the shift of the band center to 1454 in the gas
to 1450 cm21 in the krypton solution is consistent for
the rather small changes in the frequencies normally
found in going from the vapor to the rare gas solution.
This assignment indicates that the earlier assignment
of this fundamental for the corresponding fluoride
molecule, 5-fluoropent-2-yne, is in error, since the
1418.66 cm21 Q-branch was chosen as the K ¼ 0Tab
le3
(co
nti
nued
) MP
2/6
-31
G(d
)M
P2
/6-3
11
G(d
,p)
MP
2/6
-31
1G
(2d
,2p
)M
P2
/6-3
11
G(2
df,
2pd
)
an
tig
au
che
an
tig
au
che
an
tig
au
che
an
tig
au
che
/C
lC1C
2C
31
80
.06
5.4
18
0.0
66
.71
80
.06
5.7
18
0.0
65
.3
A1
98
65
55
68
19
99
75
63
01
99
24
55
05
20
03
65
53
8
B8
30
12
80
83
11
27
78
33
13
00
84
01
31
4
C8
09
10
91
81
01
09
28
11
11
03
81
81
11
4
lmal
2.6
13
1.0
07
2.6
68
1.0
69
2.5
92
0.9
97
2.6
06
0.9
90
lmbl
0.5
01
1.8
13
0.4
97
1.8
16
0.4
84
1.7
96
0.4
61
1.7
41
lmcl
0.0
00
0.6
86
0.0
00
0.7
13
0.0
00
0.7
02
0.0
00
0.6
51
lmtl
2.6
61
2.1
83
2.7
14
2.2
25
2.6
37
2.1
71
2.6
46
2.1
06
2(E
þ6
53
)0
.645
53
90
.64
37
47
0.9
09
91
80
.90
83
90
0.9
97
63
20
.99
61
36
1.1
06
34
31
.10
50
14
DE
(cm
21)
39
33
35
32
82
92
G.A. Guirgis et al. / Journal of Molecular Structure 613 (2002) 15–3524

band [15]. This assignment then leaves the 1441 cm21
band in the xenon solution as n8, the CH2 deformation.
The assignment of the remaining fundamentals in
the fingerprint region (Fig. 8) follows rather straight-
forwardly from the ab initio predicted values, group
frequencies, the infrared band contours, and the
spectra of the solid. Of particular interest was the
CH3 rocks where the ab initio predictions have the A0
and A00 modes separated by 13 cm21, i.e. 1023 and
1036 cm21, respectively. However, the infrared
spectrum of the gas clearly indicates the strong,
weak, weak alternation for these CH3 rocking modes
with the K ¼ 0 transition about 1035 cm21. There-
fore, these rocking modes are assigned (Table 5) as
pseudo-degenerate vibrations like the CH3 antisym-
metric stretches and deformations.
Fig. 5. Internal coordinates for 5-chloropent-2-yne.
Fig. 6. Raman spectra of 5-chloropent-2-yne: (A) experimental
spectrum of the liquid; (B) MP2/6-31G(d) MP2/6-31G(d) ab initio
calculated spectrum of the anti and gauche mixture with a DH of
233 cm21 (C) calculated for the pure gauche conformer; and (D)
calculated for the pure anti conformer.
Fig. 7. Comparison of (A) infrared spectrum of the annealed solid,
(B) infrared spectrum of the gas showing the free internal rotation of
the terminal methyl group; and (C) Raman spectra from 2800 to
3100 cm21 of the annealed solid for 5-chloropent-2-yne.
G.A. Guirgis et al. / Journal of Molecular Structure 613 (2002) 15–35 25

The low frequency spectral region is where the most
pronounced evidence for the conformers should be
observed, and this is, in fact, the case. For example, the
C3C4C5 ‘in-phase’ bend is predicted between 131
(unscaled) and 146 cm21 (scaled) for the gauche
conformer, with a predicted infrared intensity of
4.6 km/mol, whereas the corresponding mode for the
anti conformer is predicted between 84 (unscaled) and
93 cm21 (scaled) with essentially zero intensity. There
is a relatively strong band at 130 cm21 in the infrared
spectrum of the gas which is not present in the infrared
spectrum of the solid (Fig. 4). Similarly, the C1C2C3
and the CCCl bends (A0 modes for the anti conformer)
for the gauche conformer are predicted at 511 and
334 cm21 with no fundamental for the anti conformer
predicted within 50 cm21 of the higher frequency
band. The C3C4C5 bending mode of the anti conformer
is predicted at 335 cm21 but it is clearly observed at
374 cm21 in the Raman spectrum of the liquid. This
fundamental is predicted to have an infrared intensity
of 0.9 km/mol. Therefore the bands observed at 515
and 341 cm21 in the infrared spectrum of the gas which
must be assigned to these fundamentals for the gauche
conformer. Both of these bands disappear from the
Table 4
Symmetry coordinate for 5-chloropent-2-yne
Species Descriptiona Symmetry coordinateb
A0 CH3 antisymmetric stretch S1 ¼ 2r7 2 r5 2 r6pCH2 symmetric stretch S2 ¼ r1 þ r2
CH2 symmetric stretch S3 ¼ r3 þ r4
CH3 symmetric stretch S4 ¼ r5 þ r6 þ r7
CxC stretch S5 ¼ SpCH2 deformation S6 ¼ 412 b1 2 b2 2 a1 2 a2
CH3 antisymmetric deformation S7 ¼ 2f2 a5 2 a6
CH2 deformation S8 ¼ 4h2 b3 2 b4 2 a3 2 a4
CH3 symmetric deformation S9 ¼ b5 þ b6 þ b7 2 a5 2 a6 2 f
CH2 wag S10 ¼ b3 þ b4 2 a3 2 a4pCH2 wag S11 ¼ b1 þ b2 2 a1 2 a2
C4C5 stretch S12 ¼ T
C1C2 stretch S13 ¼ U
CH3 rock S14 ¼ 2b7 2 b5 2 b6
CCl stretch S15 ¼ V
C2C3 stretch S16 ¼ Q
C1C2C3 bend S17 ¼ u
CCCl bend S18 ¼ p
C2C3C4 in-plane bend S19 ¼ j1
C3C4C5 in-plane bend S20 ¼ l1
A00 pCH2 antisymmetric stretch S21 ¼ r1 2 r2
CH3 antisymmetric stretch S22 ¼ r5 2 r6
CH2 antisymmetric stretch S23 ¼ r3 2 r4
CH3 antisymmetric deformation S24 ¼ a5 2 a6
CH2 twist S25 ¼ b3 2 b4 2 a3 þ a4pCH2 twist S26 ¼ b1 2 b2 2 a1 þ a2
CH3 rock S27 ¼ b5 2 b6pCH2 rock S28 ¼ b1 2 b2 þ a1 2 a2
CH2 rock S29 ¼ b3 2 b4 þ a3 2 a4
C3C4C5 out-of-plane bend S30 ¼ l2
C2C3C4 out-of-plane bend S31 ¼ j2
Asymmetric torsion S32 ¼ t2
CH3 torsion S33 ¼ t1
a The pCH2 refers to the carbon with the chlorine atom attached.b Not normalized.
G.A. Guirgis et al. / Journal of Molecular Structure 613 (2002) 15–3526

infrared spectrum of the solid (Fig. 4). On these bases it
is concluded that the anti conformer is the rotamer
remaining in the polycrystalline solid state. Thus, the
assignment of skeletal bending fundamentals can
readily be made from the ab initio predictions and the
infrared and Raman spectra of the solid. It should be
noted that the C3C4C5 out-of-plane bend which is
observed more than 30 cm21 higher than the predicted
value (335 versus 374 cm21 for the liquid) is only
observed in the Raman spectrum which shows the
importance of having both Raman and infrared data for
making vibrational assignments.
The asymmetric torsional transitions for both the
anti and gauche conformers are observed at 66 and
56 cm21, respectively. The predicted values are 80
(unscaled) and 66 cm21 (unscaled), respectively,
which is a much larger difference than normally
found for these modes. However, the relative
intensities of these two peaks is much more consistent
with the proposed assignment than the alternative of
assigning the 66 cm21 band as the asymmetric
torsional fundamental of the gauche conformer and
leaving the corresponding mode for the anti rotamer
unassigned.
Table 5
Coriolis structure of nearly-degenerate CH3 antisymmetric vibrations
CH3 antisymmetric stretch CH3 antisymmetric deformation CH3 antisymmetric rock
m nobs nobs 2 ncalc nobs nobs 2 ncalc nobs nobs 2 ncalc
12 3093.96 20.41 1112.88 20.54
11 3085.01 20.14 1106.23 20.59
10 3075.97 20.08 1101.69 1.43
9 3066.70 0.11 1093.21 20.51
8 3057.46 20.21 1086.88 20.34
7 3048.12 0.25 1554.40 0.41 1081.64 0.89
6 3038.67 0.23 1540.93 20.02 1074.64 0.33
5 3029.19 0.22 1527.37 20.43 1068.42 0.52
4 3019.32 20.14 1513.35 21.21 1061.48 20.05
3 3009.98 0.07 1055.00 20.19
2 3000.30 20.01 1488.88a 1048.64 20.25
1 2990.71 0.03 1476.24 1.99 1041.83 20.78
0 2980.91 20.09 1461.41 0.79 1035.40 20.97
21 2971.58 0.30 1447.02 0.13
22 2961.21 20.31 1432.01 21.05
23 2951.00 20.71 1418.42 20.72 1018.22 0.37
24 2941.43 20.43 1404.98 20.14 1013.48 1.73
25 2931.97 20.06 1390.55 20.45 1004.62 21.05
26 2922.10 20.05 1377.26 0.57 999.34a
27 2912.76 0.68 1362.99 0.02
28 1347.94 20.12
29 1333.79 0.23
210 1319.00a
St. dev. 0.33 0.85 0.88
c0 2981.00 ^0.10 1460.62 ^0.34 1036.4 ^0.31
c1 9.699 ^0.0176 13.6800 ^0.047 6.224 ^0.074
c2 20.0264 ^0.0016 20.0487 ^0.0099 0.016 ^0.0087
F001 6.0653 6.0653 6.0653
z 0.2005 ^0.0014 20.128 ^0.005 0.487 ^0.007
n0 2976.1 ^0.1 1453.7 ^0.2 1034.8 ^0.3
a Not used in fit.
G.A. Guirgis et al. / Journal of Molecular Structure 613 (2002) 15–35 27

5. Conformational stability
A variable temperature study of the infrared
spectrum of 5-chloropent-2-yne dissolved in liquified
xenon was carried out to determine the energy
difference between the two stable conformers. An
important advantage to this temperature study is that
the conformer peaks are better resolved and the area
under them is more easily measured than bands
observed in the infrared spectrum of the gas. In Fig. 9,
a portion of the infrared spectrum of the sample
dissolved in xenon is shown. These data clearly show
how well the bands are separated and identified for the
individual conformers. Spectral data were obtained at
10 different temperatures ranging from 255 to
2100 8C of the infrared spectrum from 3500 to
400 cm21. The bands chosen for the anti conformer
for the enthalpy difference determination were 456,
708, 749 and 1244 cm21 and those for the gauche
conformer at 513, 665, 680, 896, 936 and 1300 cm21.
A typical spectral change over this temperature range
is shown in Fig. 10. Hence the following conformer
pairs were used in the enthalpy determination: 456/
513, 456/665, 456/896, 456/936, 456/1300, 708/513,
708/665, 708/896, 708/936, 708/1300, 749/513, 749/
665, 749/896, 749/936, 749/1300, 1244/665, 1244/
680, 1244/896, 1244/936 and 1244/1300 cm21. The
enthalpy difference between the anti and gauche
Fig. 8. Comparison of (A) infrared spectrum of 5-chloropent-2-yne
in liquified xenon at 275 8C; (B) Raman spectra of the liquid; (C)
infrared spectra of the annealed solid; and (D) Raman spectra of the
solid for 5-chloropent-2-yne from 650 to 1350 cm21.
Fig. 9. Mid-infrared spectrum of 5-chloropent-2-yne in liquified
xenon at 275 8C from 400 to 1100 cm21.
Fig. 10. Temperature dependant infrared spectrum (425–525 cm21)
of 5-chloropent-2-yne in liquid xenon for the anti (456 cm21) and
the gauche C1C2C3 bend (512 cm21).
G.A. Guirgis et al. / Journal of Molecular Structure 613 (2002) 15–3528

Table 6
Temperature and intensity ratios from the conformational study of 5-chloropent-2-yne dissolved in liquid xenon
T (8C) 1000/T (K) I456/513 I456/665 I456/896 I456/936 I456/1300 I708/513 I708/665 I708/896 I708/936 I708/1300
255 4.59 2.331 0.535 2.114 1.177 0.608 15.689 3.603 14.229 7.924 4.092
260 4.69 2.070 0.540 2.037 1.146 0.583 15.798 4.123 15.548 8.749 4.449
265 4.81 2.293 0.579 1.968 1.247 0.625 16.592 4.190 14.244 9.023 4.523
270 4.93 2.080 0.561 2.234 1.233 0.614 14.112 3.803 15.154 8.361 4.163
275 5.05 2.136 0.559 2.183 1.185 0.622 16.764 4.389 17.133 9.297 4.883
280 5.18 1.713 0.557 2.238 1.216 0.638 14.451 4.699 18.882 10.257 5.381
285 5.32 2.553 0.650 2.463 1.336 0.745 18.795 4.782 18.132 9.837 5.485
290 5.46 2.677 0.783 2.857 1.532 0.824 18.222 5.330 19.451 10.426 5.612
295 5.62 2.554 0.725 3.148 1.653 0.927 17.701 5.022 21.821 11.460 6.428
2100 5.78 2.931 0.841 3.116 1.691 0.923 20.226 5.805 21.503 11.666 6.371
DHa (cm21) 159 ^ 77 263 ^ 44 283 ^ 38 232 ^ 37 293 ^ 39 140 ^ 50 244 ^ 32 265 ^ 29 214 ^ 24 274 ^ 29
T (8C) 1000/T (K) I749/513 I749/665 I749/896 I749/936 I749/1300 I1244/665 I1244/680 I1244/896 I1244/936 I1244/1300
255 4.59 16.298 3.743 14.782 8.232 4.251 2.711 23.393 10.706 5.962 3.079
260 4.69 16.260 4.244 16.003 9.005 4.579 3.063 26.299 11.551 6.500 3.305
265 4.81 14.930 3.770 12.817 8.119 4.070 3.074 25.057 10.452 6.621 3.319
270 4.93 14.415 3.884 15.480 8.540 4.253 3.010 24.213 11.997 6.619 3.296
275 5.05 18.229 4.772 18.630 10.109 5.310 3.190 24.737 12.453 6.757 3.549
280 5.18 12.803 4.164 16.729 9.087 4.768 3.124 23.919 12.552 6.818 3.577
285 5.32 20.764 5.283 20.032 10.868 6.060 3.440 31.086 13.042 7.076 3.945
290 5.46 22.829 6.678 24.368 13.061 7.030 3.698 34.262 13.494 7.233 3.893
295 5.62 19.124 5.426 23.576 12.381 6.944 3.136 43.243 13.629 7.157 4.014
2100 5.78 20.635 5.922 21.938 11.902 6.500 3.699 34.144 13.702 7.434 4.060
DHa (cm21) 200 ^ 89 304 ^ 64 324 ^ 64 273 ^ 49 334 ^ 58 135 ^ 35 298 ^ 72 155 ^ 23 104 ^ 13 165 ^ 16
a Average value of DH is 233 ^ 11 cm21 with the anti conformer the more stable form.
G.A
.G
uirg
iset
al.
/Jo
urn
al
of
Mo
lecula
rS
tructu
re6
13
(20
02
)1
5–
35
29

conformers was calculated by using the van’t Hoff
equation, 2ln K ¼ ðDH=RTÞ2 DS=R: A plot of
2 ln K versus 1/T, where K is the ratio of the intensity
of a band due to the anti conformer to one due to the
gauche conformer, has a slope which is proportional
to the enthalpy difference. The data given in Table 6
for the aforementioned conformer pairs of 5-chloro-
pent-2-yne dissolved in xenon yield enthalpy values
that range from a low value of 104 ^ 13 cm21 to a
high value of 334 ^ 58 cm21 with an average value
of 233 ^ 11 cm21. While the range of 230 cm21
between the low and high values may at first seem
large, most of the values of the 20 conformer pairs fall
within the range of the average value. In addition, it is
the conformer pairs that contain the higher frequency
anti band observed at 1244 cm21 that falls outside the
range of the average value of 233 ^ 11 cm21. As one
may observe from Table 6, most of the DH values
obtained with the anti band at 1244 cm21 are lower in
value than the conformational values obtained by the
other three bands of the anti conformers. This could
be due in part to an overtone or combination band
lying underneath the band at 1244 cm21 of the anti
conformer which is too weak to be observed, yet
intense enough to interfere with the intensity of the
band of the anti conformer. The listed uncertainties
are statistical uncertainties, which cannot take into
account any underlying overtone or combination
bands. Therefore, we believe a more realistic
uncertainty is ten percent, i.e. 23 cm21. This value
should be close to the value for the vapor [2,6,15–18]
since the volumes of the two conformers and their
dipole moments do not differ significantly.
6. Asymmetric torsional potential
The asymmetric torsion for the anti conformer is
predicted at 80 cm21 (84 cm21, scaled value) but the
fundamental is assigned at 66 cm21. The intensity of
this band is consistent with this assignment (Fig. 4).
The corresponding fundamental for the gauche
conformer is assigned at 56 cm21 although the ab
initio calculations predict a separation of 14 cm21 for
these two fundamentals.
The potential function for conformational inter-
change has been determined by first beginning with
the DH value of 233 cm21 which was obtained from
the rare gas solutions, the dihedral angle 114.38
(180 2 65.78 which is the value of the dihedral angle
ClCCC) of the gauche rotamer from MP2/6-
311G(2d,2p) calculation, and the asymmetric tor-
sional transitions of the anti and gauche conformers.
The torsional dihedral angular dependence of the
internal rotational constant, FðfÞ; can be represented
as a Fourier series:
FðfÞ ¼ F0 þX7
k¼1
Fk cos kf:
The relaxation of the structural parameters, BðfÞ;during the internal rotation can be incorporated into
the above equation by assuming that they are small
periodic functions of the torsional angle of the general
type:
BðfÞ ¼ a þ b cos fþ c sin f:
The structural parameters (Table 3) obtained from the
optimized geometries for both the anti and gauche
conformers, were used to obtain the kinetic constants.
The torsional potential is also represented as a
Fourier cosine series in the internal angle (f ):
VðfÞ ¼X6
i¼1
ðVi=2Þð1 2 cos ifÞ:
The kinetic terms, the asymmetric torsional frequen-
cies for both conformers, the experimental enthalpy,
Table 7
Potential function coefficients (cm21) for asymmetric torsion of 5-
chloropent-2-yne and barriers to interconversion (cm21)
Parameter Experimental valuea Ab initiob
V1 736 ^ 38 863
V2 2431 ^ 32 2334
V3 1572 ^ 17 1729
V4 44
DH (cm21) 196 ^ 40 393
Barriers
anti/gauche 1433 1726
gauche/anti 1237 1333
gauche/gauche 2112 2199
Dihedral angle 114.3 114.6
a Calculated using F0 ¼ 0:424431; F1 ¼ 20:035809; F2 ¼
0:003985; F3 ¼ 20:000359; F4 ¼ 0:000398; F5 ¼ 20:000359;
F6 ¼ 0:003985; F7 ¼ 20:035809 cm21:b Obtained from the MP2/6-31G(d) calculation.
G.A. Guirgis et al. / Journal of Molecular Structure 613 (2002) 15–3530

and the gauche dihedral angle were used to fit the
potential function utilizing a computer program
developed in our laboratory [19]. As an iterative
process, this calculation was continued until the
differences between the observed and calculated
wavenumbers, as well as the dispersions in the
potential constants, were minimized (Table 7). From
the calculated potential function, the anti to gauche
and gauche to gauche barriers are determined to be
1433 and 2112 cm21, respectively, with the enthalpy
difference between the two conformers of
196 ^ 40 cm21. These results are listed in Table 7
and the determined potential function is shown in Fig.
11. The values for the V1 and V2 terms are relatively
large and we have omitted the V4 term since there are
only four pieces of data for determining the potential
function. The V1 and V2 terms are strongly correlated
and the use of the gauche dihedral angle for the
potential function determination reduces the corre-
lation between these two terms.
Utilizing MP2/6-31G(d) ab initio calculations, we
have also determined the barriers to internal rotation.
The calculated potential constants, V1, V2 and V3, have
similar values to those obtained from the experimental
data. However the anti to gauche barrier is predicted
to be about 20% (296 cm21) larger than the value
obtained from the experimental data. The MP2/6-
31G(d) ab initio calculation gives the values of the
torsional fundamentals of 84 and 72 cm21 for the anti
and gauche conformers, respectively, which are larger
than the observed values of 66 and 56 cm21,
respectively. In addition, this calculation predicted a
rather large energy difference of 393 cm21 between
the two conformers, which is 160 cm21 larger than the
experimental enthalpy difference. Therefore the two
potential functions are quite similar with the major
differences in the energy difference between the
conformers and slightly higher anti to gauche barrier
for the predicted values (Fig. 11).
7. Coriolis interaction
In the infrared spectrum of the gas where the
antisymmetric CH3 stretching, CH3 deformational
and rocking modes are expected, sub-band structure
with strong–weak–weak–strong intensity alternation
is observed which is typical of perpendicular bands of
symmetric-top molecules such as the methyl halides.
In symmetric-top molecules, this structure is caused
by the Coriolis interaction of the overall rotational
motion of the molecule with the angular momentum
of the E vibrations of the methyl group. Similar sub-
band structure has been observed in the corresponding
bands in the infrared spectra of 2-pentyne [20] and the
1-halo-2-butynes [21,22]. The Q-branches of the
different sub-bands agree well with the formula nsub0 ¼
c0 ^ c1m þ c2m2:For a perpendicular band of a symmetric-top
molecule such as the degenerate fundamentals of a
Fig. 11. Potential function governing the internal rotation of the asymmetric torsion of 5-chloropent-2-yne as determined by ab initio
calculations (dotted line) and by the observed asymmetric torsional transitions from the far infrared spectrum of the gas (solid line). The
torsional dihedral angle of 08 refers to the anti conformer.
G.A. Guirgis et al. / Journal of Molecular Structure 613 (2002) 15–35 31

methyl group, the formula for the sub-band structure
with the type of intensity alternation already men-
tioned has been given [23,24] by
nsub0 ¼ n0 þ ½A0ð1 2 zÞ2 2 B0�^ 2½A0ð1 2 zÞ2 B0�K
þ ½ðA0 2 B0Þ2 ðA00 2 B00Þ�K2;
where z is the Coriolis coupling constant and the
factor (1 2 z )2 is used [23,24] rather than (1 2 2z ) as
in Herzberg [25] and Nyquist [26]. The single prime
refers to the upper state and double prime to the lower
state.
However, in the case of 5-chloropent-2-yne, the
sub-band structures are due to the interaction of the
vibrational angular momentum of the three pseudo-
degenerate vibrations with the internal rotational
angular momentum of the nearly free rotating internal
top and not with the overall rotation of the molecule.
A quadratic equation can be derived from first
principles using the appropriate Hamiltonian, but in
order to retain the z notation, the following equation
can be derived from the sub-band formula for overall
rotation of symmetric-top molecules by elimination of
the kinetic constants for overall rotation, B or
(B þ C )/2, and by replacing the A constants with F1
which is h=8p2cIredt ; the inverse reduced moment of
inertia for internal rotation of the methyl top:
nsub0 ¼ ½n0 þ F0
1ð1 2 zÞ2� þ 2F01ð1 2 zÞm
þ ðF01 2 F00
1Þm2:
In 5-chloropent-2-yne, the anti conformer is shown to
be the lower energy form with a complete vibrational
analysis given above. Thus, the sub-band structure
undoubtedly arises from the near degeneracy of
n1/n22, n7/n24 and n14/n27 of the anti form. Values
for the kinetic constant F001 in the ground vibrational
state are obtained from ab initio optimized geometric
structures of the anti conformer given in Table 3.
Additionally, from the energies of several ab initio
calculations of eclipsed and staggered configurations
of 5-chloropent-2-yne, it is evident that the barrier to
internal rotation, V3, of the methyl group is essentially
negligible, i.e. a few cm21 from all calculations.
The measurements of the observed sub-bands are
given in Table 5. Fits to the sub-band peaks have been
made by the least-squares method to the formula
nsub0 ¼ c0 ^ c1m þ c2m2 and the coefficients are also
given in Table 6. For each of the bands, the quadratic
coefficient c2 is small; it is the change in the internal
rotational constant, F, between the ground and excited
states. Taking F00 ¼ 6:0653 cm21 from the MP2
geometric structure calculation for the CH3 pseudo-
degenerate stretching fundamentals, n1/n22, we obtain
z ¼ 0:2005 ^ 0:0014 from the coefficient of the linear
term, 2F0ð1 2 zÞ; and from n0 þ F0ð1 2 zÞ2 the band
center, n0, is 2976.1 ^ 0.1 cm21. In the same way, for
the deformational fundamentals, n7/n24, we obtain z ¼
20:128 ^ 0:005 from the linear term and n0 is
1453.7 ^ 0.2 cm21 for the band center. For the two
rocking modes, n14/n27 z is 0.487 ^ 0.007 with the
band center at 1034.8 ^ 0.3. These values of both z
and n0 for the stretch and deformation are similar to
those derived from the infrared spectrum of 1-fluoro-
2-butyne in the same manner [22]. However for the
fluoride no fine structure was observed on the rocking
modes. The main reason for employing the z notation
in the fitting equation for Coriolis coupling between
the internal rotation and the angular momentum of the
degenerate CH3 vibrations is that the resulting
magnitudes of z are also comparable with those
obtained for Coriolis coupling with overall rotation in
symmetric-top molecules, the halomethanes [25] and
the 1-halo-propynes [23,26].
8. Discussion
The conformational stability determined from the
xenon solution with the anti conformer more stable by
233 ^ 23 cm21 (2.79 ^ 0.28 kJ/mol) is expected to
be close to the value in the gas phase [2,6,17,18], since
the size of the two conformers as well as their dipole
moments do not differ appreciably. This experimental
value is considerably lower than the predicted energy
differences which range from 292 cm21 (MP2/6-
311G(2df,2pd)) to 393 cm21 (MP2/6-31G(d)). It
should be noted that the rather large experimental
result is rather surprising since 1-chloropropane has
the gauche conformer as the more stable rotamer by
52 ^ 3 cm1 (0.62 ^ 0.04 kJ/mol) from variable tem-
perature FT-IR spectral studies of a xenon solution
[3]. The difference in these two molecules (YCH2-
CH2Cl) is the substitution of a propynic group as Y for
the methyl group. This difference in Y results in the
G.A. Guirgis et al. / Journal of Molecular Structure 613 (2002) 15–3532

C1–C2 bond distance being predicted to be about
0.007 A shorter in 1-chloropropane (1.517 A) than the
corresponding bond distance (1.524 A) in 5-chloro-
pent-2-yne. The corresponding cyanide, ClCH2CH2-
CN, is a good model [27] for comparison since the CN
and CxCH groups have similar electronegativities
[28] and are expected to effect the C1–C2 bond
distances about the same amount. In fact the ab initio
predicted value for the C1–C2 bond for the 3-
chloropropionitrile molecule is 0.002 A longer than
this bond in 5-chloropent-2-yne. However for the
nitrile molecule the gauche conformer was deter-
mined to be the more stable rotamer by 609 ^ 31 cm1
(7.29 ^ 0.37 kJ/mol) but this result was for the liquid
[27], which could be the result of the very large dipole
moment for the gauche conformer. Nevertheless the
ab initio predicted stability gives a larger value 451
versus 393 cm21 from MP2/6-31G(d) than that for 5-
chloropent-2-yne for the energy difference between
the conformers but with the anti rotamer being the
more stable form. A re-investigation of the confor-
mational stability of ClCH2CH2CN in the gas phase or
in the rare gas solutions would be of interest.
Undoubtedly the C1–C2 bond distance is an important
factor in determining the conformational stability of
YCH2CH2Cl molecules and one expects the enthalpy
differences to be very similar for 3-chloropropionitrile
and 5-chloropent-2-yne.
The heavy atom distances are predicted to be
essentially the same for the two conformers as are
most of the angles except the C1C2C3 angle which is
predicted to be 2.28 larger for the gauche conformer
[MP2/6-311G(d,p) calculations] compared to the
similar angle for the anti form. However, most of
the other parameters have similar values for the two
conformers with most of the angles differing by only
0.1–0.48. For the other three heavy atom angles these
differences are 0.38 for one angle and 0.48 for the other
two angles.
Most of the force constants have nearly the same
values for the two conformers, i.e. within 1–2%.
However, there are two notable exceptions where the
in-plane C2C3C4 bending force constant for the trans
rotamer is 10% larger than the corresponding force
constant for the gauche conformer (0.414 versus
0.372 mdyn/A2) and the C1C2C3 bend where the force
constant for the trans rotamer is 7% smaller than the
corresponding force constant for the gauche form
(0.690 versus 0.741 mdyn/A2). The C1C2C3 angle is
2.28 larger for the gauche conformer than this angle
for the trans form. The HCC bending force constants
for the CH2 group differ by about 3% depending on
the relative position of the CCl bond, i.e. whether it is
splitting the HCH angle or in the gauche position.
Many of the remaining force constants differ by about
1% and even the ClC1C2 angle bend differs by only
2% between the force constant values for the two
conformers. Therefore most of the frequency differ-
ences for the fundamentals for the two conformers are
the result of differences in the mixing, i.e. the PEDs.
Most of the carbon–hydrogen stretches and bends
have very similar frequencies for the two conformers
with the exception of three of the bending modes, i.e.pCH2 wag, pCH2 rock, and CH2 rock (the asterisk
indicates the carbon atom with the chlorine atom
attached). For the pCH2 wag, the band is observed at
1247 cm21 for the anti conformer, whereas the
corresponding mode is observed at 1297 cm21 for
the gauche conformer. This difference is mainly due
to the difference in mixing of the modes between the
two conformers where there is a 39% contribution
from the CH2 wag for the anti conformer, whereas the
corresponding mode for the gauche conformer has
12% contribution from the CH2 twist and 86%
contribution from the pCH2 wag. The pCH2 and CH2
rocks are observed at 999 and 753 cm21 for the anti
conformer, respectively, whereas these modes are
observed at 904 and 942 cm21, respectively, for the
gauche form. The almost 200 cm21 difference for the
CH2 rock arises from an almost equal contribution of
45% for the CH2 rock for the anti form from both the
CH2 and pCH2 rocks, whereas for the gauche form the
contribution from the CH2 rock is only 29% with
contributions of 33% from the C1–C2 stretch and only
16% from the CH2 rock. There are also some
significant differences in the observed frequencies
for several of the heavy atom vibrations such as the
CCl and C2C3 stretches as well as the C1C2C3, CCCl
and C3C4C5 bends. Most of these modes differ by
about 50 cm21 except the CCl stretch which is
observed at 794 cm21 for the anti conformer and at
682 cm21 for this mode for the gauche conformer.
Again, this difference in frequencies is due to mixing
rather than force constants differences for these
stretches.
For chloro- and hydrocarbon compounds, one can
G.A. Guirgis et al. / Journal of Molecular Structure 613 (2002) 15–35 33

usually predict the wavenumbers of the fundamentals
to within 1% from MP2/6-31G(d) calculations utiliz-
ing only two scaling factors of 0.88 for the carbon–
hydrogen stretches and 0.9 for the carbon–hydrogen
bends and heavy atom stretches while keeping the
other force constants with the predicted values. Such
predictions usually give fundamental wavenumbers
with average errors of 10–12 cm21. However for the
acetylene group, the in- and out-of plane CxC–C
bends need to be scaled by factors of 1.4 and 1.5,
respectively, to give reasonable results from the
MP2/6-31G(d) calculations. By using these four
scaling factors, the fundamentals frequencies are
predicted with errors of 0.8% (11 cm21) for the A0
modes and 1.0% (13 cm21) for the A00 modes for the
anti conformer. Much of the error for the A00 modes
arises from the poor predictions for the lowest three
observed vibrations. Similar errors are also found for
the fundamentals for the gauche conformer. Even
with the two different scaling factors for the
acetylenic group, the low frequency bending modes
for this group are not very well predicted. In fact, DFT
calculations by the B3LYP method predict these
bending modes much better and if these frequencies
are needed for the vibrational assignment for
molecules with the acetylenic group the DFT
calculations are preferred.
With the DH value of 233 ^ 23 cm21 the
abundance of the gauche conformer is predicted to
be 39 ^ 2% at ambient temperature so it should be
possible to obtain microwave spectra of both
conformers. The assignment of the microwave lines
for the anti conformer should be relatively routine
since its microwave spectrum will be mainly a-type,
whereas that for the gauche conformer will be
mainly b-type which is more difficult to assign.
Since the carbon–hydrogen parameters are expected
to be well predicted from the ab initio MP2/6-
311G(d,p) calculations, the 12 rotational constants
for the two conformers with the two isotopomers
from the naturally occurring chlorine atom should be
sufficient to obtain the heavy atom structural
parameters if they are combined with the ab initio
predicted values. It would be of interest to obtain
such data so the parameters could be compared to the
corresponding ones for the 1-chloropropane mol-
ecule. The CxC bond is predicted too long by
0.010 A by the MP2/6-311G(d,p) calculations but it
is expected that the remaining heavy atom par-
ameters should be accurate to 0.006 A for distances
and 0.58 for angles. Alternatively, electron diffraction
data could be used for the structural determination.
These data could then be used to verify that the
relative C2–C3 bond distance is the major factor
determining the conformational stability of YCH2-
CH2Cl molecules.
Acknowledgments
J.R. Durig acknowledges partial support of these
studies by the University of Missouri-Kansas City
Faculty Research Grant program.
References
[1] Y.E. Youssoufi, M. Herman, J. Lievin, J. Mol. Phys. 94 (1998)
461.
[2] W.A. Herrebout, B.J. van der Veken, A. Wang, J.R. Durig,
J. Phys. Chem. 99 (1995) 578.
[3] J.R. Durig, X. Zhu, S. Shen, J. Mol. Struct. 570 (2001) 1.
[4] J.R. Durig, J. Liu, T.S. Little, V.F. Kalasinsky, J. Phys. Chem.
96 (1992) 8224.
[5] G.A. Guirgis, X. Zhu, J.R. Durig, Struct. Chem. 10 (1999) 445.
[6] W.A. Herrebout, B.J. van der Veken, J. Phys. Chem. 100
(1996) 9671.
[7] M.J. Frisch, G.W. Trucks, H.B. Schlegel, G.E. Scuseria, M.A.
Robb, J.R. Cheeseman, V.G. Zakrzewski, J.A. Montgomery,
R.E. Stratmann, J.C. Buran, S. Dapprich, J.M. Millam, A.D.
Daniels, K.N. Kudin, M.C. Strain, O. Farkas, J. Tomasi,
V. Barone, M. Cossi, R. Cammi, B. Mennucci, C. Pomelli, C.
Adamo, S. Clifford, J. Ochterski, G.A. Petersson, P.Y. Ayala,
Q. Cui, K. Morokuma, D.K. Malick, A.D. Rabuck,
K. Raghavachari, J.B. Foresman, J. Cioslowski, J.V. Ortiz,
B.B. Stefanov, G. Liu, A. Liashenko, P. Piskorz, I. Komaromi,
R. Gomperts, R.L. Martin, D.J. Fox, T. Keith, M.A. Al-Laham,
C.Y. Peng, A. Nanayakkara, C. Gonzalez, M. Challacombe,
P.M.W. Gill, B.G. Johnson, W. Chen, M.W. Wong, J.L.
Andres, M. Head-Gordon, E.S. Replogle, J.A. Pople, GAUS-
SIAN 98, Revision A.7, Gaussian, Inc., Pittsburgh PA, 1998.
[8] P. Pulay, Mol. Phys. 17 (1969) 197.
[9] G.A. Guirgis, J.R. Durig, S.J. Bell, J. Mol. Struct. 196 (1989)
101.
[10] G.A. Guirgis, X. Zhu, Z. Yu, J.R. Durig, J. Phys. Chem. A 104
(2000) 4383.
[11] M.J. Frisch, Y. Yamagushi, J.F. Gaw, H.F. Schaefer III, J.S.
Binkley, J. Chem. Phys. 84 (1986) 531.
[12] R.D. Amos, Chem. Phys. Lett. 124 (1986) 376.
[13] P.L. Polavarapu, J. Phys. Chem. 94 (1990) 8106.
G.A. Guirgis et al. / Journal of Molecular Structure 613 (2002) 15–3534

[14] G.W. Chantry, in: A. Anderson (Ed.), The Raman Effect, vol.
1, Marcel Dekker, New York, NY, 1971, Chapter 2.
[15] S. Bell, X. Zhu, G.A. Guirgis, J.R. Durig, Phys. Chem. Chem.
Phys. 39 (2001) 776.
[16] B.J. van der Veken, F.R. DeMunck, J. Chem. Phys. 97 (1992)
3060.
[17] M.O. Bulanin, J. Mol. Struct. 347 (1993) 73.
[18] M.O. Bulanin, J. Mol. Struct. 19 (1973) 59.
[19] P. Groner, R.D. Johnson, J.R. Durig, J. Mol. Struct. 142 (1986)
363.
[20] S. Bell, G.A. Guirgis, S.W. Hur, J.R. Durig, Spectrochim. Acta
55A (1999) 2361.
[21] R.D. McLachlan, Spectrochim. Acta 23A (1967) 1793.
[22] G.A. Guirgis, S. Bell, R.J. Durig, Spectrochim. Acta 57A
(2001) 1235.
[23] D.W. Davidson, H.J. Bernstein, Can. J. Chem. 33 (1955) 1226.
[24] E.W. Jones, R.J.L. Popplewell, H.W. Thomson, Spectrochim.
Acta 22 (1966) 639.
[25] G. Herzberg, Molecular Spectra and Molecular Structure: II.
Infrared and Raman Spectra of Polyatomic Molecules, Van
Nostrand, Princeton, NJ, 1945, p. 429.
[26] R.A. Nyquist, Spectrochim. Acta 21 (1965) 1245.
[27] J.R. Durig, G.A. Guirgis, A.S. Drew, J. Mol. Struct. 327
(1994) 55.
[28] N. Inamoto, S. Masuda, Chem. Lett. (1982) 1003.
G.A. Guirgis et al. / Journal of Molecular Structure 613 (2002) 15–35 35


![Vibrational energies for NH[sub 3] based on high level ab initio potential energy surfaces](https://img.pdfslide.net/doc/110x75/6324cd8a584e51a9ab0b3efe/vibrational-energies-for-nhsub-3-based-on-high-level-ab-initio-potential-energy.jpg)


