Muiruri et al. Malar J (2018) 17:398 https://doi.org/10.1186/s12936-018-2534-8
RESEARCH
Selective sweeps and genetic lineages of Plasmodium falciparum multi-drug resistance (pfmdr1) gene in KenyaPeninah Muiruri1,2, Denis W. Juma1, Luicer A. Ingasia1, Lorna J. Chebon1, Benjamin Opot1, Bidii S. Ngalah1, Jelagat Cheruiyot1, Ben Andagalu1, Hoseah M. Akala1, Venny C. S. Nyambati2, Joseph K. Ng’ang’a2 and Edwin Kamau1,3*
Abstract
Background: There are concerns that resistance to artemisinin-based combination therapy might emerge in Kenya and sub-Saharan Africa (SSA) in the same pattern as was with chloroquine and sulfadoxine–pyrimethamine. Single nucleotide polymorphisms (SNPs) in critical alleles of pfmdr1 gene have been associated with resistance to artemisinin and its partner drugs. Microsatellite analysis of loci flanking genes associated with anti-malarial drug resistance has been used in defining the geographic origins, dissemination of resistant parasites and identifying regions in the genome that have been under selection.
Methods: This study set out to investigate evidence of selective sweep and genetic lineages in pfmdr1 genotypes associated with the use of artemether–lumefantrine (AL), as the first-line treatment in Kenya. Parasites (n = 252) from different regions in Kenya were assayed for SNPs at codons 86, 184 and 1246 and typed for 7 neutral microsatellites and 13 microsatellites loci flanking (± 99 kb) pfmdr1 in Plasmodium falciparum infections.
Results: The data showed differential site and region specific prevalence of SNPs associated with drug resistance in the pfmdr1 gene. The prevalence of pfmdr1 N86, 184F, and D1246 in western Kenya (Kisumu, Kericho and Kisii) com-pared to the coast of Kenya (Malindi) was 92.9% vs. 66.7%, 53.5% vs. to 24.2% and 96% vs. to 87.9%, respectively. The NFD haplotype which is consistent with AL selection was at 51% in western Kenya compared to 25% in coastal Kenya.
Conclusion: Selection pressures were observed to be different in different regions of Kenya, especially the western region compared to the coastal region. The data showed independent genetic lineages for all the pfmdr1 alleles. The evidence of soft sweeps in pfmdr1 observed varied in direction from one region to another. This is challenging for malaria control programs in SSA which clearly indicate effective malaria control policies should be based on the region and not at a country wide level.
Keywords: Soft selective sweeps, Genetic lineages, Artemisinin resistance
© The Author(s) 2018. This article is distributed under the terms of the Creative Commons Attribution 4.0 International License (http://creat iveco mmons .org/licen ses/by/4.0/), which permits unrestricted use, distribution, and reproduction in any medium, provided you give appropriate credit to the original author(s) and the source, provide a link to the Creative Commons license, and indicate if changes were made. The Creative Commons Public Domain Dedication waiver (http://creat iveco mmons .org/publi cdoma in/zero/1.0/) applies to the data made available in this article, unless otherwise stated.
Open Access
Malaria Journal
*Correspondence: [email protected] 1 Global Emerging Infections Surveillance Program, United States Army Medical Research Directorate-Africa, Kenya Medical Research Institute, P.O. Box 54, 40100 Kisumu, KenyaFull list of author information is available at the end of the article
Page 2 of 12Muiruri et al. Malar J (2018) 17:398
BackgroundRegardless of the emergence and spread of resistance to artemisinin-based combination therapy (ACT) in South-east Asia (SEA) [1–5], ACT is still widely used as the first-line treatment for uncomplicated malaria world-wide [5] and has maintained high efficacy in sub-Saharan Africa (SSA) with fast clearance rates [5, 6]. SEA is his-torically considered to be major foci of anti-malarial drug resistance, where resistance to drugs such as chloroquine and sulfadoxine–pyrimethamine (SP) may have origi-nated before eventually spreading to Africa [7, 8]. There is now heightened concern that resistance to ACT in SEA might follow the same pattern in expansion globally as previously did for chloroquine and SP [9]. With this in mind, routine monitoring of the therapeutic efficacy of ACT is critical in detecting early changes in Plasmodium falciparum sensitivity to anti-malarial drugs, and deemed necessary for timely enactment of changes to treatment policy [10]. Indeed, there is concerted effort to scale-up monitoring therapeutic efficacy of ACT in SEA [1, 2, 10–12], SSA [13], and the rest of the world [4].
Artemether–lumefantrine (AL) is the most commonly used ACT for the treatment of uncomplicated P. falcipa-rum malaria worldwide [14]. AL was introduced as the first-line treatment for uncomplicated malaria in Kenya in 2006 due to widespread resistance to chloroquine and SP, in 1998 and 2006 respectively [15–17]. ACT has main-tained adequate clinical and parasitological response (ACPR) in Kenya, with a recent study reporting more than 97% ACPR for AL and dihydroartemisinin–pipe-raquine (DP) in treatment of uncomplicated falciparum malaria in western Kenya [18]. However, studies have shown AL selects for single nucleotide polymorphisms (SNPs) in the P. falciparum chloroquine resistance transporter gene (pfcrt) and the P. falciparum multidrug resistance gene 1 (pfmdr1) in recurring parasites [19–24]. The genotypes associated with recurrent infections are K76 in pfcrt, and N86, 184F and D1246 (NFD) in pfmdr1. Reduced susceptibility to lumefantrine and mefloquine has also been linked to NFD and increase in pfmdr1 copy numbers [25–27]. Chloroquine resistance is associated with pfcrt 76T [28], and modulated by pfmdr1 86Y, Y184 and 1246Y (YYY) [29]. The pfcrt 76 and pfmdr1 86 alleles are the most important indicators of chloroquine suscep-tibility [30]. Longitudinal studies have shown the preva-lence of pfcrt 76T and pfmdr1 86Y reached over 90% in western and coastal regions of Kenya before the intro-duction of ACT, and reversed to the sensitive genotypes with the withdrawal of chloroquine and the introduc-tion of AL [31–34]. This reversal to sensitive genotype in Kenya can be attributed to the release of chloroquine drug pressure and the introduction of lumefantrine drug pressure. Recent studies have suggested changes in the
prevalence of these alleles can be a sensitive indicator of selection of parasite populations by AL which can be used to signal early reduced susceptibility [30, 35].
Kenya has a wide variation in malaria prevalence, with some regions free of malaria to those with more than 40% endemicity [36, 37]. Most regions in western Kenya are endemic lowland with high stable transmission whereas the highlands are characterized by unstable and high transmission variability which results in epidemics dur-ing periods of suitable climatic conditions [36]. To effec-tively monitor the emergence and spread of resistance to ACT, it is important not only to monitor the prevalence of these alleles (pfcrt K76, pfmdr1 N86, 184F and D1246), but also to monitor their origin and spread. Information on the evolutionary dynamics resulting in selection of these alleles in different parts of the country with differ-ent transmission intensities and different drug resistant profiles is important in guiding strategies to control, and prevent the emergence and spread of resistance to AL.
Microsatellites are important genetic markers used to identify regions in the genome that are under selection [38]. Genetic hitchhiking is driven by the selection pro-cess which results in reduction of heterozygosity at both the selected locus and neutral flanking microsatellite loci [39]. When the mutation eventually gets fixed in a popu-lation due to continuous selection, sequence diversity is reduced around the selected locus leading to selective sweeps [38].
Characterization of P. falciparum parasite genetic backgrounds using microsatellite loci flanking genes associated with resistance to chloroquine and SP was critical in defining the geographic origins and dissemina-tion of chloroquine and SP resistant parasites. It has been reported that these resistant parasites originated in a few places before eventually spreading to the rest of the world [38, 40–43]. More recently, characterization of micro-satellite loci flanking pfmdr1 gene were used to provide comprehensive data on the distribution of alleles in this gene and the pattern of selective sweeps in four sites in Cambodia. These sites had different levels of transmis-sion and drug resistance profiles [38]. The study estab-lished that pfmdr1 184F mutant allele was under selection in this parasite population whereas copy number varia-tion of pfmdr1 gene occurred on multiple genetic back-grounds. Given the importance of polymorphisms in pfmdr1 gene in response to ACT, it is warranted to inves-tigate the selective sweep and genetic lineages of pfmdr1 alleles in SSA. This study set out to investigate evidence of selective sweep and genetic lineages in pfmdr1 geno-types associated with AL treatment in Kenya. Microsatel-lite loci flanking pfmdr1 gene in parasite population from different regions of Kenya with different malaria trans-mission intensities were characterized.
Page 3 of 12Muiruri et al. Malar J (2018) 17:398
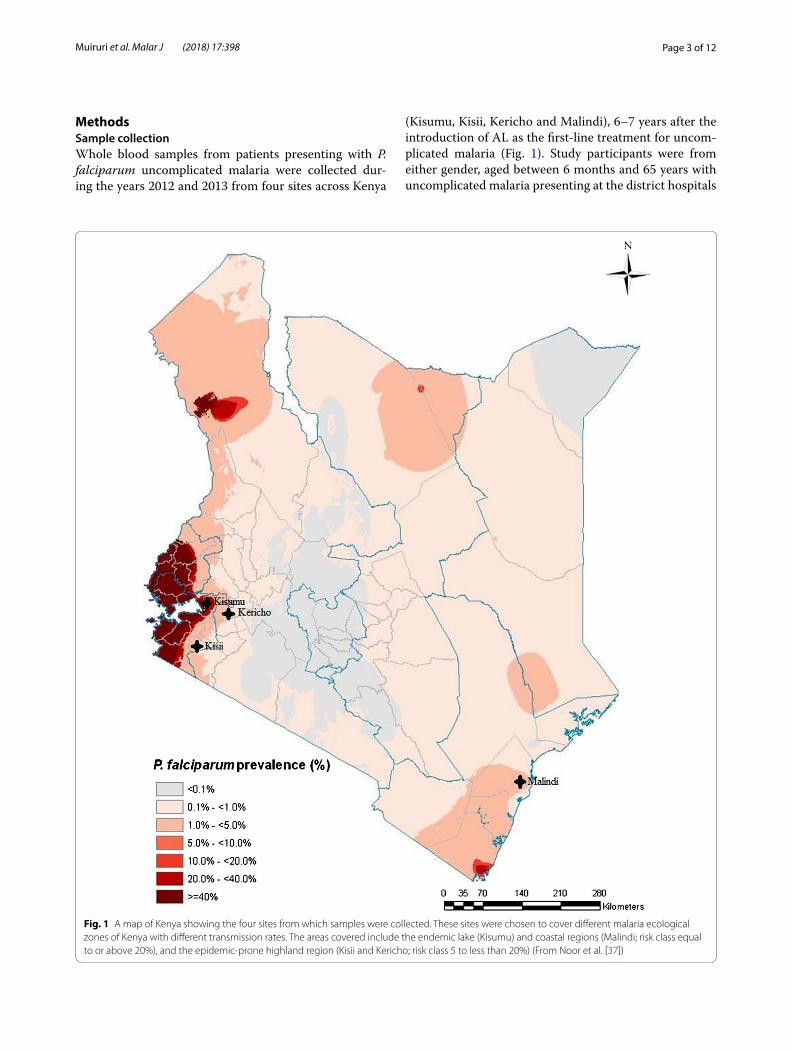
MethodsSample collectionWhole blood samples from patients presenting with P. falciparum uncomplicated malaria were collected dur-ing the years 2012 and 2013 from four sites across Kenya
(Kisumu, Kisii, Kericho and Malindi), 6–7 years after the introduction of AL as the first-line treatment for uncom-plicated malaria (Fig. 1). Study participants were from either gender, aged between 6 months and 65 years with uncomplicated malaria presenting at the district hospitals
Fig. 1 A map of Kenya showing the four sites from which samples were collected. These sites were chosen to cover different malaria ecological zones of Kenya with different transmission rates. The areas covered include the endemic lake (Kisumu) and coastal regions (Malindi; risk class equal to or above 20%), and the epidemic-prone highland region (Kisii and Kericho; risk class 5 to less than 20%) (From Noor et al. [37])
Page 4 of 12Muiruri et al. Malar J (2018) 17:398
in the above named regions. They were not on any anti-malarial treatment when they registered to the study (day 0 samples). Patients with complicated malaria, children below the age of 6 months, adults above 65 years, and those who were under treatment prior to enrollment to the study were excluded.
Plasmodium falciparum DNA extraction and SNP genotypingParasite genomic DNA of 252 day 0 samples was extracted from 200 µL whole blood using QIAamp Blood DNA mini kit (Qiagen, Valencia, CA, USA) according to the manufacturer’s instructions. The extracted DNA was properly stored for the subsequent assays.
The parasite genomic DNA extracted from the sam-ples was genotyped for key codons associated with drug resistance in the pfmdr1 gene at codons 86, 184, and 1246 through direct sequencing. Previously described methods [44] were used for amplification and sequenc-ing of two fragments of the gene (86–184, and 1034–1246). Sequencing was done on a 3500 Genetic Analyzer (Applied Biosystems, Carlsbad, CA, USA) platform.
Typing of microsatellites, allele scoring and assessment of multiple infectionsThe parasite genomic DNA was used as template for amplification of 20 microsatellites loci which included 7 neutral microsatellites located on chromosome 2 and 3; and 13 microsatellites flanking downstream and upstream of the pfmdr1 gene located on chromosome 5. The neutral microsatellites are used to assess natu-ral variation in a genome that might be occurring in a population because they are not linked to the gene under selection [45]. Therefore, the neutral microsatel-lites can be used as a reference for selection in compar-ison with the microsatellites flanking the genes [SNPs] under selection. The He of the neutral microsatellites was compared to the He of the microsatellites flank-ing the pfmdr1 gene to assess any evidence of selection using GenAlEx, as described by Peakall and Smouse in 2012 [46]. The neutral microsatellites were used to assess the clonality of each sample and included 3 loci on chromosome 2, (C2M29/319 kb, C2M34/313 kb, and C2M33/302 kb) and 4 loci on chromosome 3 (C3M40/335 kb, C3M88/363 kb, C3M69/383 kb and C3M39/429 kb) [45] spanning 94 kb. The primers and cycling conditions were adapted from previous studies [38, 47, 48]. The 13 microsatellites loci flanking pfmdr1 gene are on positions − 99, − 54, − 30, − 9.3, − 4.2, − 3.3 and − 1.4 kb upstream and 0.16, 0.45, 3.6, 9.1, 23, and 89 kb downstream on chromosome 5 [45]. The PCR products were separated by electrophoresis on
polyacrylamide gel with Genescan-500 LIZ labelled size standard on the 3500 Genetic Analyzer (Applied Bio-systems, Carlsbad, CA, USA).
Allele scoring for all microsatellites was done using GeneMapper software, version 4.1 (Applied Bio-systems, Foster City, CA, USA). The software auto-matically measures allele lengths and quantifies peak heights. Multiple alleles per locus were scored if elec-trophoretic peaks corresponding to minor alleles were ≥ 33% the predominant allele in the isolate and the peak height is > 200 rfu (fluorescence units) as previ-ously described [49]. Predominant allele was defined as the allele with the highest peak height in the elec-tropherograms. Peaks below 33% of the predominant peak and below 200 rfu were considered as poor qual-ity and/or background noise. Since Kenya is a high transmission region, most of the samples had multiple alleles at any given loci. Parasite haplotypes cannot be determined when 2 or more clones are present and are usually removed from analysis. However, in a previ-ous study, to present a population-based perspective, data from multiply infected parasites was retained for analysis where appropriate [50]. In this study, multiply infected parasites were retained but only the predomi-nant alleles were used for allele frequency calculation and multi-locus microsatellite haplotype construction. According to Anderson et al. this method gives unbi-ased estimation of allele frequencies within a popula-tion assuming the composition of PCR products is representative of the composition of templates [50].
Estimating expected heterozygosity (He) and genetic differentiation (Fst)The genetic variation at each locus was measured as expected heterozygosity (He). The formula for calculating the He is
where n is the number of isolates genotyped and pi is the frequency of the ith allele. This was estimated using GenAlEx v2.2. For the genetic differentiation (Wright’s fixation index, Fst), values at selected loci are expected to be exceptionally low or high compared with loci that are not under the influence of any selection [51]. Subse-quently He and FST were estimated at the 7 neutral micro-satellite loci and the 13 microsatellite loci flanking the pfmdr1 gene to explore evidence of selection occurring at the gene. The He and Fst at all the microsatellite loci were estimated using GenAlEx version 6.501 described by Peakall and Smouse [46].
He = [n/(n− 1)]
[
1−∑
pi2]
Page 5 of 12Muiruri et al. Malar J (2018) 17:398
Constructing multi‑locus microsatellite haplotypes and genetic lineagesThe 8 closest loci (± 9 kb) around pfmdr1 (− 9.3, − 4.2, − 3.3, 1.4, 0.16, 0.45, 3.6 and 9.1 kb) were used for group-ing the isolates or parasites into haplotypes using NET-WORK software version 4.6.1.3. The use of the 8 closest loci around pfmdr1 (as opposed to using all the 13 loci analysed) was important to allow us to compare this data with previously published data [44]. To define the genetic lineages of the resistant alleles in Kenya, we constructed the median-joining networks using NETWORK soft-ware as well. This enabled us to visualize the relationships among different alleles of the gene. Any locus that failed to amplify was assigned a null value (99) for the purposes of analysis.
Statistical analysisThe mean He values were compared by using a Mann–Whitney U statistics and Chi square implemented in the statistical package GraphPad Prism (San Diego, CA, USA). A P value of ≤ 0.05 was considered statistically significant.
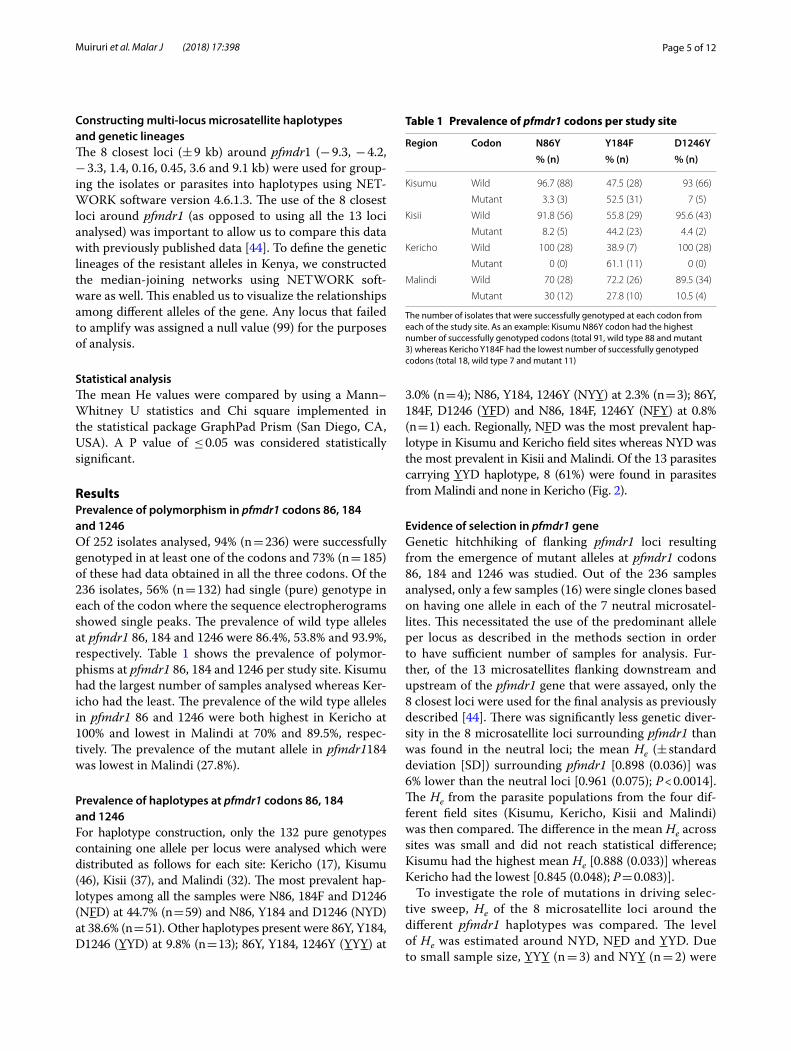
ResultsPrevalence of polymorphism in pfmdr1 codons 86, 184 and 1246Of 252 isolates analysed, 94% (n = 236) were successfully genotyped in at least one of the codons and 73% (n = 185) of these had data obtained in all the three codons. Of the 236 isolates, 56% (n = 132) had single (pure) genotype in each of the codon where the sequence electropherograms showed single peaks. The prevalence of wild type alleles at pfmdr1 86, 184 and 1246 were 86.4%, 53.8% and 93.9%, respectively. Table 1 shows the prevalence of polymor-phisms at pfmdr1 86, 184 and 1246 per study site. Kisumu had the largest number of samples analysed whereas Ker-icho had the least. The prevalence of the wild type alleles in pfmdr1 86 and 1246 were both highest in Kericho at 100% and lowest in Malindi at 70% and 89.5%, respec-tively. The prevalence of the mutant allele in pfmdr1184 was lowest in Malindi (27.8%).
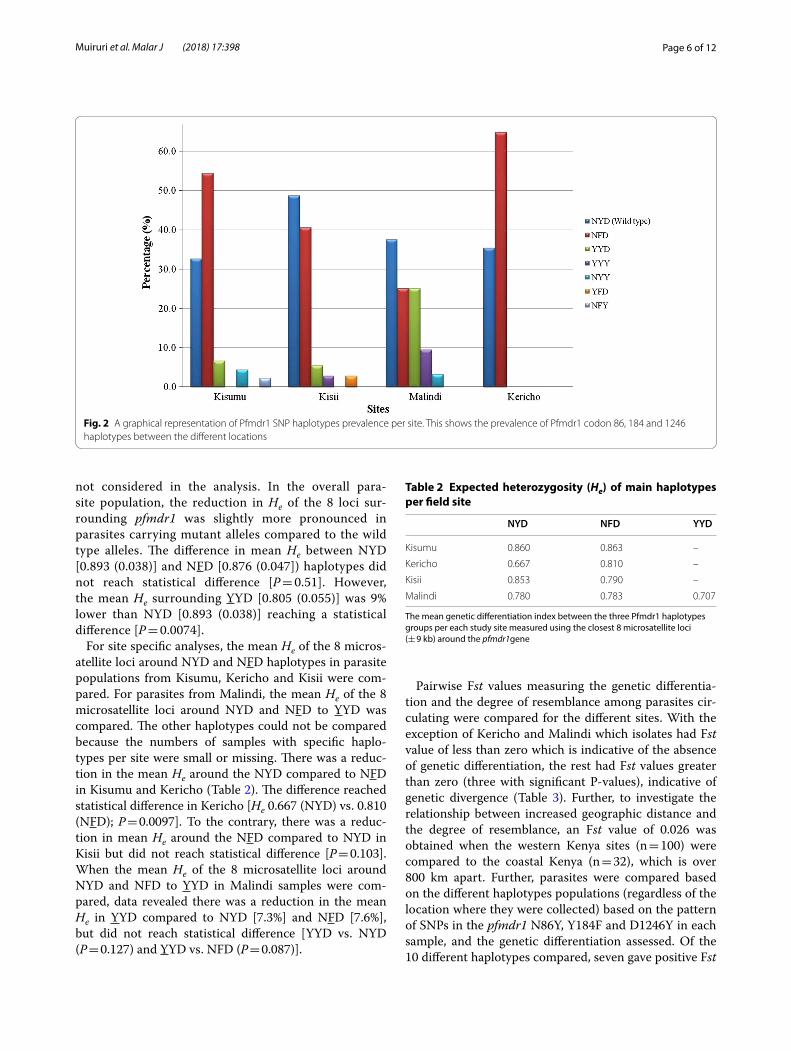
Prevalence of haplotypes at pfmdr1 codons 86, 184 and 1246For haplotype construction, only the 132 pure genotypes containing one allele per locus were analysed which were distributed as follows for each site: Kericho (17), Kisumu (46), Kisii (37), and Malindi (32). The most prevalent hap-lotypes among all the samples were N86, 184F and D1246 (NFD) at 44.7% (n = 59) and N86, Y184 and D1246 (NYD) at 38.6% (n = 51). Other haplotypes present were 86Y, Y184, D1246 (YYD) at 9.8% (n = 13); 86Y, Y184, 1246Y (YYY) at
3.0% (n = 4); N86, Y184, 1246Y (NYY) at 2.3% (n = 3); 86Y, 184F, D1246 (YFD) and N86, 184F, 1246Y (NFY) at 0.8% (n = 1) each. Regionally, NFD was the most prevalent hap-lotype in Kisumu and Kericho field sites whereas NYD was the most prevalent in Kisii and Malindi. Of the 13 parasites carrying YYD haplotype, 8 (61%) were found in parasites from Malindi and none in Kericho (Fig. 2).
Evidence of selection in pfmdr1 geneGenetic hitchhiking of flanking pfmdr1 loci resulting from the emergence of mutant alleles at pfmdr1 codons 86, 184 and 1246 was studied. Out of the 236 samples analysed, only a few samples (16) were single clones based on having one allele in each of the 7 neutral microsatel-lites. This necessitated the use of the predominant allele per locus as described in the methods section in order to have sufficient number of samples for analysis. Fur-ther, of the 13 microsatellites flanking downstream and upstream of the pfmdr1 gene that were assayed, only the 8 closest loci were used for the final analysis as previously described [44]. There was significantly less genetic diver-sity in the 8 microsatellite loci surrounding pfmdr1 than was found in the neutral loci; the mean He (± standard deviation [SD]) surrounding pfmdr1 [0.898 (0.036)] was 6% lower than the neutral loci [0.961 (0.075); P < 0.0014]. The He from the parasite populations from the four dif-ferent field sites (Kisumu, Kericho, Kisii and Malindi) was then compared. The difference in the mean He across sites was small and did not reach statistical difference; Kisumu had the highest mean He [0.888 (0.033)] whereas Kericho had the lowest [0.845 (0.048); P = 0.083)].
To investigate the role of mutations in driving selec-tive sweep, He of the 8 microsatellite loci around the different pfmdr1 haplotypes was compared. The level of He was estimated around NYD, NFD and YYD. Due to small sample size, YYY (n = 3) and NYY (n = 2) were
Table 1 Prevalence of pfmdr1 codons per study site
The number of isolates that were successfully genotyped at each codon from each of the study site. As an example: Kisumu N86Y codon had the highest number of successfully genotyped codons (total 91, wild type 88 and mutant 3) whereas Kericho Y184F had the lowest number of successfully genotyped codons (total 18, wild type 7 and mutant 11)
Region Codon N86Y Y184F D1246Y% (n) % (n) % (n)
Kisumu Wild 96.7 (88) 47.5 (28) 93 (66)
Mutant 3.3 (3) 52.5 (31) 7 (5)
Kisii Wild 91.8 (56) 55.8 (29) 95.6 (43)
Mutant 8.2 (5) 44.2 (23) 4.4 (2)
Kericho Wild 100 (28) 38.9 (7) 100 (28)
Mutant 0 (0) 61.1 (11) 0 (0)
Malindi Wild 70 (28) 72.2 (26) 89.5 (34)
Mutant 30 (12) 27.8 (10) 10.5 (4)
Page 6 of 12Muiruri et al. Malar J (2018) 17:398
not considered in the analysis. In the overall para-site population, the reduction in He of the 8 loci sur-rounding pfmdr1 was slightly more pronounced in parasites carrying mutant alleles compared to the wild type alleles. The difference in mean He between NYD [0.893 (0.038)] and NFD [0.876 (0.047]) haplotypes did not reach statistical difference [P = 0.51]. However, the mean He surrounding YYD [0.805 (0.055)] was 9% lower than NYD [0.893 (0.038)] reaching a statistical difference [P = 0.0074].
For site specific analyses, the mean He of the 8 micros-atellite loci around NYD and NFD haplotypes in parasite populations from Kisumu, Kericho and Kisii were com-pared. For parasites from Malindi, the mean He of the 8 microsatellite loci around NYD and NFD to YYD was compared. The other haplotypes could not be compared because the numbers of samples with specific haplo-types per site were small or missing. There was a reduc-tion in the mean He around the NYD compared to NFD in Kisumu and Kericho (Table 2). The difference reached statistical difference in Kericho [He 0.667 (NYD) vs. 0.810 (NFD); P = 0.0097]. To the contrary, there was a reduc-tion in mean He around the NFD compared to NYD in Kisii but did not reach statistical difference [P = 0.103]. When the mean He of the 8 microsatellite loci around NYD and NFD to YYD in Malindi samples were com-pared, data revealed there was a reduction in the mean He in YYD compared to NYD [7.3%] and NFD [7.6%], but did not reach statistical difference [YYD vs. NYD (P = 0.127) and YYD vs. NFD (P = 0.087)].
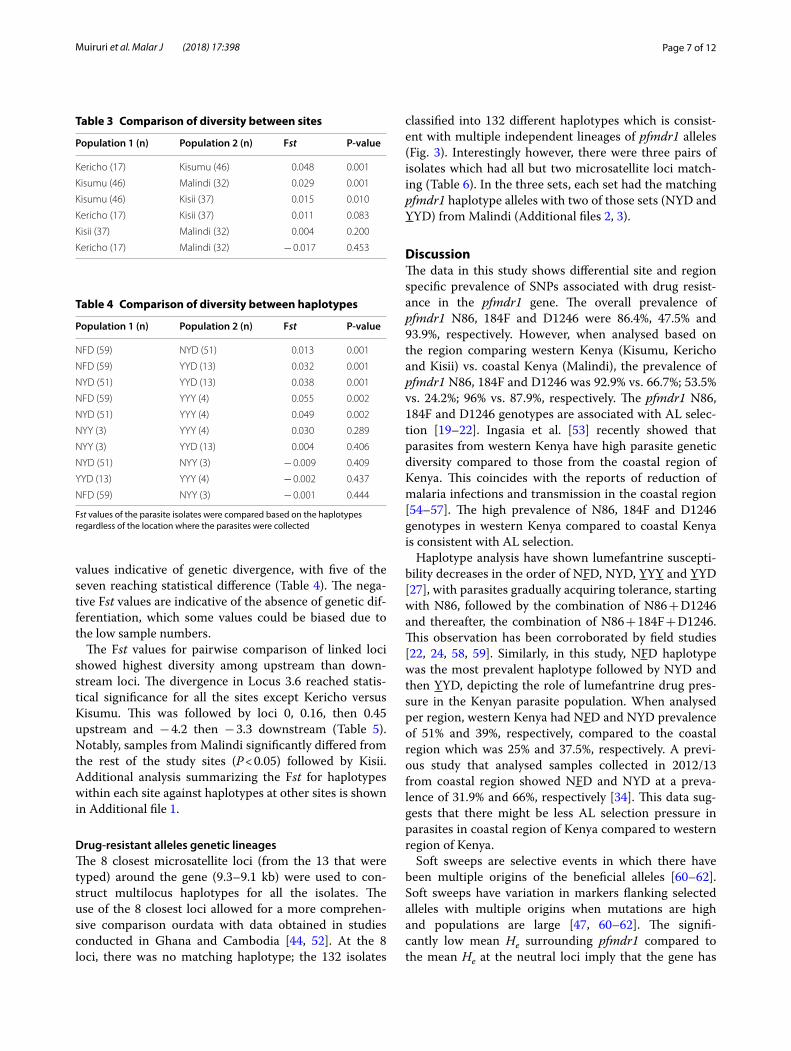
Pairwise Fst values measuring the genetic differentia-tion and the degree of resemblance among parasites cir-culating were compared for the different sites. With the exception of Kericho and Malindi which isolates had Fst value of less than zero which is indicative of the absence of genetic differentiation, the rest had Fst values greater than zero (three with significant P-values), indicative of genetic divergence (Table 3). Further, to investigate the relationship between increased geographic distance and the degree of resemblance, an Fst value of 0.026 was obtained when the western Kenya sites (n = 100) were compared to the coastal Kenya (n = 32), which is over 800 km apart. Further, parasites were compared based on the different haplotypes populations (regardless of the location where they were collected) based on the pattern of SNPs in the pfmdr1 N86Y, Y184F and D1246Y in each sample, and the genetic differentiation assessed. Of the 10 different haplotypes compared, seven gave positive Fst
Fig. 2 A graphical representation of Pfmdr1 SNP haplotypes prevalence per site. This shows the prevalence of Pfmdr1 codon 86, 184 and 1246 haplotypes between the different locations
Table 2 Expected heterozygosity (He) of main haplotypes per field site
The mean genetic differentiation index between the three Pfmdr1 haplotypes groups per each study site measured using the closest 8 microsatellite loci (± 9 kb) around the pfmdr1gene
NYD NFD YYD
Kisumu 0.860 0.863 –
Kericho 0.667 0.810 –
Kisii 0.853 0.790 –
Malindi 0.780 0.783 0.707
Page 7 of 12Muiruri et al. Malar J (2018) 17:398
values indicative of genetic divergence, with five of the seven reaching statistical difference (Table 4). The nega-tive Fst values are indicative of the absence of genetic dif-ferentiation, which some values could be biased due to the low sample numbers.
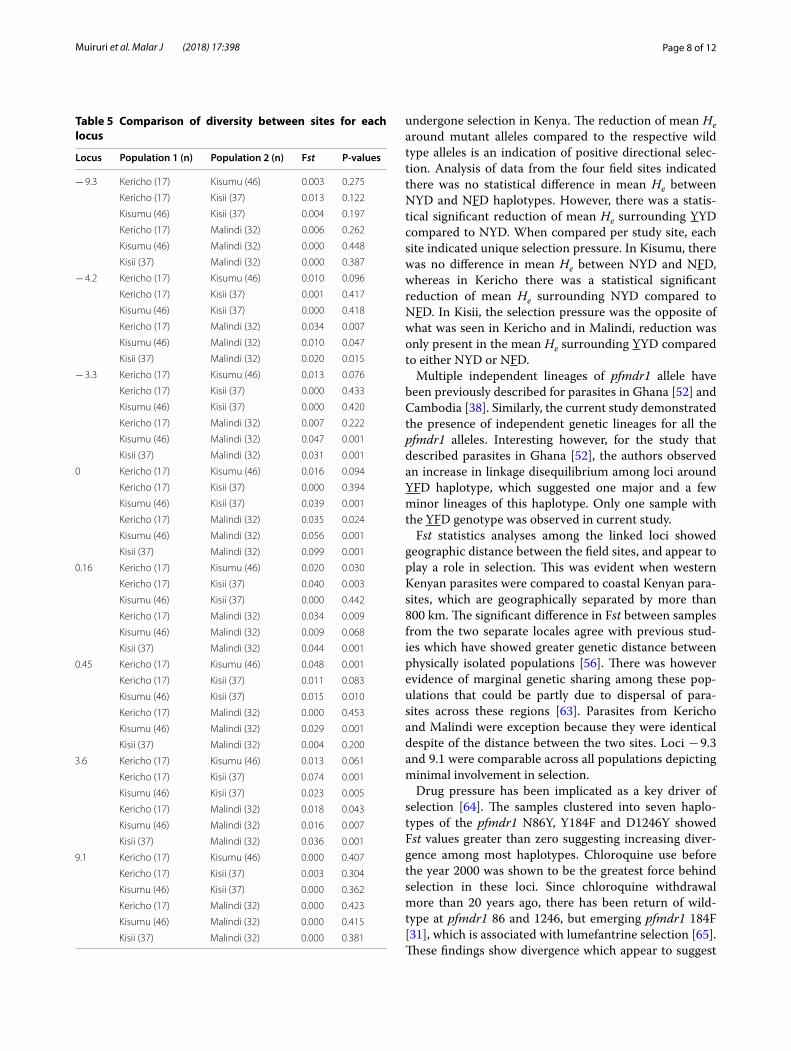
The Fst values for pairwise comparison of linked loci showed highest diversity among upstream than down-stream loci. The divergence in Locus 3.6 reached statis-tical significance for all the sites except Kericho versus Kisumu. This was followed by loci 0, 0.16, then 0.45 upstream and − 4.2 then − 3.3 downstream (Table 5). Notably, samples from Malindi significantly differed from the rest of the study sites (P < 0.05) followed by Kisii. Additional analysis summarizing the Fst for haplotypes within each site against haplotypes at other sites is shown in Additional file 1.
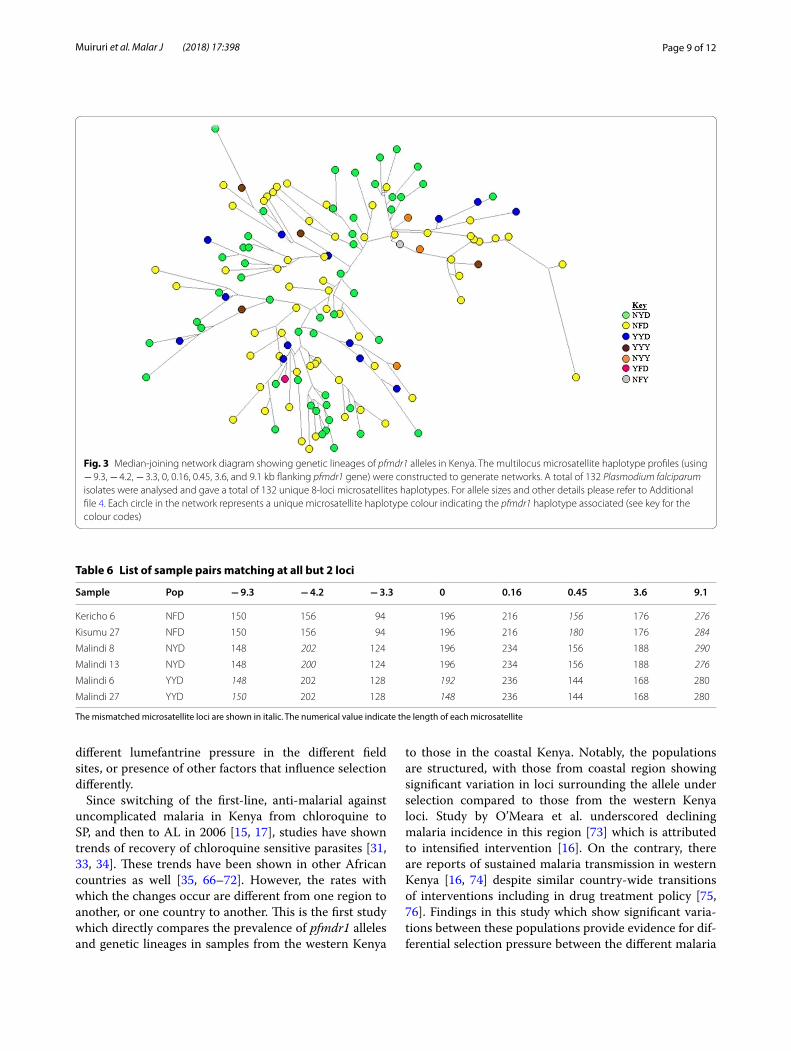
Drug‑resistant alleles genetic lineagesThe 8 closest microsatellite loci (from the 13 that were typed) around the gene (9.3–9.1 kb) were used to con-struct multilocus haplotypes for all the isolates. The use of the 8 closest loci allowed for a more comprehen-sive comparison ourdata with data obtained in studies conducted in Ghana and Cambodia [44, 52]. At the 8 loci, there was no matching haplotype; the 132 isolates
classified into 132 different haplotypes which is consist-ent with multiple independent lineages of pfmdr1 alleles (Fig. 3). Interestingly however, there were three pairs of isolates which had all but two microsatellite loci match-ing (Table 6). In the three sets, each set had the matching pfmdr1 haplotype alleles with two of those sets (NYD and YYD) from Malindi (Additional files 2, 3).
DiscussionThe data in this study shows differential site and region specific prevalence of SNPs associated with drug resist-ance in the pfmdr1 gene. The overall prevalence of pfmdr1 N86, 184F and D1246 were 86.4%, 47.5% and 93.9%, respectively. However, when analysed based on the region comparing western Kenya (Kisumu, Kericho and Kisii) vs. coastal Kenya (Malindi), the prevalence of pfmdr1 N86, 184F and D1246 was 92.9% vs. 66.7%; 53.5% vs. 24.2%; 96% vs. 87.9%, respectively. The pfmdr1 N86, 184F and D1246 genotypes are associated with AL selec-tion [19–22]. Ingasia et al. [53] recently showed that parasites from western Kenya have high parasite genetic diversity compared to those from the coastal region of Kenya. This coincides with the reports of reduction of malaria infections and transmission in the coastal region [54–57]. The high prevalence of N86, 184F and D1246 genotypes in western Kenya compared to coastal Kenya is consistent with AL selection.
Haplotype analysis have shown lumefantrine suscepti-bility decreases in the order of NFD, NYD, YYY and YYD [27], with parasites gradually acquiring tolerance, starting with N86, followed by the combination of N86 + D1246 and thereafter, the combination of N86 + 184F + D1246. This observation has been corroborated by field studies [22, 24, 58, 59]. Similarly, in this study, NFD haplotype was the most prevalent haplotype followed by NYD and then YYD, depicting the role of lumefantrine drug pres-sure in the Kenyan parasite population. When analysed per region, western Kenya had NFD and NYD prevalence of 51% and 39%, respectively, compared to the coastal region which was 25% and 37.5%, respectively. A previ-ous study that analysed samples collected in 2012/13 from coastal region showed NFD and NYD at a preva-lence of 31.9% and 66%, respectively [34]. This data sug-gests that there might be less AL selection pressure in parasites in coastal region of Kenya compared to western region of Kenya.
Soft sweeps are selective events in which there have been multiple origins of the beneficial alleles [60–62]. Soft sweeps have variation in markers flanking selected alleles with multiple origins when mutations are high and populations are large [47, 60–62]. The signifi-cantly low mean He surrounding pfmdr1 compared to the mean He at the neutral loci imply that the gene has
Table 3 Comparison of diversity between sites
Population 1 (n) Population 2 (n) Fst P‑value
Kericho (17) Kisumu (46) 0.048 0.001
Kisumu (46) Malindi (32) 0.029 0.001
Kisumu (46) Kisii (37) 0.015 0.010
Kericho (17) Kisii (37) 0.011 0.083
Kisii (37) Malindi (32) 0.004 0.200
Kericho (17) Malindi (32) − 0.017 0.453
Table 4 Comparison of diversity between haplotypes
Fst values of the parasite isolates were compared based on the haplotypes regardless of the location where the parasites were collected
Population 1 (n) Population 2 (n) Fst P‑value
NFD (59) NYD (51) 0.013 0.001
NFD (59) YYD (13) 0.032 0.001
NYD (51) YYD (13) 0.038 0.001
NFD (59) YYY (4) 0.055 0.002
NYD (51) YYY (4) 0.049 0.002
NYY (3) YYY (4) 0.030 0.289
NYY (3) YYD (13) 0.004 0.406
NYD (51) NYY (3) − 0.009 0.409
YYD (13) YYY (4) − 0.002 0.437
NFD (59) NYY (3) − 0.001 0.444
Page 8 of 12Muiruri et al. Malar J (2018) 17:398
undergone selection in Kenya. The reduction of mean He around mutant alleles compared to the respective wild type alleles is an indication of positive directional selec-tion. Analysis of data from the four field sites indicated there was no statistical difference in mean He between NYD and NFD haplotypes. However, there was a statis-tical significant reduction of mean He surrounding YYD compared to NYD. When compared per study site, each site indicated unique selection pressure. In Kisumu, there was no difference in mean He between NYD and NFD, whereas in Kericho there was a statistical significant reduction of mean He surrounding NYD compared to NFD. In Kisii, the selection pressure was the opposite of what was seen in Kericho and in Malindi, reduction was only present in the mean He surrounding YYD compared to either NYD or NFD.
Multiple independent lineages of pfmdr1 allele have been previously described for parasites in Ghana [52] and Cambodia [38]. Similarly, the current study demonstrated the presence of independent genetic lineages for all the pfmdr1 alleles. Interesting however, for the study that described parasites in Ghana [52], the authors observed an increase in linkage disequilibrium among loci around YFD haplotype, which suggested one major and a few minor lineages of this haplotype. Only one sample with the YFD genotype was observed in current study.
Fst statistics analyses among the linked loci showed geographic distance between the field sites, and appear to play a role in selection. This was evident when western Kenyan parasites were compared to coastal Kenyan para-sites, which are geographically separated by more than 800 km. The significant difference in Fst between samples from the two separate locales agree with previous stud-ies which have showed greater genetic distance between physically isolated populations [56]. There was however evidence of marginal genetic sharing among these pop-ulations that could be partly due to dispersal of para-sites across these regions [63]. Parasites from Kericho and Malindi were exception because they were identical despite of the distance between the two sites. Loci − 9.3 and 9.1 were comparable across all populations depicting minimal involvement in selection.
Drug pressure has been implicated as a key driver of selection [64]. The samples clustered into seven haplo-types of the pfmdr1 N86Y, Y184F and D1246Y showed Fst values greater than zero suggesting increasing diver-gence among most haplotypes. Chloroquine use before the year 2000 was shown to be the greatest force behind selection in these loci. Since chloroquine withdrawal more than 20 years ago, there has been return of wild-type at pfmdr1 86 and 1246, but emerging pfmdr1 184F [31], which is associated with lumefantrine selection [65]. These findings show divergence which appear to suggest
Table 5 Comparison of diversity between sites for each locus
Locus Population 1 (n) Population 2 (n) Fst P‑values
− 9.3 Kericho (17) Kisumu (46) 0.003 0.275
Kericho (17) Kisii (37) 0.013 0.122
Kisumu (46) Kisii (37) 0.004 0.197
Kericho (17) Malindi (32) 0.006 0.262
Kisumu (46) Malindi (32) 0.000 0.448
Kisii (37) Malindi (32) 0.000 0.387
− 4.2 Kericho (17) Kisumu (46) 0.010 0.096
Kericho (17) Kisii (37) 0.001 0.417
Kisumu (46) Kisii (37) 0.000 0.418
Kericho (17) Malindi (32) 0.034 0.007
Kisumu (46) Malindi (32) 0.010 0.047
Kisii (37) Malindi (32) 0.020 0.015
− 3.3 Kericho (17) Kisumu (46) 0.013 0.076
Kericho (17) Kisii (37) 0.000 0.433
Kisumu (46) Kisii (37) 0.000 0.420
Kericho (17) Malindi (32) 0.007 0.222
Kisumu (46) Malindi (32) 0.047 0.001
Kisii (37) Malindi (32) 0.031 0.001
0 Kericho (17) Kisumu (46) 0.016 0.094
Kericho (17) Kisii (37) 0.000 0.394
Kisumu (46) Kisii (37) 0.039 0.001
Kericho (17) Malindi (32) 0.035 0.024
Kisumu (46) Malindi (32) 0.056 0.001
Kisii (37) Malindi (32) 0.099 0.001
0.16 Kericho (17) Kisumu (46) 0.020 0.030
Kericho (17) Kisii (37) 0.040 0.003
Kisumu (46) Kisii (37) 0.000 0.442
Kericho (17) Malindi (32) 0.034 0.009
Kisumu (46) Malindi (32) 0.009 0.068
Kisii (37) Malindi (32) 0.044 0.001
0.45 Kericho (17) Kisumu (46) 0.048 0.001
Kericho (17) Kisii (37) 0.011 0.083
Kisumu (46) Kisii (37) 0.015 0.010
Kericho (17) Malindi (32) 0.000 0.453
Kisumu (46) Malindi (32) 0.029 0.001
Kisii (37) Malindi (32) 0.004 0.200
3.6 Kericho (17) Kisumu (46) 0.013 0.061
Kericho (17) Kisii (37) 0.074 0.001
Kisumu (46) Kisii (37) 0.023 0.005
Kericho (17) Malindi (32) 0.018 0.043
Kisumu (46) Malindi (32) 0.016 0.007
Kisii (37) Malindi (32) 0.036 0.001
9.1 Kericho (17) Kisumu (46) 0.000 0.407
Kericho (17) Kisii (37) 0.003 0.304
Kisumu (46) Kisii (37) 0.000 0.362
Kericho (17) Malindi (32) 0.000 0.423
Kisumu (46) Malindi (32) 0.000 0.415
Kisii (37) Malindi (32) 0.000 0.381
Page 9 of 12Muiruri et al. Malar J (2018) 17:398
different lumefantrine pressure in the different field sites, or presence of other factors that influence selection differently.
Since switching of the first-line, anti-malarial against uncomplicated malaria in Kenya from chloroquine to SP, and then to AL in 2006 [15, 17], studies have shown trends of recovery of chloroquine sensitive parasites [31, 33, 34]. These trends have been shown in other African countries as well [35, 66–72]. However, the rates with which the changes occur are different from one region to another, or one country to another. This is the first study which directly compares the prevalence of pfmdr1 alleles and genetic lineages in samples from the western Kenya
to those in the coastal Kenya. Notably, the populations are structured, with those from coastal region showing significant variation in loci surrounding the allele under selection compared to those from the western Kenya loci. Study by O’Meara et al. underscored declining malaria incidence in this region [73] which is attributed to intensified intervention [16]. On the contrary, there are reports of sustained malaria transmission in western Kenya [16, 74] despite similar country-wide transitions of interventions including in drug treatment policy [75, 76]. Findings in this study which show significant varia-tions between these populations provide evidence for dif-ferential selection pressure between the different malaria
Fig. 3 Median-joining network diagram showing genetic lineages of pfmdr1 alleles in Kenya. The multilocus microsatellite haplotype profiles (using − 9.3, − 4.2, − 3.3, 0, 0.16, 0.45, 3.6, and 9.1 kb flanking pfmdr1 gene) were constructed to generate networks. A total of 132 Plasmodium falciparum isolates were analysed and gave a total of 132 unique 8-loci microsatellites haplotypes. For allele sizes and other details please refer to Additional file 4. Each circle in the network represents a unique microsatellite haplotype colour indicating the pfmdr1 haplotype associated (see key for the colour codes)
Table 6 List of sample pairs matching at all but 2 loci
The mismatched microsatellite loci are shown in italic. The numerical value indicate the length of each microsatellite
Sample Pop − 9.3 − 4.2 − 3.3 0 0.16 0.45 3.6 9.1
Kericho 6 NFD 150 156 94 196 216 156 176 276
Kisumu 27 NFD 150 156 94 196 216 180 176 284
Malindi 8 NYD 148 202 124 196 234 156 188 290
Malindi 13 NYD 148 200 124 196 234 156 188 276
Malindi 6 YYD 148 202 128 192 236 144 168 280
Malindi 27 YYD 150 202 128 148 236 144 168 280
Page 10 of 12Muiruri et al. Malar J (2018) 17:398
transmission regions of Kenya, especially the western region of Kenya compared to the coastal region. Indeed, a recent study showed western Kenya parasites have high genetic diversity compared to those in coastal Kenya [53]. The difference in selection pressure can be attributed to disease prevalence, genetic diversity of the parasite popu-lation, anti-malarial drug usage and cultural behaviour of the different patient populations alongside environmen-tal factors that modulate vector density [77]. Adherence to anti-malarial drug treatment is a challenge as evident by a recent case report of attenuated-responsiveness to AL treatment in western Kenya [78].
ConclusionsThe study shows different prevalence of pfmdr1 alleles in different regions of Kenya, especially western Kenya com-pared to coastal Kenya. Further, evidence of soft sweeps in pfmdr1 has been shown, but the direction of the selec-tion for the pfmdr1 haplotypes is different from one region to another, which can be explained by factors such as difference in parasite genetic diversity, drug pressure and much more. This finding poses further challenges for malaria control programmes in malaria endemic coun-tries because transmission rates might change differ-ently in the same country, which might require different malaria control strategies. It would be worthwhile to use this type of data as an additional molecular surveillance tool for guiding decisions for effective malaria control policies based on the region and not at a country wide level.
Additional files
Additional file 1.The additional material table with microsatellites data of 8 closest loci flanking the Pfmdr1 gene, and the corresponding SNP haplotypes data for the samples from the four different sites.
Additional file 2. The expected heterozygosity (He) at microsatellite loci flanking Pfmdr1 alleles. The dashed line crossing the y-axis indicates the mean He at 7 neutral microsatellite loci on chromosome 2 and 3. The other lines indicate other Pfmdr1 alleles NFD (n = 59), NYD (n = 51), YYD (n = 13), YYY (n = 4), and NYY (n = 3).
Additional file 3. The expected heterozygosity (He) at microsatellite loci flanking Pfmdr1 alleles. The dashed line crossing the y-axis indicates the mean He at 7 neutral microsatellite loci on chromosome 2 and 3. The other lines indicate other Pfmdr1 alleles NFD (n = 59), NYD (n = 51), and YYD (n = 13).
Additional file 4. Represents diversity (Fst) of haplotypes across all sites.
Authors’ contributionsEK, BA and HA designed the study protocol, PM and DJ performed laboratory assays, LI, LC, BO, BN, JC did data analysis and interpretation. PM, DJ and EK drafted the manuscript. PM, DJ, BA, HA, VS, JN and EK reviewed, re-wrote the final manuscript draft. All authors read and approved the final manuscript.
Author details1 Global Emerging Infections Surveillance Program, United States Army Medi-cal Research Directorate-Africa, Kenya Medical Research Institute, P.O. Box 54, 40100 Kisumu, Kenya. 2 Department of Biochemistry, School of Biomedi-cal Sciences, Jomo Kenyatta University of Agriculture and Technology, P.O. Box 62000, 00200 Nairobi, Kenya. 3 Walter Reed National Military Medical Center, Bethesda, Maryland, USA.
AcknowledgementsWe would like to thank all the patients, clinical and other support staff at the study sites. We would like to thank all the colleagues in the Malaria Drug Resistance laboratory for their technical and moral support. We would also thank the Director of KEMRI for permission to publish this work. The opinions and assertions contained herein are private opinions of the authors and are not to be construed as reflecting the views of the U.S. Army Medical Research Directorate-Kenya, the U.S. Department of the Army, the U.S. Department of Defense or the U.S. Government. The investigators have adhered to the poli-cies for protection of human subjects as prescribed in AR-70.
Competing interestsThe authors declare that they have no competing interests.
Availability of data and materialsAll data generated or analysed during this study are included in this published article [and its additional information files].
Consent for publicationNot Applicable. No individual personal data was used in the study. All authors have provided consent to publish the findings in this study.
Ethics approval and consent to participateWritten informed consent was provided by participants and/or their legal guardians. The study was carried out in accordance to approved guidelines by the Ethical Review Committee of the Kenya Medical Research Institute (KEMRI), Nairobi, Kenya and Walter Reed Army Institute of Research (WRAIR) Institutional Review Board, Silver Spring, MD. The study was conducted under the approved study protocols KEMRI-SCC 1330/WRAIR 1384.
FundingThis work was supported by the Armed Forces Health Surveillance Center, Division of Global Emerging Infections Surveillance and Response System Operations. The funding body did not participate in the design of the study, collection, analysis, interpretation of data or in writing the manuscript.
Publisher’s NoteSpringer Nature remains neutral with regard to jurisdictional claims in pub-lished maps and institutional affiliations.
Received: 22 March 2018 Accepted: 20 October 2018
References 1. Noedl H, Se Y, Schaecher K, Smith BL, Socheat D, Fukuda MM, et al.
Evidence of artemisinin-resistant malaria in western Cambodia. N Engl J Med. 2008;359:2619–20.
2. Dondorp AM, Nosten F, Yi P, Das D, Phyo AP, Tarning J, et al. Arte-misinin resistance in Plasmodium falciparum malaria. N Engl J Med. 2009;361:455–67.
3. WHO. World malaria report 2009. Geneva: World Health Organization; 2009.
4. WHO. World malaria report 2014. Geneva: World Health Organization; 2015.
5. Ashley EA, Dhorda M, Fairhurst RM, Amaratunga C, Lim P, Suon S, et al. Spread of artemisinin resistance in Plasmodium falciparum malaria. N Engl J Med. 2014;371:411–23.
6. Zwang J, Dorsey G, Martensson A, d’Alessandro U, Ndiaye JL, Karema C, et al. Plasmodium falciparum clearance in clinical studies of
Page 11 of 12Muiruri et al. Malar J (2018) 17:398
artesunate-amodiaquine and comparator treatments in sub-Saharan Africa, 1999–2009. Malar J. 2014;13:114.
7. Ariey F, Fandeur T, Durand R, Randrianarivelojosia M, Jambou R, Legrand E, et al. Invasion of Africa by a single pfcrt allele of South East Asian type. Malar J. 2006;5:34.
8. Maiga O, Djimde AA, Hubert V, Renard E, Aubouy A, Kironde F, et al. A shared Asian origin of the triple-mutant dhfr allele in Plasmodium falcipa-rum from sites across Africa. J Infect Dis. 2007;196:165–72.
9. Plowe CV. The evolution of drug-resistant malaria. Trans R Soc Trop Med Hyg. 2009;103(Suppl 1):S11–4.
10. WHO. Global plan for artemisinin resistance containment (GPARC). Geneva: World Health Organization; 2011.
11. Phyo AP, Nkhoma S, Stepniewska K, Ashley EA, Nair S, McGready R, et al. Emergence of artemisinin-resistant malaria on the western border of Thailand: a longitudinal study. Lancet. 2012;379:1960–6.
12. Cheeseman IH, Miller BA, Nair S, Nkhoma S, Tan A, Tan JC, et al. A major genome region underlying artemisinin resistance in malaria. Science. 2012;336:79–82.
13. Woodrow CJ, White NJ. The clinical impact of artemisinin resistance in Southeast Asia and the potential for future spread. FEMS Microbiol Rev. 2017;41:34–48.
14. WHO. World malaria report 2013. Geneva: World Health Organization; 2013.
15. Shretta R, Omumbo J, Rapuoda B, Snow RW. Using evidence to change antimalarial drug policy in Kenya. Trop Med Int Health. 2000;5:755–64.
16. Okiro EA, Alegana VA, Noor AM, Snow RW. Changing malaria intervention coverage, transmission and hospitalization in Kenya. Malar J. 2010;9:285.
17. Amin AA, Hughes DA, Marsh V, Abuya TO, Kokwaro GO, Winstanley PA, et al. The difference between effectiveness and efficacy of antimalarial drugs in Kenya. Trop Med Int Health. 2004;9:967–74.
18. Ogutu BR, Onyango KO, Koskei N, Omondi EK, Ongecha JM, Otieno GA, et al. Efficacy and safety of artemether–lumefantrine and dihydroarte-misinin–piperaquine in the treatment of uncomplicated Plasmodium falciparum malaria in Kenyan children aged less than five years: results of an open-label, randomized, single-centre study. Malar J. 2014;13:33.
19. Sisowath C, Stromberg J, Mårtensson A, Msellem M, Obondo C, Bjork-man A, et al. In vivo selection of Plasmodium falciparum pfmdr1 86N coding alleles by artemether–lumefantrine (Coartem). J Infect Dis. 2005;191:1014–7.
20. Sisowath C, Ferreira PE, Bustamante LY, Dahlstrom S, Mårtensson A, Bjork-man A, et al. The role of pfmdr1 in Plasmodium falciparum tolerance to artemether–lumefantrine in Africa. Trop Med Int Health. 2007;12:736–42.
21. Sisowath C, Petersen I, Veiga MI, Mårtensson A, Premji Z, Bjorkman A, et al. In vivo selection of Plasmodium falciparum parasites carrying the chloroquine-susceptible pfcrt K76 allele after treatment with artemether–lumefantrine in Africa. J Infect Dis. 2009;199:750–7.
22. Humphreys GS, Merinopoulos I, Ahmed J, Whitty CJ, Mutabingwa TK, Sutherland CJ, et al. Amodiaquine and artemether–lumefantrine select distinct alleles of the Plasmodium falciparum mdr1 gene in Tanzanian chil-dren treated for uncomplicated malaria. Antimicrob Agents Chemother. 2007;51:991–7.
23. Henriques G, Hallett RL, Beshir KB, Gadalla NB, Johnson RE, Burrow R, et al. Directional selection at the pfmdr1, pfcrt, pfubp1, and pfap2mu loci of Plasmodium falciparum in Kenyan children treated with ACT. J Infect Dis. 2014;210:2001–8.
24. Baliraine FN, Rosenthal PJ. Prolonged selection of pfmdr1 polymorphisms after treatment of falciparum malaria with artemether–lumefantrine in Uganda. J Infect Dis. 2011;204:1120–4.
25. Gadalla NB, Adam I, Elzaki SE, Bashir S, Mukhtar I, Oguike M, et al. Increased pfmdr1 copy number and sequence polymorphisms in Plasmodium falciparum isolates from Sudanese malaria patients treated with artemether–lumefantrine. Antimicrob Agents Chemother. 2011;55:5408–11.
26. Lim P, Alker AP, Khim N, Shah NK, Incardona S, Doung S, et al. Pfmdr1 copy number and arteminisin derivatives combination therapy failure in falciparum malaria in Cambodia. Malar J. 2009;8:11.
27. Malmberg M, Ferreira PE, Tarning J, Ursing J, Ngasala B, Bjorkman A, et al. Plasmodium falciparum drug resistance phenotype as assessed by patient antimalarial drug levels and its association with pfmdr1 polymorphisms. J Infect Dis. 2013;207:842–7.
28. Djimde A, Doumbo OK, Cortese JF, Kayentao K, Doumbo S, Diourte Y, et al. A molecular marker for chloroquine-resistant falciparum malaria. N Engl J Med. 2001;344:257–63.
29. Reed MB, Saliba KJ, Caruana SR, Kirk K, Cowman AF. Pgh1 modulates sen-sitivity and resistance to multiple antimalarials in Plasmodium falciparum. Nature. 2000;403:906–9.
30. Venkatesan M, Gadalla NB, Stepniewska K, Dahal P, Nsanzabana C, Moriera C, et al. Polymorphisms in Plasmodium falciparum chloroquine resistance transporter and multidrug resistance 1 genes: parasite risk factors that affect treatment outcomes for P. falciparum malaria after artemether–lumefantrine and artesunate-amodiaquine. Am J Trop Med Hyg. 2014;91:833–43.
31. Achieng AO, Muiruri P, Ingasia LA, Opot BH, Juma DW, Yeda R, et al. Tem-poral trends in prevalence of Plasmodium falciparum molecular markers selected for by artemether–lumefantrine treatment in pre-ACT and post-ACT parasites in western Kenya. Int J Parasitol Drugs Drug Resist. 2015;5:92–9.
32. Mang’era CM, Mbai FN, Omedo IA, Mireji PO, Omar SA. Changes in genotypes of Plasmodium falciparum human malaria parasite following withdrawal of chloroquine in Tiwi, Kenya. Acta Trop. 2012;123:202–7.
33. Mwai L, Ochong E, Abdirahman A, Kiara SM, Ward S, Kokwaro G, et al. Chloroquine resistance before and after its withdrawal in Kenya. Malar J. 2009;8:106.
34. Okombo J, Kamau AW, Marsh K, Sutherland CJ, Ochola-Oyier LI. Temporal trends in prevalence of Plasmodium falciparum drug resistance alleles over two decades of changing antimalarial policy in coastal Kenya. Int J Parasitol Drugs Drug Resist. 2014;4:152–63.
35. Malmberg M, Ngasala B, Ferreira PE, Larsson E, Jovel I, Hjalmarsson A, et al. Temporal trends of molecular markers associated with artemether–lumefantrine tolerance/resistance in Bagamoyo district, Tanzania. Malar J. 2013;12:103.
36. Wanjala CL, Waitumbi J, Zhou G, Githeko AK. Identification of malaria transmission and epidemic hotspots in the western Kenya highlands: its application to malaria epidemic prediction. Parasit Vectors. 2011;4:81.
37. Noor AM, Gething PW, Alegana VA, Patil AP, Hay SI, Muchiri E, et al. The risks of malaria infection in Kenya in 2009. BMC Infect Dis. 2009;9:180.
38. Vinayak S, Alam MT, Mixson-Hayden T, McCollum AM, Sem R, Shah NK, et al. Origin and evolution of sulfadoxine resistant Plasmodium falciparum. PLoS Pathog. 2010;6:e1000830.
39. Smith JM, Haigh J. The hitch-hiking effect of a favourable gene. Genet Res. 2007;89:391–403.
40. Anderson TJ, Roper C. The origins and spread of antimalarial drug resist-ance: lessons for policy makers. Acta Trop. 2005;94:269–80.
41. Roper C, Pearce R, Nair S, Sharp B, Nosten F, Anderson T. Intercontinental spread of pyrimethamine-resistant malaria. Science. 2004;305:1124.
42. Wootton JC, Feng X, Ferdig MT, Cooper RA, Mu J, Baruch DI, et al. Genetic diversity and chloroquine selective sweeps in Plasmodium falciparum. Nature. 2002;418:320–3.
43. Mita T, Tanabe K, Takahashi N, Tsukahara T, Eto H, Dysoley L, et al. Independent evolution of pyrimethamine resistance in Plasmodium falciparum isolates in Melanesia. Antimicrob Agents Chemother. 2007;51:1071–7.
44. Vinayak S, Alam MT, Sem R, Shah NK, Susanti AI, Lim P, et al. Multiple genetic backgrounds of the amplified Plasmodium falciparum multidrug resistance (pfmdr1) gene and selective sweep of 184F mutation in Cam-bodia. J Infect Dis. 2010;201:1551–60.
45. Su X, Ferdig MT, Huang Y, Huynh CQ, Liu A, You J, et al. A genetic map and recombination parameters of the human malaria parasite Plasmodium falciparum. Science. 1999;286:1351–3.
46. Peakall R, Smouse PE. GenAlEx 6.5: genetic analysis in Excel. Population genetic software for teaching and research—an update. Bioinformatics. 2012;28:2537–9.
47. Nair S, Nash D, Sudimack D, Jaidee A, Barends M, Uhlemann AC, et al. Recurrent gene amplification and soft selective sweeps during evolution of multidrug resistance in malaria parasites. Mol Biol Evol. 2007;24:562–73.
48. Nduati E, Hunt S, Kamau EM, Nzila A. 2,4-diaminopteridine-based com-pounds as precursors for de novo synthesis of antifolates: a novel class of antimalarials. Antimicrob Agents Chemother. 2005;49:3652–7.
49. McCollum AM, Schneider KA, Griffing SM, Zhou Z, Kariuki S, Ter-Kuile F, et al. Differences in selective pressure on dhps and dhfr drug resistant mutations in western Kenya. Malar J. 2012;11:77.
Page 12 of 12Muiruri et al. Malar J (2018) 17:398
• fast, convenient online submission
•
thorough peer review by experienced researchers in your field
• rapid publication on acceptance
• support for research data, including large and complex data types
•
gold Open Access which fosters wider collaboration and increased citations
maximum visibility for your research: over 100M website views per year •
At BMC, research is always in progress.
Learn more biomedcentral.com/submissions
Ready to submit your research ? Choose BMC and benefit from:
50. Anderson TJ, Haubold B, Williams JT, Estrada-Franco JG, Richardson L, Mollinedo R, et al. Microsatellite markers reveal a spectrum of population structures in the malaria parasite Plasmodium falciparum. Mol Biol Evol. 2000;17:1467–82.
51. Lewontin RC, Krakauer J. Distribution of gene frequency as a test of the theory of the selective neutrality of polymorphisms. Genetics. 1973;74:175–95.
52. Alam MT, de Souza DK, Vinayak S, Griffing SM, Poe AC, Duah NO, et al. Selective sweeps and genetic lineages of Plasmodium falciparum drug-resistant alleles in Ghana. J Infect Dis. 2011;203:220–7.
53. Ingasia LA, Cheruiyot J, Okoth SA, Andagalu B, Kamau E. Genetic vari-ability and population structure of Plasmodium falciparum parasite populations from different malaria ecological regions of Kenya. Infect Genet Evol. 2016;39:372–80.
54. Kalayjian BC, Malhotra I, Mungai P, Holding P, King CL. Marked decline in malaria prevalence among pregnant women and their offspring from 1996 to 2010 on the south Kenyan Coast. Am J Trop Med Hyg. 2013;89:1129–34.
55. Okiro EA, Hay SI, Gikandi PW, Sharif SK, Noor AM, Peshu N, et al. The decline in paediatric malaria admissions on the coast of Kenya. Malar J. 2007;6:151.
56. Okiro EA, Alegana VA, Noor AM, Mutheu JJ, Juma E, Snow RW. Malaria paediatric hospitalization between 1999 and 2008 across Kenya. BMC Med. 2009;7:75.
57. O’Meara WP, Bejon P, Mwangi TW, Okiro EA, Peshu N, Snow RW, et al. Effect of a fall in malaria transmission on morbidity and mortality in Kilifi, Kenya. Lancet. 2008;372:1555–62.
58. Dokomajilar C, Nsobya SL, Greenhouse B, Rosenthal PJ, Dorsey G. Selec-tion of Plasmodium falciparum pfmdr1 alleles following therapy with artemether–lumefantrine in an area of Uganda where malaria is highly endemic. Antimicrob Agents Chemother. 2006;50:1893–5.
59. Happi CT, Gbotosho GO, Folarin OA, Sowunmi A, Hudson T, O’Neil M, et al. Selection of Plasmodium falciparum multidrug resistance gene 1 alleles in asexual stages and gametocytes by artemether–lumefantrine in Nigerian children with uncomplicated falciparum malaria. Antimicrob Agents Chemother. 2009;53:888–95.
60. Hermisson J, Pennings PS. Soft sweeps. Genetics. 2005;169:2335–52. 61. Pennings PS, Hermisson J. Soft sweeps II—molecular population genet-
ics of adaptation from recurrent mutation or migration. Mol Biol Evol. 2006;23:1076–84.
62. Pennings PS, Hermisson J. Soft sweeps III: the signature of positive selec-tion from recurrent mutation. PLoS Genet. 2006;2:e186.
63. Kaufmann C, Briegel H. Flight performance of the malaria vectors Anoph-eles gambiae and Anopheles atroparvus. J Vector Ecol. 2004;29:140–53.
64. Nsanzabana C, Hastings IM, Marfurt J, Muller I, Baea K, Rare L, et al. Quan-tifying the evolution and impact of antimalarial drug resistance: drug use, spread of resistance, and drug failure over a 12-year period in Papua New Guinea. J Infect Dis. 2010;201:435–43.
65. Otienoburu SD, Maiga-Ascofare O, Schramm B, Jullien V, Jones JJ, Zolia YM, et al. Selection of Plasmodium falciparum pfcrt and pfmdr1 poly-morphisms after treatment with artesunate-amodiaquine fixed dose combination or artemether–lumefantrine in Liberia. Malar J. 2016;15:452.
66. Kublin JG, Cortese JF, Njunju EM, Mukadam RA, Wirima JJ, Kazembe PN, et al. Reemergence of chloroquine-sensitive Plasmodium falcipa-rum malaria after cessation of chloroquine use in Malawi. J Infect Dis. 2003;187:1870–5.
67. Mbogo GW, Nankoberanyi S, Tukwasibwe S, Baliraine FN, Nsobya SL, Conrad MD, et al. Temporal changes in prevalence of molecular markers mediating antimalarial drug resistance in a high malaria transmission setting in Uganda. Am J Trop Med Hyg. 2014;91:54–61.
68. Raman J, Mauff K, Muianga P, Mussa A, Maharaj R, Barnes KI. Five years of antimalarial resistance marker surveillance in Gaza Province, Mozam-bique, following artemisinin-based combination therapy roll out. PLoS ONE. 2011;6:e25992.
69. Froberg G, Jornhagen L, Morris U, Shakely D, Msellem MI, Gil JP, et al. Decreased prevalence of Plasmodium falciparum resistance markers to amodiaquine despite its wide scale use as ACT partner drug in Zanzibar. Malar J. 2012;11:321.
70. Thomsen TT, Madsen LB, Hansson HH, Tomas EV, Charlwood D, Bygbjerg IC, et al. Rapid selection of Plasmodium falciparum chloroquine resist-ance transporter gene and multidrug resistance gene-1 haplotypes associated with past chloroquine and present artemether–lumefantrine use in Inhambane District, southern Mozambique. Am J Trop Med Hyg. 2013;88:536–41.
71. Ly O, Gueye PE, Deme AB, Dieng T, Badiane AS, Ahouidi AD, et al. Evolution of the pfcrt T76 and pfmdr1 Y86 markers and chloroquine susceptibility 8 years after cessation of chloroquine use in Pikine, Senegal. Parasitol Res. 2012;111:1541–6.
72. Nwakanma DC, Duffy CW, Amambua-Ngwa A, Oriero EC, Bojang KA, Pinder M, et al. Changes in malaria parasite drug resistance in an endemic population over a 25-year period with resulting genomic evidence of selection. J Infect Dis. 2014;209:1126–35.
73. O’Meara WP, Mwangi TW, Williams TN, McKenzie FE, Snow RW, Marsh K. Relationship between exposure, clinical malaria, and age in an area of changing transmission intensity. Am J Trop Med Hyg. 2008;79:185–91.
74. Kapesa A, Kweka EJ, Atieli H, Kamugisha E, Zhou G, Githeko AK, et al. Why some sites are responding better to anti-malarial interventions? A case study from western Kenya. Malar J. 2017;16:498.
75. Amin AA, Zurovac D, Kangwana BB, Greenfield J, Otieno DN, Akhwale WS, et al. The challenges of changing national malaria drug policy to artemisinin-based combinations in Kenya. Malar J. 2007;6:72.
76. Borrmann S, Sasi P, Mwai L, Bashraheil M, Abdallah A, Muriithi S, et al. Declining responsiveness of Plasmodium falciparum infections to artemisinin-based combination treatments on the Kenyan coast. PLoS ONE. 2011;6:e26005.
77. Goncalves BP, Kapulu MC, Sawa P, Guelbeogo WM, Tiono AB, Grignard L, et al. Examining the human infectious reservoir for Plasmodium falci-parum malaria in areas of differing transmission intensity. Nat Commun. 2017;8:1133.
78. Kamau E, Akala HM, Achieng AO, Yeda R, Ingasia LA, Cheruiyot AC, et al. Case report of attenuated-responsiveness to Coartem® in Western Kenya. Int J Med Pharmac Case Rep. 2014;2:1.
Recommended


