
int j remote sensing 2001 vol 22 no 17 3503ndash3520
Sensitivity of vegetation indices to substrate brightness in hyper-aridenvironment the Makhtesh Ramon Crater (Israel ) case study
H SCHMIDT and A KARNIELIdagger
Remote Sensing Laboratory J Blaustein Institute for Desert ResearchBen-Gurion University of the Negev Sede Boker Campus 84990 Israel
(Received 13 November 1998 in nal form 25 May 2000)
Abstract The in uence of soil background on most vegetation indices (VIs)derived from remotely sensed imagery is a well known phenomenon and hasgenerated interest in the development of indices that would be less sensitive tothis in uence Several such indices have been developed thus far This paperfocuses on testing and comparing the sensitivity of seven intensively used LandsatThematic Mapper (TM) derived VIs (NDVI SAVI MSAVI PVI WDVI SAVI2and TSAVI) to bare surface variation with almost no vegetation signal The studywas conducted on a terrain composed of a high variety of bare surface materialsof which basalt and gypsum are two extremely dark and bright substrates respect-ively It was found that SAVI and MSAVI respond to bare surface material verysimilarly Such close similarity was also found between PVI and WDVI andbetween SAVI2 and TSAVI NDVI tends to be overestimated on dark surfaceswhile SAVI PVI and TSAVI show more sensitivity to bright surfaces Comparisonbetween D
VI (the diVerence between pairs of VIs) and the brightness of the diVerentsurface materials showed a high correlation in each case which underlines thefact that the response of diVerent VIs to bare surface variation is mainly relatedto the surface brightness
1 IntroductionDiVerent vegetation indices (VIs) based on combinations of two or more spectral
bands have been developed over the last three decades because more information
about the state of vegetation and its characteristics (spatial coverage biomassproductivity etc) can be derived more accurately from multi-band analysis thanfrom a single band Most VIs are computed from radiance re ectance or at leastapparent re ectance values in the red and the near-infrared (NIR) bands (Bannari
et al 1995)The most commonly applied vegetation index for agricultural and ecological
applications is the Normalized DiVerence Vegetation Index (NDVI table 1) whichhas been shown to be widely usable for vegetation analysis (Rouse et al 1974)
Previous studies have shown that multi-temporal NDVI images are useful for analys-
daggere-mail Karnielibgumailbguacil
International Journal of Remote SensingISSN 0143-1161 printISSN 1366-5901 online copy 2001 Taylor amp Francis Ltd
httpwwwtandfcoukjournalsDOI 10108001431160110063779
H Schmidt and A Karnieli3504
Table 1 Vegetation indices used in this study
Vegetation index Reference
Normalized DiVerence Vegetation Index
Rouse et al (1974)NDVI=(NIRshy R)
(NIR+R)
Perpendicular Vegetation Index
Richardson et al (1977)PVI=(NIRshy aR shy b)
2atilde a2+1
Weighted DiVerence Vegetation IndexWDVI=NIR=(aR) Richardson et al (1977)
Soil Adjusted Vegetation Index
Huete (1988)SAVI=A (NIRshy R)
(NIR+R+LB (1+L)
Modi ed SAVI
Qi et al (1994)MSAVI=2NIR+1 shy atilde (2NIR+1)2 shy [8(NIRshy R)]
2
Transformed SAVI
Baret et al (1989)TSAVI=[a(NIRshy aR shy b)]
(R+aNIRshy ab)
Soil Adjusted ratio Vegetation Index
SAVI2=NIR
[R+(ba)]Major et al (1990)
ing spatial vegetation patterns and for assessing vegetation dynamics (eg Justiceet al 1985 Townshend and Justice 1986)
It is well documented that the brightness of soil beneath vegetation in uencesthe interpretation of green vegetation by satellite observations (eg Huete et al 19841985 Huete and Jackson 1987 Huete 1988 Qi et al 1994 Qi and Huete 1995)Using ground-based spectral measurements Huete and Jackson (1987) concludedthat light coloured soils produce lower NDVI values than darker soil substrates forequivalent vegetation cover The problem is particularly noticeable in semi-arid andarid environments where there is less than 30 green canopy cover (Pech et al 1986)
The sensitivity of the NDVI to soil background has generated ample interest indeveloping other indices DiVerent research groups have developed alternative VIsfor qualitative and quantitative evaluation of vegetation characteristics using spectralmeasurements (see intensive review in Bannari et al 1995) Richardson and Wiegand(1977) noted that in scatter plots of red against NIR pixel values bare soil pixelswere aligned along a straight line This line has been denoted the lsquosoil linersquo whichcan be de ned by a linear equation with slope a and intercept b They modi ed thefour-dimensional lsquoTasseled Caprsquo transformation of Kauth and Thomas (1976) to onewith two dimensions for use with the red and NIR bands of Landsat MSS (Multi-Spectral Scanner) data and developed the Perpendicular Vegetation Index (PVItable 1 ) The perpendicular distance of a vegetation pixel to the lsquosoil linersquo is a measureof the amount of vegetation However Huete et al (1985) found that the PVI is alsoaVected by background soil brightness brighter soil leads to higher PVI values andvice versa which is the opposite eVect to that on the NDVI Richardson and Wiegand
Sensitivity of vegetation indices to substrate brightness 3505
(1977) presented also the Weighted DiVerence Vegetation Index (WDVI table 1)which is functionally equivalent to the PVI but includes only the slope of the soilline in the equation
Huete (1988) introduced the Soil Adjusted Vegetation Index (SAVI table 1) inorder to minimize the soil darkness in uence Based on a constant soil adjustmentfactor L SAVI minimizes the eVect of soil background re ected radiation Qi et al(1994) developed the Modi ed Soil Adjusted Vegetation Index (MSAVI table 1)to further minimize soil background in uence by using a variable soil brightnesscorrection factor to replace the constant soil correction factor as used in SAVI
The Transformed Soil Adjusted Vegetation Index (TSAVI table 1) is a modi ca-tion of the SAVI concept that was developed by Baret et al (1989) TSAVI takesinto account the soil parameters in the PVI concept and does not apply the correctionfactor L in the SAVI formula Furthermore a new version of the SAVI was developedby Major et al (1990) this is referred to as SAVI2 (table 1) which considers whetherthe soil is either wet or dry and incorporates the soil line parameter into thecalculation
DiVerent experiments have been conducted by some researchers using narrow-band eld re ectance spectra to study the in uence of diVerent soil backgrounds onVIs (Perry and Lautenschlager 1984 Price 1992 1993) These experiments tookplace mostly in agricultural areas with diVerent vegetation covers (Huete et al 1985Huete and Jackson 1987 Huete 1988 Qi et al 1994 Qi and Huete 1995) They werelater extended to satellite-based broadband VIs (Qi and Huete 1995 Huete et al1997) Liu and Huete (1995) used an analytical approach to examine noise sourcesin existing VIs for variable canopy background conditions Their results showedthat among the most intensively used VIs NDVI had the highest level of noise anderror whereas the soil noise in the SAVI and MSAVI had been partially removedto various degrees
Elvidge and Chen (1995) compared VIs by means of eld re ectance spectraacquired over pinyon pine and sage-bush canopies with diVerent backgrounds Theperformance of each vegetation index was evaluated based on its capability toestimate leaf area index (LAI) and per cent green cover Calculations and comparisonof the VIs were based on spectral eld data which were transformed to the broadbands of the satellite sensor The results of that study showed a background eVectfor each of the tested VIs
Rondeaux et al (1996) simulated several VIs for diVerent soil samples and arange of canopy covers The simulations were performed for a pair of single wave-lengths in the red and NIR parts of the spectrum Analysis showed that indicesrelated to the soil line such as SAVI MSAVI and TSAVI produce better resultsthan the NDVI The latter gives a very wide range of values with varying background
The spectral re ectance of soil in the visible spectral bands formed part ofnumerous studies conducted in the recent past (Escadafal et al 1989 Escadafal 1993Mulders 1993 Matikalli 1997) Matikalli (1997) investigated the spectral re ectanceof diVerent soil samples in the visible and NIR The research indicated that colouris the main feature used in the identi cation of soils For the identi cation andmapping of soil and geological materials of non-vegetated or sparsely vegetatedregions data acquired by sensors operating in the visible and NIR bands show auseful potential
As mentioned earlier soil brightness has a signi cant impact on VIs (eg Qi andHuete 1995 Huete et al 1997) Escadafal and Bacha (1996) developed the Brightness
H Schmidt and A Karnieli3506
Index (BI) which applies the re ectance values in two visible bands green (G) andred (R) and the NIR band to calculate the brightness of a surface
BI=(G2+R2+NIR2 )12 (1)
The fact that the BI includes the NIR part of the spectrum makes this index usefulfor studying the in uence of soil brightness on VIs
Qi (1993) stated that in order to evaluate VIs one should consider four sensitivit-ies of the indices The author ranked these sensitivities in the following ordervegetation sensitivity soil background variations atmospheric conditions and thesensor viewing geometry The current study deals only with the second priority invegetation index evaluationsmdashsoil background variations (soil brightness) This issueis especially important for global change studies and arid and semi-arid applicationswhere the vegetation is sparse and therefore the soil background is the majorcontributor to the remote sensing signal For vegetation applications the primarygoal is to minimize the soil noise
The objective of this paper is to study the sensitivity of diVerent VIs (derivedfrom a Landsat TM image) to bare substrate brightness It should be emphasizedthat the evaluation of these VIs for vegetation interpretation in semi-arid environ-ments with sparse vegetation cover was beyond the scope of this study Most ofthe previous works in this domain deal with correlations between VIs and cropcover biomass chlorophyll content and other vegetation parameters based onspectral eld measurements In this work only bare surfaces of diVerent brightnessand their response to diVerent VIs were studied Therefore the correlation betweenVIs and vegetation parameters such as per cent cover and LAI does not need to beconsidered Seven VIs were selected for examination They belong to two groupsone characterizes the vegetation cover according to the redNIR slope (NDVI SAVIand MSAVI) and the other by the perpendicular distance from the bare soil line(PVI WDVI SAVI2 and TSAVI)
2 Study areaThe Makhtesh Ramon erosive crater ( gure 1) is located in the Negev Desert in
southern Israel (30deg00ecirc ndash30deg15ecirc N and 34deg40ecirc ndash34deg50ecirc E) The crater is 40 km long and7 km wide covering about 200km2 in area The annual average rainfall is 56 mmwhich is restricted to the winter months (October to March) The vegetation coveris less than 15 consisting mainly of typical desert shrub vegetation which islocated primarily along the riverbeds in the crater (Danin 1983) The annualvegetation varies between years depending on the rainfall amount and distribution
The erosion crater was formed by the action of the intermittent river NahalRamon which erodes through layers of the Eocene to reveal a variety of substratesotherwise not exposed in this area (Ward et al 1993) The bottom surface of thecrater consists of a variety of geological units such as sandstone gypsum limestonedolomite plutonic crystalline rocks and others (Evenari et al 1982) Table 2 lists thekey for the studied lithologicalpedological substrates Figure 1 shows a generalgeological map of Makhtesh Ramon (Segev 1996) The large variety of geologicalformations concentrated over such a relatively small area has made it attractive forseveral remote sensing studies with the main focus on geology (Kaufmann 1988Ben-Dor and Kruse 1995 Ben-Dor et al 1996) The Landsat TM image in gure 2shows the geologic heterogeneity of the surface in Makhtesh Ramon The boxesshow the most interesting parts of the study area with regard to the current study
Sensitivity of vegetation indices to substrate brightness 3507
Figure 1 Location map of the study areas and geological map of the Makhtesh RamonCrater (after Segev 1996)
3 Methodology31 Satellite data processing
A Landsat TM image acquired in September 1995 was used for the study Thisimage acquired after 6 months of dry weather and high temperatures over theNegev Desert can be assumed to have detected almost no vegetation signal onlysignals of the geological and pedological substrates
Processing of the Landsat TM image included radiometric atmospheric andgeometric corrections The radiometric correction procedure was adapted fromMarkham and Barker (1986) Atmospheric correction of the Top-Of-Atmosphere(TOA) re ectance was carried out using the Second Simulation of the Satellite Signalin the Solar Spectrum algorithm denoted 6S version 6 (Vermote et al 1997) For
H Schmidt and A Karnieli3508
Tab
le2
Key
for
geolo
gica
lsu
bst
rate
sw
ith
red
and
NIR
re
ecta
nce
san
dori
gin
alV
Iva
lues
base
don
Lan
dsa
tT
Mdata
Key
Geo
logi
cal
subst
rate
sR
edN
IRN
DV
ISA
VI
MSA
VI
SA
VI 2
PV
IW
DV
IT
SA
VI
1B
asalt
0100
0156
0220
0089
0092
1364
0002
0023
0197
2L
acco
lith
0116
0162
0166
0072
0073
1242
shy0
001
0007
0138
3Sand
ston
e0
140
0208
0197
0101
0103
1346
0002
0022
0182
4Sand
ston
e(p
edim
ent)
0166
0246
0193
0112
0115
1355
0003
0025
0183
5Sand
ston
e(i
rono
xid
e)0
129
0189
0189
0091
0094
1319
shy0
001
0017
0172
6Sand
(du
nes
)0
220
0326
0195
0137
0140
1392
0008
0033
0195
7A
lluviu
m0
235
0346
0203
0119
0122
1387
0006
0029
0191
8L
oes
sal
luviu
m0
239
0350
0189
0140
0143
1384
0007
0031
0191
9Q
uar
tzit
e0
148
0222
0202
0108
0111
1370
0003
0025
0192
10
Ped
imen
t0
166
0246
0201
0088
0091
1319
0001
0020
0191
11
Lim
esto
ne
(iro
no
xid
e)0
154
0227
0190
0105
0107
1342
0001
0021
0179
12
Lim
esto
ne
(wit
hdo
lom
ite)
0277
0416
0200
0164
0166
1426
0016
0046
0206
13
Kaoli
nit
e0
235
0327
0162
0116
0118
1306
shy0
004
0012
0158
14
Gypsu
m0
220
0304
0161
0110
0112
1297
shy0
005
0011
0155
15
Flints
tone
0213
0326
0211
0147
0150
1435
0014
0042
0212
Sensitivity of vegetation indices to substrate brightness 3509
Figure 2 Subset of Landsat TM image (RGB=3 2 1) acquired in September 1995 showingthe Makhtesh Ramon Crater The red boxes mark the areas with the most signi cantdiVerences between the vegetation indices
this program the desert model was selected Measurements of the aerosol opticalthickness and the precipitable water were obtained by an automatic Sun trackingphotometer (CIMEL) (Holben et al 1998) This instrument is located at the site ofthe Jacob Blaustein Institute for Desert Research Ben-Gurion University of theNegev Sede Boker Campus about 30 km north of the study area Values for ozoneconcentration were determined from climatological data based on the Total OzoneMapping Spectrometer measurements (TOMS 1993) taken onboard the Nimbus-7spacecraft between 1987 and 1993
The image was recti ed using well distributed control points A rst-order poly-nomial equation of the ERDAS Imagine image processing package was used to con-vert the le coordinates to recti ed map coordinates in the Israeli Grid coordinatesystem (ERDAS 1994)
32 Satellite data analysisSeven diVerent VIs were determined (table 1) To calculate the soil line the lower
values of the red versus NIR re ectance scatter plots were used A simple linearregression between them was used to calculate the slope a and intercept b values ofthe soil line ( gure 3) For SAVI the soil adjustment factor L was used in additionAs suggested by Huete (1988) L =1 was selected due to the sparse vegetationconditions of the study area
Based on the calculation of the seven VIs homogeneous substrates characterizedby low standard deviation of VI ranges were identi ed Each substrate represents adiVerent lithology or pedology Since the dynamic ranges of the VIs are diVerent
H Schmidt and A Karnieli3510
(b)
(a)
Figure 3 Scatter plots of NIR against red re ectances of the bare surface materials (for keyto numbers see table 2) in the study area showing tendency towards the NIR as there ectance values increase (a) Landsat TM data and (b) laboratory spectralmeasurements
from one another and a few of them can have negative values it is impossible tocompare them directly Therefore qualitative comparison between the VIs wasperformed after rescaling them to values in the range of 0 to 1 based on thefollowing formula
VIrescaled=(VIvalue shy VI)(VImax shy VImin) (2)
where for a given VI type the subscripts value min max and rescaled designate theoriginal minimum maximum and rescaled values respectively Besides the VIs theBrightness Index (BI) was calculated for each substrate type using equation (1)based on the method of Escadafal and Bacha (1996) This was in order to study therelationship between the VI and the BI values of the diVerent bare surface types
33 L aboratory measurementsSubstrate samples were collected from diVerent locations in the Makhtesh Ramon
Crater Samples varied from black basalt (1) to very bright gypsum (14) For each
Sensitivity of vegetation indices to substrate brightness 3511
sample re ectance values were measured in the laboratory at wavelengths of between400 and 1100nm using a LICOR spectrometer (LI-COR 1989) A 1000 W halogenlamp was used as a light source Re ected radiation was measured with a 15deg eld-of-view from a height of 50 cm above the samples An average value of four re ectancemeasurements for each sample was calculated each obtained after rotating thesample 90deg in the horizontal plane The VI and BI values were calculated tocorrespond with the spectral bandwidth of the Landsat TM sensor
4 Results and discussionIt is assumed that the re ectance values acquired by the Landsat TM were
entirely from the substrate rather than vegetation since in addition to the lowvegetation cover most of the plants were almost completely dry at that time of theyear Figure 3 shows the soil base lines resulting from interpolations between thelow values from the red and NIR scatter plots of all substrates The diVerencebetween red and NIR becomes larger as the brightness of the substrate increasesTherefore the distance from the 11 line increases with substrate brightness Theslope of the soil base line re ects the sensitivity of the VI to the bare surface materialsHigher slope values may cause higher VI values Figure 3(a) shows the soil base linefor the Landsat TM data In comparison with gure 3(b) which represents thelaboratory spectral measurements the slope of the soil base line in gure 3(a) issteeper and shifts signi cantly from the 11 line with increasing surface brightnessThis phenomenon is slightly less pronounced for the laboratory spectral measure-ments ( gure 3(b)) The high slope in the soil line measured by the Landsat TMsensor in the red and NIR might be caused by sparse cover of dead plant materialin some of the study areas ( limestone 12) Table 2 lists the re ectances in red andNIR as well as the original VI values for each substrate All the parameters show awide range of values for the bare surfaces The relative diVerence between red andNIR increases with brightness of substrate as can be seen in gure 3(a)
The correlation matrix between pairs of the seven VIs based on Landsat TMdata is shown in table 3 Very high correlation coeYcients were found between SAVIand MSAVI (r2=0999) WDVI and PVI (r2=0997) SAVI2 and WDVI (r2=0930)SAVI
2and PVI (r2=0919) and SAVI
2and TSAVI (r2=0951) The lower coeYcients
of the other pairs are mainly due to the extreme dark or bright substrates such asbasalt (1) laccolith (2) kaolinite (13) and intstone (15) This can be noticedfrom the high residual values of the diVerent substrates in the regression plots( gures 4(a)ndash( f )) For example in gure 4(a) basalt (1) is represented by a high
Table 3 Correlation coeYcients (r2) between pairs of vegetation indices of bare surfacematerials derived from the Landsat TM image of the Makhtesh Ramon Crater Boldnumbers indicate relatively high correlation
NDVI SAVI MSAVI SAVI2 TSAVI PVI WDVI
NDVI 1000SAVI 0030 1000MSAVI 0036 0999 1000SAVI2 0473 0681 0695 1000TSAVI 0659 0484 0499 0951 1000PVI 0407 0713 0721 0919 0843 1000WDVI 0404 0723 0732 0930 0857 0997 1000
H Schmidt and A Karnieli3512
(a) (b)
(c) (d)
(e) (f)
Figure 4 Correlation between pairs of the selected vegetation indices based on Landsat TManalysis
NDVI value but low SAVI value thereby having a high residual value A similareVect can be noticed for bright surface materials For example the SAVI value ofloess (8) is much higher in relation to the NDVI value of the same material ( gure4(a)) Based on these results the number of VIs used for further study in this paperwas reduced to fourmdashthe indices which showed least correlation in their sensitivityto the substrate (NDVI SAVI PVI and TSAVI) Analysis of the laboratory spectralmeasurements showed very similar high correlations for SAVI versus MSAVI forPVI versus WDVI and TSAVI versus SAVI
2
Table 4 lists the rescaled VI values that were extracted from the Landsat TMimage for the selected substrates The italicized entries represent substrates with highvariation between rescaled VIs The BI values of the substrates based on the spectrallaboratory measurements are also listed The strong sensitivity of NDVI for darksubstrates is underlined by the high NDVI for basalt (1) which is more than double
Sensitivity of vegetation indices to substrate brightness 3513
Table 4 Rescaled vegetation index values based on Landsat TM analysis and brightnessindex values based on spectral laboratory measurements Italic numbers indicatesubstrates with signi cant variation between the VIs
Lithologicalpedological BrightnessKey substrates NDVI SAVI PVI TSAVI index
1 Basalt 0699 0282 0400 0564 02212 Laccolith 0175 0153 0175 0288 02833 Sandstone 0476 0374 0400 0493 05404 Sandstone (pediment) 0437 0458 0425 0498 08955 Sandstone (ironoxide) 0398 0404 0375 0479 04536 Sand dunes 0456 0649 0550 0553 06627 Alluvium 0408 0664 0525 0535 03158 Loessalluvium 0398 0672 0525 0535 06459 Quartzite 0524 0427 0425 0539 044410 Pediment 0514 0275 0375 0451 063811 Limestone (ironoxide) 0408 0404 0375 0479 062212 Limestone (with dolomite) 0505 0855 0755 0605 069813 Kaolinite 0136 0488 0255 0381 077114 Gypsum 0126 0443 0225 0367 077415 Flintstone 0612 0725 0700 0632 0333
the SAVI for the same substrate The opposite is observed for bright substrates suchas loess (8) limestone (12) kaolinite (13) and gypsum (14) for which the NDVIis lower than all the other VIs For some materials (eg sandstone and sanddune(3 4 5 6)) all four VIs respond quantitatively similarly The laccolith (2) ischaracterized by small values for all VIs whereas intstone (15) shows a highresponse in all Landsat TM based VIs
Figure 5 shows images of four of the rescaled VIs for the central part of theMakhtesh Ramon Crater In this area gypsum (14) and laccolith (2) are the mainlithologicalpedological substrates As seen in gure 5(a) the gypsum (indicated byan arrow) is represented by low NDVI values while SAVI ( gure 5(b)) shows rela-tively higher rescaled VI values for the same area These results emphasize theobserved phenomenon of low response of NDVI to bright surface types This is incontrast to SAVI which represents these bright materials with much higher valuesPVI shows a similar response to NDVI while TSAVI is close to SAVI Figure 6illustrates the same VIs but for a diVerent zone located in the western part of thestudy area As can be seen in the Landsat TM image ( gure 2) this area is coveredby distinctive basalt hills The basalt hills appear in diVerent grey tones on theimages of the diVerent VIs ( gure 6) which is also obvious from the wide variationin the values representing basalt (1) in table 4 The NDVI ( gure 6(a)) values arerelatively high while SAVI ( gure 6(b)) does not show much sensitivity to thedarkness of the substrate PVI ( gure 6(c)) appears to show almost the same responseas SAVI while TSAVI ( gure 6(d )) shows slightly higher values for the basalt thanSAVI or PVI
The previous comparison of all VIs shows that NDVI SAVI PVI and TSAVIrespond diVerently to variability in bare surface material Correlation analysisbetween the brightness values from the laboratory spectral measurements and thoseof the Landsat TM analysis for the main substrates gave a high value of r2=079To summarize the relationship between brightness and VIs quantitatively the BIand VI values based on the Landsat TM data were correlated (table 5) High
H Schmidt and A Karnieli3514
(a) (b)
(c) (d)
Figure 5 Greyscale images of the rescaled vegetation indices for the central part of theMakhtesh Ramon Crater White arrows show the location of the gypsum area Therescaled vegetation index values range from 0 (black) to 1 (white) (a) NDVI (b) SAVI(c) PVI (d) TSAVI
correlation between the BI and any VI means that the VI of the bare surface is verysensitive to the brightness of the substrate material As seen in table 5 NDVI doesnot show any correlation SAVI shows a strong correlation whereas PVI and TSAVIshow very little correlation with the surface brightness in the Landsat TM dataSince the sensitivity of satellite-derived VIs to surface brightness is a chief interestof this work it is worthwhile examining the regression plots ( gure 7) between theLandsat TM derived VI and BI values of the selected bare surfaces The NDVIshows a weak correlation with soil brightness with only a slight decrease as afunction of brightness ( gure 7(a)) The high NDVI value for basalt (1) has contrib-uted immensely to this result SAVI shows high positive correlation with the BI ofthe surface material ( gure 7(b)) PVI ( gure 7(c)) and TSAVI ( gure 7(d )) alsoincrease with increasing BI but with a reduced correlation compared to SAVI
The diVerence between the rescaled VIs was calculated in order to detect thesensitivity and diVerent responses of the VIs to the brightness of various substratesFigure 8 shows the diVerence between the rescaled NDVI and SAVI for the entirestudy area The white and black areas are locations of extreme diVerence in responsebetween the two VIs White areas represent high NDVI values while black areasshow high SAVI values Figure 9 shows the relationship between surface brightnessand various VI pair diVerences The diVerence between SAVI and NDVI (DSAVIndashNDVI)correlated highly positively (r2=089) with substrate brightness ( gure 9(a)) Thehigh correlation shows that the diVerence in the responses of SAVI and NDVI for
Sensitivity of vegetation indices to substrate brightness 3515
(a) (b)
(c) (d)
Figure 6 Greyscale images of the rescaled vegetation indices for the western part of theMakhtesh Ramon Crater focused on the basalt hills The rescaled vegetation indexvalues range from 0 (black) to 1 (white) (a) NDVI (b) SAVI (c) PVI (d ) TSAVI
Table 5 Correlation coeYcients (r2) between brightness values and vegetation index valuesbased on Landsat TM data of bare surface material in the Makhtesh Ramon Crater
Landsat TM data
NDVI 0055SAVI 0835TSAVI 0125PVI 0323
the same bare surface material depends on the brightness of the substrate As shownin gure 9(a) and gure 8 NDVI responds to dark surface material with much highervalues than SAVI (positive DVI ) The same behaviour has been found for DPVIndashNDVI( gure 9(b)) D
TSAVIndashNDVI( gure 9(c)) and D
SAVIndashPVI( gure 9(d )) These three D
VI
H Schmidt and A Karnieli3516
(a) (b)
(c) (d)
Figure 7 Correlation between vegetation index values and brightness index values of selectedbare surface materials based on Landsat TM data (a) NDVI (b) SAVI (c) PVI and(d ) TSAVI
Figure 8 DiVerence image (DNDVIndashSAVI) of the Makhtesh Ramon Crater
increase as a function of the substrate brightness except that the slopes of theirregression lines are diVerent The slope for DSAVIndashNDVI (1917) is much higher thanfor DPVIndashNDVI (1106) DTSAVIndashNDVI (0595) and DSAVIndashPVI (081) Therefore the depend-ence of DSAVIndashNDVI on surface brightness exceeds those of DPVIndashNDVI DTSAVIndashNDVI andD
SAVIndashPVI As can be seen in gures 9(b) and 9(c) the diVerent responses of basalt
Sensitivity of vegetation indices to substrate brightness 3517
(a) (b)
(c) (d)
(e) (f)
Figure 9 Correlation between brightness and rescaled VI diVerences (DVI) for selected baresurface materials based on Landsat TM data
(1) and laccolith (2) in these VIs does not have strong dependence on the brightnessof both surface components DSAVIndashTSAVI in gure 9(e) shows the highest correlationwith substrate brightness (r2=0991) This is probably because in general TSAVIshows much higher values for dark surface types while SAVI responds more sensit-ively to brighter surface materials Furthermore the slope of the regression line isrelative high (0462) The diVerence between PVI and TSAVI (D
PVIndashTSAVI) shows a
weak correlation as a function of substrate brightness (r2=0331) ( gure 9( f ))
5 ConclusionsSoil background is a major surface component that has an impact on the spectral
behaviour of vegetation canopies especially in semi-arid environments with sparse
H Schmidt and A Karnieli3518
vegetation cover The goal of this paper has been to show that the values of the VIsvary not only as a function of the vegetation but also due to variation in the exposedsoil or rock background in terms of the substrate brightness Therefore the resultspresented here are speci c to the sensitivity of VIs to bare surface material ratherthan to vegetation The sensitivity of diVerent VIs to bare surface materials andtheir Landsat TM derived brightness was investigated and the eVect of diVerentbackground substrates on the most widely used VIs was examined
Out of the seven VIs investigated it was found that three diVerent pairs havesuch a high correlation that one member of each pair can be practically consideredthe same index as the other In eVect SAVI and MSAVI show almost the samesensitivity to bare surface materials The same phenomenon was observed also forPVI and WDVI and for SAVI2 and TSAVI The main indices that show considerablevariation between them are NDVI SAVI PVI and TSAVI
It was demonstrated that NDVI is very sensitive to basalt and responds with ahigh value whereas SAVI and PVI respond to bright surface materials with highervalues Comparison of brightness values with VI values of diVerent bare surfacematerials underlines the strong dependence of VIs on the brightness variation of thesoil background The high correlation between brightness and DVI proves theseresults For instance the diVerence in response between SAVI and NDVI and SAVIand TSAVI to bare surface material is caused by brightness variation while thediVerence between SAVI and PVI does not show the same strong dependence onbrightness
AcknowledgmentsWe thank Sveta Gilerman for her essential assistance We gratefully acknowledge
the help of Kevin G Kleinsah and Iris Schmidt for collecting the substrate samplesin the Makhtesh Ramon Crater and Charles Ichoku for editing the paper Finallywe also thank the MINERVA-Stipendien-Komitee and the German AcademicExchange Program (DAAD) who nanced this work with research fellowships
References
Bannari A Morin D Bonn F and Huete A R 1995 A review of vegetation indicesRemote Sensing Reviews 13 95ndash120
Baret F Guyot G and Major D J 1989 TSAVI a vegetation index which minimizessoil brightness eVects on LAI and APAR estimation Proceedings of the 12th CanadianSymposium on Remote Sensing IGARRSSrsquo90 Vancouver BC Canada 10ndash14 Julyvolume 3 (Piscataway NJ IEEE) pp 1355ndash1358
Ben-Dor E and Kruse F A 1995 Surface mineral mapping of Makhtesh Ramon NegevIsrael using GER 63 channel scanner data International Journal of Remote Sensing16 3529ndash3553
Ben-Dor E Kruse F A Dietz J B Braun A W and Banin A 1996 Spatial distortionand quantitative geological mapping of Makhtesh Ramon Negev Israel by using theGER 63 channel scanner data Canadian Journal of Remote Sensing 22 258ndash268
Danin A 1983 Desert Vegetation of Israel and Sinai (Jerusalem Cana)Elvidge C D and Chen Z 1995 Comparison of broad-band and narrow-band red and
near-infrared vegetation indices Remote Sensing of Environment 54 38ndash48ERDAS 1994 Erdas Field Guide ERDAS Inc Atlanta GA USAEscadafal R 1993 Remote sensing of soil color principles and applications Remote Sensing
Reviews 7 261ndash279Escadafal R and Bacha S 1996 Strategy for the dynamic study of deserti cation
Proceedings of the ISSS International Symposium Ouagadougou Burkino Faso 6ndash10February 1995 (Paris Orstom editions) pp 19ndash34
Sensitivity of vegetation indices to substrate brightness 3519
Escadafal R Girard M C and Courault D 1989 Munsell soil color and soil re ectancein the visible spectral bands of Landsat MSS and TM data Remote Sensing ofEnvironment 27 37ndash46
Evenari M Shanan L and Tadmor N 1982 The Negev The Challenge of a Desert(Cambridge Havard University Press) pp 437
Holben B N Eck T F Slutsker I Tanrersquo D Setzer A Vermote EReagan I A Kaufman Y J Nakajama T Lavenu F Jankowiak I andSmirnov A 1998 AERONETmdashA Federated Instrument Network and Data Archivefor Aerosol Characterization Remote Sensing of Environment 66 1ndash16
Huete A 1988 A soil-adjusted vegetation index (SAVI) Remote Sensing of Environment 25295ndash309
Huete A and Jackson R D 1987 Suitability of spectral indices for evaluating vegetationcharacteristics on arid rangelands Remote Sensing of Environment 23 213ndash232
Huete A Jackson R D and Fost D F 1985 Spectral response of a plant canopy withdiVerent soil backgrounds Remote Sensing of Environment 17 37ndash53
Huete A Liu H Q Batchily K and van Leeuwen W 1997 A comparison of vegetationindices over a global set of TM images for EOS-MODIS Remote Sensing ofEnvironment 59 440ndash451
Huete A Post D F and Jackson R D 1984 Soil spectral eVects on 4-space vegetationdiscrimination Remote Sensing of Environment 15 155ndash165
Justice C O Townshend J R G Holben B N and Tucker C J 1985 Analysis of thephenologyof global vegetationusing meteorologicalsatellite data InternationalJournalof Remote Sensing 6 1271ndash1318
Kaufmann H 1988 Decorrelation processing and evaluation of Landsat TM data as appliedto Makhtesh Ramon Israel Journal of Earth Sciences 37 137ndash143
Kauth R J and Thomas G S 1976 The tasseled capmdasha graphic description of the spatialndashtemporal development of agricultural crops as seen by Landsat Machine Processingof Remotely Sensed Data Proceedings of L AR Symposium Purdue University WestL afayette Indiana 29 Junendash1 July 1976 edited by P H Swain D B Morrison andD E Parks (West Lafayette Ind IEEE) pp 41ndash51
LI-COR 1989 LI-1800 Portable Spectrometer Instruction Manual Publication No8210-0030 LI-COR Inc Lincoln NE USA
Liu H Q and Huete A 1995 A feedback based modi cation of the NDVI to minimizecanopy background and atmospheric noise IEEE T ransactions on Geoscience andRemote Sensing 33 457ndash465
Major D J Baret F and Guyot G 1990 A ratio vegetation index adjusted for soilbrightness International Journal of Remote Sensing 11 727ndash740
Markham B L and Barker J L 1986 Landsat MSS and TM post calibration dynamicranges atmospheric re ectance and at-satellite temperature EOSAT LandsatTechnical Notes 1 August 1986 Earth Observation Satellite Company Lanham MDUSA pp 3ndash8
Mattikalli N M 1997 Soil color modeling for the visible and near-infrared bandsof Landsat sensors using laboratory spectral measurements Remote Sensing ofEnvironment 59 14ndash28
Mulders M A 1993 Remote sensing of soils in warm arid and semi-arid lands RemoteSensing Reviews 7 341ndash363
Pech R P Davis A W Lamacraft R R and Graetz R D 1986 Calibration of Landsatdata for sparsely vegetated semi-arid rangelands International Journal of RemoteSensing 7 1729ndash1750
Perry C R and Lautenschlager L F 1984 Functional equivalence of spectral vegetationindices Remote Sensing of Environment 14 169ndash182
Price J C 1992 Estimating vegetation amount from visible and near infrared re ectancemeasurements Remote Sensing of Environment 41 29ndash34
Price J C 1993 Estimating leaf area index from satellite data IEEE T ransactions onGeoscience and Remote Sensing 31 727ndash734
Qi J 1993 Compositing multitemporal remote sensing data sets Ph D dissertationUniversity of Arizona Tucson AZ USA
Qi J Chehbouni A Huete A Kerr Y H and Sorooshian S 1994 A modi ed soiladjusted vegetation index Remote Sensing of Environment 48 119ndash126
Sensitivity of vegetation indices to substrate brightness3520
Qi J and Huete A 1995 A feedback based modi cation of the NDVI to minimize canopybackground and atmospheric noise IEEE T ransactions on Geoscience and RemoteSensing 33 457ndash465
Richardson A J and Wiegand C L 1977 Distinguishingvegetation from soil backgroundinformation Photogrammetric Engineering and Remote Sensing 43 1541ndash1552
Rondeaux G Steven M and Baret F 1996 Optimization of soil-adjusted vegetationindices Remote Sensing of Environment 55 95ndash107
Rouse J W Haas R H Schell J A Deering D W and Harlan J C 1974 Monitoringthe Vernal Advancements and Retrogradation (Greenwave EVect) of NatureVegetation NASAGSFC Final Report NASA Greenbelt MD USA
Segev A 1996 Mesozoic magmatism in the Ramon Israel Journal of Earth Sciences 4590ndash100
TOMS 1993 Total Ozone Mapping Spectrometer instrument onboard the Nimbus 7 space-craft NASA Goddard Space Flight Center Laboratory for Atmospheres Code 916Greenbelt MD USA
Townshend J-R-G and Justice C O 1986 Analysis of dynamics of African vegetationusing the NDVI International Journal of Remote Sensing 7 1224ndash1242
Vermote E Tanre D Deuze J L Herman M and Morcette J-J 1997 SecondSimulation of the Satellite Signal in the Solar Spectrum (6S) IEEE T ransactions onGeoscience and Remote Sensing 35 675ndash685
Ward D Olsvig-Whittaker L and Lawes M 1993 Vegetationndashenvironment relationshipin a Negev Desert erosion cirque Journal of Vegetation Science 4 83ndash94
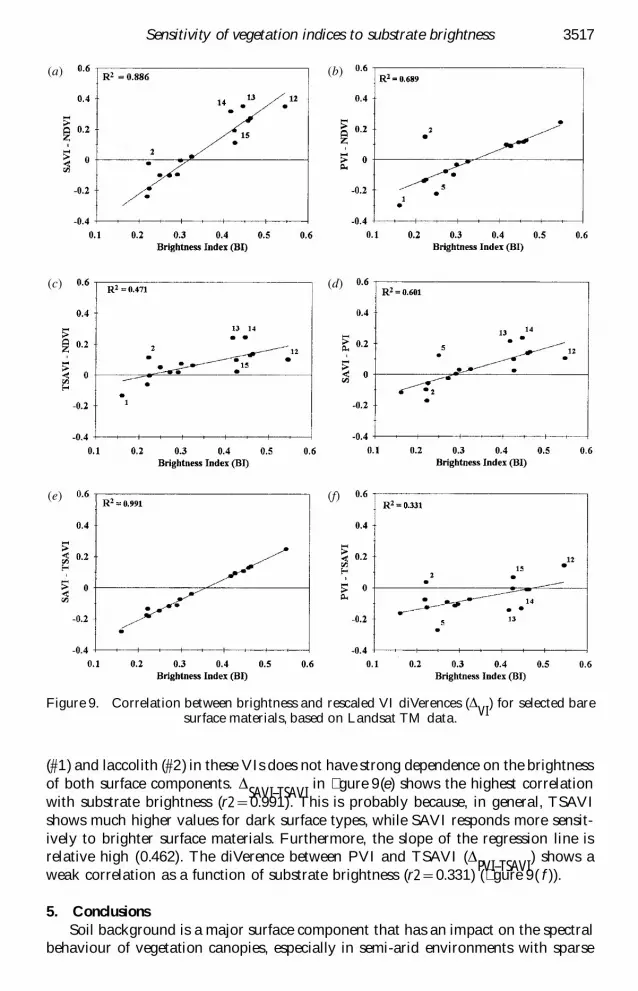
Recommended


