Spine Calcium Transients Induced by Synaptically-Evoked Action Potentials Can Predict Synapse Locationand Establish Synaptic DemocracyDavid C. Sterratt1., Martine R. Groen2., Rhiannon M. Meredith2", Arjen van Ooyen2"*
1 Institute for Adaptive and Neural Computation, School of Informatics, University of Edinburgh, Edinburgh, Scotland, United Kingdom, 2 Department of Integrative
Neurophysiology, Center for Neurogenomics and Cognitive Research, VU University Amsterdam, Amsterdam, The Netherlands
Abstract
CA1 pyramidal neurons receive hundreds of synaptic inputs at different distances from the soma. Distance-dependentsynaptic scaling enables distal and proximal synapses to influence the somatic membrane equally, a phenomenon called‘‘synaptic democracy’’. How this is established is unclear. The backpropagating action potential (BAP) is hypothesised toprovide distance-dependent information to synapses, allowing synaptic strengths to scale accordingly. Experimentalmeasurements show that a BAP evoked by current injection at the soma causes calcium currents in the apical shaft whoseamplitudes decay with distance from the soma. However, in vivo action potentials are not induced by somatic currentinjection but by synaptic inputs along the dendrites, which creates a different excitable state of the dendrites. Due totechnical limitations, it is not possible to study experimentally whether distance information can also be provided bysynaptically-evoked BAPs. Therefore we adapted a realistic morphological and electrophysiological model to measure BAP-induced voltage and calcium signals in spines after Schaffer collateral synapse stimulation. We show that peak calciumconcentration is highly correlated with soma-synapse distance under a number of physiologically-realistic suprathresholdstimulation regimes and for a range of dendritic morphologies. Peak calcium levels also predicted the attenuation of theEPSP across the dendritic tree. Furthermore, we show that peak calcium can be used to set up a synaptic democracy in ahomeostatic manner, whereby synapses regulate their synaptic strength on the basis of the difference between peakcalcium and a uniform target value. We conclude that information derived from synaptically-generated BAPs can indicatesynapse location and can subsequently be utilised to implement a synaptic democracy.
Citation: Sterratt DC, Groen MR, Meredith RM, van Ooyen A (2012) Spine Calcium Transients Induced by Synaptically-Evoked Action Potentials Can PredictSynapse Location and Establish Synaptic Democracy. PLoS Comput Biol 8(6): e1002545. doi:10.1371/journal.pcbi.1002545
Editor: Olaf Sporns, Indiana University, United States of America
Received October 5, 2011; Accepted April 19, 2012; Published June 14, 2012
Copyright: � 2012 Sterratt et al. This is an open-access article distributed under the terms of the Creative Commons Attribution License, which permitsunrestricted use, distribution, and reproduction in any medium, provided the original author and source are credited.
Funding: This project was funded by Nederlandse Organisatie voor Wetenschappelijk Onderzoek (NWO) Top Talent grant (021.002.082) to MG, NWO (917.10.372)to RMM and DCS was supported by The Wellcome Trust (grant number 083205/B/07/Z). The funders had no role in study design, data collection and analysis,decision to publish, or preparation of the manuscript.
Competing Interests: The authors have declared that no competing interests exist.
* E-mail: [email protected]
. These authors contributed equally to this work.
" These authors are joint senior authors on this work.
Introduction
CA1 pyramidal neurons receive numerous synaptic inputs
across their extensive dendritic tree, with synapses located up to
hundreds of micrometres from the soma [1]. Due to electrotonic
filtering, a distal synapse evokes a smaller EPSP at the soma than a
proximal synapse of equal synaptic strength and is therefore less
effective at generating somatic action potentials [2]. In CA1
pyramidal neurons, synaptic scaling overcomes this inequality with
larger synaptic conductances at distal Schaffer collateral synapses
than at proximal synapses [3–5]. This makes the amplitude of a
synaptic response at the soma independent of its dendritic
location, a phenomenon known as ‘dendritic democracy’ [6].
It is not clear what cues synapses may use to establish this
distance-dependent scaling along the dendrites but internal
activity-dependent signalling by the neuron may provide this
information. A likely candidate is the backpropagating action
potential (BAP), which decreases in amplitude and arrives later as
it travels further along the apical shaft [7,8]. BAPs activate voltage-
gated calcium channels, causing transient, local increases in
calcium concentrations at dendritic spines [9,10]. Previous
experiments, including ours, have measured BAPs that were
induced artificially in neurons via somatic current injection [7–10].
However, in vivo action potential generation occurs via synaptic
stimulation distributed across the dendritic tree, which could evoke
a different spatiotemporal pattern of voltage and calcium
concentration at spines. Furthermore, AP propagation speed
decreases in dendrites with a smaller diameter, such as distal and
oblique dendrites [11]. Thus the relationship between BAP
features and distance may vary across different branches of the
dendritic tree and depend on previous synaptic activity.
The two available stimulation methods in slice experiments,
extracellular stimulation and glutamate uncaging, are not yet able
to elicit a physiologically-realistic, synaptically-evoked BAP. The
first method, extracellular stimulation, stimulates both glutama-
tergic and GABAergic axons and requires an artificially large
PLoS Computational Biology | www.ploscompbiol.org 1 June 2012 | Volume 8 | Issue 6 | e1002545
tetanus to induce an AP. The second method, synapse stimulation
by laser-induced glutamate uncaging near a spine, requires
scanning two-photon laser microscopes that currently are only
able to uncage glutamate at ca. 10 spines within a 5 ms time
window. This is insufficient to elicit an AP at the soma of CA1
pyramidal cells, which requires many simultaneously-activated
synapses. In addition, measuring voltage in dendritic branches
with voltage sensitive dyes is difficult, due to their limited signal-to-
noise ratio and toxicity [12]. Although direct patch clamp
recordings have been made at the apical shaft [3,13], this is not
yet possible for the thin oblique dendrites, where the majority of
the spines are located [14]. Therefore we took a modelling
approach to investigate whether the calcium and voltage signals
associated with synaptically-evoked BAPs contain sufficient
information to predict synapse location.
We added spines to a well-established CA1 pyramidal neuron
model that contains both active and passive properties distributed
across a detailed morphology and that has been verified by
combined dendritic and somatic recordings [15]. In addition, we
used a range of CA1 morphology reconstructions, so as to exclude
potential morphology-specific simulation results. We investigated
whether features of the voltage and calcium signals, namely their
peak, integral and time of onset, could be used as predictors for
synaptic location. A good distance predictor should not only
contain reliable distance information but should also give
consistent results for different types of stimulation. Importantly,
the predictor should be a suitable candidate for homeostatic
scaling of synaptic strength. This implies that the value of the
predictor should respond to changes in synaptic strength, enabling
the system to self-organise into a state of synaptic democracy.
Under in vivo-like conditions of synaptic stimulation, in non-
scaled CA1 pyramidal neurons, we find that the peak value of
calcium transients, but not membrane potential, integral values or
onset latencies, is strongly correlated with distance and EPSP
attenuation. Interestingly, setting one peak calcium target for all
spines and homeostatically regulating synaptic strength on the
basis of peak calcium resulted in synaptic democracy. Thus,
calcium signals in spines induced by synaptically-evoked action
potentials contain distance-dependent information across the CA1
dendritic tree that can be used to set up a synaptic democracy.
Materials and Methods
Compartmental modelA previous morphologically-realistic compartmental model of a
hippocampal CA1 pyramidal cell was modified to include
Schaffer collateral spines across the dendritic tree [15,16]. In
short, the multi-compartment model includes calcium buffering
and the following ionic currents: a voltage-gated sodium current
(INa), a potassium delayed rectifier current (IKDR), a fast
inactivating, A type potassium current (IA), a hyperpolarisation-
activated mixed cation current (Ih), a LVA T-type calcium
current (ICaT), a HVA R-type calcium current (ICaR), a HVA L-
type calcium current (ICaL), a calcium-dependent potassium
current (IAHP) and a slowly inactivating potassium current (Im)
[15]. To make the model consistent with our calcium imaging
data (Fig. 1B, C), we had to set the density of L-type calcium
currents in the proximal apical shaft (first 50 mm from soma)
equal to the density in the distal dendrites; this had little effect on
the backpropagation of APs in the model. In addition, we applied
the model to two other CA1 pyramidal cell morphologies, based
on a Neurolucida reconstruction of biocytin-filled neurons. Since
no full axon reconstruction was available for these morphologies,
we used the axon reconstruction described in the original
morphology. The model is implemented in NEURON [17] and
the code for all simulations in this paper is available from the
ModelDB database (accession number 144490 http://senselab.
med.yale.edu/senselab/modeldb).
Spine distribution and activationTo model synaptic input, spines were distributed at random
over the dendrites of the stratum radiatum dendritic section, based
on distribution patterns for adult CA1 pyramidal neurons [18].
For each stimulation condition, the simulation was repeated 100
times with a new distribution of synapses. Peak, integral and delay-
to-peak (defined as the time from synapse stimulation until the
peak signal) were measured for voltage and calcium signals in
spines. To ensure sufficient data points per stimulation to
determine a reliable mean per synapse, only synapses that were
activated 10 or more times were analysed.
Spines were simulated using separate compartments for the
neck (diameter 0.2 mm, length 1.0 mm) and spine head (diameter
0.4 mm, length 0.2 mm) [10]. Synaptic NMDA and AMPA
receptors and R-type calcium channels were located on the spine
head (see below for detailed description). Apart from these
receptors and channels, the spines had only passive conductances,
the membrane resistance being 10 kVcm2 and the intracellular
resistance 50 Vcm (the same as in the oblique dendrites and
proximal apical shaft; see [15]).
Calcium entered into the spine and dendrites through activation
of synaptic glutamate receptors and voltage-gated calcium
channels. Based on experimental evidence [10] and modelling
results [19], we assumed that there was no diffusion of calcium
through the spine neck. Accumulation, buffering and extrusion of
calcium in the spine head were modelled using first order kinetics
[20]:
d½Ca2z�idt
~ICa
2Fnk{½Ca2z�i{½Ca2z�i,0
tCað1Þ
Author Summary
Neurons receive information from other neurons viahundreds of contacts (synapses) spread across theirdendritic branches. Input signals from synapses propagatealong a dendrite to the cell body (soma), where the neurondecides whether or not to produce an action potential.Signals that travel further decay more. Were all synapsesequally strong, a synapse far from the soma would haveless influence on the decision than a synapse close by.However, neurons in the hippocampus, which are involvedin learning and memory, have synapses far from the somathat are stronger than those close by, so that all synapseshave an equal voice (‘‘synaptic democracy’’). But how can asynapse ‘‘know’’ how far it is from the soma? Using acomputational model of a hippocampal neuron, we showthat the action potential, which propagates from the somaback into the dendrites, contains information with whichsynapses can estimate their somatic distance. Specifically,the calcium concentration at the synapse, which ismodulated by the backpropagating action potential,decreases with distance from the soma. We show thatwhen the strength of a synapse is adapted in a self-organising manner based on calcium concentration,synaptic democracy is obtained.
Synaptically-Induced BAP Predicts Synapse Location
PLoS Computational Biology | www.ploscompbiol.org 2 June 2012 | Volume 8 | Issue 6 | e1002545
where [Ca2+]i is the intracellular calcium concentration,
[Ca2+]i,0 = 70 nM is the resting concentration of calcium, ICa is
the total calcium current through the NMDA, AMPA and R-type
channels, tCa = 12 ms is the calcium pump extrusion time
constant, k = 20 is the buffer capacity [10], v is the volume of
the spine head and F is Faraday’s constant.
NMDA channelsThe time course of NMDA currents were modelled as a sum of
exponentials, {e{t=t1z0:61e{t=t2z0:39e{t=t3 , with rise time
constant t1 = 1.7 ms and decay time constants t2 = 68 ms and
t3 = 444 ms. The time constants derive from excised patch
recordings at 22uC [21], corrected for the simulation temperature
of 34uC using a Q10 of 3 [22]. The peak NMDA conductance was
gNMDA = 45 pS, based on a peak conductance of 70 pS measured
in spines in CA1 cells [23] and allowing for a 40% reduction due
to the steady-state calcium-dependent NMDA receptor inactiva-
tion [24].
Voltage-dependent block was modelled as an instantaneous
process, with the fraction of unblocked channels being given by
Vargas-Caballero and Robinson [25]:
1
1ze{1:92F (Vz13)=RT
ð2Þ
where R is the molar gas constant and T is the temperature in
Kelvin.
The NMDA receptor passed both a nonspecific ion current
IM,NMDA and a calcium current ICa,NMDA given by:
IM,NMDA~0:87gNMDA(V{ENMDA) ICa,NMDA~0:13gNMDAVCa(V ) ð3Þ
where ENMDA = 0 mV is the NMDA reversal potential and VCa is
the effective calcium driving force given by the Goldman-
Hodgkin-Katz current equation,
VCa(V )~V½Ca2z�i=½Ca2z�e{e{2FV=RT
1{e{2VF=RT
� �ð4Þ
with [Ca2+]e being the extracellular calcium concentration of
2 mM. The ratio of IM,NMDA to ICa,NMDA derives from the ratio of
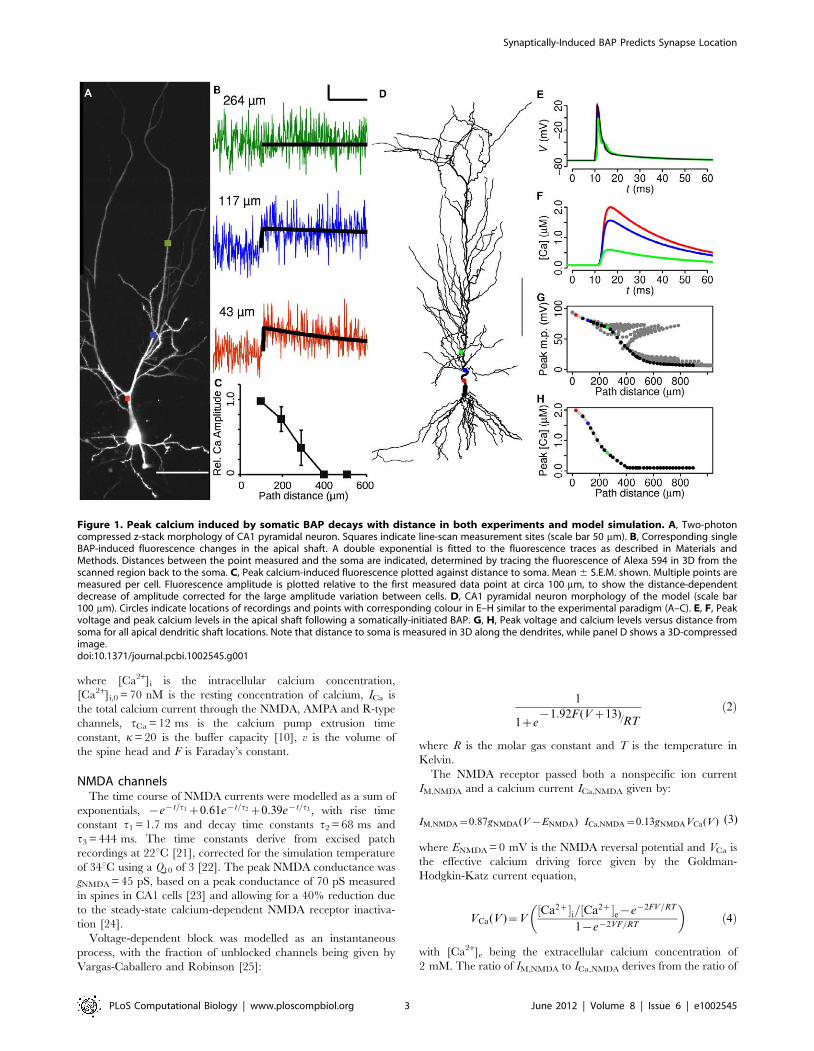
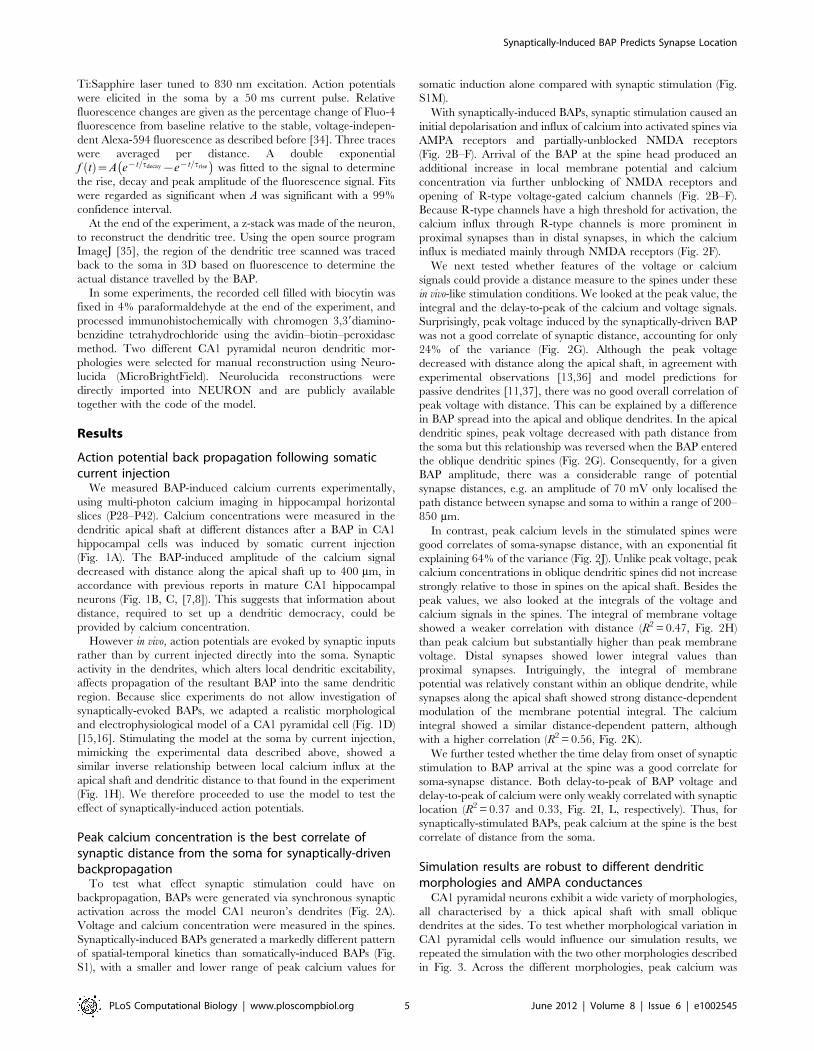
Figure 1. Peak calcium induced by somatic BAP decays with distance in both experiments and model simulation. A, Two-photoncompressed z-stack morphology of CA1 pyramidal neuron. Squares indicate line-scan measurement sites (scale bar 50 mm). B, Corresponding singleBAP-induced fluorescence changes in the apical shaft. A double exponential is fitted to the fluorescence traces as described in Materials andMethods. Distances between the point measured and the soma are indicated, determined by tracing the fluorescence of Alexa 594 in 3D from thescanned region back to the soma. C, Peak calcium-induced fluorescence plotted against distance to soma. Mean 6 S.E.M. shown. Multiple points aremeasured per cell. Fluorescence amplitude is plotted relative to the first measured data point at circa 100 mm, to show the distance-dependentdecrease of amplitude corrected for the large amplitude variation between cells. D, CA1 pyramidal neuron morphology of the model (scale bar100 mm). Circles indicate locations of recordings and points with corresponding colour in E–H similar to the experimental paradigm (A–C). E, F, Peakvoltage and peak calcium levels in the apical shaft following a somatically-initiated BAP. G, H, Peak voltage and calcium levels versus distance fromsoma for all apical dendritic shaft locations. Note that distance to soma is measured in 3D along the dendrites, while panel D shows a 3D-compressedimage.doi:10.1371/journal.pcbi.1002545.g001
(3)
Synaptically-Induced BAP Predicts Synapse Location
PLoS Computational Biology | www.ploscompbiol.org 3 June 2012 | Volume 8 | Issue 6 | e1002545
calcium to caesium permeability in hippocampal CA1 and CA3
[23].
AMPA channelsThe AMPA conductance was modelled by a dual exponential
with a rise time constant of 0.2 ms and a decay time constant of
5 ms [26]. The maximum AMPA conductance, gAMPA, was
200 pS for all synapses in the non-scaled simulations. This value
was based on experimentally measured EPSCs at the apical shaft
and the AMPA channel reversal potential [3]. Nonspecific ion and
calcium flow through the AMPA channels was modelled in the
ratio 99.8%:0.2% [23].
R-type calcium channelsThe current through the R-type calcium channel was given by:
ICa,R~gCa,RVCa(V ) ð5Þ
where gCa,R approaches the slope conductance of the channel for
large negative voltages.
The kinetics of the R-type channel were taken from the
recordings at 22uC [27] and scaled to 34uC using a Q10 of 3 typical
of ion channels [28]. The conductance was
gCa,R~gCa,Rm3h ð6Þ
where m and h are Hodgkin-Huxley state variables obeying first
order kinetics. Their steady-state values were
m?~1
1ze{ V{3ð Þ=8:3and h?~
1
1ze Vz39ð Þ=9:2ð7Þ
with V in mV. The time constants (in ms) of the state variables were
tm~2Q{(T{22)=1010 and th~100Q
{(T{22)=1010 ð8Þ
where T is temperature in degrees Celsius.
Based on a unitary conductance of 17 pS [27] and 10 channels
per spine [29], we took gCa,R to be 170 pS. With these parameter
values, the peak calcium concentration in a spine in response to a
somatically-induced BAP was around 1 mM, which is well within
the range measured experimentally [10].
Stimulation protocolsSynaptic inputs were modelled at subthreshold (190 synapses
activated) and suprathreshold (240 synapses activated) levels as
bursts of synchronous Schaffer collateral activity. To simulate
spike jitter that occurs during sharp-wave or theta rhythms,
synapses were activated in an asynchronous pattern, randomly
drawn from a 10 ms time window [30]. During a single synaptic
stimulation episode, inputs were activated only once.
AttenuationThe attenuation at a synapse is defined as
1{VEPSP,syn=VEPSP,soma, where VEPSP,syn is the amplitude of the
EPSP at the synapse and VEPSP,soma the corresponding amplitude
measured at the soma.
Attenuation-dependent scaling of synapsesThe synapses were scaled by multiplying each synapse’s
conductance in the unscaled simulations by its EPSP attenuation
and then dividing by the mean EPSP attenuation of all synapses.
Homeostatic regulation of synaptic strengthIn developing neurons, postsynaptic calcium regulates AMPA
trafficking and expression in spines [31,32]. To investigate
whether this can be used to set up a synaptic democracy, we
carried out simulations in which the AMPA conductances of
activated synapses were adjusted based on the peak calcium levels
in the spines. At the start of the simulation, all synapses had the
same AMPA conductance (gAMPA = 200 pS). For each simulation
run, a different set of 240 synapses was activated to induce a BAP.
In each run, the AMPA conductance of an activated synapse was
updated according to
gAMPA,i(rz1)~gAMPA,i(r) 1zk½Ca2z�T{½Ca2z�i(r)
½Ca2z�i(r)
� �ð9Þ
where gAMPA,i(r) and [Ca2+]i(r) are the AMPA conductance and
peak calcium at synapse i at run r; [Ca2+]T is the target peak
calcium value, which we set at 47.0 mM, the median of the peak
calcium in the scaled synapses simulation described above; and
k = 0.1 determines the speed with which the AMPA conductance
changes. Thus, in each run, the AMPA conductance changes
depending on the difference between the target peak calcium and
the current peak calcium; 500 runs were sufficient to create stable
synaptic strength in all spines.
Statistical analysisTo quantify the predictive power of each feature x for synapse
distance or attenuation y, we determined the least squares fit of the
distance or attenuation to a straight line y~mxzc or an
exponential y~Aekx. In each case the significant fit which gave
the higher R2 value was accepted.
Ethics statementAll animal use was approved by the Animal Welfare Committee
of the VU University Amsterdam.
Two-photon calcium imagingYoung adult male Wistar rats (P28–P42) were decapitated and
brain removed in ice cold slice solution containing (in mM):110
choline chloride, 11.6 Na-ascorbate, 3.10 Na-pyruvate, 2.50 KCL,
1.25 NaH2PO4, 7 MgCl2, 0.50 CaCl2, 10 glucose, 26 NaHCO3
[33]. 300 mm horizontal hippocampal slices were cut using a
LEICA VT1000S vibratome. Slices were transferred to a holding
chamber containing artificial cerebrospinal fluid (aCSF) contain-
ing (in mM): 125NaCl, 3 KCl, 1.2 NaH2PO4, 10 glucose and 26
NaHCO3, and heated at 34uC for 20 minutes before storing at
room temperature until recording started. All recordings were
made in 32uC aCSF.
Whole cell patch-clamp recordings were made from CA1
pyramidal cells using 2.5–4.5 MV glass pipettes filled with
intracellular solution containing (in mM): 154 K-gluconate, 1
KCl, 10 HEPES, 4 Mg-ATP, 4 K2 phosphocreatine, 0.4 GTP. In
some experiments, 0.2% biocytin was added for morphological
verification and K-gluconate was adjusted to 148 mM. Pipettes
were filled with intracellular solution containing Alexa-594
(80 mM) and the calcium dye, fluo-4 (200 mM) (Molecular Probes,
Invitrogen). Series resistance was not allowed to exceed 20 MVand was monitored throughout the recording. Fluorescent dyes
were allowed to diffuse into the cell for 20 minutes before
measurements began.
Dendrites were line-scanned bidirectionally at a frequency of
8 kHz, at various distances from the soma, using a LEICA RS2
two-photon laser scanning microscope with a 636objective and a
Synaptically-Induced BAP Predicts Synapse Location
PLoS Computational Biology | www.ploscompbiol.org 4 June 2012 | Volume 8 | Issue 6 | e1002545
Ti:Sapphire laser tuned to 830 nm excitation. Action potentials
were elicited in the soma by a 50 ms current pulse. Relative
fluorescence changes are given as the percentage change of Fluo-4
fluorescence from baseline relative to the stable, voltage-indepen-
dent Alexa-594 fluorescence as described before [34]. Three traces
were averaged per distance. A double exponential
f tð Þ~A e{t=tdecay{e{t=trise� �
was fitted to the signal to determine
the rise, decay and peak amplitude of the fluorescence signal. Fits
were regarded as significant when A was significant with a 99%
confidence interval.
At the end of the experiment, a z-stack was made of the neuron,
to reconstruct the dendritic tree. Using the open source program
ImageJ [35], the region of the dendritic tree scanned was traced
back to the soma in 3D based on fluorescence to determine the
actual distance travelled by the BAP.
In some experiments, the recorded cell filled with biocytin was
fixed in 4% paraformaldehyde at the end of the experiment, and
processed immunohistochemically with chromogen 3,39diamino-
benzidine tetrahydrochloride using the avidin–biotin–peroxidase
method. Two different CA1 pyramidal neuron dendritic mor-
phologies were selected for manual reconstruction using Neuro-
lucida (MicroBrightField). Neurolucida reconstructions were
directly imported into NEURON and are publicly available
together with the code of the model.
Results
Action potential back propagation following somaticcurrent injection
We measured BAP-induced calcium currents experimentally,
using multi-photon calcium imaging in hippocampal horizontal
slices (P28–P42). Calcium concentrations were measured in the
dendritic apical shaft at different distances after a BAP in CA1
hippocampal cells was induced by somatic current injection
(Fig. 1A). The BAP-induced amplitude of the calcium signal
decreased with distance along the apical shaft up to 400 mm, in
accordance with previous reports in mature CA1 hippocampal
neurons (Fig. 1B, C, [7,8]). This suggests that information about
distance, required to set up a dendritic democracy, could be
provided by calcium concentration.
However in vivo, action potentials are evoked by synaptic inputs
rather than by current injected directly into the soma. Synaptic
activity in the dendrites, which alters local dendritic excitability,
affects propagation of the resultant BAP into the same dendritic
region. Because slice experiments do not allow investigation of
synaptically-evoked BAPs, we adapted a realistic morphological
and electrophysiological model of a CA1 pyramidal cell (Fig. 1D)
[15,16]. Stimulating the model at the soma by current injection,
mimicking the experimental data described above, showed a
similar inverse relationship between local calcium influx at the
apical shaft and dendritic distance to that found in the experiment
(Fig. 1H). We therefore proceeded to use the model to test the
effect of synaptically-induced action potentials.
Peak calcium concentration is the best correlate ofsynaptic distance from the soma for synaptically-drivenbackpropagation
To test what effect synaptic stimulation could have on
backpropagation, BAPs were generated via synchronous synaptic
activation across the model CA1 neuron’s dendrites (Fig. 2A).
Voltage and calcium concentration were measured in the spines.
Synaptically-induced BAPs generated a markedly different pattern
of spatial-temporal kinetics than somatically-induced BAPs (Fig.
S1), with a smaller and lower range of peak calcium values for
somatic induction alone compared with synaptic stimulation (Fig.
S1M).
With synaptically-induced BAPs, synaptic stimulation caused an
initial depolarisation and influx of calcium into activated spines via
AMPA receptors and partially-unblocked NMDA receptors
(Fig. 2B–F). Arrival of the BAP at the spine head produced an
additional increase in local membrane potential and calcium
concentration via further unblocking of NMDA receptors and
opening of R-type voltage-gated calcium channels (Fig. 2B–F).
Because R-type channels have a high threshold for activation, the
calcium influx through R-type channels is more prominent in
proximal synapses than in distal synapses, in which the calcium
influx is mediated mainly through NMDA receptors (Fig. 2F).
We next tested whether features of the voltage or calcium
signals could provide a distance measure to the spines under these
in vivo-like stimulation conditions. We looked at the peak value, the
integral and the delay-to-peak of the calcium and voltage signals.
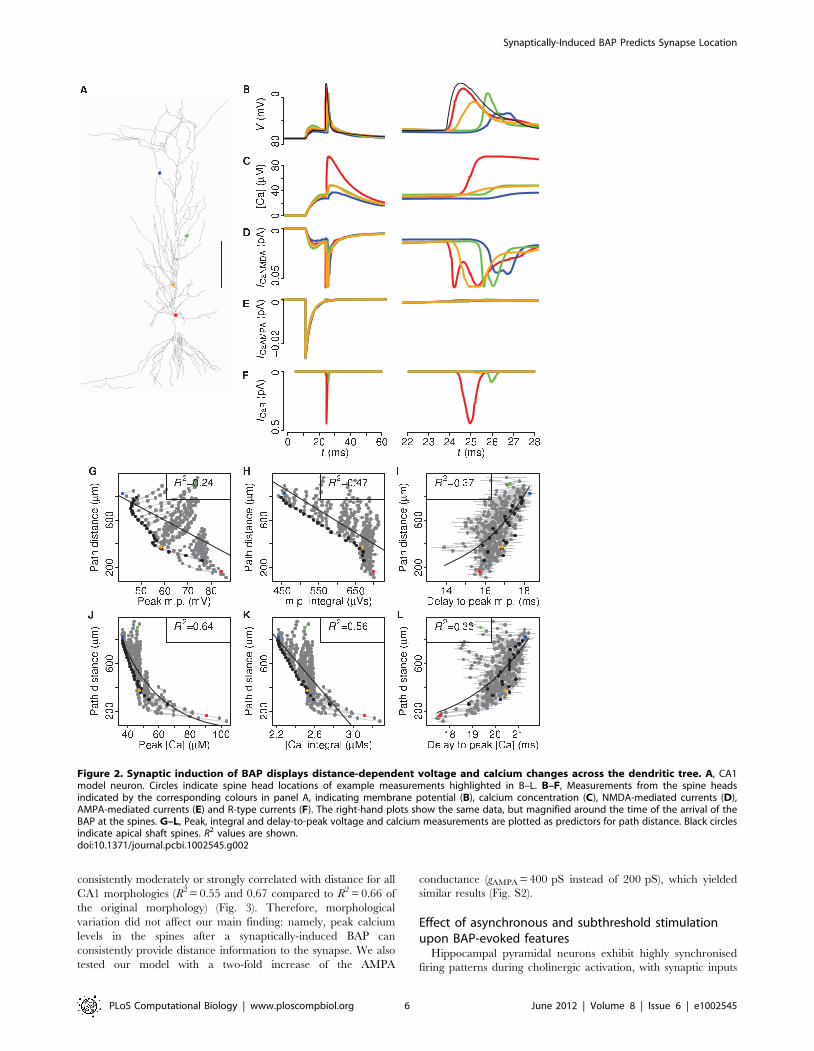
Surprisingly, peak voltage induced by the synaptically-driven BAP
was not a good correlate of synaptic distance, accounting for only
24% of the variance (Fig. 2G). Although the peak voltage
decreased with distance along the apical shaft, in agreement with
experimental observations [13,36] and model predictions for
passive dendrites [11,37], there was no good overall correlation of
peak voltage with distance. This can be explained by a difference
in BAP spread into the apical and oblique dendrites. In the apical
dendritic spines, peak voltage decreased with path distance from
the soma but this relationship was reversed when the BAP entered
the oblique dendritic spines (Fig. 2G). Consequently, for a given
BAP amplitude, there was a considerable range of potential
synapse distances, e.g. an amplitude of 70 mV only localised the
path distance between synapse and soma to within a range of 200–
850 mm.
In contrast, peak calcium levels in the stimulated spines were
good correlates of soma-synapse distance, with an exponential fit
explaining 64% of the variance (Fig. 2J). Unlike peak voltage, peak
calcium concentrations in oblique dendritic spines did not increase
strongly relative to those in spines on the apical shaft. Besides the
peak values, we also looked at the integrals of the voltage and
calcium signals in the spines. The integral of membrane voltage
showed a weaker correlation with distance (R2 = 0.47, Fig. 2H)
than peak calcium but substantially higher than peak membrane
voltage. Distal synapses showed lower integral values than
proximal synapses. Intriguingly, the integral of membrane
potential was relatively constant within an oblique dendrite, while
synapses along the apical shaft showed strong distance-dependent
modulation of the membrane potential integral. The calcium
integral showed a similar distance-dependent pattern, although
with a higher correlation (R2 = 0.56, Fig. 2K).
We further tested whether the time delay from onset of synaptic
stimulation to BAP arrival at the spine was a good correlate for
soma-synapse distance. Both delay-to-peak of BAP voltage and
delay-to-peak of calcium were only weakly correlated with synaptic
location (R2 = 0.37 and 0.33, Fig. 2I, L, respectively). Thus, for
synaptically-stimulated BAPs, peak calcium at the spine is the best
correlate of distance from the soma.
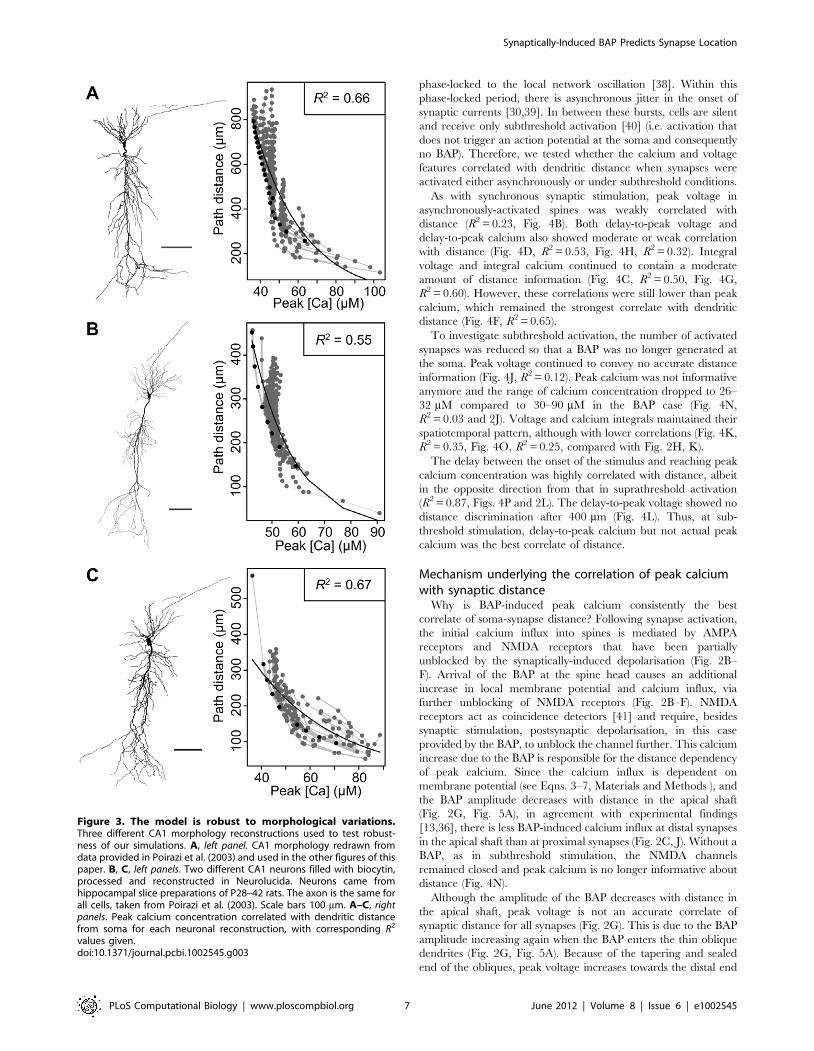
Simulation results are robust to different dendriticmorphologies and AMPA conductances
CA1 pyramidal neurons exhibit a wide variety of morphologies,
all characterised by a thick apical shaft with small oblique
dendrites at the sides. To test whether morphological variation in
CA1 pyramidal cells would influence our simulation results, we
repeated the simulation with the two other morphologies described
in Fig. 3. Across the different morphologies, peak calcium was
Synaptically-Induced BAP Predicts Synapse Location
PLoS Computational Biology | www.ploscompbiol.org 5 June 2012 | Volume 8 | Issue 6 | e1002545
consistently moderately or strongly correlated with distance for all
CA1 morphologies (R2 = 0.55 and 0.67 compared to R2 = 0.66 of
the original morphology) (Fig. 3). Therefore, morphological
variation did not affect our main finding: namely, peak calcium
levels in the spines after a synaptically-induced BAP can
consistently provide distance information to the synapse. We also
tested our model with a two-fold increase of the AMPA
conductance (gAMPA = 400 pS instead of 200 pS), which yielded
similar results (Fig. S2).
Effect of asynchronous and subthreshold stimulationupon BAP-evoked features
Hippocampal pyramidal neurons exhibit highly synchronised
firing patterns during cholinergic activation, with synaptic inputs
Figure 2. Synaptic induction of BAP displays distance-dependent voltage and calcium changes across the dendritic tree. A, CA1model neuron. Circles indicate spine head locations of example measurements highlighted in B–L. B–F, Measurements from the spine headsindicated by the corresponding colours in panel A, indicating membrane potential (B), calcium concentration (C), NMDA-mediated currents (D),AMPA-mediated currents (E) and R-type currents (F). The right-hand plots show the same data, but magnified around the time of the arrival of theBAP at the spines. G–L, Peak, integral and delay-to-peak voltage and calcium measurements are plotted as predictors for path distance. Black circlesindicate apical shaft spines. R2 values are shown.doi:10.1371/journal.pcbi.1002545.g002
Synaptically-Induced BAP Predicts Synapse Location
PLoS Computational Biology | www.ploscompbiol.org 6 June 2012 | Volume 8 | Issue 6 | e1002545
phase-locked to the local network oscillation [38]. Within this
phase-locked period, there is asynchronous jitter in the onset of
synaptic currents [30,39]. In between these bursts, cells are silent
and receive only subthreshold activation [40] (i.e. activation that
does not trigger an action potential at the soma and consequently
no BAP). Therefore, we tested whether the calcium and voltage
features correlated with dendritic distance when synapses were
activated either asynchronously or under subthreshold conditions.
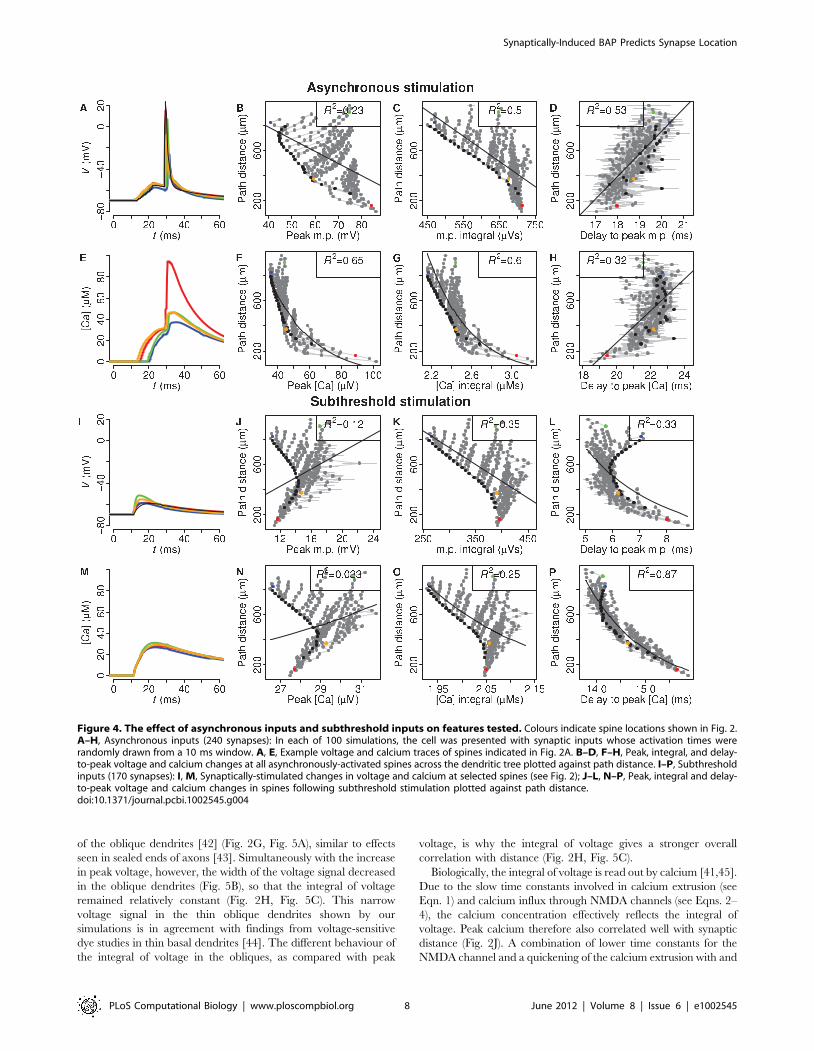
As with synchronous synaptic stimulation, peak voltage in
asynchronously-activated spines was weakly correlated with
distance (R2 = 0.23, Fig. 4B). Both delay-to-peak voltage and
delay-to-peak calcium also showed moderate or weak correlation
with distance (Fig. 4D, R2 = 0.53, Fig. 4H, R2 = 0.32). Integral
voltage and integral calcium continued to contain a moderate
amount of distance information (Fig. 4C, R2 = 0.50, Fig. 4G,
R2 = 0.60). However, these correlations were still lower than peak
calcium, which remained the strongest correlate with dendritic
distance (Fig. 4F, R2 = 0.65).
To investigate subthreshold activation, the number of activated
synapses was reduced so that a BAP was no longer generated at
the soma. Peak voltage continued to convey no accurate distance
information (Fig. 4J, R2 = 0.12). Peak calcium was not informative
anymore and the range of calcium concentration dropped to 26–
32 mM compared to 30–90 mM in the BAP case (Fig. 4N,
R2 = 0.03 and 2J). Voltage and calcium integrals maintained their
spatiotemporal pattern, although with lower correlations (Fig. 4K,
R2 = 0.35, Fig. 4O, R2 = 0.25, compared with Fig. 2H, K).
The delay between the onset of the stimulus and reaching peak
calcium concentration was highly correlated with distance, albeit
in the opposite direction from that in suprathreshold activation
(R2 = 0.87, Figs. 4P and 2L). The delay-to-peak voltage showed no
distance discrimination after 400 mm (Fig. 4L). Thus, at sub-
threshold stimulation, delay-to-peak calcium but not actual peak
calcium was the best correlate of distance.
Mechanism underlying the correlation of peak calciumwith synaptic distance
Why is BAP-induced peak calcium consistently the best
correlate of soma-synapse distance? Following synapse activation,
the initial calcium influx into spines is mediated by AMPA
receptors and NMDA receptors that have been partially
unblocked by the synaptically-induced depolarisation (Fig. 2B–
F). Arrival of the BAP at the spine head causes an additional
increase in local membrane potential and calcium influx, via
further unblocking of NMDA receptors (Fig. 2B–F). NMDA
receptors act as coincidence detectors [41] and require, besides
synaptic stimulation, postsynaptic depolarisation, in this case
provided by the BAP, to unblock the channel further. This calcium
increase due to the BAP is responsible for the distance dependency
of peak calcium. Since the calcium influx is dependent on
membrane potential (see Eqns. 3–7, Materials and Methods ), and
the BAP amplitude decreases with distance in the apical shaft
(Fig. 2G, Fig. 5A), in agreement with experimental findings
[13,36], there is less BAP-induced calcium influx at distal synapses
in the apical shaft than at proximal synapses (Fig. 2C, J). Without a
BAP, as in subthreshold stimulation, the NMDA channels
remained closed and peak calcium is no longer informative about
distance (Fig. 4N).
Although the amplitude of the BAP decreases with distance in
the apical shaft, peak voltage is not an accurate correlate of
synaptic distance for all synapses (Fig. 2G). This is due to the BAP
amplitude increasing again when the BAP enters the thin oblique
dendrites (Fig. 2G, Fig. 5A). Because of the tapering and sealed
end of the obliques, peak voltage increases towards the distal end
Figure 3. The model is robust to morphological variations.Three different CA1 morphology reconstructions used to test robust-ness of our simulations. A, left panel. CA1 morphology redrawn fromdata provided in Poirazi et al. (2003) and used in the other figures of thispaper. B, C, left panels. Two different CA1 neurons filled with biocytin,processed and reconstructed in Neurolucida. Neurons came fromhippocampal slice preparations of P28–42 rats. The axon is the same forall cells, taken from Poirazi et al. (2003). Scale bars 100 mm. A–C, rightpanels. Peak calcium concentration correlated with dendritic distancefrom soma for each neuronal reconstruction, with corresponding R2
values given.doi:10.1371/journal.pcbi.1002545.g003
Synaptically-Induced BAP Predicts Synapse Location
PLoS Computational Biology | www.ploscompbiol.org 7 June 2012 | Volume 8 | Issue 6 | e1002545
of the oblique dendrites [42] (Fig. 2G, Fig. 5A), similar to effects
seen in sealed ends of axons [43]. Simultaneously with the increase
in peak voltage, however, the width of the voltage signal decreased
in the oblique dendrites (Fig. 5B), so that the integral of voltage
remained relatively constant (Fig. 2H, Fig. 5C). This narrow
voltage signal in the thin oblique dendrites shown by our
simulations is in agreement with findings from voltage-sensitive
dye studies in thin basal dendrites [44]. The different behaviour of
the integral of voltage in the obliques, as compared with peak
voltage, is why the integral of voltage gives a stronger overall
correlation with distance (Fig. 2H, Fig. 5C).
Biologically, the integral of voltage is read out by calcium [41,45].
Due to the slow time constants involved in calcium extrusion (see
Eqn. 1) and calcium influx through NMDA channels (see Eqns. 2–
4), the calcium concentration effectively reflects the integral of
voltage. Peak calcium therefore also correlated well with synaptic
distance (Fig. 2J). A combination of lower time constants for the
NMDA channel and a quickening of the calcium extrusion with and
Figure 4. The effect of asynchronous inputs and subthreshold inputs on features tested. Colours indicate spine locations shown in Fig. 2.A–H, Asynchronous inputs (240 synapses): In each of 100 simulations, the cell was presented with synaptic inputs whose activation times wererandomly drawn from a 10 ms window. A, E, Example voltage and calcium traces of spines indicated in Fig. 2A. B–D, F–H, Peak, integral, and delay-to-peak voltage and calcium changes at all asynchronously-activated spines across the dendritic tree plotted against path distance. I–P, Subthresholdinputs (170 synapses): I, M, Synaptically-stimulated changes in voltage and calcium at selected spines (see Fig. 2); J–L, N–P, Peak, integral and delay-to-peak voltage and calcium changes in spines following subthreshold stimulation plotted against path distance.doi:10.1371/journal.pcbi.1002545.g004
Synaptically-Induced BAP Predicts Synapse Location
PLoS Computational Biology | www.ploscompbiol.org 8 June 2012 | Volume 8 | Issue 6 | e1002545
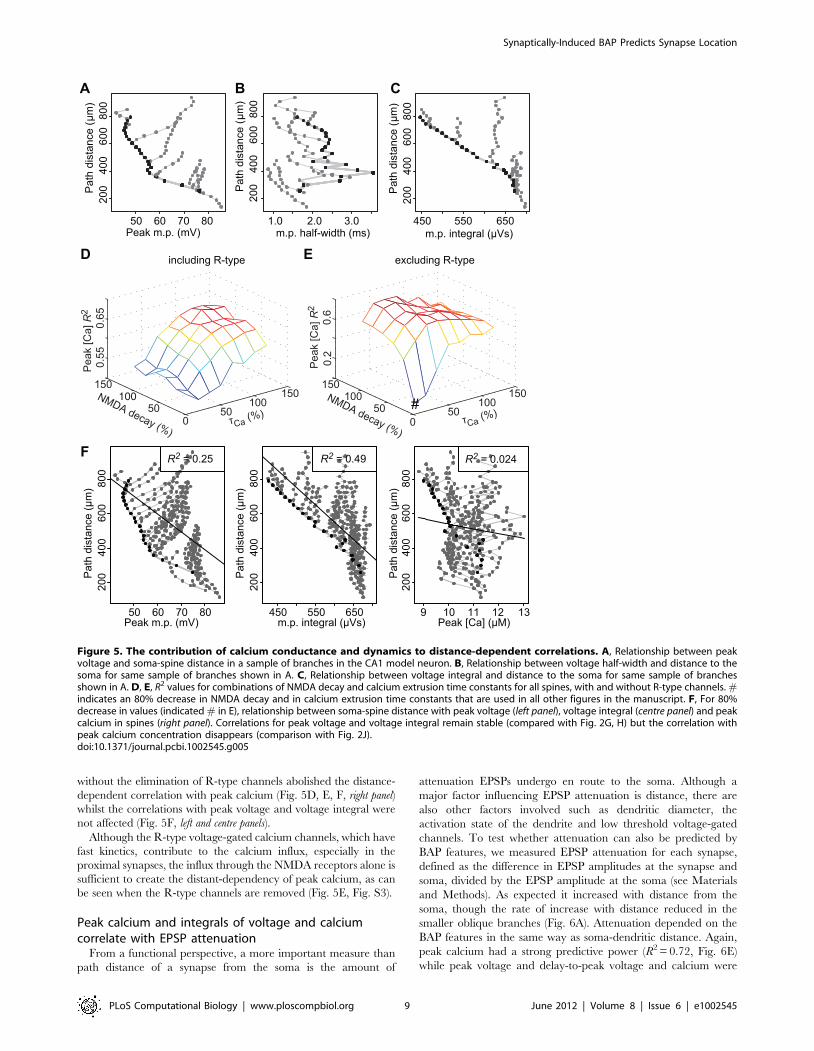
without the elimination of R-type channels abolished the distance-
dependent correlation with peak calcium (Fig. 5D, E, F, right panel)
whilst the correlations with peak voltage and voltage integral were
not affected (Fig. 5F, left and centre panels).
Although the R-type voltage-gated calcium channels, which have
fast kinetics, contribute to the calcium influx, especially in the
proximal synapses, the influx through the NMDA receptors alone is
sufficient to create the distant-dependency of peak calcium, as can
be seen when the R-type channels are removed (Fig. 5E, Fig. S3).
Peak calcium and integrals of voltage and calciumcorrelate with EPSP attenuation
From a functional perspective, a more important measure than
path distance of a synapse from the soma is the amount of
attenuation EPSPs undergo en route to the soma. Although a
major factor influencing EPSP attenuation is distance, there are
also other factors involved such as dendritic diameter, the
activation state of the dendrite and low threshold voltage-gated
channels. To test whether attenuation can also be predicted by
BAP features, we measured EPSP attenuation for each synapse,
defined as the difference in EPSP amplitudes at the synapse and
soma, divided by the EPSP amplitude at the soma (see Materials
and Methods). As expected it increased with distance from the
soma, though the rate of increase with distance reduced in the
smaller oblique branches (Fig. 6A). Attenuation depended on the
BAP features in the same way as soma-dendritic distance. Again,
peak calcium had a strong predictive power (R2 = 0.72, Fig. 6E)
while peak voltage and delay-to-peak voltage and calcium were
Figure 5. The contribution of calcium conductance and dynamics to distance-dependent correlations. A, Relationship between peakvoltage and soma-spine distance in a sample of branches in the CA1 model neuron. B, Relationship between voltage half-width and distance to thesoma for same sample of branches shown in A. C, Relationship between voltage integral and distance to the soma for same sample of branchesshown in A. D, E, R2 values for combinations of NMDA decay and calcium extrusion time constants for all spines, with and without R-type channels. #indicates an 80% decrease in NMDA decay and in calcium extrusion time constants that are used in all other figures in the manuscript. F, For 80%decrease in values (indicated # in E), relationship between soma-spine distance with peak voltage (left panel), voltage integral (centre panel) and peakcalcium in spines (right panel). Correlations for peak voltage and voltage integral remain stable (compared with Fig. 2G, H) but the correlation withpeak calcium concentration disappears (comparison with Fig. 2J).doi:10.1371/journal.pcbi.1002545.g005
Synaptically-Induced BAP Predicts Synapse Location
PLoS Computational Biology | www.ploscompbiol.org 9 June 2012 | Volume 8 | Issue 6 | e1002545
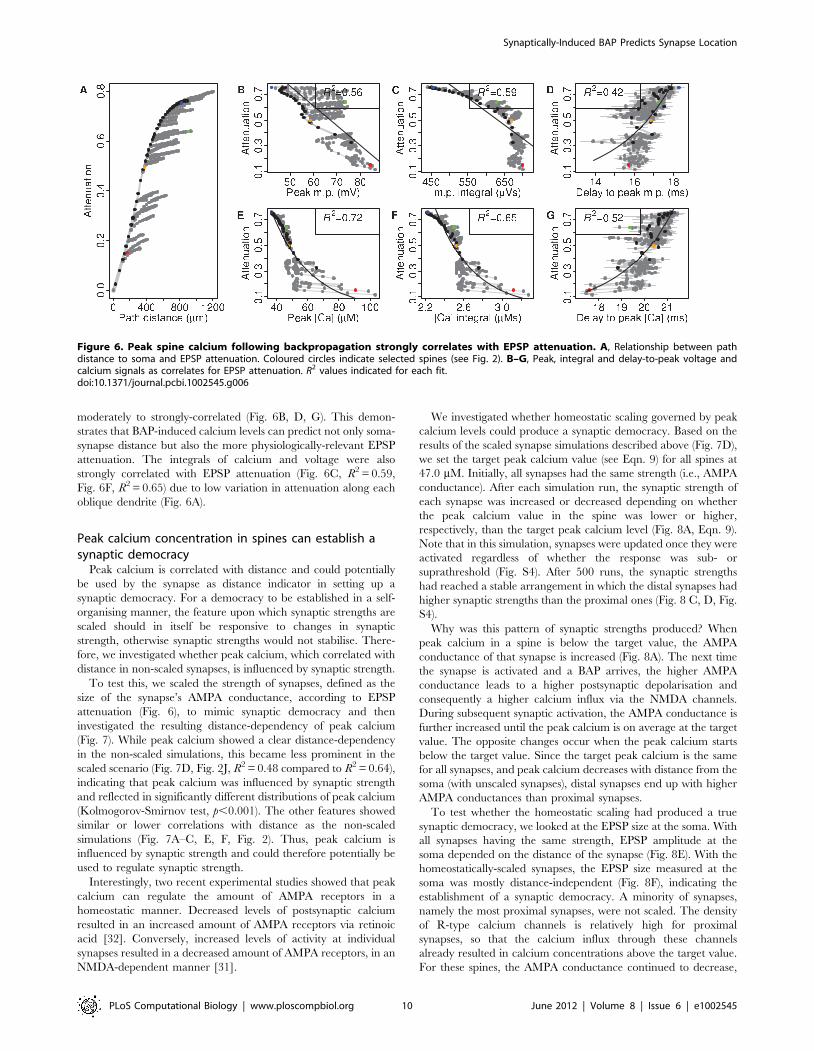
moderately to strongly-correlated (Fig. 6B, D, G). This demon-
strates that BAP-induced calcium levels can predict not only soma-
synapse distance but also the more physiologically-relevant EPSP
attenuation. The integrals of calcium and voltage were also
strongly correlated with EPSP attenuation (Fig. 6C, R2 = 0.59,
Fig. 6F, R2 = 0.65) due to low variation in attenuation along each
oblique dendrite (Fig. 6A).
Peak calcium concentration in spines can establish asynaptic democracy
Peak calcium is correlated with distance and could potentially
be used by the synapse as distance indicator in setting up a
synaptic democracy. For a democracy to be established in a self-
organising manner, the feature upon which synaptic strengths are
scaled should in itself be responsive to changes in synaptic
strength, otherwise synaptic strengths would not stabilise. There-
fore, we investigated whether peak calcium, which correlated with
distance in non-scaled synapses, is influenced by synaptic strength.
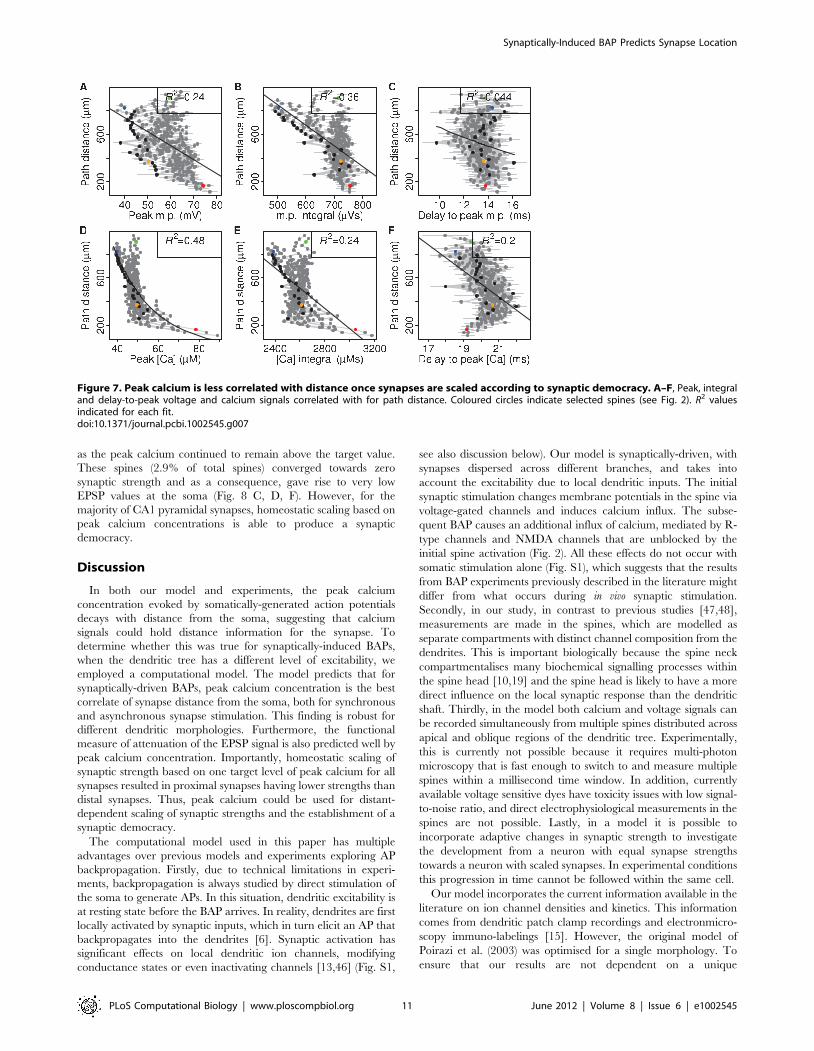
To test this, we scaled the strength of synapses, defined as the
size of the synapse’s AMPA conductance, according to EPSP
attenuation (Fig. 6), to mimic synaptic democracy and then
investigated the resulting distance-dependency of peak calcium
(Fig. 7). While peak calcium showed a clear distance-dependency
in the non-scaled simulations, this became less prominent in the
scaled scenario (Fig. 7D, Fig. 2J, R2 = 0.48 compared to R2 = 0.64),
indicating that peak calcium was influenced by synaptic strength
and reflected in significantly different distributions of peak calcium
(Kolmogorov-Smirnov test, p,0.001). The other features showed
similar or lower correlations with distance as the non-scaled
simulations (Fig. 7A–C, E, F, Fig. 2). Thus, peak calcium is
influenced by synaptic strength and could therefore potentially be
used to regulate synaptic strength.
Interestingly, two recent experimental studies showed that peak
calcium can regulate the amount of AMPA receptors in a
homeostatic manner. Decreased levels of postsynaptic calcium
resulted in an increased amount of AMPA receptors via retinoic
acid [32]. Conversely, increased levels of activity at individual
synapses resulted in a decreased amount of AMPA receptors, in an
NMDA-dependent manner [31].
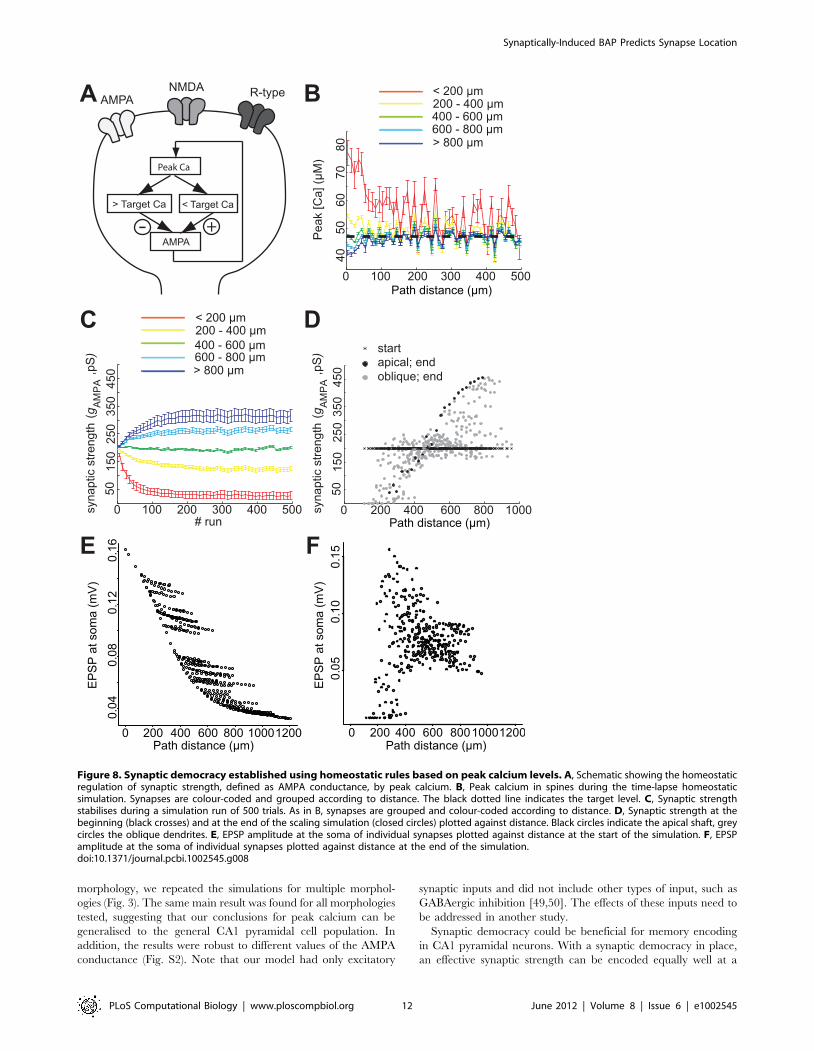
We investigated whether homeostatic scaling governed by peak
calcium levels could produce a synaptic democracy. Based on the
results of the scaled synapse simulations described above (Fig. 7D),
we set the target peak calcium value (see Eqn. 9) for all spines at
47.0 mM. Initially, all synapses had the same strength (i.e., AMPA
conductance). After each simulation run, the synaptic strength of
each synapse was increased or decreased depending on whether
the peak calcium value in the spine was lower or higher,
respectively, than the target peak calcium level (Fig. 8A, Eqn. 9).
Note that in this simulation, synapses were updated once they were
activated regardless of whether the response was sub- or
suprathreshold (Fig. S4). After 500 runs, the synaptic strengths
had reached a stable arrangement in which the distal synapses had
higher synaptic strengths than the proximal ones (Fig. 8 C, D, Fig.
S4).
Why was this pattern of synaptic strengths produced? When
peak calcium in a spine is below the target value, the AMPA
conductance of that synapse is increased (Fig. 8A). The next time
the synapse is activated and a BAP arrives, the higher AMPA
conductance leads to a higher postsynaptic depolarisation and
consequently a higher calcium influx via the NMDA channels.
During subsequent synaptic activation, the AMPA conductance is
further increased until the peak calcium is on average at the target
value. The opposite changes occur when the peak calcium starts
below the target value. Since the target peak calcium is the same
for all synapses, and peak calcium decreases with distance from the
soma (with unscaled synapses), distal synapses end up with higher
AMPA conductances than proximal synapses.
To test whether the homeostatic scaling had produced a true
synaptic democracy, we looked at the EPSP size at the soma. With
all synapses having the same strength, EPSP amplitude at the
soma depended on the distance of the synapse (Fig. 8E). With the
homeostatically-scaled synapses, the EPSP size measured at the
soma was mostly distance-independent (Fig. 8F), indicating the
establishment of a synaptic democracy. A minority of synapses,
namely the most proximal synapses, were not scaled. The density
of R-type calcium channels is relatively high for proximal
synapses, so that the calcium influx through these channels
already resulted in calcium concentrations above the target value.
For these spines, the AMPA conductance continued to decrease,
Figure 6. Peak spine calcium following backpropagation strongly correlates with EPSP attenuation. A, Relationship between pathdistance to soma and EPSP attenuation. Coloured circles indicate selected spines (see Fig. 2). B–G, Peak, integral and delay-to-peak voltage andcalcium signals as correlates for EPSP attenuation. R2 values indicated for each fit.doi:10.1371/journal.pcbi.1002545.g006
Synaptically-Induced BAP Predicts Synapse Location
PLoS Computational Biology | www.ploscompbiol.org 10 June 2012 | Volume 8 | Issue 6 | e1002545
as the peak calcium continued to remain above the target value.
These spines (2.9% of total spines) converged towards zero
synaptic strength and as a consequence, gave rise to very low
EPSP values at the soma (Fig. 8 C, D, F). However, for the
majority of CA1 pyramidal synapses, homeostatic scaling based on
peak calcium concentrations is able to produce a synaptic
democracy.
Discussion
In both our model and experiments, the peak calcium
concentration evoked by somatically-generated action potentials
decays with distance from the soma, suggesting that calcium
signals could hold distance information for the synapse. To
determine whether this was true for synaptically-induced BAPs,
when the dendritic tree has a different level of excitability, we
employed a computational model. The model predicts that for
synaptically-driven BAPs, peak calcium concentration is the best
correlate of synapse distance from the soma, both for synchronous
and asynchronous synapse stimulation. This finding is robust for
different dendritic morphologies. Furthermore, the functional
measure of attenuation of the EPSP signal is also predicted well by
peak calcium concentration. Importantly, homeostatic scaling of
synaptic strength based on one target level of peak calcium for all
synapses resulted in proximal synapses having lower strengths than
distal synapses. Thus, peak calcium could be used for distant-
dependent scaling of synaptic strengths and the establishment of a
synaptic democracy.
The computational model used in this paper has multiple
advantages over previous models and experiments exploring AP
backpropagation. Firstly, due to technical limitations in experi-
ments, backpropagation is always studied by direct stimulation of
the soma to generate APs. In this situation, dendritic excitability is
at resting state before the BAP arrives. In reality, dendrites are first
locally activated by synaptic inputs, which in turn elicit an AP that
backpropagates into the dendrites [6]. Synaptic activation has
significant effects on local dendritic ion channels, modifying
conductance states or even inactivating channels [13,46] (Fig. S1,
see also discussion below). Our model is synaptically-driven, with
synapses dispersed across different branches, and takes into
account the excitability due to local dendritic inputs. The initial
synaptic stimulation changes membrane potentials in the spine via
voltage-gated channels and induces calcium influx. The subse-
quent BAP causes an additional influx of calcium, mediated by R-
type channels and NMDA channels that are unblocked by the
initial spine activation (Fig. 2). All these effects do not occur with
somatic stimulation alone (Fig. S1), which suggests that the results
from BAP experiments previously described in the literature might
differ from what occurs during in vivo synaptic stimulation.
Secondly, in our study, in contrast to previous studies [47,48],
measurements are made in the spines, which are modelled as
separate compartments with distinct channel composition from the
dendrites. This is important biologically because the spine neck
compartmentalises many biochemical signalling processes within
the spine head [10,19] and the spine head is likely to have a more
direct influence on the local synaptic response than the dendritic
shaft. Thirdly, in the model both calcium and voltage signals can
be recorded simultaneously from multiple spines distributed across
apical and oblique regions of the dendritic tree. Experimentally,
this is currently not possible because it requires multi-photon
microscopy that is fast enough to switch to and measure multiple
spines within a millisecond time window. In addition, currently
available voltage sensitive dyes have toxicity issues with low signal-
to-noise ratio, and direct electrophysiological measurements in the
spines are not possible. Lastly, in a model it is possible to
incorporate adaptive changes in synaptic strength to investigate
the development from a neuron with equal synapse strengths
towards a neuron with scaled synapses. In experimental conditions
this progression in time cannot be followed within the same cell.
Our model incorporates the current information available in the
literature on ion channel densities and kinetics. This information
comes from dendritic patch clamp recordings and electronmicro-
scopy immuno-labelings [15]. However, the original model of
Poirazi et al. (2003) was optimised for a single morphology. To
ensure that our results are not dependent on a unique
Figure 7. Peak calcium is less correlated with distance once synapses are scaled according to synaptic democracy. A–F, Peak, integraland delay-to-peak voltage and calcium signals correlated with for path distance. Coloured circles indicate selected spines (see Fig. 2). R2 valuesindicated for each fit.doi:10.1371/journal.pcbi.1002545.g007
Synaptically-Induced BAP Predicts Synapse Location
PLoS Computational Biology | www.ploscompbiol.org 11 June 2012 | Volume 8 | Issue 6 | e1002545
morphology, we repeated the simulations for multiple morphol-
ogies (Fig. 3). The same main result was found for all morphologies
tested, suggesting that our conclusions for peak calcium can be
generalised to the general CA1 pyramidal cell population. In
addition, the results were robust to different values of the AMPA
conductance (Fig. S2). Note that our model had only excitatory
synaptic inputs and did not include other types of input, such as
GABAergic inhibition [49,50]. The effects of these inputs need to
be addressed in another study.
Synaptic democracy could be beneficial for memory encoding
in CA1 pyramidal neurons. With a synaptic democracy in place,
an effective synaptic strength can be encoded equally well at a
Figure 8. Synaptic democracy established using homeostatic rules based on peak calcium levels. A, Schematic showing the homeostaticregulation of synaptic strength, defined as AMPA conductance, by peak calcium. B, Peak calcium in spines during the time-lapse homeostaticsimulation. Synapses are colour-coded and grouped according to distance. The black dotted line indicates the target level. C, Synaptic strengthstabilises during a simulation run of 500 trials. As in B, synapses are grouped and colour-coded according to distance. D, Synaptic strength at thebeginning (black crosses) and at the end of the scaling simulation (closed circles) plotted against distance. Black circles indicate the apical shaft, greycircles the oblique dendrites. E, EPSP amplitude at the soma of individual synapses plotted against distance at the start of the simulation. F, EPSPamplitude at the soma of individual synapses plotted against distance at the end of the simulation.doi:10.1371/journal.pcbi.1002545.g008
Synaptically-Induced BAP Predicts Synapse Location
PLoS Computational Biology | www.ploscompbiol.org 12 June 2012 | Volume 8 | Issue 6 | e1002545
distal synapse as at a proximal synapse, so that a neuron will have
many equivalent synapses at its disposal. Another type of large
pyramidal cell, the layer 5 neocortical pyramidal cell, does not
have synaptic democracy [51]. This may be understood from a
functional perspective: layer 5 pyramidal cells receive axonal
inputs from different layers, each impinging at different but highly
localised areas of the dendrite. These inputs convey different types
of information and need to be processed differently, either via
classical EPSP summation at the soma or via NMDA or calcium
spikes in the dendrites [49,52]. In contrast, CA1 pyramidal
neurons receive axonal inputs from a single layer, CA3, and the
inputs are widely dispersed over the dendrite [1]. If all these inputs
need to be treated equally, CA1 neurons would benefit from a
synaptic democracy.
Distance-dependent synaptic scaling was first shown in slice
preparations using combined dendritic and somatic patch
recording [3]. London and Segev [53] challenged whether the
synaptic scaling observed in vitro could give rise to a true synaptic
democracy in vivo, pointing out that slice preparations have
artificially low levels of synaptic background activity. Their
computational model showed that the scaling seen in vivo [3]
would be insufficient to counteract the attenuation when in vivo like
background activity is present. However, in contrast with our
model, their model did not contain active channels, which,
crucially, affect EPSP attenuation, and they used only subthresh-
old synaptic stimulation. In our model, background activity is
present in the form of suprathreshold synaptic stimulation that
triggers a BAP.
The conclusions from our model simulations should be regarded
as a hypothesis, which could be tested experimentally once the
field has developed a suitable technique to stimulate many
synapses simultaneously to elicit an action potential. The most
promising technique for doing this is glutamate uncaging
combined with a piezo-controlled laser system that can quickly
jump from one spine to the next to stimulate and measure
hundreds of spines simultaneously [54]. We tested whether a few
activated spines together with a somatically-induced action
potential would be able to mimic a synaptically-induced BAP in
an experimental setting. Compared with a synaptically-induced
BAP, both a somatically-induced BAP and a combination of a
somatically-induced BAP and synaptic stimulation produced a
different voltage pattern across the dendrites (Fig. S1). Peak
calcium is lower and the spread of membrane depolarisation into
the oblique dendrites is different. In contrast, synaptic stimulation
combined with a somatically-induced BAP would be a valid way to
mimic the calcium signals in spines after a synaptically-induced
BAP (Fig. S1D, I). The calcium signal in spines induced by a
somatically-evoked BAP is only a fraction of what is induced by a
synaptically-evoked BAP, with some distal synapses even lacking
calcium influx altogether (Fig. S1M). However, note that a
somatically-evoked BAP alone combined with the stimulation of a
few synapses will lead to a great variability in spine calcium
concentrations, depending upon the precise timing of the BAP
relative to synapse activation across the dendritic tree.
In general, the timing and amplitude of signals are employed in
a wide range of biological processes, such as protein synthesis and
gene regulation [31,55]. For neurons, membrane voltage and
calcium concentration are important signals, which can open ion
channels, evoke action potentials, trigger signalling cascades and
activate protein synthesis [32,56]. We therefore investigated which
aspects of the calcium and voltage signals, namely their peak,
integral and timing, could be used to establish a distance-
dependent synaptic scaling (synaptic democracy). Surprisingly,
we found that the peak voltage of the AP as it backpropagated into
the dendritic tree was not a strong predictor of synapse location.
The main reason for this low predictability is the differential
propagation along the apical shaft and secondary/tertiary
dendrites. In the apical shaft, BAP amplitude decreases with
distance, in agreement with our experimental data and that of
others [7,42,47], but increases when entering the oblique dendrites
[57].
The time delay between synapse activation and BAP arrival,
important for spike timing-dependent plasticity (STDP), has been
hypothesised to be a signal for creating a synaptic democracy [58].
We observed that the delay-to-peak calcium is a predictor for
synapse location only in subthreshold conditions (Fig. 4P) and is
weakly correlated with distance in suprathreshold conditions. In
addition, using delay-to-peak calcium or delay-to-peak voltage as a
distance indicator would be problematic because with both these
features the correlation with distance is in opposite directions for
sub- and suprathreshold conditions (Fig. 2L, Fig. 4P, Table 1).
This implies that a scaling process based on time-delay features
would receive conflicting information with alternate subthreshold
and suprathreshold inputs.
It was previously proposed that a reverse STDP rule is required
to set up synaptic democracy, followed by a switch to classical
STDP rules in the adult CA1 pyramidal cell [58]. However, many
studies show that the hippocampus uses classical STDP rules at
CA3-CA1 synapses in both juvenile and adult stages [59–61].
Thus, no experimental evidence exists to-date for a developmental
switch. Moreover, reverse STDP rules only at juvenile stages
would make it difficult to accommodate new spines, which are
regularly created in the adult neuron [62]. These new spines
would not be scaled and would therefore behave differently from
the other spines. Another modelling study showed that a distance-
dependent STDP rule could also result in synaptic democracy
[63]. However this mechanism would still require an internal
signalling of distance to the spines to set the distance dependence
learning rules. Our study, in contrast, has the same learning rule
for all synapses.
For non-scaled synapses, peak calcium in spines showed the
strongest correlation with distance (Figs. 2J, 3, 4F), with higher
calcium concentrations in proximal synapses than in distal
synapses, suggesting that this feature could be used for distance-
dependent synaptic scaling. The high correlation of peak calcium
with distance can be explained by the integrative properties of
calcium, reflecting the integral of voltage rather than peak voltage
(Fig. 5). Peak calcium was also strongly correlated with EPSP
attenuation. However, when the neuron received only subthresh-
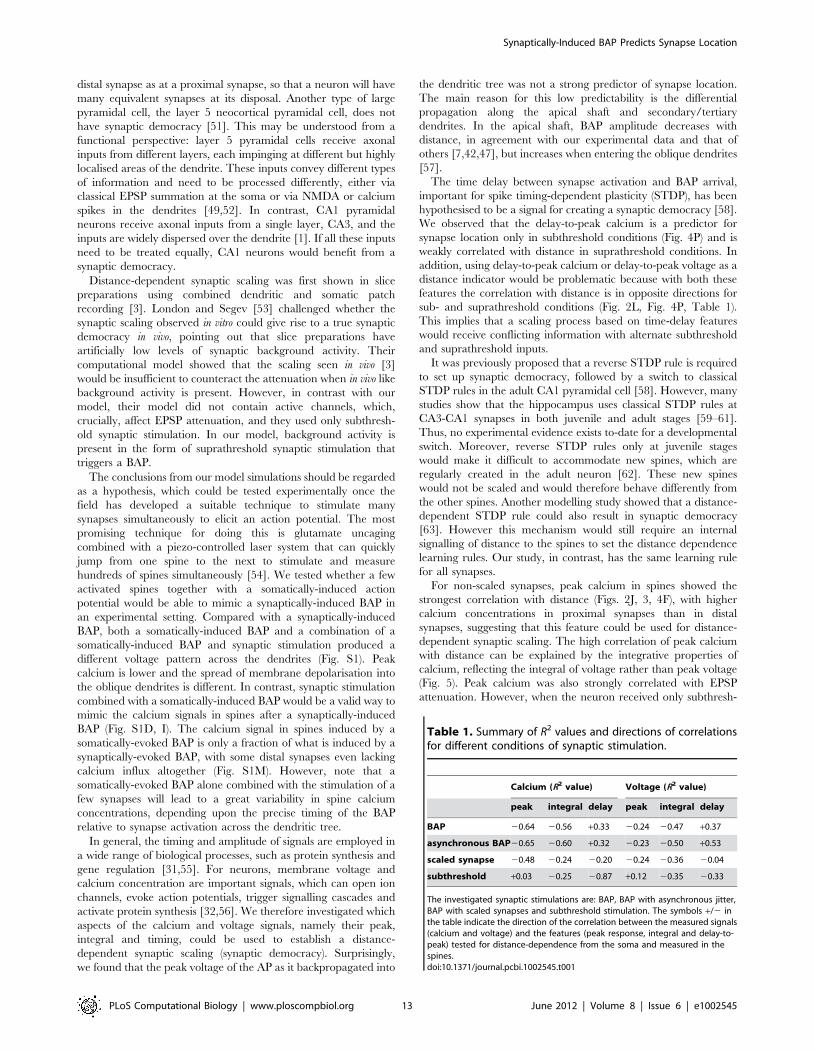
Table 1. Summary of R2 values and directions of correlationsfor different conditions of synaptic stimulation.
Calcium (R2 value) Voltage (R2 value)
peak integral delay peak integral delay
BAP 20.64 20.56 +0.33 20.24 20.47 +0.37
asynchronous BAP20.65 20.60 +0.32 20.23 20.50 +0.53
scaled synapse 20.48 20.24 20.20 20.24 20.36 20.04
subthreshold +0.03 20.25 20.87 +0.12 20.35 20.33
The investigated synaptic stimulations are: BAP, BAP with asynchronous jitter,BAP with scaled synapses and subthreshold stimulation. The symbols +/2 inthe table indicate the direction of the correlation between the measured signals(calcium and voltage) and the features (peak response, integral and delay-to-peak) tested for distance-dependence from the soma and measured in thespines.doi:10.1371/journal.pcbi.1002545.t001
Synaptically-Induced BAP Predicts Synapse Location
PLoS Computational Biology | www.ploscompbiol.org 13 June 2012 | Volume 8 | Issue 6 | e1002545
old activation (i.e. no BAP was generated), peak calcium was much
lower and did not show distance dependence (Fig. 4N, Table 1).
Importantly, using one target calcium level for all synapses and a
homoeostatic scaling of AMPA conductances based on peak
calcium resulted in a neuron with a self-organising form of
synaptic democracy.
Homeostatic scaling of synapses based on peak calcium is an
attractive and biologically plausible mechanism for creating a
synaptic democracy. Firstly, calcium has been shown to regulate
protein transcription, protein modulation and protein insertion
[55]. Recently, two studies have shown that AMPA receptor
expression at the synapse is homeostatically regulated by calcium
[31,32]. Reduced levels of postsynaptic calcium stimulate the
production of retinoic acid, which in turn increase AMPA
conductance [32]. Conversely, increased levels of activity in
individual synapses of hippocampal cultures resulted in decreased
AMPA receptor expression in a NMDA-dependent manner [31].
Secondly, homeostatic scaling takes place on a time scale of days,
allowing synaptic changes governed by mechanisms such as STDP
to occur on a shorter time scale. Thirdly, the system is dynamic
and the same scaling rule can be used for all synapses
independently of distance, so that newly-created synapses can
scale themselves within an existing synaptic democracy.
In summary, our synaptically-driven model suggests that peak
calcium levels in the spines are a strong predictor of the distance of
a synapse from the soma and the level of attenuation its EPSP
undergoes. It is robust to varying levels of activity, different
dendritic morphologies and applies to both larger apical dendrites
and smaller distal and oblique dendrites. Our results show that a
form of homeostatic synaptic self-regulation, in which the synapse
can utilise the BAP-induced peak calcium to adjust its strength,
results in a synaptic democracy, where all synapses are equally
heard at the soma.
Supporting Information
Figure S1 Comparison of different BAP inductionparadigms. A–E, Synaptically-induced back propagation. F–J,Somatic action potential induced by somatic current injection
13 ms after a stimulation of a small number of synapses. The
EPSP-AP delay was 16.1+/21.7 ms compared to 16.6+/20.7 ms
in Fig. 2. K–M, Somatically-induced action potential. A, F, K,Illustration of the different BAP induction paradigms. Stars
represent synaptic stimulation. Arrows indicate propagation to
and from the soma. B, G, L, Correlations of distance to soma
plotted against peak voltage measured at the spine. C, H,Correlations of distance to soma plotted against delay-to-peak
voltage (defined as the time between the stimulation of the synapse
and the peak of membrane potential). Note that this is not defined
for synapses for the somatically-induced BAP as in K. D, I, M,Correlations of distance to soma plotted against peak calcium
concentration. E, J, Correlations of distance to soma plotted
against delay-to-peak calcium values.
(EPS)
Figure S2 Correlations of features with distance arerobust to increased synaptic AMPA conductance. Synaptic
AMPA strength at all spines was doubled from 200 pS to 400 pS.
A–F, Peak, integral and delay-to-peak voltage and calcium signals
correlations against path distance. Coloured circles indicate
selected spines (see Fig. 2). R2 values indicated for each fit.
(EPS)
Figure S3 Synaptically-induced BAP without R-typechannels. A, CA1 model neuron. Circles indicate spine head
locations of example measurements highlighted in B–L. B–F,
Measurements from the spine heads indicated by the correspond-
ing colours in panel A, indicating membrane potential (B), calcium
concentration (C), NMDA-mediated currents (D), AMPA-medi-
ated currents (E) and R-type currents (F). The right-hand plots
show the same data, but magnified around the time of the arrival
of the BAP at the spines G–L, Peak, integral and delay-to-peak
voltage and calcium measurements are plotted as correlates for
path distance. Black circles indicate apical shaft spines. R2 values
are shown.
(EPS)
Figure S4 Individual synapse scaling in a homeostaticmanner based on peak calcium levels. A, Example traces of
individual synapse strength during the first 200 runs of the
timelapse homeostatic simulation (same simulation as in Fig. 8).
Synapses are colour-coded according to soma-synapse distance. B,
Examples of peak calcium levels for individual synapses during the
time-lapse homeostatic simulation. On each run, a new set of
synapses was stimulated. Synapses are colour-coded as in A, with
individual points showing the fluctuations in peak calcium
concentration around the target level following sub- and
suprathreshold responses.
(EPS)
Author Contributions
Conceived and designed the experiments: DCS MRG RMM AvO.
Performed the experiments: DCS MRG. Analyzed the data: DCS MRG
AVO. Wrote the paper: DCS MRG RMM AvO.
References
1. Kajiwara R, Wouterlood FG, Sah A, Boekel AJ, Baks-te Bulte LT, et al. (2008)
Convergence of entorhinal and CA3 inputs onto pyramidal neurons and
interneurons in hippocampal area CA1—an anatomical study in the rat.
Hippocampus 18: 266–280.
2. Rall W (1964) Theoretical significance of dendritic trees for neuronal input-
output relations Stanford University Press.
3. Magee JC, Cook EP (2000) Somatic EPSP amplitude is independent of synapse
location in hippocampal pyramidal neurons. Nat Neurosci 3: 895–903.
4. Nicholson DA, Trana R, Katz Y, Kath WL, Spruston N, et al. (2006) Distance-
dependent differences in synapse number and AMPA receptor expression in
hippocampal CA1 pyramidal neurons. Neuron 50: 431–442.
5. Katz Y, Menon V, Nicholson DA, Geinisman Y, Kath WL, et al. (2009) Synapse
distribution suggests a two-stage model of dendritic integration in CA1
pyramidal neurons. Neuron 63: 171–177.
6. Hausser M (2001) Synaptic function: dendritic democracy. Curr Biol 11:
R10–12.
7. Spruston N, Schiller Y, Stuart G, Sakmann B (1995) Activity-dependent action
potential invasion and calcium influx into hippocampal CA1 dendrites. Science
268: 297–300.
8. Gasparini S, Losonczy A, Chen X, Johnston D, Magee JC (2007) Associative
pairing enhances action potential back-propagation in radial oblique branches of
CA1 pyramidal neurons. J Physiol 580: 787–800.
9. Koester HJ, Sakmann B (1998) Calcium dynamics in single spines during
coincident pre- and postsynaptic activity depend on relative timing of back-
propagating action potentials and subthreshold excitatory postsynaptic poten-
tials. Proc Natl Acad Sci U S A 95: 9596–9601.
10. Sabatini BL, Oertner TG, Svoboda K (2002) The life cycle of Ca2+ ions in
dendritic spines. Neuron 33: 439–452.
11. Hodgkin AL, Huxley AF (1952) A quantitative description of membrane current
and its application to conduction and excitation in nerve. J Physiol 117: 500–544.
12. Peterka DS, Takahashi H, Yuste R (2011) Imaging voltage in neurons. Neuron
69: 9–21.
13. Hoffman DA, Magee JC, Colbert CM, Johnston D (1997) K+ channel regulation
of signal propagation in dendrites of hippocampal pyramidal neurons. Nature
387: 869–875.
14. De Simoni A, Griesinger CB, Edwards FA (2003) Development of rat CA1
neurones in acute versus organotypic slices: role of experience in synaptic
morphology and activity. J Physiol 550: 135–147.
Synaptically-Induced BAP Predicts Synapse Location
PLoS Computational Biology | www.ploscompbiol.org 14 June 2012 | Volume 8 | Issue 6 | e1002545
15. Poirazi P, Brannon T, Mel BW (2003) Arithmetic of subthreshold synaptic
summation in a model CA1 pyramidal cell. Neuron 37: 977–987.16. Sterratt DC, van Ooyen A (2004) Does a dendritic democracy need a ruler?
Neurocomputing 58–60: 437–442.
17. Hines ML, Carnevale NT (1997) The NEURON simulation environment.Neural Comput 9: 1179–1209.
18. Megias M, Emri Z, Freund TF, Gulyas AI (2001) Total number and distributionof inhibitory and excitatory synapses on hippocampal CA1 pyramidal cells.
Neuroscience 102: 527–540.
19. Zador A, Koch C, Brown TH (1990) Biophysical model of a Hebbian synapse.Proc Natl Acad Sci U S A 87: 6718–6722.
20. Koch C, Segev I (1998) Methods in Neuronal Modeling: From Ions to Networks.Massachusetts. MIT Press.
21. Andrasfalvy BK, Magee JC (2001) Distance-dependent increase in AMPAreceptor number in the dendrites of adult hippocampal CA1 pyramidal neurons.
J Neurosci 21: 9151–9159.
22. Hestrin S (1992) Developmental regulation of NMDA receptor-mediatedsynaptic currents at a central synapse. Nature 357: 686–689.
23. Spruston N, Jonas P, Sakmann B (1995) Dendritic glutamate receptor channelsin rat hippocampal CA3 and CA1 pyramidal neurons. J Physiol 482: 325–352.
24. Medina I, Filippova N, Bakhramov A, Bregestovski P (1996) Calcium-induced
inactivation of NMDA receptor-channels evolves independently of run-down incultured rat brain neurones. J Physiol 495(Pt 2): 411–427.
25. Vargas-Caballero M, Robinson HP (2003) A slow fraction of Mg2+ unblock ofNMDA receptors limits their contribution to spike generation in cortical
pyramidal neurons. J Neurophysiol 89: 2778–2783.26. Smith MA, Ellis-Davies GC, Magee JC (2003) Mechanism of the distance-
dependent scaling of Schaffer collateral synapses in rat CA1 pyramidal neurons.
J Physiol 548: 245–258.27. Magee JC, Johnston D (1995) Characterization of single voltage-gated Na+ and
Ca2+ channels in apical dendrites of rat CA1 pyramidal neurons. J Physiol 487:67–90.
28. Hille B (2001) Ion Channels of Excitable Membranes. 3rd edition. Sunderland,
MA: Sinauer Associates.29. Sabatini BL, Svoboda K (2000) Analysis of calcium channels in single spines
using optical fluctuation analysis. Nature 408: 589–593.30. Csicsvari J, Hirase H, Mamiya A, Buzsaki G (2000) Ensemble patterns of
hippocampal CA3-CA1 neurons during sharp wave-associated populationevents. Neuron 28: 585–594.
31. Hou Q, Gilbert J, Man HY (2011) Homeostatic regulation of AMPA receptor
trafficking and degradation by light-controlled single-synaptic activation.Neuron 72: 806–818.
32. Wang HL, Zhang Z, Hintze M, Chen L (2011) Decrease in calciumconcentration triggers neuronal retinoic acid synthesis during homeostatic
synaptic plasticity. J Neurosci 31: 17764–17771.
33. Bureau I, von Saint Paul F, Svoboda K (2006) Interdigitated paralemniscal andlemniscal pathways in the mouse barrel cortex. PLoS Biol 4: e382.
34. Meredith RM, Holmgren CD, Weidum M, Burnashev N, Mansvelder HD(2007) Increased threshold for spike-timing-dependent plasticity is caused by
unreliable calcium signaling in mice lacking fragile X gene FMR1. Neuron 54:627–638.
35. Abramoff MD, Magalhaes PJ, Ram SJ (2004) Image processing with ImageJ.
Biophotonics International 11: 36–42.36. Stuart GJ, Sakmann B (1994) Active propagation of somatic action potentials
into neocortical pyramidal cell dendrites. Nature 367: 69–72.37. Jack JJ, Redman SJ (1971) The propagation of transient potentials in some linear
cable structures. J Physiol 215: 283–320.
38. Oren I, Mann EO, Paulsen O, Hajos N (2006) Synaptic currents in anatomicallyidentified CA3 neurons during hippocampal gamma oscillations in vitro.
J Neurosci 26: 9923–9934.39. Mehta MR, Lee AK, Wilson MA (2002) Role of experience and oscillations in
transforming a rate code into a temporal code. Nature 417: 741–746.
40. Thompson LT, Best PJ (1989) Place cells and silent cells in the hippocampus of
freely-behaving rats. J Neurosci 9: 2382–2390.41. Bourne HR, Nicoll R (1993) Molecular machines integrate coincident synaptic
signals. Cell 72 Suppl: 65–75.
42. Migliore M, Ferrante M, Ascoli GA (2005) Signal propagation in obliquedendrites of CA1 pyramidal cells. J Neurophysiol 94: 4145–4155.
43. Luscher HR, Shiner JS (1990) Computation of action potential propagation andpresynaptic bouton activation in terminal arborizations of different geometries.
Biophys J 58: 1377–1388.
44. Antic SD (2003) Action potentials in basal and oblique dendrites of ratneocortical pyramidal neurons. J Physiol 550: 35–50.
45. Berridge MJ, Bootman MD, Roderick HL (2003) Calcium signalling: dynamics,homeostasis and remodelling. Nat Rev Mol Cell Biol 4: 517–529.
46. Watanabe S, Hoffman DA, Migliore M, Johnston D (2002) Dendritic K+
channels contribute to spike-timing dependent long-term potentiation in
hippocampal pyramidal neurons. Proc Natl Acad Sci U S A 99: 8366–8371.
47. Golding NL, Kath WL, Spruston N (2001) Dichotomy of action-potentialbackpropagation in CA1 pyramidal neuron dendrites. J Neurophysiol 86:
2998–3010.48. Chen X, Yuan LL, Zhao C, Birnbaum SG, Frick A, et al. (2006) Deletion of
Kv4.2 gene eliminates dendritic A-type K+ current and enhances induction of
long-term potentiation in hippocampal CA1 pyramidal neurons. J Neurosci 26:12143–12151.
49. Perez-Garci E, Gassmann M, Bettler B, Larkum ME (2006) The GABAB1b
isoform mediates long-lasting inhibition of dendritic Ca2+ spikes in layer 5
somatosensory pyramidal neurons. Neuron 50: 603–616.50. Meredith RM, Groen MR (2010) Inhibition of action potential backpropagation
during postnatal development of the hippocampus. J Neurophysiol 103: 2313;
author reply 2314.51. Williams SR, Stuart GJ (2003) Role of dendritic synapse location in the control
of action potential output. Trends Neurosci 26: 147–154.52. Nevian T, Larkum ME, Polsky A, Schiller J (2007) Properties of basal dendrites
of layer 5 pyramidal neurons: a direct patch-clamp recording study. Nat
Neurosci 10: 206–214.53. London M, Segev I (2001) Synaptic scaling in vitro and in vivo. Nat Neurosci 4:
853–855.54. Matsuzaki M, Kasai H (2011) Two-photon uncaging microscopy. Cold Spring
Harb Protoc 2011: pdb prot5620.55. Lisman J, Schulman H, Cline H (2002) The molecular basis of CaMKII function
in synaptic and behavioural memory. Nat Rev Neurosci 3: 175–190.
56. Hansel C, de Jeu M, Belmeguenai A, Houtman SH, Buitendijk GH, et al. (2006)aCaMKII is essential for cerebellar LTD and motor learning. Neuron 51:
835–843.57. Frick A, Magee J, Koester HJ, Migliore M, Johnston D (2003) Normalization of
Ca2+ signals by small oblique dendrites of CA1 pyramidal neurons. J Neurosci
23: 3243–3250.58. Rumsey CC, Abbott LF (2006) Synaptic democracy in active dendrites.
J Neurophysiol 96: 2307–2318.59. Bi GQ, Poo MM (1998) Synaptic modifications in cultured hippocampal
neurons: dependence on spike timing, synaptic strength, and postsynaptic celltype. J Neurosci 18: 10464–10472.
60. Fuenzalida M, Fernandez de Sevilla D, Buno W (2007) Changes of the EPSP
waveform regulate the temporal window for spike-timing-dependent plasticity.J Neurosci 27: 11940–11948.
61. Campanac E, Debanne D (2008) Spike timing-dependent plasticity: a learningrule for dendritic integration in rat CA1 pyramidal neurons. J Physiol 586:
779–793.
62. Wilbrecht L, Holtmaat A, Wright N, Fox K, Svoboda K (2010) Structuralplasticity underlies experience-dependent functional plasticity of cortical circuits.
J Neurosci 30: 4927–4932.63. Gidon A, Segev I (2009) Spike-timing-dependent synaptic plasticity and synaptic
democracy in dendrites. J Neurophysiol 101: 3226–3234.
Synaptically-Induced BAP Predicts Synapse Location
PLoS Computational Biology | www.ploscompbiol.org 15 June 2012 | Volume 8 | Issue 6 | e1002545
Recommended


