
Cell Metabolism, Volume 4
Supplemental data
Thermoregulatory and metabolic defects in Huntington’s disease transgenic mice implicate PGC-1α in Huntington’s disease neurodegeneration Patrick Weydt, Victor V. Pineda, Anne E. Torrence, Randell T. Libby, Terrence F. Satterfield, Eduardo R. Lazarowski, Merle L. Gilbert, Gregory J. Morton, Theodor K. Bammler, Andrew D. Strand, Libin Cui, Richard P. Beyer, Courtney N. Easley, Annette C. Smith, Dimitri Krainc, Serge Luquet, Ian R. Sweet, Michael W. Schwartz, and Albert R. La Spada Supplemental experimental methods
Histology
Infra-scapular BAT was dissected out and fixed in 4% paraformaldehyde overnight. The tissue
was subsequently dehydrated and sectioned for standard H&E staining (Lin et al., 2004).
Immunohistochemistry
Brains were postfixed overnight in 4% paraformaldehyde in phosphate buffer (PB) and
cryoprotected by overnight incubation in 30% sucrose in PB with 0.1% NaN3. 40 �m frozen
coronal sections were cut on a sliding microtome, and blocked with 1% normal goat serum.
Sections were incubated in 0.1 M PB containing c-Fos anti-serum (1:1000; Calbiochem, San
Diego, CA, USA), 1% normal goat serum, and 0.3% Triton X-100 for 24 h at 4 °C, rinsed three
times in 0.1 M PB and incubated in 0.1 M PB and incubated in fluorescent secondary antibody
(Alexa-Fluor 594; 1:1000; Molecular Probes, Eugene, OR, USA) for 2 hrs at RT. Ventromedial
hypothalamic nucleus images were captured at the same exposure on a Zeiss Axiovert 200M
fluorescent microscope and analyzed using Slidebook software (version 4.01.40). The ImageJ
program was used to count c-Fos positive cells from four adjacent rectangular areas / section.
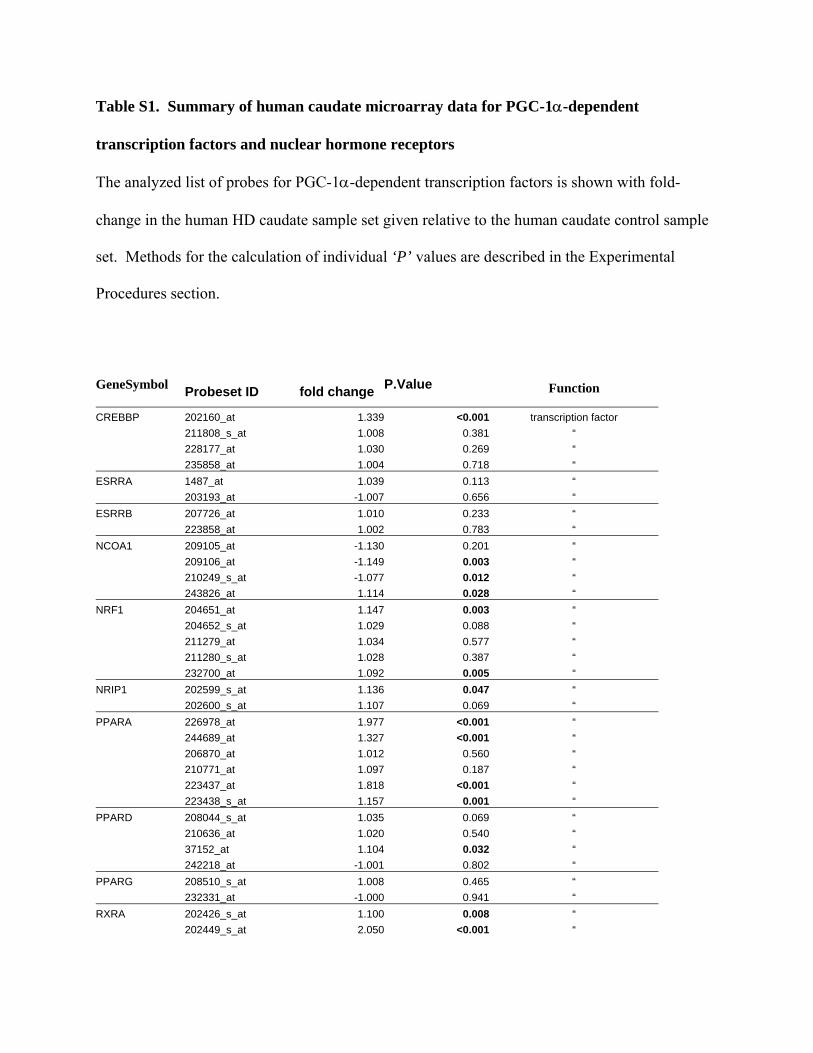
Table S1. Summary of human caudate microarray data for PGC-1α-dependent
transcription factors and nuclear hormone receptors
The analyzed list of probes for PGC-1α-dependent transcription factors is shown with fold-
change in the human HD caudate sample set given relative to the human caudate control sample
set. Methods for the calculation of individual ‘P’ values are described in the Experimental
Procedures section.
GeneSymbol Probeset ID fold change P.Value Function
CREBBP 202160_at 1.339 <0.001 transcription factor 211808_s_at 1.008 0.381 “ 228177_at 1.030 0.269 “ 235858_at 1.004 0.718 “ ESRRA 1487_at 1.039 0.113 “ 203193_at -1.007 0.656 “ ESRRB 207726_at 1.010 0.233 “ 223858_at 1.002 0.783 “ NCOA1 209105_at -1.130 0.201 “ 209106_at -1.149 0.003 “ 210249_s_at -1.077 0.012 “ 243826_at 1.114 0.028 “ NRF1 204651_at 1.147 0.003 “ 204652_s_at 1.029 0.088 “ 211279_at 1.034 0.577 “ 211280_s_at 1.028 0.387 “ 232700_at 1.092 0.005 “ NRIP1 202599_s_at 1.136 0.047 “ 202600_s_at 1.107 0.069 “ PPARA 226978_at 1.977 <0.001 “ 244689_at 1.327 <0.001 “ 206870_at 1.012 0.560 “ 210771_at 1.097 0.187 “ 223437_at 1.818 <0.001 “ 223438_s_at 1.157 0.001 “ PPARD 208044_s_at 1.035 0.069 “ 210636_at 1.020 0.540 “ 37152_at 1.104 0.032 “ 242218_at -1.001 0.802 “ PPARG 208510_s_at 1.008 0.465 “ 232331_at -1.000 0.941 “ RXRA 202426_s_at 1.100 0.008 “ 202449_s_at 2.050 <0.001 “

Weydt et al.
Table S2. Sample subset used for real-time RT-PCR confirmation of human caudate microarray
expression analysis
PM delay = post-mortem delay (in hours); VS Grade = Vonsattel grade; CAGn = CAG repeat allele size
Brain No. genotype Age years Gender PM Delay (h) VS Grade CAGn Cause of deathHC86 HD 46 M 18 1 17/37 Head injuryHC53 HD 56 M 14.5 1 17/43 Bowel obstructionHC51 HD 58 M 4.5 1 16/43 PneumoniaHC103 HD 41 M 11 1 19/39 ndHC82 HD 74 M 16 2 15/42 PneumoniaHC76 HD 71 M 16 2 19/42 PneumoniaHC73 HD 47 M 4 2 19/49 Pneumonia
H114 Control 42 M 14 - - ndH125 Control 58 M 13 - - ndH129 Control 48 M 12 - - ndH86 Control 74 M 15.5 - - ndH113 Control 68 M 19 - - ndH146 Control 61 M 15 - - nd
Weydt et al.
Supplemental figures
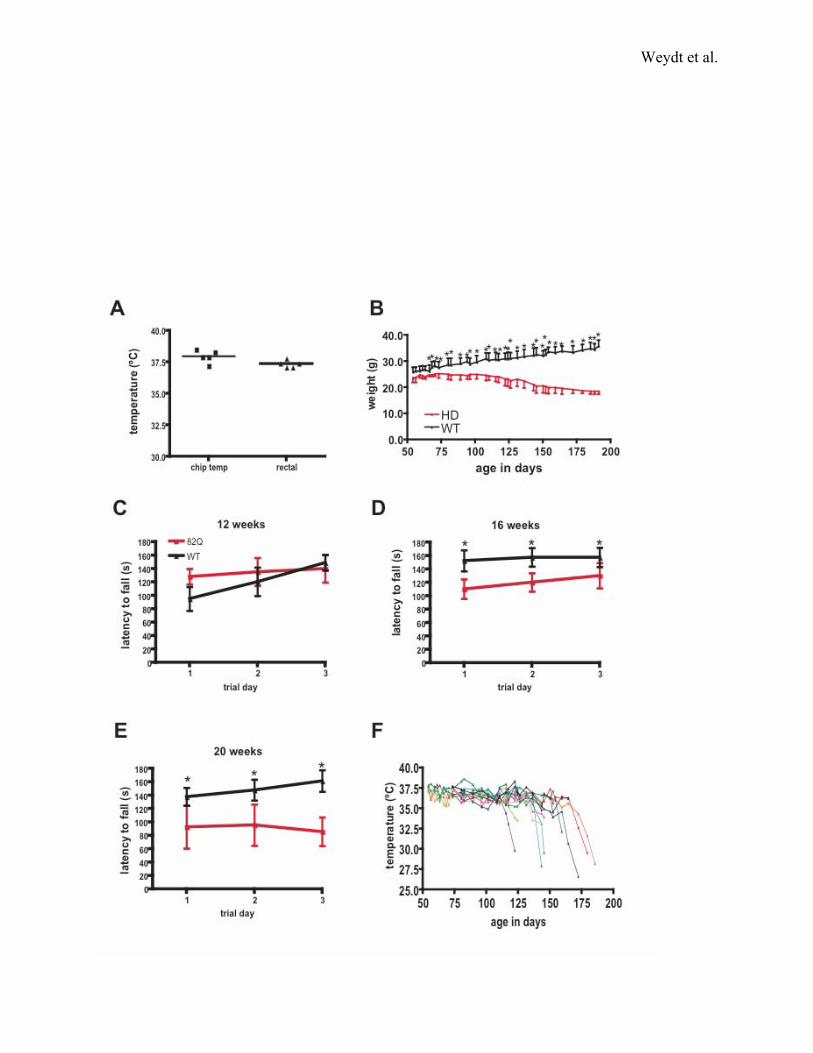
Figure S1. HD N171-82Q phenotype progression and thermoregulatory defect
A) Correlation of intrascapular chip temperature and rectal probe temperature.
B) To allow comparison of body temperature regulation with other parameters of disease in the
HD N171-82Q mice, we charted body weight in the same cohort of mice whose body
temperatures were charted in Figure 1a. As has been described (Schilling et al., 1999), we
observed significant weight loss in the HD mice with disease progression (90 days of age; p <
.05 by two-way ANOVA).
C-E) Using a standard accelerating rotarod paradigm (Garden et al., 2002), we noted progressive
impairment in rotarod performance in the HD mice in comparison to controls with age. (12 wks:
p = n.s.; 16 wks: p < 0.05; 20 wks: p < 0.05; all analyses were by two-way ANOVA).
F) Individual temperature charts for the HD N171-82Q cohort. All HD mice show body
temperature decreases with progression of their disease, with certain mice suffering dramatic
drops in body temperature prior to their death. While hypothermia is a reliable indicator of
impending death, hypothermic HD mice usually survive for days with temperatures < 35°C.
Weydt et al.
Weydt et al.
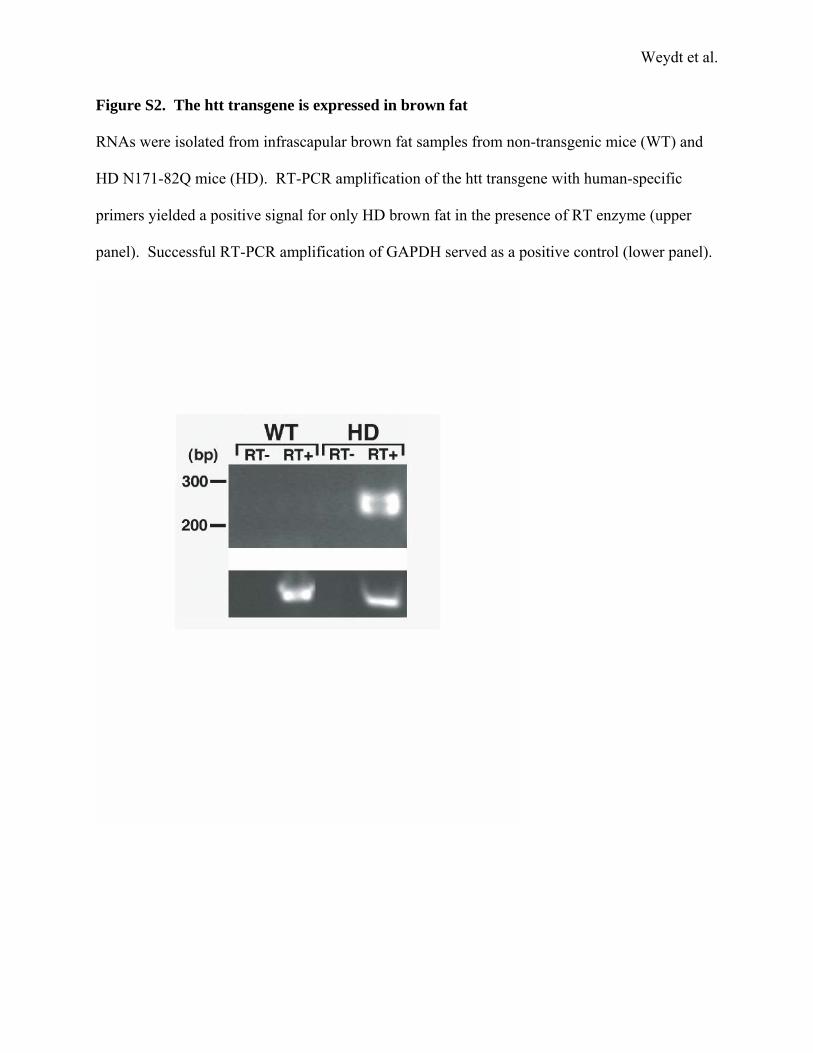
Figure S2. The htt transgene is expressed in brown fat
RNAs were isolated from infrascapular brown fat samples from non-transgenic mice (WT) and
HD N171-82Q mice (HD). RT-PCR amplification of the htt transgene with human-specific
primers yielded a positive signal for only HD brown fat in the presence of RT enzyme (upper
panel). Successful RT-PCR amplification of GAPDH served as a positive control (lower panel).
Weydt et al.
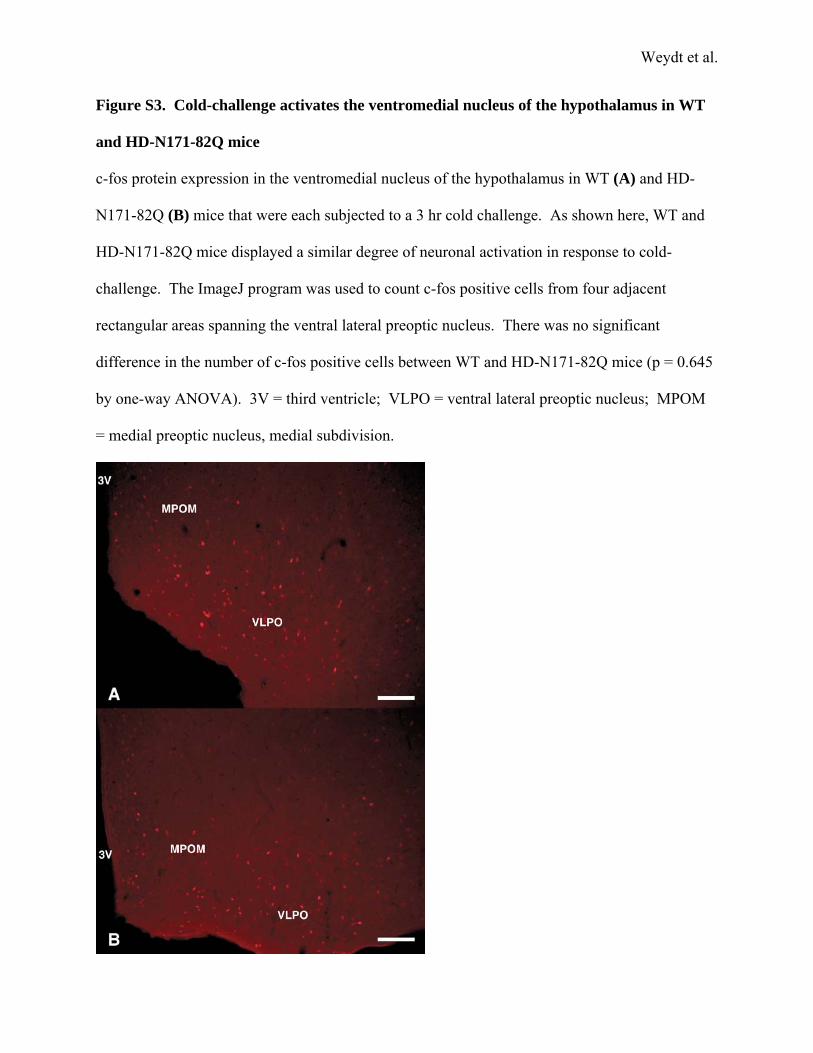
Figure S3. Cold-challenge activates the ventromedial nucleus of the hypothalamus in WT
and HD-N171-82Q mice
c-fos protein expression in the ventromedial nucleus of the hypothalamus in WT (A) and HD-
N171-82Q (B) mice that were each subjected to a 3 hr cold challenge. As shown here, WT and
HD-N171-82Q mice displayed a similar degree of neuronal activation in response to cold-
challenge. The ImageJ program was used to count c-fos positive cells from four adjacent
rectangular areas spanning the ventral lateral preoptic nucleus. There was no significant
difference in the number of c-fos positive cells between WT and HD-N171-82Q mice (p = 0.645
by one-way ANOVA). 3V = third ventricle; VLPO = ventral lateral preoptic nucleus; MPOM
= medial preoptic nucleus, medial subdivision.
Weydt et al.
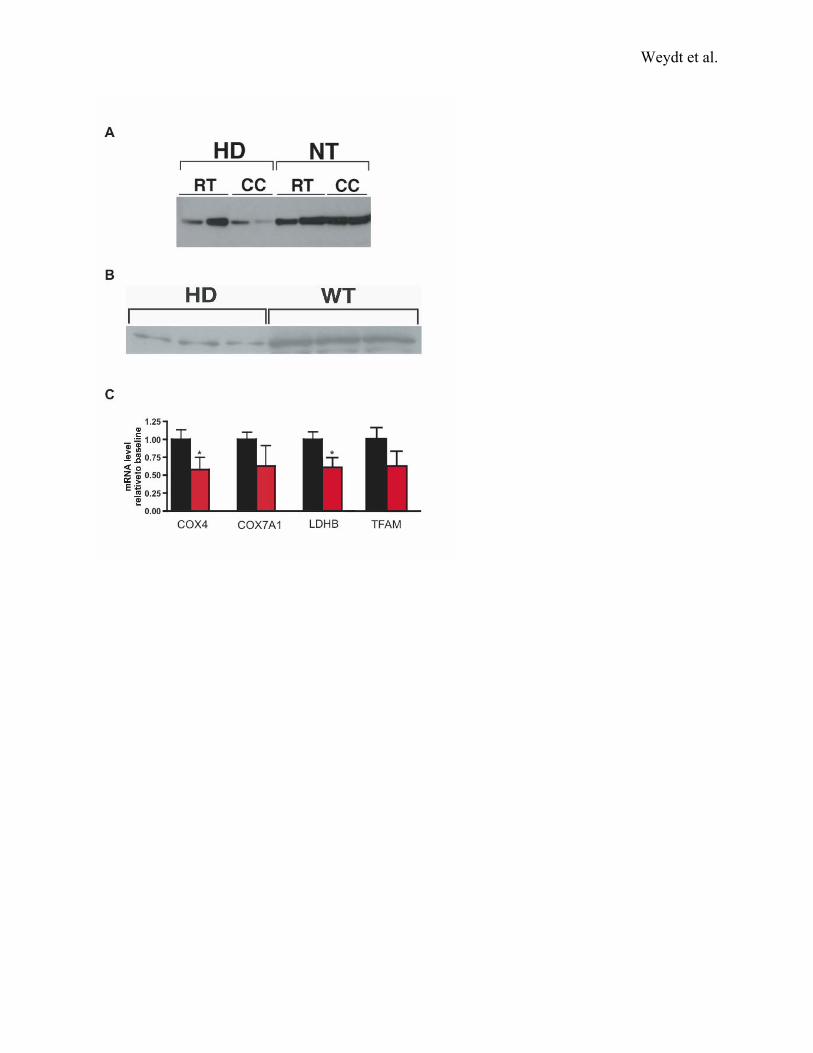
Figure S4. UCP-1 expression alterations and PGC-1α target gene alterations in HD BAT
A) HD transgenic mice fail to up-regulate UCP-1 protein expression during cold challenge.
Western blot analysis of brown fat UCP-1 protein levels in cold challenged HD N171-82Q mice
(HD) and non-transgenic littermate controls (WT) indicates up-regulation of UCP-1 in WT mice
at the end of the 3 hour cold challenge in comparison to HD mice. Staining of SDS PAGE gels
prior to transfer confirmed equivalent loading of brown fat protein samples (not shown).
B) Impaired UCP-1 protein up-regulation in norepinephrine-treated HD primary brown
adipocytes. Protein lysates obtained from primary brown adipocyte cultures from individual
non-transgenic (WT) and HD N171-82Q (HD) mice were immunoblotted with an anti-UCP-1
antibody. Much lower levels of UCP-1 protein are apparent in primary brown adipocyte samples
from HD mice in comparison to WT mice. Blots were reprobed with an anti-βactin antibody to
assure equivalent loading (data not shown).
C) Expression analysis of PGC-1α mitochondrial gene targets in HD BAT. We performed real-
time RT-PCR analysis of BAT RNAs, obtained from sets of 20 week-old HD 82Q (red) and WT
mice (black), and observed a significant reduction or trend toward reduction in PGC-1α gene
targets involved in mitochondrial energy production (p = 0.035 for COX4; p = 0.072 for
COX7a1; p = 0.036 for LDH-B, p = .092 for TFAM, all by t-test). These reductions were
consistent with a decrease in functional mitochondria and depressed ATP/ADP ratios (Figure 2).
Weydt et al.
Weydt et al.
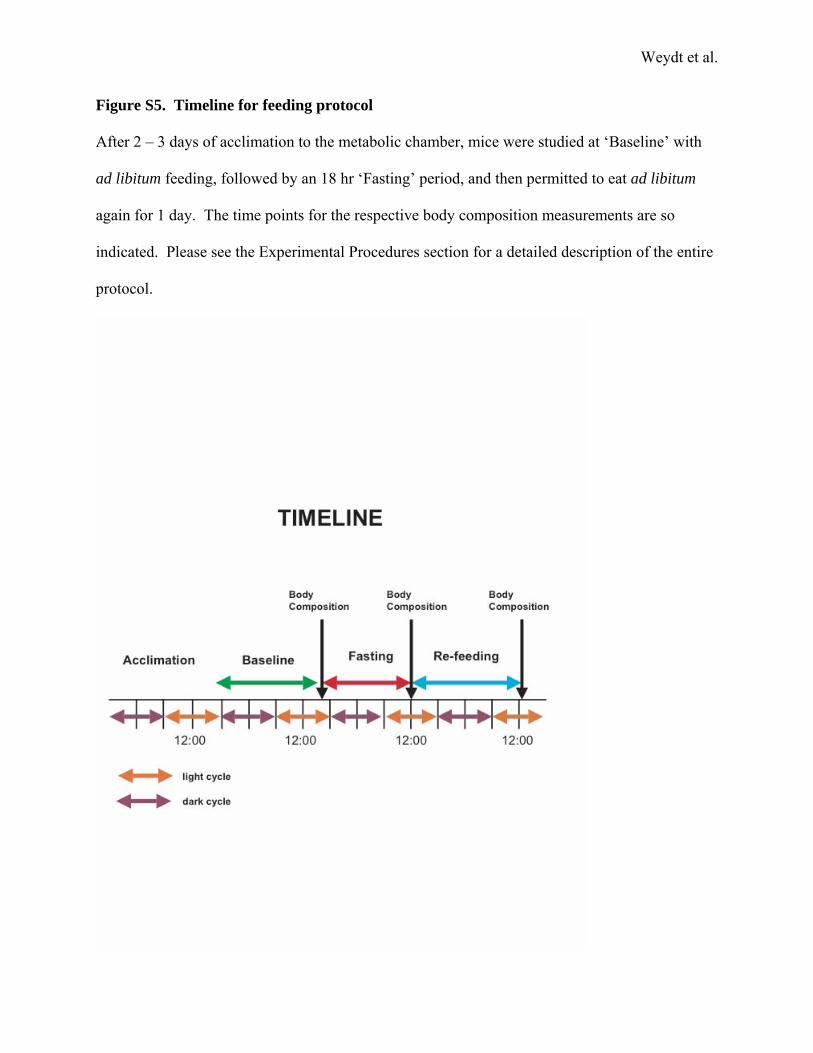
Figure S5. Timeline for feeding protocol
After 2 – 3 days of acclimation to the metabolic chamber, mice were studied at ‘Baseline’ with
ad libitum feeding, followed by an 18 hr ‘Fasting’ period, and then permitted to eat ad libitum
again for 1 day. The time points for the respective body composition measurements are so
indicated. Please see the Experimental Procedures section for a detailed description of the entire
protocol.
Weydt et al.
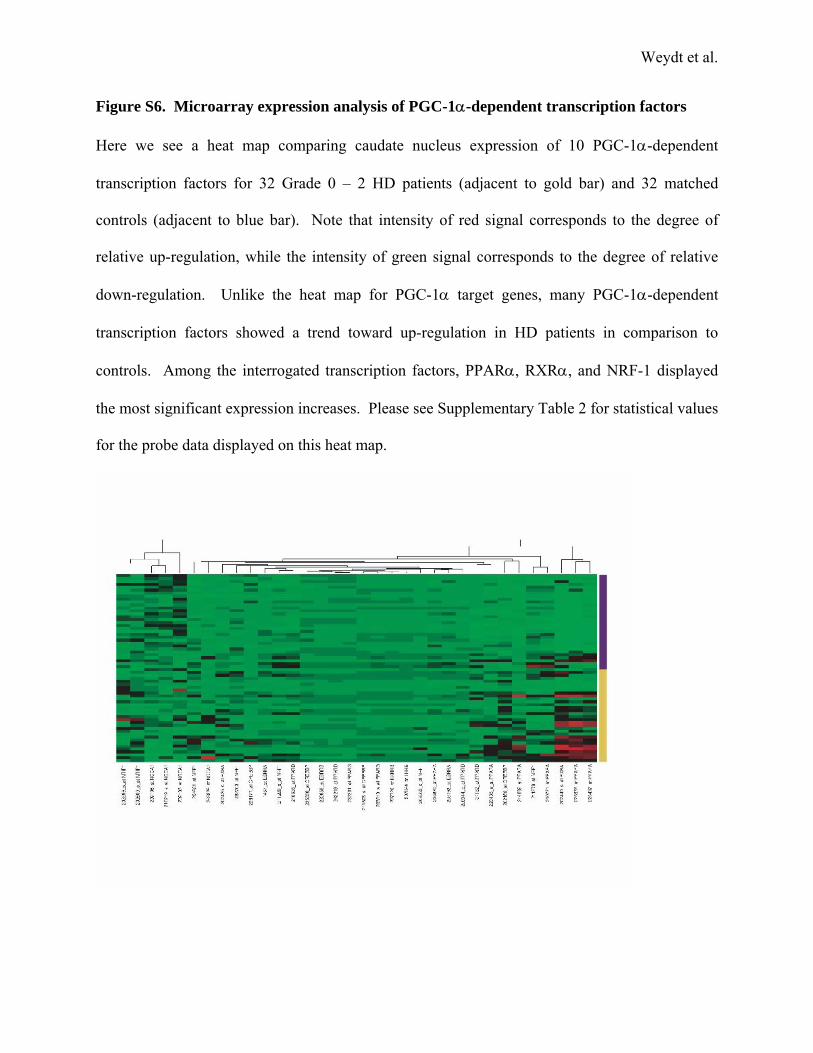
Figure S6. Microarray expression analysis of PGC-1α-dependent transcription factors
Here we see a heat map comparing caudate nucleus expression of 10 PGC-1α-dependent
transcription factors for 32 Grade 0 – 2 HD patients (adjacent to gold bar) and 32 matched
controls (adjacent to blue bar). Note that intensity of red signal corresponds to the degree of
relative up-regulation, while the intensity of green signal corresponds to the degree of relative
down-regulation. Unlike the heat map for PGC-1α target genes, many PGC-1α-dependent
transcription factors showed a trend toward up-regulation in HD patients in comparison to
controls. Among the interrogated transcription factors, PPARα, RXRα, and NRF-1 displayed
the most significant expression increases. Please see Supplementary Table 2 for statistical values
for the probe data displayed on this heat map.
Weydt et al.
Supplemental references
Garden, G. A., Libby, R. T., Fu, Y. H., Kinoshita, Y., Huang, J., Possin, D. E., Smith, A. C., Martinez, R. A., Fine, G. C., Grote, S. K., et al. (2002). Polyglutamine-expanded ataxin-7 promotes non-cell-autonomous purkinje cell degeneration and displays proteolytic cleavage in ataxic transgenic mice. J. Neurosci. 22, 4897-4905. Schilling, G., Becher, M. W., Sharp, A. H., Jinnah, H. A., Duan, K., Kotzuk, J. A., Slunt, H. H., Ratovitski, T., Cooper, J. K., Jenkins, N. A., et al. (1999). Intranuclear inclusions and neuritic aggregates in transgenic mice expressing a mutant N-terminal fragment of huntingtin. Hum. Mol. Genet. 8, 397-407.
Recommended


