TEMPORAL EFFECTS OF FESCUE TOXICOSIS AND HEAT
STRESS ON RAT PHYSIOLOGY AND HEPATIC GENE
EXPRESSION
A Dissertation presented to
the Faculty of the Graduate School at
the University of Missouri-Columbia
In Partial Fulfillment of the
Requirements for the Degree
Doctor of Philosophy
by
RAJA SEKHAR SETTIVARI
Dr. Donald Spiers, Dissertation Supervisor
DECEMBER 2007
The undersigned, appointed by the Dean of the Graduate School, have examined the
dissertation entitled
TEMPORAL EFFECTS OF FESCUE TOXICOSIS AND HEAT STRESS
ON RAT PHYSIOLOGY AND HEPATIC GENE EXPRESSION
presented by Raja sekhar Settivari
a candidate for the degree of Doctor of Philosophy
and hereby certify that, in their opinion, it is worthy of acceptance.
Dr. Donald Spiers
Dr. Eric Antoniou
Dr. Matt Lucy
Dr. Tim Evans
Dr. Marilyn James-Kracke

ii
ACKOWLEDGEMENTS
I would like to thank my advisor, Dr. Donald Spiers, for giving me the
precious opportunity to work with him in the area of fescue toxicosis and without whom I
never would have made it through this challenge. I would like to thank him for his
constant support, guidance and encouragement which allowed me to venture into new
areas and grow as a researcher. I thank him a lot for his constant support especially when
things didn’t work out in my research or in personal life and his precious suggestions will
always be remembered. He is very understanding, patient and great person to work with.
I would like to thank Drs. Antoniou and Timothy Evans for their expertise in micro array
technology and toxicology and for the time they spent on my research work. I would like
to thank Dr. James-Kracke and Dr. Chada Reddy who had encouraged me and has been
of great assistance and moral support throughout my graduate career. I would like to
thank Dr. Lucy for agreeing to be on my committee and I would like to thank all my
committee members for spending their valuable time and for guiding me during the
course of my Ph.D. program. I also would like to thank Drs. Rucker, Sutovsky,
Rottinghaus, Fritsche Shukla and Keisler for their help during my graduate studies.
I also would like to thank Peggy Ann Eichen, Vamsidhara Dhulipala, Kamala
Maddali, Zhilin Liu, Sachin Bhusari, Jim Porter, Miriam Sutovsky for helping me learn
laboratory techniques. I also thank Prakash Babu Bommala, Bhanu Prakash Telugu,
Ganesh Talatam, Srikanth Singamsetty, Ram Kishore Gernapudi and Sai Ram Jabba for
their friendship. I would also thank my lab mates Laura Wax, Brad Scharf and all the
undergrad students for making my stay in the lab enjoyable. I also thank Cindy Glascock,
Doris Lyons, and Kathy Craighead for always being ready to help out anything for me

iii
and Mary Smith for helping me tie up the loose ends. Thanks also to Chaya Reddy,
Peggy Spiers, Martine Antoniou, Xena Ledoux, Elizabeth and Jeremy McGill, and
Drs.Smith, Lamberson and, Ledoux, for their support and help when it was most needed.
I would like to thank my parents for encouraging and supporting me to become
what I am today. I am very grateful for their sacrifices in helping me achieve the best
possible education. Thanks to my sisters and brother-in-laws for all their loving care and
support. I consider my self very lucky to have Lakshmi Praveena Yarru as my loving,
understandable and caring wife. I would like to thank her for her patience and support. I
thank God for blessing us with our lovely son Ashrith Settivari. I dedicate my dissertation
to my parents Mallappa and Jayalakshmi, my wife Praveena Yarru and lovely son Ashrith
Settivari. Thank you all!
iv
TABLE OF CONTENTS
ACKNOWLEDGEMENTS ……………………………………………......….……….ii LIST OF FIGURES………………………………………………………......….……...ix LIST OF TABLES…………………………………………………………......….…..xiii ABSTRACT………………………………………………………………......…….….xvii Chapter
I INTRODUCTION…………………………………………….......………….. 1 II LITERATURE REVIEW
1. Heat stress
1. 1. Introduction ………………………………………………….....……....5 1. 2. Effects of heat stress on livestock performance ……………….....….…5 1. 2. 1. Effects on respiratory rate and animal core temperature…….........…6 1. 2. 2. Effects of heat stress on feed intake and daily gain…………….....…7 1. 2. 3. Effects of heat stress on hormones and blood chemistry…….....……8 1. 2. 4. Effects of heat stress on immune system ……………………..........10 1. 2. 5. Role of heat stress in inducing oxidative stress………………......…11 1. 2. 6. Effects of heat stress on heat shock proteins………………......……14 1. 2. 7. Short versus long term heat stress effects on animal performance…………………………………………………………......…..15
2. Fescue toxicosis 2. 1. Introduction – Fescue toxicosis………………………………......……17 2. 2. Symbiotic association of fescue with endophyte………………......….17 2. 2. 1. Toxins associated with fescue toxicosis……………………......…...19
v
2. 2. 1. 1. Ergopeptine versus ergoline alkaloids……………………......… 20 2. 3. Toxicological conditions associated with fescue toxicosis …………………………………………………………………………........21 2. 3. 1. Effects of endophyte-infected fescue on livestock performance …………………………………………………………......….23 2. 3. 2. Effects of endophyte-infected fescue on core temperature and respiration rate …………………………….…………………….....…..23 2. 3. 3. Effects of endophyte-infected fescue on feed intake ……….......…25 2. 3. 4. Effects of endophyte-infected fescue on body weight and growth rate ……………………………………………………......……27 2. 3. 5. Effects of endophyte-infected fescue on feed conversion efficiency ……………………………………………………………......….28 2. 3. 6. Interactions of ergot alkaloids associated with endophyte-infected fescue with biogenic amine receptors …………......…..29 2. 3. 7. Effects of endophyte-infected fescue on blood chemistry and hormonal changes …………………………………….....….31 2. 3. 7. 1. Effects of endophyte-infected fescue on prolactin………….........35 2. 3. 8. Effects of endophyte-infected fescue on immune system………………………………………………………………….........36 2. 3. 9. Effects of endophyte-infected fescue on endothelial cells……………………………………………………….....….37 2. 4. Economic impact associated with endophyte-infected fescue …………………………………………………………….…......…..40 2. 5. Hepatic detoxification ………………………………………….....…. 40 2. 5. 1. Cytochrome P450…………………………………………......…….41 2. 5. 2. Antioxidants………………………………………………......…….44 2. 5. 3. Antiporter system…………………………………………......…….47 2. 6. Rat as a model for fescue toxicosis …………………………......…….47
vi
2. 7. Microarrays 2. 7. 1. Introduction………………………………………………......……..48 2. 7. 2. Recent applications of DNA microarrays to toxicology ………………………………………………………......……49 2. 7. 3. Application of microarray technique to fescue toxicosis ……………………………………………………......……50
III SHORT- AND LONG-TERM RESPONSES TO FESCUE
TOXICOSIS AT THERMONEUTRALITY OR DURING HEAT STRESS
1. Abstract…………………………………………………….…….....…....52 2. Introduction……………………………………………………......……..52 3. Materials and Methods…………………………………………......…….54 4. Results……………………………………………………………......…..57 5. Discussion………………………………………………………......…….63 6. Conclusion……………………………………………………......……....72
IV GENOMIC ANALYSIS OF THE IMPACT OF FESCUE TOXICOSIS ON HEPATIC FUNCTION
1. Abstract………………………………………………………......……….82 2. Introduction…………………………………………………….....….…..83 3. Materials and Methods………………………………………......…...…..84 4. Results………………………………………………………….......…….92 5. Discussion……………………………….…………….....…..…………..96 6. Conclusion…………………………………………….....……………..104
V EFFECT OF ERGOT ALKALOIDS ASSOCIATED WITH FESCUE TOXICOSIS ON HEPATIC CYTOCHROME P450 AND
ANTIOXIDANT PROTEINS
vii
1. Abstract…………………………………………………………......…..119 2. Introduction……………………………………………….……….....…120 3. Materials and Methods………………………………….….…….....…..122 4. Results………………………………………………………….....…….130 5. Discussion……………………………………………...…….….....…...131 6. Conclusion……………………………………………...…………........139
VI EFFECTS OF FESCUE TOXICOSIS AND ACUTE HEAT STRESS
ON RAT HEPATIC GENE EXPRESISON
1. Abstract…………………………………………….……….…….....….151 2. Introduction……………………………………….…………….....……152 3. Materials and Methods…………………………….……………......…..154 4. Results…………………………………………………………….....….164 5. Discussion…………………………………………….………….....…..169 6. Conclusion……………………………………………………........…....182
VII EFFECTS OF FESCUE TOXICOSIS AND CHRONIC HEAT
STRESS ON RAT HEPATIC GENE EXPRESISON
1. Abstract……………………………………………….……….....……..211 2. Introduction……………………………….…………………….....……212 3. Materials and Methods…………………….…………………….....…...214 4. Results………………………………………………………….....…….220 5. Discussion………………………………….……………….....………..223 6. Conclusion…………………………………………………….....…......237
VIII SUMMARY……………………………….……………...……........……..271
LITERATURE CITED…………………………..……………........….......….….277
viii
APPENDICES………………………………………..……………….......……..305
Appendix 1. Implanting mini mitters in rats………………………......…306 Appendix 2. RNA extraction………….………………..……......…..…..307 Appendix 3. DNase treatment for RNA samples……………….....……..308 Appendix 4. Agarose gel electrophoresis…………………........….…….310 Appendix 5. Microarray slide quality control check…………….........….311 Appendix 6. Microarray protocol I............................................................312 Appendix 7. Microarray protocol II......................................................….318 Appendix 8. Flow cytometry...............................................................…..325
VITA…………………..…………………………….……..…………….............326
ix
LIST OF FIGURES Figure Page
3. 1. Study design for the Experiments…………………………..........
73
3. 2. Group average values for average daily feed intake (a), and daily body weight (b) of rats fed either E- or E+ diets during short- (S; 5 days) or long-term (L; 26 days) exposures at thermoneutrality……………………………...................................
74
3. 3. Group average values for average daily feed intake (a), and daily body weight (b) of rats fed either E- or E+ diets during short- (S; 5 days) or long-term (L; 26 days) exposures at thermoneutrality……………………………..................................
76
4. 1. Average core body temperature of endophyte-infected diet (E+) and endophyte-free diet (E-) rats during pretreatment and treatment periods as a function of time………………..................
105
4. 2. Average daily BW of endophyte-infected diet (E+) and endophyte-free diet (E-) rats during pretreatment and treatment periods…………………………………………............................
106
4. 3. Average daily feed intake of endophyte-infected diet (E+) and
endophyte-free diet (E-) rats during pretreatment and treatment periods………………………………………….............................
107
4. 4. Histological sections of liver stained with H&E showing vacuolation (fat globules) in the midzonal to periportal hepatocytes in endophyte-free diet (E-) compared to endophyte-infected diet (E+) rats…………………………...................................................
108
4. 5. Hierarchical tree showing the differentially expressed genes in endophyte-infected diet (E+) and endophyte-free diet (E-) rats at thermoneutrality, with the similarly expressed genes clustered together………………………………………………..
4. 6. Diagram showing the effects of fescue toxicosis both at physiological and genomic levels…………………………...........
110
109
x
5. 1. The effects of dietary exposure to fescue toxicosis–associated ergot alkaloids on hepatic CYP and nuclear receptor gene expression………………………………………………….............
140
5. 2. The induction of expression of CYP3A1 protein in the livers of rats exposed to diet containing the ergot alkaloids associated with fescue toxicosis……………………………......................................
141
5. 3. The effect of dietary exposure to ergot alkaloids associated with fescue toxicosis on immunohistochemical staining for CYP3A1 in hepatic sections………………………………..................................
142
5. 4. The dose-dependent induction of CYP3A1 by ergovaline (i.e., the direct effects of ergovaline on CYP3A1 protein expression) in primary hepatocellular cultures………….....................................….
143
5. 5. The statistically significant effects of dietary exposure to ergot alkaloids associated with fescue toxicosis on the hepatic gene expression of antioxidant enzymes………….....................................
144
5. 6. The decreased expression of various antioxidant enzymatic proteins in the livers of rats exposed to diet containing the ergot alkaloids associated with fescue toxicosis………….........................................
145
5. 7. The decreased antioxidant activity in the livers of rats exposed to diet containing the ergot alkaloids associated with fescue toxicosis……………………………………................................….
146
5. 8. Decreased protein expression of PCNA (i.e., the decreased hepatocellular proliferation) in the livers of rats exposed to diet containing the ergot alkaloids associated with fescue toxicosis………………………………………………….............….
147
5. 9. The potential roles of ergot alkaloid-induced CYP over expression, as well as decreased responsiveness to oxidative stress, in the pathogenesis of hepatic insult associated with fescue toxicosis are summarized……….......................................................................…
148
6. 1. a Average core body temperature of rats fed E+ diet and maintained under TN (21˚C) for five days, and then extended under TN or HS conditions (31˚C) for three days
184
6. 1. b Average water intake of rats fed E+ diet and maintained under TN (21 ˚C) for five days, and then extended under TN or HS conditions (31˚C) for three days……………................................................…..
184
xi
6. 2. a Fescue toxicosis-induced reduction in average daily feed intake during the eight-day treatment period for E+TN and E+HS groups………………………………………………......................
186
6. 2. b Fescue toxicosis-induced reduction in average feed conversion
efficiency during the eight-day treatment period for E+TN and E+HS groups………………………………..................................
186
6. 3. a Fescue toxicosis-induced reduction in average body weight during the eight-day treatment period for E+TN and E+HS groups……………………………………………………...........…
188
6. 3. b Fescue toxicosis-induced reduction in average growth rate during the eight-day treatment period for E+TN and E+HS groups…………………………………………………..........……
188
6. 4. Heat map representing differentially expressed genes in E+HS compared to E+TN rats maintained under thermoneutral (TN) conditions (21˚C) for five days, and then extended under TN or heat stress (HS) conditions (31 ˚C) for three days……………………..
190
6. 5. Average protein expression of CYP3A4 for hepatic tissue from E+TN and E+HS groups…………………………….....................
191
6. 6. Average antioxidant activities for hepatic tissue from E+TN and E+HS groups……………………………….............................….
192
6. 7. Average number of TUNEL positive cells per 100 hepatic nuclei for E+TN and E+HS groups…………………….....................….
193
6. 8. Gene expression for eight genes, randomly selected from the differentially expressed gene list of microarray results................
194
6. 9. Heat map representing differentially expressed genes in E+HS compared to E-HS rats maintained under thermoneutral (TN) conditions (21 ˚C) for five days, and then extended under heat stress (HS) conditions (31 ˚C) for three days……………………
196
7. 1. Differentially expressed genes between E-TN and E+TN (FDR ≤ 15% and fold change greater than 1.4%) rats maintained under thermoneutral (TN) conditions (21˚C) for five days, and then extended under TN or heat stress (HS) conditions (31˚C) for three weeks…………………..................................................................
239
xii
7. 2. Differentially expressed genes between E-HS and E+HS (p ≤ 0.001 and fold change greater than 1.4%) rats maintained under thermoneutral (TN) conditions (21˚C) for five days, and then extended under TN or heat stress (HS) conditions (31˚C) for three weeks……………………………………........................................
241
7. 3. Differentially expressed genes between E-HS and E-TN (p ≤ 0.001 and fold change greater than 1.4%) rats maintained under thermoneutral (TN) conditions (21˚C) for five days, and then extended under TN or heat stress (HS) conditions (31˚C) for three weeks…………………………………….........................................
242
7. 4. Differentially expressed genes between E+TN and E+HS (p ≤ 0.001 and fold change greater than 1.4%) rats maintained under thermoneutral (TN) conditions (21˚C) for five days, and then extended under TN or heat stress (HS) conditions (31˚C) for three weeks…………………....................................................................
243
7. 5. Differentially expressed genes between E-TN and E+HS (FDR ≤ 15% and fold change greater than 1.4%) rats maintained under thermoneutral (TN) conditions (21˚C) for five days, and then extended under TN or heat stress (HS) conditions (31˚C) for three weeks…………………....................................................................
244
xiii
LIST OF TABLES
Table Page
3. 1. Average values representing the growth slope for rats fed endophyte-free (E-) or endophyte-infected tall fescue (E+) diets for short-term period or long-term period under thermoneutral or heat stress conditions…………………….....................................
78
3. 2. Group mean serum biochemistry values for rats fed endophyte-free or endophyte-infected tall fescue diets for 5 (short-term) or 26 days (long-term) under thermoneutral conditions……………………………………………………......
79
3. 3. Average values of wet organ weights (g/Kg BW) from rats fed endophyte-free (E-) or endophyte-infected tall fescue (E+) diets for 5 days (short-term period) or 26 days (long-term period) under thermoneutral or heat stress conditions….....................................
80
3.4 Group average serum biochemistry values for rats fed endophyte-free (E-) or endophyte-infected tall fescue (E+) diets for 3 (short-term HS) or 21 days (long-term HS) under heat stress conditions………………………...........…........................
81
4. 1. Details of primers used for RT-PCR……………………………
111
4. 2. List of significantly differentially expressed genes in E+ rat liver after the 5-d treatment period………………………….....
112
5. 1. Details of CYP and Nuclear Receptor Primers used for RT-PCR………………………………………………………….…
149
5. 2. Details of Antioxidant Enzyme Primers used for RT-PCR…….
150
6. 1. Primer sequences used in real-time PCR……………………….
197
6. 2. Differentially expressed gene list in E+HS compared to E+TN rats at the end of 8 day treatment period…………….................
198
6. 3. Enriched gene ontology terms at biological process level 5 and p value less than 0.01………………………………………..…
209
xiv
6. 4. Differentially expressed gene list in E+HS compared to E-HS rats at the end of 8 day treatment period……………………....
210
7. 1. Differentially expressed gene list in E-TN compared to E+TN rats at the end of 26 day treatment period……………..............
246
7. 2. Differentially expressed gene list in E-HS compared to E+HS rats at the end of 26 day treatment period……………...............
253
7. 3. Differentially expressed gene list in E-TN compared to E-HS rats at the end of 26 day treatment period………………………
256
7. 4. Differentially expressed gene list in E+TN compared to E+HS rats at the end of 26 day treatment period…………….................
260
7. 5. Differentially expressed gene list in E-TN compared to E+HS rats at the end of 26 day treatment period…………….................
262
xv
LIST OF ABBREVIATIONS
5-HT 5- Hydroxytryptamine Ac Activity count ADFI Average daily feed intake ADG Average daily gain ALP Alkaline phosphatase ALT Alanine aminotransferase BASE Bioarray soft ware environment BUN Blood urea nitrogen BW Body weight CAT Catalase Ct Cycle number in RT-PCR at which the fluorescence passes the thresholdCYP Cytochrome P450 isoform DMEM Dulbecco’s modified Eagle’s medium D2 Dopamine-2 receptor E- Endophyte-free fescue diet E+ Endophyte-infected fescue diet E-HS Rats fed E- diet and maintained under heat stress conditions E+HS Rats fed E+ diet and maintained under heat stress conditions E-TN Rats fed E- diet and maintained under thermoneutral conditions E+TN Rats fed E+ diet and maintained under thermoneutral conditions EV Ergovaline FCE Feed conversion efficiency FDR False discovery rate GAPDH Glyceraldehyde-3-phosphate dehydrogenase FI Feed intake GPx Glutathione peroxidase GSH Glutathione (Reduced) GSSG Glutathione disulfide HEPES 4-(2-hydroxyethyl)-1-piperazineethanesulfonic acid H2O2 Hydrogen peroxide H&E Hematoxylin and eosin HS Heat stress HSF Heat shock factor HSP Heat shock protein HO-1 Heme oxygenase-1 IHC Immunohistochemistry KRB Krebs-Ringer-bicarbonate buffer LH Long-term-heat stress LPS Lipopolysacharide LTHA Long-term heat acclimation MDMA 3, 4-methylenedioxymethamphetamine MDR 1 Multidrug resistance gene 1
xvi
MRP 2 Multidrug resistance associated protein 2 NO Nitric oxide PAS Periodic Acid-Schiff PCNA Proliferating cell nuclear antigen PRL Prolactin PXR Pregnane X receptor ROS Reactive oxygen species RT-PCR Real-time PCR RXR Retinoid X receptor SAM Significance Analysis of Microarray SDS Sodium dodecyl sulfate SH Short-term-heat stress SOD Superoxide dismutase SSC Standard saline citrate STHA Short-term heat acclimation SUMO-1 Small ubiquitin-like modifier 1 T3 and T4 Triiodothyronine and Thyroxine Ta Ambient temperature TBARS Thiobarbituric acid reactive substrates Tc Core body temperature THI Temperature-humidity index TN Thermoneutrality TRH Thyroid stimulating hormone-releasing hormone TUNEL Terminal dUTP nick-end labeling
xvii
TEMPORAL EFFECTS OF FESCUE TOXICOSIS AND HEAT
STRESS ON RAT PHYSIOLOGY AND HEPATIC GENE
EXPRESSION
Raja S. Settivari
Dr. Don Spiers, Dissertation Supervisor
ABSTRACT
Ingestion of endophyte (Neotyphodium coenophialum) - infected tall fescue diet
(E+) often impairs animal health and productivity. These effects or problems are
collectively termed fescue toxicosis. Clinical signs associated with fescue toxicosis are
mainly dependent on the ambient temperature and period of exposure. Characteristics of
fescue toxicosis include reduced feed intake (FI), growth, and serum prolactin level.
Thermoregulatory shifts are hypothermia under cold or thermoneutral (TN; 21◦C)
conditions and hyperthermia during heat stress (HS; 31◦C). Rats exhibit similar
characteristics of fescue toxicosis, and are very sensitive responders to E+ treatment
under both TN and HS conditions. The primary objective of the present studies was to
determine the temporal (short vs long-term) physiological changes associated with the
intake of E+ or uninfected fescue seed diet (E-) under TN and HS conditions. The second
ary objective was to identify the temporal effects of fescue toxicosis on hepatic gene
expression in TN and HS environments. The final objective was to determine the effects
of fescue toxicosis on hepatic detoxification pathways in these environments.
xviii
Three experiments were performed during which different rats were initially fed
either E+ or E- fescue seed diets, and maintained at TN for five days (pre-heat stress/TN).
In two experiments the exposure was extended under TN or HS conditions for either
three days (short-term HS) or three weeks (long-term HS). The schedule in all three
experiments consisted initially of an eight-day recovery period after intraperitoneal
implantation of telemetric transmitters to measure core temperature (Tc) and activity
count (Ac), followed by a five-day pretreatment period (d -5 to -1), during which all rats
received E- diet (Spiers et al., 2005). Rats in Experiment 1 were randomly assigned to
either E- (n = 12) or E+ treatment (n = 12) groups and administered treatment at TN for 5
d (d 1 to 5; Figure 1) to determine the fescue toxicosis response in the absence of heat
stress. During short-term HS (Experiment 2), rats were exposed to heat stress (n = 6; two
groups: E- HS and E+ HS) for three days. During long-term HS (Experiment 3), rats were
divided at random into four groups at the end of the TN period (n = 6; four groups: E-
TN, E- HS, E+ TN, and E+ HS) to determine adaptive responses to heat stress and fescue
toxicosis. At the end of each treatment period, rats from each group were euthanized and
blood and selected visceral organs (i.e., liver, adrenal, kidney, heart, and testes) were
collected from each animal. Wet organ weights were also measured at this time. Intake
of E+ diet did not change daily Tc in rats at TN, but increased Tc with short- and long-
term HS exposures. In addition, this intake reduced FI, FCE, daily gain, serum prolactin
and cholesterol levels during both TN and HS exposures. Under TN conditions, rats
adapted to the E+ diet, as reflected by the complete recovery in FI, FCE, and partial
recovery in weight gain. However, rats simultaneously exposed to a second stressor (i. e.,
HS) failed to show a similar rate of recovery, suggesting a greater shift from normalcy
xix
with multiple stressors. Moreover, the long-term depressant effect of HS seemed to have
a greater influence on physiological parameters than intake of E+ diet, which seemed to
elicit a more transient response.
Microarray analysis was used to identify shifts in hepatic gene expression
associated with affected physiological processes as a result of E+ diet intake. Data from
the analyses were analyzed using a two-step ANOVA model and the results validated
using real-time PCR. In Experiment 1, microarray analysis revealed that E+ treatment
down-regulated various genes associated with energy metabolism, growth and
development, antioxidant protection, immune function, and chaperone activity.
Furthermore, this treatment up-regulated genes coding for gluconeogenesis,
detoxification, and biotransformation. Partial adaptation in FI, FCE and growth rate that
was observed in E+ rats by the end of Experiment 1 could be partially attributed to the
up-regulation of genes associated with biotransformation and detoxification. However,
down-regulation of genes coding for antioxidant, immune, and chaperone functions,
along with energy metabolism, could contribute to the toxicological signs observed with
fescue toxicosis. This study demonstrated that even short-term intake of E+ diet under
TN conditions can result in altered hepatic gene expression contributing to the clinical
signs associated with fescue toxicosis.
Microarray results obtained from Experiment 1 supported the well proven notion
that the liver is one of the major target organs for fescue toxicosis. Effects of E+ intake on
hepatic detoxification pathways were evaluated using liver tissue samples from Experiment
1. Hepatic gene expression of various CYPs, selected nuclear receptors associated with the
CYP induction, and antioxidant enzymes were measured using real-time PCR. Hepatic
xx
expression of CYP, antioxidant and proliferating cell nuclear antigen (PCNA) proteins
were measured using western blots. The CYP3A1 protein expression was evaluated using
primary rat hepatocellular cultures treated with ergovaline, one of the major ergot alkaloids
produced by fescue endophyte, in order to assess the direct effect of ergot alkaloids on
CYP3A1 induction. The enzyme activities of selected antioxidants were assayed
spectrophotometrically. While hepatic CYP and nuclear receptor expression were
increased in E+ rats, the expression and activity of antioxidant enzymes were reduced. This
could potentially lead to increased oxidative stress, which might be responsible for the
decrease in hepatocellular proliferation after E+ diet intake. This study demonstrated that
even short-term exposure to ergot alkaloids under TN conditions can potentially induce
hepatic oxidative stress which can contribute to the pathogenesis of fescue toxicosis.
The effects of fescue toxicosis on hepatic gene expression were evaluated under
short-term HS conditions in Experiment 2. This experiment also compared the effects of
E+ treatment under TN conditions versus under short-term HS conditions. Furthermore,
protein expression of hepatic cytochrome P450 3A4 (CYP3A4) was evaluated. Hepatic
enzyme activities of superoxide dismutase (SOD), catalase (CAT), and glutathione
peroxidase (GPx) were also determined. Hepatic apoptosis rates were measured using the
TUNEL assay. Results obtained from microarray analysis showed that genes coding for
antioxidant system, and carbohydrate and lipid metabolisms were down-regulated, and
CYP2c37 was up-regulated in E+ compared to E- underrates during HS. However, only a
few genes were differentially expressed for each pathway, and therefore it was difficult to
draw conclusions with regard to the various pathways that are affected between the two
groups. Nevertheless, results obtained from comparing E+ rats under TN versus HS
xxi
conditions revealed that E+ diet intake under HS conditions down-regulated various
genes associated with ATP synthesis, immune function, chaperone activity, and
antioxidant function. Terminal dUTP nick-end labeling (TUNEL) positive hepatic nuclei
and CYP3A4 protein expression increased in E+HS with a reduction in SOD and GPx
activities. The present findings suggest that rats respond to E+ during short-term HS by
inducing hepatic CYP expression and suppressing chaperone, antioxidant, and immune
systems, which could ultimately increase cellular stress, resulting in various pathological
abnormalities.
In the final study, rats were used to evaluate the effect of endophytic toxins on
hepatic gene expression under long-term (three weeks) TN and HS conditions. Both E+
and HS induced alterations in hepatic gene expression were evaluated using DNA
microarrays. Rats (n = 24) were fed an E+ diet and maintained at TN (21˚C) for five
days, followed by TN or HS (31˚C) conditions for three weeks. Long-term intake of an
E+ diet under TN conditions (E-TN versus E+TN) up-regulated genes coding for immune
and electron transport functions, but down-regulated genes associated with antioxidant,
xenobiotic, and chaperonic activities. Long-term intake of an E+ diet under HS
conditions (E-HS versus E+HS) down-regulated genes coding for immune system, as
well as carbohydrate, lipid, and protein metabolisms. Chronic HS (E-TN versus E-HS) in
the present study down-regulated genes associated with cell proliferation, detoxification,
ATP synthesis, and immune function. The E+ treatment under long-term HS up-regulated
genes coding for apoptosis and detoxification, but down-regulated genes associated with
immune and antioxidant functions, as well as carbohydrate, lipid and protein
metabolisms. Taken together, results from the present study revealed that long-term HS
xxii
increased the susceptibility of rats to oxidative stress. In addition, E+ intake further
affected the animals’ antioxidant and immune systems as well as chaperone activity,
making the animals more susceptible to oxidative and other stressors.
The present findings identified partial adaptation of rats to long-term E+ diet
under TN conditions and this adaptation could be attributed to increased gene expression
for detoxification and immune response. However at HS, rats did not exhibit similar
adaptation to long-term E+ diet and this could be attributed to decreased antioxidant and
immune response associated genes. Down-regulation of these pathways could contribute
to distress often observed in E+ diet fed animals under heat stress conditions.
1
CHAPTER I
INTRODUCTION
Fescue toxicosis is an economically important syndrome with estimated annual
losses exceeding $600 million in the United States alone (Hoveland et al., 1993). Within
the United States, more than 8.5 million cattle graze on tall fescue, and more than half of
the tall fescue forage is infected by the endophyte Neotyphodium coenophialum (Jones
et al., 2004). The endophyte maintains a symbiotic relationship with the plant by
improving its drought and heat tolerance (Malinowski et al., 2005) but produces toxins
(ergopeptine alkaloids), which interact with dopaminergic, adrenergic and serotonergic
receptors and reduce the heat tolerance, growth, and performance of cattle grazing on the
endophyte-infected tall fescue grass (Cross et al., 1995; Oliver, 2005). Other species,
including horses (Cross et al., 1995), sheep (Gadberry et al., 2003), rabbits (Filipov et al.,
1998), rats (Spiers et al., 2005a), mice (Varney et al., 1991), meadow voles (Conover,
1998) and birds (Zavos et al., 1993) exhibit some of the clinical manifestations of fescue
toxicosis that are seen in cattle.
The economic losses associated with heat stress (HS) in livestock industry are
mainly because of its negative effects on feed intake, activity, daily gain, male and
female reproductive performance, embryo development, etc. (Collier et al., 2006). As a
result of reduced feed intake and direct HS effects, numerous changes occur in the
digestive tract, acid-base chemistry, and hormone activity (West, 2003). Heat stressed
animals often reduce feed intake and seek shade, as well as increase respiratory, sweating
2
and peripheral blood flow rates at the expense of blood flow to mammary gland (in case
of dairy cows) (West, 2003). This result in reduced productive efficiency of the animals.
Heat stress also decrease serum calorigenic hormones (T3 and T4) and alkaline
phosphatase (El-Nouty et al., 1990), cholesterol (Abeni et al., 2007), immune response
(Kelley et al., 1982) and increase serum prolactin (Smith et al., 1997) and oxidative stress
(Salo et al., 1991). Annual economic losses due to HS alone for the US livestock industry
have been estimated between $1.69 to 2.36 billion dollars (St-Pierre et al., 2003). The
dairy industry experiences the greatest economic losses ($897 to $1,500 million dollars)
due to HS, followed by beef industry ($370 million dollars), swine industry ($299 to
$316 million dollars), and poultry industry ($128 to $165 million dollars) (St-Pierre et al.,
2003).
It has been noted that many of the animal responses to ergopeptine alkaloids
depend on ambient temperature (Ta), with augmented hyperthermic and hypothermic
conditions observed in animals fed E+ diets in hot and cold environments, respectively
(Neal and Schmidt, 1985; Osborn et al., 1992; Spiers et al., 1995). Injection of rats with
ergovaline (EV), the primary ergopeptine alkaloid found in endophyte-infected fescue,
(Zhang et al., 1994) results in hypothermia at TN and hyperthermia under HS conditions.
Other signs often observed with intake of E+ diet include decreased feed intake (FI),
growth rate and serum prolactin and these signs are independent of Ta. The combination
of altered thermoregulatory ability and reduced caloric intake over an extended period of
time will likely have a negative impact on general animal health and performance.
Like cattle, rats fed a diet containing endophyte-infected fescue seed (E+) exhibit
reductions in average daily FI and growth (Spiers et al., 2005a), making the rat a useful
3
animal model for the study of fescue toxicosis under controlled environmental conditions
(Osborn et al., 1992; Spiers et al., 2005a).
The liver is the most important organ for xenobiotic metabolism and
detoxification, and has been identified as a target organ of fescue toxicosis (Oliver,
1997). Long-term intake of E+ diet in cattle increases liver-specific enzymes (Piper et al.,
1991), and a component of the fescue toxicosis response in rats is reduced liver weight
(Settivari et al., 2006). Chestnut et al. (1992) noted that this reduction in liver weights in
rats fed an E+ diet is also observed in rats fed a control diet at the same caloric level (i.e.,
pair-fed group). Recently, Bhusari et al. (2006) reported that E+ mice differentially
express hepatic genes coding for cholesterol biosynthesis, antioxidants and de novo
lipogenesis under TN and HS conditions.
Little experimental data is available for a detailed comparative evaluation of the
effects of ergopeptine alkaloids on these research endpoints under controlled conditions
of short- and long-term exposures to heat, and such information would facilitate the
characterization of adaptation to one or both of these stressors (i.e., ergopeptine alkaloids
and/or heat).
The first objective of the present study was to evaluate the temporal effects of E+
and/or HS on various physiological responses, including core temperature (Tc), activity
count, FI, feed conversion efficiency (FCE), average daily gain (ADG), selected serum
biochemical parameters and visceral organ weights. The second objective was to identify
the temporal effects of E+ and/or HS on hepatic gene expression and to identify various
pathways that are affected as a result of either of the two stressors or the combination. It
was hypothesized that there are temporal differences in physiological and genomic

4
responses to tall fescue endophytic toxins under thermoneutral, short-term and long-term
heat conditions that characterize potentially adaptive processes.
5
CHAPTER II
LITERATURE REVIEW
Physiological responses associated with fescue toxicosis are often discussed in
context of the interaction with Ta. Since toxins associated with fescue toxicosis alter
thermoregulatory ability of the exposed animals, this review will discuss the normal
mechanisms of thermoregulation, and the action of ergot alkaloids in different thermal
environments. Then, the effects of fescue toxicants on hepatic detoxification pathways
will be discussed. These include cytochrome P450, antioxidants, and drug efflux
proteins. Finally, a brief description of microarray technique will be presented.
1. HEAT STRESS
1. 1. Introduction
A majority of the world’s domestic animal populations are in regions where
environmental stressors adversely influence productive efficiency (Gaughan et al., 1999).
Annual economic losses due to HS alone for the US livestock industry have been
estimated between $1.69 to 2.36 billion (St-Pierre et al., 2003). The dairy industry
experiences the greatest economic losses ($897 to $1,500 million) due to HS, followed by
beef ($370 million), swine ($299 to $316 million), and poultry ($128 to $165 million)
industries (St-Pierre et al., 2003).
1. 2. Effects of heat stress on livestock performance
The economic losses associated with HS in livestock industry are mainly because
of its negative effects on feed intake, activity, daily gain, male and female reproductive
6
performance, embryo development, etc. (Collier et al., 2006). As a result of reduced feed
intake and direct HS effects, numerous changes occur in the digestive tract, acid-base
chemistry, and hormone activity (West, 2003). Heat stressed animals often reduce feed
intake and seek shade, as well as increase respiratory, sweating and peripheral blood flow
rates at the expense of blood flow to mammary gland (in case of dairy cows) (West,
2003). This would result in reduced productive efficiency of the animals.
1. 2. 1. Effects on respiratory rate and animal core temperature
Animals under HS conditions increase both respiratory rate and water intake, and
reduce feed intake and serum T3 (reduced serum T3 results in reduced metabolic heat
production) levels to maintain homeothermy (Pereira et al. 2007). In conditions where
these avenues of heat loss and production fail to maintain homeothermy, animals
experience hyperthermia. Also, with increased respiration rate, a marked decline in blood
carbon dioxide (CO2) to oxygen (O2) partial pressure ratio occurs, leading to respiratory
alkalosis (Dale et al., 1954). This results in elevated blood and urine pH and decreased
net acid excretion rate (Sanchez et al., 1994). Respiratory alkalosis associated with HS
also disturbs ruminal microfloral environment, contributing to the overall deleterious
effects on production and physiological status of the animal (Wallace et al., 1996).
Elvinger et al. (1992) exposed dairy cows to hot environments (average black
globe temperature = 41ºC) for 15 days. They observed increased rectal temperature and
respiration rate in heat stressed cows compared to the cows maintained at TN throughout
the study period. Pereira et al. (2007) observed greater rectal temperature in steers that
were less resistant to HS (36ºC for 13 days). Srikandakumar et al. (2004) compared the
rectal temperature and respiration rate in black wooly Omani and white wooly Australian
7
Merino sheep during December (temperature humidity index; THI = 72 ± 1.4) and July
(THI = 93 ± 3.1) months. They observed increased rectal temperature and respiration rate
in both species during July compared to December.
1. 2. 2. Effects of heat stress on feed intake and daily gain
Most of the responses to HS are aimed at maintaining normal Tc. It is widely
known that HS reduces feed intake in an attempt to reduce the body heat, generated by
ruminal fermentation and body metabolism (Sanchez et al., 1994). Under chronic
stressful conditions, animals lower food intake together with blood circulating thyroid
hormone levels resulting in lower metabolic rate (Pereira et al., 2007). Typically, other
factors such as relative humidity, wind velocity, radiation load, and feed quality also
interact to affect the amount of feed consumed by a heat stressed animal under field
conditions (Sanchez et al., 1994).
Heat stress also reduces digestive tract motility, ruminal contraction rates, ingesta
passage rates, and increases gut mean retention time (Sanchez et al., 1994). Heat stressed
(32ºC) cows have greater digestibility of diets compared to those at TN (18ºC) conditions
(Warren et al., 1974). Cows with shade and without shade when fed the same amount of
diet, cows without shade exhibited increased ruminal acid production per unit of
fermentable feed, and their ruminal pH decreased compared to the cows in shade,
contributing to greater digestibility of feed under heat (Niles et al., 1980). However,
Wallace et al. (1996) reported a significant depression in body weight gain and feed to
gain conversion in heat stressed beef calves. Brosh et al. (1998) fed heifers either high or
low metabolizable energy (ME) diets during morning or evening hours under HS (30˚C)
conditions, with or without shade. Heifers consumed more O2 when fed the high ME diet
8
in morning versus evening hours, irrespective of shade conditions. Furthermore, the high
ME diet intake resulted in greater O2 consumption than the low ME diet, more so in the
morning than in the evening. This study highlights the significance of feeding high ME
during cool periods rather than in the morning, in order to enhance thermal status of the
animal.
Pereira et al. (2007) studied the effects of thermal stress (36ºC for 13 days) on Tc
and feed intake response in four different cattle breeds (Alentejana, Frisian, Mertolenga
and Limousine breeds). They observed least feed intake changes in the heat resistant
breeds (Mertolenga and Frisian), which suggests that the reduction in feed intake under
HS depends on the level of strain the animal underwent. Others have shown that feed
intake in rats is reduced with an exposure to HS (Johnson and Strack, 1989; Spiers et al.,
2005a). Reduced feed intake in the HS rats (32ºC) contributes to reduced average daily
gain (Johnson and Stack, 1989: Spiers et al., 2005a).
1. 2. 3. Effects of heat stress on hormones and blood chemistry
Serum chemistry provides information about carbohydrate, lipid, protein, mineral
metabolism, as well as other aspects of normal and abnormal physiology. Clinical signs
often observed in HS animals include decreased blood calorigenic hormones (i.e., T4, T3)
and alkaline phosphatase (Mitra et al., 1972; El-Nouty et al., 1990), but increased
prolactin (PRL) levels (Smith et al., 1997). Cattle exhibit decreased T3 and T4
concentrations (33 and 15%, respectively) during summer months but increase
concentrations during winter months (Johnson and Vanjonack, 1976). Reduced thyroid
hormone levels under HS conditions are due to the complex neuroendocrine processes
related to interactions among thermosensors, hypothalamus, pituitary and thyroid glands
9
(Pereira et al., 2007). Furthermore, hyperthermia inhibits the TSH-releasing hormone
(TRH) secretion by hypothalamus, resulting in decreased thyroid activity (Pereira et al.,
2007). A positive correlation is known to exist between Ta and serum PRL
concentrations. Serum PRL concentrations in steers rise when their Ta is raised from 20
to 40ºC, and their concentrations decrease when their Ta is reduced from 20 to 4ºC
(Smith et al., 1977). Similarly, Wetteman and Tucker (1976) observed elevated PRL
levels in heifers at 32ºC, but reduced levels at 4.5ºC compared to the animals maintained
at 21ºC. Heat stress exposure increases circulating PRL levels in rats (Neill, 1970), goats
(Sergent et al., 1988), sheep (Salah et al., 1995), and poultry (Johnson, 1981). Prolactin is
known to stimulate water and mineral intake in lower vertebrates (Bern, 1975), rabbits
(Burstyn, 1978), rats (Kaufman et al., 1981) and humans (Horrobin et al., 1971).
Therefore increased prolactin levels under HS conditions, help the animals to maintain
water and salt balance and at the same time to regulate their body temperature.
Catecholamines (epinephrine and norepinephrine) play an important role in
thermoregulation, and their plasma levels may be used as an index of thermal stress
(Davis et al., 1984). Davis et al. (1984) evaluated the effects of short-term HS (32 or
42ºC for 8 hours) or cold exposure (13ºC) on blood catecholamines (blood catecholamine
levels increase with stress) in Longhorn and Hereford cattle. They observed that HS
increased catecholamine levels only in Hereford during heat conditions as Longhorn
breeds were heat tolerant. Similarly, they observed elevated levels of catecholamines
only in Longhorn during cold conditions as Hereford cattle are cold tolerant. Similarly,
Alvarez and Johnson (1973) observed elevated plasma and urinary norepinephrine levels
of non-lactating Holstein during heat exposure (35 to 37ºC).
10
Heat stress is known to have negative effects on serum cholesterol level. Abeni et
al. (2007) monitored serum cholesterol level in dairy cows under summer conditions.
They observed reduced plasma cholesterol concentration in heat stressed cows. A similar
reduction in serum cholesterol level was evident in rats under HS (Fuquay et al., 1980).
Three-week-old chicks exposed to HS (38ºC for 2 hours/day) for 6 days resulted in
reduced serum cholesterol level (Zulkifli et al., 2000).
Heat stress reduces serum alkaline phosphatase (ALP) level in different species.
Abeni et al. (2007) observed reduced plasma ALP activity in dairy cows during summer
months and they confirmed that this enzyme as a quick and reliable blood-marker for HS.
Niu et al. (2007) observed a similar reduction in serum ALP, but increases in serum
creatinine, urea nitrogen, aspartate aminotranferase, alanine aminotransferase in rats
exposed to 43ºC for 20 min.
1. 2. 4. Effects of heat stress on immune system
Chronic heat is known to compromise immune status of the animal. Kelley et al.
(1982) exposed Holstein calves to constant HS (35ºC) or TN (23ºC) conditions and
measured their immune responses at different time periods (i.e., at the end of 3, 7 and 14
days). They observed that after HS for 3 to 14 days, immunoglobulin G1 averaged 27%
less in HS calves than in calves maintained at TN. Elvinger et al. (1992) exposed dairy
cows to HS (average black globe temperature = 41ºC) for 15 days. They observed greater
packed cell volume (possibly due to shock or dehydration) in HS cows than for cows at
TN. They also reported that the migrations of leukocytes to the mammary tissue, in
response to a chemotactic challenge of oyster glycogen, were reduced under HS
conditions. In a previous study, the same group observed that HS (42ºC) inhibited
11
random migration and chemotaxis of polymorphonuclear leukocytes compared to cows
maintained at TN. Joseph et al. (1991) studied the effects of acute HS (40ºC for 30
minutes) on immunological parameters in male albino rats. They observed decreased total
WBC count and neutrophilia, eosinophilia and lymphocytopenia in HS rats compared to
controls maintained at TN. They also noticed an increase in phagocytic index and lymph
node/BW, but a reduction in avidity index, thymus and spleen weight/BW. These results
show that HS has detrimental effects on immune status of an animal.
1. 2. 5. Role of heat stress in inducing oxidative stress
Heat stress causes protein structure instability throughout the body leading to
deleterious denaturation of various essential proteins (Salo et al., 1991). Several reports
in the past have correlated HS and hyperthermia with increased levels of oxidative stress
(Salo et al., 1991).
Sub-lethal H2O2 exposure in Saccharomyces cervisiae elicits the induction of a
variety of heat shock response genes involved in thermo protection, including heat shock
protein (HSP) 104 (involved in solubilization of aggregated proteins and the protection of
mRNA splicing), HSP 70 (protein folding and refolding), as well as the antioxidant
enzymes catalase, thioredoxin peroxidase and cytochrome C peroxidase (Godon et al.,
1998). Heat exposure provides cross-tolerance to lethal H2O2 exposure and depletion of
protein antioxidant defenses, including catalase, cytochrome C peroxidase, superoxide
dismutase and thioredoxin peroxidase sensitizes cells to lethal heat exposures (Davidson
et al., 2006). Niu et al. (2007) observed increased levels of lipid peroxidation and
oxidized-form glutathione/reduced-form of glutathione ratio in hypothalamus in rats
exposed to HS (43ºC for 20 min.) suggesting oxidative stress.
12
Zhang et al. (2003) tested if HS would increase the hepatic free radical levels in
two-year- and six-month-old rats. They heated the rats using an infrared lamp until Tc
reached 41ºC and then maintained them at this HS level for 30 minutes. Following HS,
the rats were allowed to passively cool at room temperature. A second HS exposure
occurred 24 hours after the first. After the second HS, the rats were euthanized at various
time points (0, 2, 6, 12 and 24 hours) and liver sections were collected. They followed a
similar protocol for the sham groups, except they were maintained at 22 to 24ºC
throughout the experiment. They observed an increase in the oxidative fluorescent
markers dihydroethidium and dihydrofluorescein diacetate in both age groups. In six-
month-old rats, reactive oxygen species (ROS) levels increased only in the early stages
after heating (1, 2 and 6 hours), returning to control level by 12 hours; however in two-
year-old rats, the marker levels remained high throughout the 24 hour post-stress period.
They also observed hepatocellular oxidative damage to lipids and DNA in two-year-old
rats at all time points. The antioxidant levels of glutathione (GSH) to glutathione
disulfide (GSSG) was reduced in heat stressed rats; however, in six-month-old rats, the
levels returned to TN level by 12 hours post-stress, whereas in two-year-old rats, the
levels remained low even at the end of 24 hours post-stress. Their study proved that
hyperthermic challenge produces oxidative stress in rat hepatic tissue with increased
levels of reactive oxygen species production and reduced antioxidant enzyme levels.
Bernabucci et al. (2002) measured antioxidant enzyme levels in transition cattle
exposed to mild HS (rectal temperature = 39.5 ± 0.2ºC; THI = 73.2 ± 2.5) conditions
during April to August. They did not observe any difference in plasma glutathione
peroxidase (GPx), thiol groups (SH), reactive oxygen metabolites, or thiobarbituric acid
13
reactive substrates (TBARS) between spring (April to May) and summer cows (June to
August). However, they observed increased levels of erythrocyte superoxide dismutase,
GPx, SH, and TBARS in summer cows compared to spring cows, indicating a condition
of oxidative stress in summer transition dairy cows. They hypothesized that during HS,
increased blood O2 pressure, due to increased respiratory rate, might be the cause of
alterations of oxidative status of erythrocytes. They also hypothesized that the presence
of high concentrations of polyunsaturated fatty acids in erythrocyte membranes, and the
presence of high concentrations of iron in hemoglobin might generate free radicals,
which could in turn cause alterations in erythrocyte antioxidant defense systems. They
reported that the increased antioxidant enzyme levels in summer cows represent
compensatory changes that the cows undergo in response to oxidative stress. They
suggested that erythrocytes are an appropriate and sensitive model to study the oxidative
status of dairy cows in hot environments.
Harmon et al. (1997), in contrast, reported the reduction of plasma antioxidant
activity in mid lactating cows exposed to a chamber temperature of 29.5ºC. Bernabucci et
al. (2002) did not observe any difference in the concentrations of lipid soluble
antioxidants, i.e., α-tocopherol, β-carotene, retinol and retinyl palmitate in muscle tissue
during 10 day continuous heat (mean dry bulb temperature = 38.3ºC). Bernabucci et al.
(2002) suggested that the discrepancies observed between such studies are mainly due to
the differences in the physiological status of the experimental animals and the tissue
tested across the studies.
Free radicals at low levels can induce antioxidant enzymes such as superoxide
dismutase, catalase, and glutathione peroxidase (Klatt and Lamas, 2000). However, when
14
free radicals are in excess of the antioxidant capacity they in fact become inhibitory to
these enzymes and factors (Klatt and Lamas, 2000). Antioxidant vitamins, such as E and
C, act as scavengers of free radicals to minimize DNA damage by glycooxidation
(Arechiga et al., 1998).
1. 2. 6. Effects of heat stress on heat shock proteins
Most animals react to heat and other stressors by synthesizing the evolutionary-
conserved HSP (Wu, 1995). They are classified based on their molecular weights. The
major ones are HSP 150, HSP 110, HSP 90, HSP 70, HSP 60, HSP 40 (Malago et al.,
2002).
Under stressful conditions, a family of DNA-binding proteins called heat shock
factors (HSF1-4, of which the best known is HSF1) transactivates various HSPs (Malago
et al., 2002). In unstressed cells, the inactive HSF is bound to the cytoplasmic HSP40, 70
and 90 in monomeric form without the DNA-binding activity. In response to stress, HSF
is released and translocates into nucleus, where it assembles into a trimer and binds to a
heat shock regulatory element present in the heat shock gene promoter. This binding
results in transcriptional activation of various HSPs (Santoro, 2000). The resulting HSPs
act as molecular chaperones and enhance cellular stability in an attempt to cope with the
severe conditions, thereby enabling the cell structure to function optimally and survive
the impact (Horowitz, 1998).
Up-regulation of HSPs as a result of whole body hyperthermia (42ºC for 15 min)
protects myocardial tissue against subsequent ischemia and hyperthermic injury in the rat
(Yamashita et al., 1998). Li et al. (2001) reported that HSPs generated through HS (45ºC
for 60 minutes) confer cardiovascular protection during heat stroke by alleviating severe
15
hypotension and bradycardia by potentiating the sensitivity and capacity of baroreceptor
reflex response.
The HSPs provide thermo-tolerance in animals by preventing protein denaturation
or increasing its repair (Kregel, 2002). By virtue of their anti-oxidant actions, HSPs
sequester pro-oxidant free iron, thereby reducing oxidative stress within cell (Sonna et
al., 2002). Sensitive organs such as the liver and small intestine are the first to accumulate
HSPs in response to whole body hyperthermia (Flanagan et al., 1995). Furthermore,
HSPs are known to protect against different kinds of environmental stressors such as
infection, inflammation, toxins, ultraviolet light, starvation, etc. (Malago et al., 2002).
1. 2. 7. Short versus long term heat stress effects on animal performance
Many animal studies have concentrated on the effects of acute (30 to120 min.)
and intense HS (41 to 42ºC) on physiological parameters. However, in real world,
animals are often exposed to chronic (days to months) and less intense (33 to 36ºC) HS
(Jordan, 2003; St-Pierre et al., 2003). Exposure to stressful conditions initially results in
impaired cellular performance (Schwimmer et al., 2006). To compensate for it, the short-
term heat acclimation (STHA) process increases excitability of autonomic nervous
system outflow signals. This is followed by enhanced cellular functions during long-term
heat acclimation (LTHA) that is accompanied by decreased autonomic excitability
(Schwimmer et al., 2006). During LTHA, hypothalamic threshold for body temperature is
decreased, resulting in activation of heat-dissipation mechanisms. Furthermore, the body
temperature threshold for the development of thermal injury increases under this
condition (Schwimmer et al., 2006).
16
Schwimmer et al. (2006) continuously exposed rats to 34 ± 1°C for 2 days
(STHA) or for 30 days (LTHA) to identify the hypothalamic gene expression changes in
response to acute or chronic HS. They observed an up-regulation in genes coding for
voltage-gated ion channels, ion pumps or transporters, hormone or transmitter receptors,
and cellular messengers leading to enhanced neurotransmitter signaling. They observed a
down-regulation of genes associated with intracellular protein trafficking, metabolism,
and phosphorylation processes to imply a perturbation in cellular maintenance. During
LTHA, genes encoding ion movement and cellular signaling returned to normal levels
but genes encoding mitochondrial energy metabolism, immune response, and cellular
maintenance processes were up-regulated. These results represent a shift from an early
transient, perturbed state (STHA) to a long-lasting efficient and stable acclamatory
homeostasis (Schwimmer et al., 2006).
Rats are known to adapt to chronic HS by decreasing metabolic heat production
(Arieli and Chinet, 1986; Shido et al., 1991; Gordon, 1993) and increasing heat loss
activities (Horowitz et al., 1983). Horowitz et al. (2004) continuously exposed rats to 34
± 1°C for 2 d (STHA) or for 30 d (LTHA) to identify the cardiac gene expression
changes in response to HS, and its association to ischemic-reperfusion cross-tolerance. At
the end of 2 d or 30 d period, the rats received a thermal challenge by exposure to 41ºC
for 2 hours. They observed an increase in the expression of genes coding for DNA
damage/repair, free radical scavenging, stress regulation, and effectors to protect the cells
from DNA damage and oxidative stress. However, they did not observe the up-
regulation of these genes in the chronic study. Instead, they observed the up-regulation
of genes coding for adaptive and long-lasting adaptive pathways, such as DnaJ (HSP40)
17
homologs (required for stabilizing the interaction of HSP 70), anti-apoptotic genes, and
anti-oxidants. These results suggest that the physiological and genomic responses to HS
vary temporally in a selective manner.
2. FESCUE TOXICOSIS
2. 1. Introduction – Fescue toxicosis
A large portion of the pasture grass in the US is tall fescue (Festuca
arundinacea), and it is considered as the primary cool season grass for livestock (Sleper
and Buckner, 1995). Tall fescue is reported to be imported into US from Europe as early
as 1771 (Terrell, 1979). It is known for its tolerance to drought, insects, and extreme soil
pH (4.7 to 9.5; Cowan, 1956). This grass has high seed production and forage yields,
vigorous rooting, and a long grazing season (Hanson, 1979).
Low demand on labor and grazing control make tall fescue a highly favorable
cultivar for livestock producers. Favorable environments for tall fescue grass include
humid and moderately temperate zones (Burns and Chamblee, 1979). Tall fescue is
expected to occupy greater than 14 million hectares in the US, extending from northern
Florida to Canadian border. Nutritive value of tall fescue (100 to 200 g crude protein/kg)
depends on genetic variant, plant maturity, and soil fertility. Highest nutritive value is
observed during the fall due to both high carbohydrate solubility and low lignin content
(Brown et al., 1963) and lowest during summer (Bughrara et al., 1991).
2. 2. Symbiotic association of fescue with endophyte
An endophytic fungus (Neotyphodium coenophialum) grows within tall fescue
and has a mutual symbiotic relationship with the grass. The endophyte grows between the
18
cell walls of the tall fescue, with mycelia growing throughout the intracellular spaces
(Kimbrough et al., 1993). It does not invade the plant cells nor is it pathogenic to the
plant (Thompson et al., 2001). The endophyte infects the developing seed and its life
cycle follows that of the fescue grass. The fungus and fescue grass interaction produces
various ergot alkaloids, which are toxic to grazing animals.
Fescue grass benefits from the endophyte-grass association, in part, because of a
group of ergopeptine alkaloids produced by the endophyte or the plant in response to the
endophyte. Ergopeptine and clavine alkaloids, peramine and loline alkaloids, are
biologically active and inhibit the activities of root eating nematodes and other insects,
and also reduce reproduction and growth in large animals (Thompson et al., 2001).
Fescue toxicosis is not just a problem for livestock, but also affects other species,
including horses (Cross et al., 1995), sheep (Gadberry et al., 2003), rabbits (Filipov et al.,
1998), rats (Spiers et al., 2005a), mice (Varney et al., 1991), meadow voles (Conover,
1998) and birds (Zavos et al., 1993).
The association also reduces plant defoliation, which helps the plant to capture
solar energy (Thompson et al., 2001). Endophyte-infected tall fescue has greater forage
and seed productivity than the uninfected (E-) form (Hill et al., 1991) and is more
drought and insect tolerant (West et al., 1993). The endophyte, in turn, receives a home
and food supply and therefore it is never subjected to environmental forces and is only
dependent upon plant health for its survival (Hill, 1994). So, it is in the plant’s interest to
provide the needs for the endophyte; and the endophyte to provide protection to the plant
against climatic and biological forces (e.g., insects) that may threaten the plants.
19
The Neotyphodium genus, unlike the Claviceps genus (similar fungi which
produce ergotism) do not transmit from one plant to another, but rather are confined to
the seed and transmit only though seeds (Sleper and Buckner, 1995). In a survey of over
1,500 pasture samples tested throughout US, more than 70% of the samples had 60% or
more endophyte infection rate (Shelby and Dalrymple, 1987).
2. 2. 1. Toxins associated with fescue toxicosis
Some of the ergot alkaloids associated with endophyte infected tall fescue (E+)
include ergovaline, ergotamine, ergocryptine, ergocornine, ergosine, lysergic acid amide,
and ergonovine (Porter, 1994). Ergopeptines are non-ribosomally-synthesized peptides,
containing lysergic acid and three amino acids that vary between and define the
molecules in the family (Panaccione et al., 2001). Ergovaline has historically been
identified as the putative toxin causing fescue toxicosis in E+ grazing livestock (Oliver,
1997; Porter, 1994). It comprises more than 85% of total ergopeptine alkaloids found in
E+ (McCollough et al., 1994). Ergovaline contains D-lysergic acid, L-alanine, L-valine
and L-proline and differs from ergotamine, the most common ergopeptine, in containing
L-valine in place of L-phenylalanine (Panaccione et al., 2001). Peramine is another ergot
product produced by the fungus-grass interaction in infected tall fescue grass. Peramine
alkaloids cause minimal toxicity in mammals (Cheeke, 1995; Porter, 1995), but are toxic
to insects (Porter 1994). However, some insects adapt to peramine and use it for their
own protection against predators (Porter, 1994). Loline alkaloids, though present in high
concentrations in E+, have little effect on grazing animals (Fletcher et al., 2000; Gadberry
et al., 2003) but are toxic to many insects (Wilkinson et al., 2000). Although loline
alkaloids alone are not thought to cause fescue toxicosis; Gadberry et al. (2003)
20
hypothesized a potential synergistic action with ergopeptine alkaloids that might
contribute to the condition.
2. 2. 1. 1. Ergopeptine versus ergoline alkaloids
Although ergopeptine alkaloids are considered to be responsible for majority of
clinical signs associated with fescue toxicosis, some researchers (Hill, 2005) have
proposed that ergoline alkaloids play a major role in producing the syndrome. Hill et al.
(2001) reported ergoline alkaloid (lysergic acid) is a circulating metabolite of ergot
alkaloid metabolism in herbivores. Lysergic acid was shown to have a greater absorption
potential across ruminant foregut in vitro than ergopeptines. Oliver et al. (1993) has
shown that a lysergic acid analog, lysergic acid amide, has a vasoconstrictive activity in
bovine tissue. Similarly, various ergopeptine alkaloids, such as ergotamine (Solomons et
al., 1989) and ergovaline (Dyer, 1993) vasoconstrict blood vessels in cattle. However,
Klotz et al. (2006) reported that lysergic acid is a weak vasoconstrictor and its
vasoconstrictor properties are evident only at very high levels (1X 10⁻⁴) (approximately
7-fold the maximum concentration often found in E+ grass). In contrast, Dyer (1993)
observed that bovine uterine and umbilical veins exposed to low concentrations of
ergovaline (1X 10⁻⁸) exhibit a slow and prolonged vasoconstriction mediated through
serotonin receptors. It also has a greater potential for bioaccumulation than lysergic acids.
Likewise, various in vitro (Strickland et al., 1994) and in vivo (Spiers et al., 1995) studies
using pure ergovaline support the hypothesis that ergovaline contributes to many of the
clinical signs associated with fescue toxicosis. Spiers et al. (1995) reported hyperthermia
in heat stressed (31 to 33ºC) rats’ injected intraperitonially with ergovaline, as a result of
reduced peripheral heat loss across the tail. Other livestock maladies associated with
21
ergovaline consumption include reduced feed intake, poor weight gain, and hormonal
imbalances leading to reduced fertility, reduced lactation, and gangrene of limbs
(Panaccione et al., 2001). Therefore it can be speculated that ergoline compounds by
themselves are very weak vasoconstrictors, and therefore do not have the capability to
cause fescue toxicosis by themselves. However, in combination with ergopeptine
alkaloids, they might contribute to the clinical signs associated with fescue toxicosis.
Ergovaline may not be the only contributor to fescue toxicosis and may work in
concert with other ergot alkaloids to produce the toxicological syndrome (Gadberry et al.,
2003). Gadberry et al. (2003) tested lambs to determine if a diet containing synthetic
ergovaline and a diet containing E+ seed would exhibit similar clinical signs. Their diets
consisted of 10% E- fescue seed diet (E- group), 10% E- fescue seed diet containing pure
EV (EV group), and 10% E+ fescue seed diet (E+ group). They observed a reduction in
feed intake and growth rate of the E+ group compared to both E- and EV groups, with no
difference between EV and E- groups. The EV did cause peripheral vasoconstriction and
reduction in serum PRL levels compared to E- group, however, the E+ diet produced a
greater response compared to EV diet alone. Therefore, they concluded that ergovaline is
a fescue toxicant; however, it is not as effective as the E+ diet in producing fescue
toxicosis symptoms, to suggest that additional alkaloids might contribute to the full
fescue toxicosis response.
2. 3. Toxicological conditions associated with fescue toxicosis
Physiological responses to fescue toxicosis are often discussed in the context of
an interaction with Ta. Fescue toxicosis-related health problems are exacerbated by
extreme Ta. The type of thermal stress (i.e., cold versus hot) experienced by livestock
22
exposed to E+ tall fescue is an important determinant of which clinical signs are observed
with fescue toxicosis (Hemken et al., 1981). The toxicological conditions associated with
fescue toxicosis can be broadly divided into three types. They include summer slump,
fescue foot and fat necrosis.
During HS conditions, an economically significant syndrome (i.e., summer
slump) occurs in E+ fed animals, which results from alterations in thermoregulatory
ability and changes in endocrine and neurotransmitter milieus (Burrows and Tyrl, 2001;
Kerr and Kelch, 1999; Paterson et al., 1995). The E+ beef cattle under HS conditions,
exhibit poor performance due to disruption of the normal patterns of diurnal Tc (Al-
Haidary et al., 2001; Burke et al., 2001). Summer slump is more common in cattle and
sheep, under hot and humid conditions, and it is characterized by hyperthermia, rough
hair coat, tachypnea, increased salivation, hypoprolactinemia, and reductions in
reproductive performance. Feed intake, growth rate and milk production (Aldrich et al.,
1993; Burrows and Tyrl, 2001; Kerr and Kelch, 1999) may also be reduced, but this may
occur at any Ta.
In contrast to summer slump, fescue foot occurs in E+ fed animals during cold
environmental temperatures and it is characterized by tissue necrosis and dry gangrene of
the distal extremities, including tips of the ears and tail (Yates, 1983). Fescue foot
develops in cattle during long-term intake of endophyte-infected tall fescue hay or
pasture, and most commonly affects the hind limbs (Spiers et al., 2005b). Clinical signs
start with swelling and reddening at coronary band, knuckling of the pastern joint, and
arching of the back and in extreme cases. Animals will appear unthrifty, with increasing
lameness and inflammation and ischemic necrosis of the hooves, associated phalanges,
23
joints and soft tissue (Burrows and Tyrl, 2001). Furthermore, under cold conditions, E+
fed animals’ exhibit hypothermia. Spiers et al. (1995) reported hypothermia in rats
following ip injection of ergovaline under TN and cold stress conditions, which they
attributed to reduced metabolic heat production.
Both summer slump and fescue foot conditions occur mainly because of
peripheral vasoconstriction, with the animal being unable to dissipate its internal heat
during the summer and supply sufficient nutrients to active tissues during winter
conditions. Fat necrosis is a rare condition characterized by formation of large necrotic
fat masses within the stomach region, which obstruct gastrointestinal and reproductive
tracts leading to various abnormalities (Smith et al., 2004).
2. 3. 1. Effects of endophyte-infected fescue on livestock performance
Livestock that graze endophyte-infected tall fescue diet (E+) develop clinical
signs collectively known as fescue toxicosis (Gadberry et al., 2003). Characteristic
clinical signs associated with fescue toxicosis vary with the level of environmental stress
and thermal strain of the animal. Reduced feed intake and increased Tc are probably
responsible for many of the problems associated with fescue toxicosis.
2. 3. 2. Effects of endophyte-infected fescue on core body temperature and
respiratory rate
Fescue toxicosis-related health problems are Ta-dependent and are exacerbated by
extreme conditions. The level of environmental stress experienced by livestock exposed
to E+ tall fescue is an important determinant of which clinical signs are observed in cases
of fescue toxicosis (Spiers et al., 2005b). Under cold or TN conditions, E+ fed animals
exhibit lower or unaltered Tc, with no change in respiration rate. Neal and Schmidt
24
(1985) observed lowered Tc in rats fed an E+ diet 21ºC for 15 days. Similarly, Spiers et
al. (1995) observed a decrease in both Tc and tail temperature in ergovaline-injected rats
at 7-9ºC. However, Osborn et al. (1992) did not observe any change in Tc, as well as
respiration rate, in steers consuming E+ diet at 21ºC.
Intake of an E+ diet during HS increases Tc and respiration rate. Elevated Tc
results from the inability to transfer core heat to peripheral tissues (Rhodes et al., 1991).
This is because of peripheral vasoconstriction resulting from the agonistic properties of
E+ toxicants with α-2 adrenergic and serotonin receptors (Oliver, 2005). Steers on an E+
diet exhibited only one-half the heat loss of steers consuming E- diet at 32ºC, however, at
22ºC heat loss was similar between E- and E+ animals (Paterson et al., 1995). Al-Haidary
et al. (2001) reported that the exacerbated poor performance in E+ fed beef cattle during
HS is associated with the disruption of the normal patterns of diurnal Tc. Similarly,
Osborn et al. (1992) observed a significant increase in Tc and respiration rate in E+ diet
fed steers at 32ºC. Spiers et al. (1995) investigated the effects of injecting rats with
ergovaline (EV) in hot environment (31 to 33ºC). Treatment during HS resulted in an
elevation of rectal temperature and a reduction in tail temperature suggesting peripheral
vasoconstriction.
Nickerson (1970) and Loew et al. (1978) suggested that ergot alkaloids can
increase Tc by a direct effect upon the temperature regulating areas in the brain. This
central effect upon Tc was found to occur at a lower dosage compared to that necessary
to mediate vasoconstriction (Thompson et al., 2001).
25
2. 3. 3. Effects of endophyte-infected fescue on feed intake
The effects of fescue toxicosis on feed intake have been extensively studied. A
typical response to ingesting an E+ diet is a reduction in feed intake in both rodents
(Spiers et al., 2005a) and livestock (Jackson et al., 1984). Neal and Schmidt (1985)
observed decreased feed intake and growth rate in rats feeding on E+ diet at TN for 15
days. Similarly, Spiers et al. (2005a) observed feed intake reduction by more than 50%
within the first 24 hours on E+ diet at TN. Likewise, cattle fed a diet containing E- seed
at 22ºC ate more than those fed a diet containing E+ seed (EV concentration in E+ diet
was 285 ppb) (Aldrich et al., 1993).
The effect of E+ diet on feed intake appears to be exacerbated by HS (Hemken et
al., 1981). At 32ºC, Aldrich et al. (1993) observed greater feed intake of cattle on E-
compared to E+ diets, though HS reduced feed intake for both groups. Similarly, Roberts
et al. (2002) and Spiers et al. (2005a) observed decreased feed intake in rats fed an E+
diet under HS conditions. Likewise, Gadberry et al. (2003) reported a reduction in feed
intake in lambs fed an E+ diet at 32ºC compared to those on an E- diet.
The reason for the large, rapid reduction in feed intake is unknown. Spiers et al.
(2005a) ruled out the possibility of amount of seed in the diet or palatability of the ground
seed diet as the responsible causes for the reduction in feed intake, as rats fed on E- diet
had identical content and amount of fescue seed.
Several neurotransmitters affect feed intake and gut motility. Ergot alkaloids
possess high affinity for α-2 adrenergic, dopamine, and nearly all subtypes of 5-
hydroxytryptamine (5-HT) receptors (Perz et al., 1999). Peripheral and central serotonins
play an important role in normal satiation (Pollock and Rowland, 1981). Pollock and
26
Rowland (1981) observed a dose-related decrease in feed intake in hungry rats upon
intraperitoneal serotonin injection. Similarly, injection of α-adrenergic receptor agonists
into the paraventricular nucleus (Wellman et al., 1993) or intraperitoneal injection of
dopamine agonist (Bednar et al., 1991) reduces feed intake in rats. Given the agonistic
properties of ergot alkaloids with serotonin, dopamine, and adrenergic receptors, it is
speculated that the reduced feed intake associated with fescue toxicosis could be partially
associated with these receptors. Oliver et al. (2000) observed increased tryptophan levels
in E+ fed cattle, and hypothesized that increased tryptophan levels impact serotonin
levels in hypothalamus and thereby affect feeding behavior. Porter et al. (1990) reported
increased serotonin metabolite levels in the hypothalamus of E+ fed cattle suggesting
activation of serotonin receptors by E+ toxicants. Also, a majority of serotonin receptors
are localized in gastrointestinal tract, where serotonin plays a major role in gut motility.
Activation of serotonin receptors in gut may increase gut motility leading to impaired
feed utilization and diarrhea, which are clinical signs often observed in E+ fed cattle
(Coppock et al., 1989; McCollough et al., 1993).
Several attempts have been made to alleviate the clinical signs associated with
fescue toxicosis. Dopamine antagonists such as haloperidol, phenothiazine, domperidone,
metaclopramide, and spiperone have been tested to determine if they can minimize the
toxicological conditions of fescue toxicosis. These antagonists increase serum PRL levels
but have only limited effects on body heat dissipation (Bolt et al., 1983; Boling et al.,
1989). Metaclopramide injections increase serum PRL and cholesterol levels, increase
grazing time during the hot period of the day, increase daily gain, increase blood flow to
the pancreas, adrenal gland and duodenum in steers (Lipham et al., 1989; Rhodes et al.,
27
1991) but do not alter dry matter digestibility or Tc in lambs (Aldrich et al., 1993).
Intraperitonial injection of prazosin (α-adrenergic antagonist) into rats fed an E+ diet
increase dry matter intake and aid in the dissipation of body heat under HS conditions
(Larson, 1993).
2. 3. 4. Effects of endophyte-infected fescue on body weight and growth rate
Decrease in BW and growth rate are characteristic symptoms of fescue toxicosis.
The decrease in growth rate could be due to reduced feed intake and feed conversion
efficiency. Spiers et al. (2005a) observed a parallel decrease in body weight and growth
rate along with reduced feed intake in E+ fed rats at TN. They noted that the rate of
increase in BW and ADG were less (70 to 78%) for E+ than for E- rats. Likewise, Neal
and Schmidt (1985) observed a 63% decrease in ADG for E+ rats fed under similar
conditions. Similarly, E+ fed cattle reduce ADG from 22 to 79% under a variety of
ambient conditions (Schmidt et al., 1982; Stuedemann et al., 1986).
Under HS conditions, E+ diet fed animals are known to have a greater reduction
in growth rate and BW. Gadberry et al. (2003) observed a greater reduction in average
daily gain in E+ compared to E- lambs when they were fed with E+ feed under HS
conditions. Similarly, Johnson and Stack (1989) reported that HS reduces BW and
growth rate in rats. Spiers et al. (2005a) observed a similar decrease in average daily gain
in rats when exposed to HS.
Prolactin is known to increase the circadian rhythm of lipogenic and insulin
receptor numbers in hepatic tissue of hamsters, and inhibition of PRL secretion decreases
hepatic lipogenic rates (Gerardo-Gettens, 1989). Similarly, Cross et al. (1995) suggested
hypoprolactinemia as one of the main causes for decreased body weight in E+ fed cattle.
28
Therefore, hypoprolactinemia seen in E+ animals could contribute to the lowered BW
gain in E+ rats by lowering hepatic lipogenic rates.
Clinical signs observed in fescue toxicosis may be due to the direct effects of
toxicants or to reduced dry matter intake. To separate the reduced dry matter intake from
reduced feed intake, Varney et al. (1991) used pair-fed studies, and identified
developmental and pubertal delays in pup mice born to E+ seed fed dams. The E+ diets
also increased estrous cycle abnormality and reduced testicular-epididymal weight. In a
separate pair-fed study, Larson et al. (1992) observed that consumption of E+ seed by rats
reduced dry matter intake by 11% and reduced growth and nitrogen (N) digestibility at
TN (20ºC). In the same study, exposure to HS (32ºC) reduced dry matter intake, growth
rate, body N gain, apparent N digestibility, and N retention. These observations support
the notion that fescue toxicants by themselves reduce production efficiency in animals.
2. 3. 5. Effects of endophyte-infected fescue on feed conversion efficiency
The reduced feed conversion efficiency associated with fescue toxicosis could
hinder the animal’s ability to utilize the feed energy for production aspects. Diets
containing E+ tall fescue were reported to reduce dry matter and organic matter
digestibility in sheep (Hannah et al., 1990), cattle (Aldrich et al., 1993), and rats (Larson
et al., 1992). Schmidt et al. (1982) noted a reduction in ADG in steers that consumed
fescue toxins, and hypothesized that the observed reduction is not solely due to reduction
in feed intake. Similarly, Osborn et al. (1992) observed that, even though some E+ fed
steers consumed feed more than the calculated maintenance level (NRC, 1984) they lost
weight. Reduction in ADG in the above cases could be mainly due to the reduction in
feed conversion efficiency. Similar results were observed by others (Neal and Schmidt,
29
1985; Hoveland et al., 1993). The reasons for the reduction in feed conversion efficiency
are not yet identified.
Dopamine and serotonin are capable of rapidly increasing gastric and small
intestine motility and also vasoconstrict mesenteric blood vessels (Estan et al., 1995).
Since it is known that ergot alkaloids act as dopaminergic and serotonergic agents, they
activate the dopamine and serotonin pathways. This might result in improper feed energy
absorption due to lack of sufficient nutrient absorption time (as a result of increased
gastric and intestinal motility) resulting in the observed reduction in feed conversion
efficiency. Thompson et al. (2001) concluded that growth in rats and cattle is affected by
the endophyte in a manner beyond reduced intake, and they speculated that animals used
the energy for other functions, such as hepatic mixed function oxidase activity related to
detoxification rather than production activities. In support of this speculation, Zanzalari et
al. (1989) observed an increase in sheep hepatic mixed function oxidase activity as a
result of toxic fescue intake. Also, the effects of ergot alkaloids on various digestive
enzymes, gastrointestinal tract epithelia, pH, and microflora are not known and this
possibility cannot be ruled out since GIT is the first organ that is exposed to full spectrum
of ergot alkaloids on oral intake. Although the reasons are not fully known, it can be
concluded that fescue toxicosis impairs the animal’s ability to fully utilize the feed
energy for production purposes.
2. 3. 6. Interactions of ergot alkaloids associated with endophyte-infected fescue
with biogenic amine receptors
Ergopeptide alkaloids, present in E+ tall fescue, affect various biogenic amine
receptors (Dyer, 1993; Larson et al., 1999). Stimulation of these receptors by these
30
alkaloids contributes to vasoconstrictive properties that are known to deprive tissues of
proper blood flow for heat loss and nutrition (Spiers et al., 2005a). Stimulation of α-2
adrenergic receptors by the alkaloids enhances blood platelet aggregation, which is likely
involved in the various coagulopathies that occur with severe toxicity (Oliver, 1997).
Ergovaline has agonistic properties with α-2 adrenergic receptors and therefore
has a greater effect on venous (where α-2 receptors predominate) compared to arterial
locations (Oliver et al., 1993). Smaller blood vessels are more sensitive to ergot alkaloids
compared to larger arteries (Oliver, 1997). Activation of α-2 adrenergic receptors often
results in persistent vasoconstriction of smooth muscle cells in the veins (Oliver, 1997),
which is a characteristic of fescue toxicosis. Dopamine-2 receptor (D2) stimulation by
these alkaloids reduces PRL secretion, which is the cause of the decreased milk secretion
in animals that graze on E+ pastures (Larson et al., 1999).
Ergot alkaloids such as ergine and EV also possess high affinity for nearly all
subtypes of 5-hydroxytryptamine (5-HT) receptors (Dyer, 1993). Several ergot alkaloids,
including ergovaline and ergotamine have agonistic properties with serotonin-2 receptors
(Oliver, 2005). Moreover, serotonin-2 receptors are present throughout the CNS, blood
vessels, gastrointestinal tract, and on platelets Martin, 1994). Activation of serotonin-2
receptors by EV results in both vasoconstriction and vascular smooth muscle cell
proliferation leading to reduced vascular lumen (Oliver, 1997). Furthermore, various
serotonin-2 receptor agonists such as 3, 4-methylenedioxymethamphetamine (MDMA)
disrupt thermoregulatory ability of rats, making Tc dependent on the Ta above 26ºC
(Malberg and Seiden, 1998). Given the agonistic properties of ergot alkaloids associated
with fescue toxicosis, it can be speculated that serotonin receptors also contribute to the
31
hyperthermic conditions often seen in E+ diet fed animals during HS. Cattle grazing on
E+ tall fescue pasture have increased serotonin metabolites in the central nervous system,
suggesting activation of serotonin receptors as a result of E+ diet intake (Porter et al.,
1992). Oliver et al. (2000) observed increased tryptophan levels in serum from cattle on
E+ pasture, to result in reduced feed intake (Rossi-Fanelli and Cangiano, 1991).
2. 3. 7. Effects of endophyte-infected fescue on blood chemistry and hormonal
changes
Toxicants associated with fescue toxicosis affect a variety of enzymatic systems
associated with the liver. Intake of an E+ diet reduces serum alkaline phosphatase,
aspartate aminotransferase, and aniline transaminase (Piper et al., 1991; Thompson and
Steudeman, 1993). Piper et al. (1991) hypothesized that the depression in transaminases
in E+ fed animals is likely due to hepatic toxicity, which could depress overall hepatic
detoxifying efficiency (Piper et al., 1991). However, Oliver (1997) and Schultze et al.
(1999) suggested that the reductions in hepatic enzyme activity in E+ animals were due to
nutrient deficiency (minerals, vitamins and proteins) as a result of reduced caloric intake.
Ergot alkaloids associated with fescue toxicosis such as ergotamine, ergonovine,
and ergovaline affect renal function. The toxicants reduce renal Na+/K+ ATPase enzyme
in rats (Moubarak et al., 2003a). The enzyme plays a major role in optimizing renal
filtration and excretion/retention of minerals across the nephron. Serum sodium and
potassium levels are decreased and blood urea nitrogen levels are increased in cattle
grazing on E+ pasture (Oliver et al., 1997). This is possibly because of α-2 adrenergic
receptor activation resulting in decreased antidiuretic hormone release and decreased
tubular reabsorption of salt and water (Oliver, 1997). Creatinine, a protein produced by
32
muscle, is relatively stable in animals and is used to evaluate renal function. Schultze et
al. (1999) and Oliver et al. (2000) observed elevated levels of serum creatinine and total
bilirubin in cattle grazing E+ pastures and they concluded that these observations were
indicative of reduced renal filtration rates.
Alkaline phosphatase is a representative brush border enzyme functionally
involved in nutrient absorption and transport of long chain fatty acids in the intestinal
mucosa (Kaur et al., 1996). In rats, a majority of serum ALP is intestinal in origin.
Alkaline phosphatase activity in rats depends on ADFI status, with a reduction in activity
during a 3 to 4 day fast (Holt and Kotler, 1987). Therefore, lowered ALP activity is
associated with reduced ADFI, which is the characteristic feature of E+ rats. Reduction in
serum ALP activity in E+ fed animals occurs consistently (Rice et al., 1997). Reduction
in serum ALP was also observed in steers fed an E+ diet (Schultze et al., 1999).
One of the prominent signs of fescue toxicosis is increased serum ALT levels in
E+ treated animals. Alanine aminotransferase, found in hepatocytes and striated muscle
cells increases only during hepatocellular injury or necrosis of striated muscles
(Valentine et al., 1990). Similar increase in serum ALT levels was observed in steers
exposed to fescue toxicosis (Schultze et al., 1999) suggesting liver and skeletal muscle
damage.
Blood urea nitrogen (BUN) is an indicator of the amount of urea nitrogen (i.e., a
waste product of protein metabolism) and protein metabolism. Blood urea nitrogen levels
are reduced in E+ fed animals. Liver damage causes a reduction in blood urea level since
urea is synthesized by the liver (Satirapoj et al., 2007). Decreased BUN levels are also
seen during malnutrition and impaired nutrient absorption (Preston et al., 1965).
33
Intake of an E+ diet by rats significantly reduces serum amylase (Spiers et al.,
2001); however, steers and heifers on long-term E+ treatment increase serum amylase
level (Nutting et al., 1992). Elevated serum amylase is a common indicator of pancreatic
toxicity, resulting specifically from damage to the exocrine portion of the gland (Hirano
et al., 1992). Bovines lack salivary amylase and therefore exclusively depend on pancreas
for the enzyme (Nutting et al., 1992). Although the exact effects of fescue toxicosis on
pancreas are not fully understood, it can be speculated that the exocrine portion of the
pancreas is affected.
Serum cholesterol is reduced by feeding an E+ diet to cattle (Stuedemann et al.,
1985), and rats (Bhusari et al., 2006). It is not known if this reduction is due to increased
cholesterol uptake by the tissues or decreased hepatic secretion (Thompson et al., 2001).
Cattle grazing on toxic tall fescue during summer months exhibit decreased serum
triglyceride levels (Oliver et al., 1995). Gadberry et al. (1995) observed similar results in
rats consuming an E+ seed based diet. Stuedemann et al. (1985) made an association
between high-nitrogen fertilization of E+ tall fescue, reduced serum cholesterol, and
incidence of fat necrosis in cattle. Lowered total serum cholesterol leads to lowered
steroidogenesis (Burke et al., 2001) which is another prominent symptom of fescue
toxicosis leading to reduced estradiol and progesterone (Burke et al., 2001)
concentrations in female cattle. Decrease in the concentrations of estrogen and
progesterone may lead to various reproductive problems often seen in E+ animals. Since
cholesterol is the precursor for various steroid hormones, lowered cholesterol
biosynthesis in E+ animals could be one of the main reasons for the various male and
female reproductive problems observed in E+ animals. Although PRL is necessary to
34
initiate lactogenesis, the involvement of progesterone and estrogen in lactation is
significant. Estrogen and progesterone stimulate development of ductal and secretary
structures when mammary tissue is primed with insulin, aldosterone, and PRL (Forsyth,
1983). Therefore the common reproductive problems associated with fescue toxicosis
could be partly due to the lowered steroidogenesis because of lowered cholesterol
biosynthesis.
Oliver et al. (2000) did not observe any changes in serum mineral levels, except
copper, in steers grazing on E+ tall fescue. They noted a reduction in serum copper levels
in E+ fed steers compared to E- fed steers. Dennis et al. (1998) reported that the reduction
in serum copper levels in E+ fed cattle could be because of reduced copper levels in E+
tall fescue.
Insulin-like growth factor is reduced in E+ fed compared to E- fed cattle (Lipham
et al., 1989), which they attributed to the reduced feed intake and growth rate. However,
there are no consistent effects of E+ tall fescue on serum growth hormone level (Lipham
et al., 1989; Oliver et al, 1997). Oliver et al. (2005) hypothesized that growth hormone
secretary changes do not contribute to the decreased weight gains associated with E+ tall
fescue intake.
Oliver et al. (2000) observed microcytic (smaller in size), hypochromic (less
hemoglobin content) erythrocytes in E+ fed compared to E- fed steers, but the number of
erythrocytes were greater in E+ compared to E- fed animals. They hypothesized that the
reduction in mean corpuscular volume and mean corpuscular hemoglobin is due to the
reduced serum copper levels in E+ fed animals which could affect hemoglobin synthesis.
35
2. 3. 7. 1. Effects of endophyte-infected fescue on prolactin
Serum PRL is reduced in livestock (Thompson et al., 1989) and rats (Mizinga et
al., 1993) consuming E+ diets. The effect of fescue toxicosis on PRL level is independent
of Ta. Aldrich et al. (1993) reported a suppression in PRL level in cattle consuming E+
during exposed to heat (32ºC) and thermoneutral conditions (22ºC). Lambs fed on E+
(10%) diets had a 93.6% reduction in serum PRL levels compared to lambs fed the E-
diet (Gadberry et al., 2003). They reported that changes in PRL are more sensitive to
fescue toxicosis than feed intake, skin temperature and Ta. Pure ergovaline reduced PRL
concentrations when injected into cattle (McCollough et al., 1994), added to pituitary
culture system (Strickland et al., 1994) and when added to diet in lambs (Gadberry et al.,
2003).
Ergot alkaloids are potent dopaminergic agonists and pituitary secretion of PRL is
inhibited by dopamine stimulation (Lamberts and Macleod, 1990). The central nervous
system and pituitary have an abundance of dopamine receptors (Thompson et al., 2001).
Depressed serum PRL in animals consuming E+ diets indicates an impact of ergot
alkaloids on both pituitary and neural function. Mizinga et al. (1993) studied the effects
of endophyte on hypothalamic and striatal dopamine D2 receptor density and binding
affinity in rats fed E+ seed (EV concentration was 1.91 micrograms/g) for 21 days. They
observed that endophyte did not change the dopamine D2 receptor density, but increased
D2 receptor affinity for ergot alkaloids.
Dull and shaggy hair coat changes associated with fescue toxicosis may also be a
result of depressed serum PRL (Thompson et al., 2001). Decreased serum prolactin levels
in the Djungarian hamsters are an important component of the change into winter pelage
36
(growth of a whitish winter coat) (Niklowitz and Hoffmann, 1988). Lipham et al. (1989)
treated E+ fed steers with metaclopramide (dopamine antagonist) and observed increased
serum PRL, improved hair coat quality, and BW gain. From these results, it can be
speculated that retention of rough hair coat (Aiken et al., 2006) often seen in cattle on E+
pastures could partially be associated with hypoprolactinemia.
Prolactin receptors are found not only in mammary glands but also in liver,
kidney, cerebral cortex, and seminal vesicles (Turington et al., 1972). Decreased PRL
levels lead to agalactia, lowered androgen dependent enzyme activity (Prasad et al.,
1989), impaired spermatogenesis (Jabbour et al., 1998), lowered serum testosterone
levels (Regisford et al., 1993), and immune suppression (Reber et al., 1993) in large
animals. Prolactin plays an important role in regulation of hepatic lipogenesis rate, insulin
receptor number, ADFI, immunomodulation, water electrolyte balance, and temperature
regulation (Strickland et al., 1993). Other effects of PRL in mammals include synergistic
effects with steroid hormones on gonad functions and effects on male accessory glands;
in addition distribution of PRL receptors in various tissues such as liver, kidney, cerebral
cortex, seminal vesicle suggests the involvement of PRL in various physiological
processes (Strickland et al., 1993). Therefore hypoprolactinemia associated with fescue
toxicosis could affect many vital organ functions in the body.
2. 3. 8. Effects of endophyte-infected fescue on immune system
Steers grazing on E+ tall fescue are found to have lowered immune function that
is associated with copper deficiency (Saker et al., 1998). Filipov et al. (1999) challenged
the steers, fed an E+ diet for eight months, with acute lipopolysacharide (LPS). They
observed a higher immune-inflammatory response in the E+ group as reflected by higher
37
values of serum cortisol and tumor necrosis factor-α, and suggested this is an indication
of a sensitized hypothalamic-pituitary-adrenal axis and immune system. Likewise, in a
separate study, they observed an increase in the levels of proinflammatory cytokine IL-6
in ergotamine treated mice (Filipov et al., 1999). Cattle feeding on E+ diet have
suppressed phagocytic activity, as evidenced by reduction in monocyte major
histocompatability complex class II (MHC-II) (Saker et al., 1998). Schultze et al. (1999)
and Oliver et al. (2000) reported a reduction in total eosinophil count, γ-globulin levels in
cattle chronically fed an E+ diet. Furthermore, Oliver (1997) reported that chronic
ingestion of E+ diet by cattle increased thrombogenic (i.e., clot formation) activity and
acute phase proteins (i.e., von Willebrand factor) levels, which serve as biomarkers of
endothelial cell damage (Hirano et al., 2000). Oliver et al. (2000) observed the elevation
of thromoxane levels and platelet aggregation in E+ fed steers. Effects of ergot alkaloids
on the immune system add further to the complexity of fescue toxicosis.
2. 3. 9. Effects of endophyte-infected fescue on endothelial cells
Clinical signs associated with fescue toxicosis are due, in part, to effects of
alkaloids on vascular endothelium, with resultant effects leading to thickened blood
vessels, increased vascular tone, hypercoagulability, ischemia, and gangrenous necrosis
of tissues (Oliver, 2005). Thompson et al. (1950) identified vascular endothelium as the
cellular target for initial injury by ergot alkaloids. Schultze and Oliver (1999) exposed
bovine endothelial cells to ergot alkaloids (ergovaline and ergine) at a concentration of
10-5 M. Ergine, at this dose level, only caused minimal effects, however ergovaline
caused marked cytotoxic effects. In a separate study, ergovaline was cytotoxic to
endothelial cells at a concentration of 10-4 M, while ergine had only a slightly toxic
38
effect. Therefore, Oliver (2005) hypothesized that ergot alkaloid-induced toxicity on
endothelial cells in vivo results in elaboration of inflammatory mediators and also
changes the clotting factor profile. A case study in humans (Pietrogrande et al., 1995)
reported the damage of endothelial tissue and platelet dysfunction due to the chronic use
of ergotamine in treatment of migraine headaches. Strickland et al. (1996) tested the
effects of various ergot alkaloids (ergonovine, α-ergocryptine, ergovaline, N-acetyl
loline) on isolated bovine vascular smooth muscle cells from the dorsal metatarsal artery.
They observed mitogenic effects of these alkaloids on E+ fed bovine blood vessels
leading to well-described thickening of blood vessels. The blood vessel thickening in E+
tall fescue-fed cattle was also reported earlier (Garner and Cornell, 1978; Oliver and
Schultze, 1997). Oliver and Schultze (1997) reported that the ergot alkaloids damage
vascular endothelial cells, allowing ergot alkaloids to come in contact with various
mitogenic agents in the underlying smooth muscle cell layers, resulting in vascular
smooth cell proliferation. Reduced lumen size resulting from mitogenesis might
contribute to the vascular complications that arise in E+ fed animals (Aldrich-Markham
et al., 2003). Oliver (2005) reported inflammation as an important etiological factor for
various pathological changes that occur in E+ fed animals. He linked various clinical
signs associated with fescue toxicosis, such as febrile response, hyperanalgesia, lameness,
and blood stasis in peripheral vessels that leads to coagulation defects, to inflammation.
Ergot alkaloids also affect biologically active substances released by endothelial cells,
such as increased angiotensin converting enzyme, which leads to increased angiotensin II
levels in the sera of E+ fed cattle. Angiotensin II is a potent vasoconstrictor that impacts
fluid and electrolyte balance through antidiuretic hormone and aldosterones release
39
(Oliver, 2005). Cattle exposed to E+ diet are reported to have greater levels of von
Willebrand factor (Vwf), which increases the risk for hypercoagulability and thrombosis
(Oliver, 2005). Oliver et al. (1998) reported increased levels of thromboxane A2 (TXA2)
in cattle that graze E+ fescue. Thromboxane A2 is a potent vasoconstrictor that is formed
in blood platelets, and its increased level suggest thrombotic events (vascular occlusions)
occurring in E+ fed cattle (Oliver, 2005). Oliver et al. (2000) found reduced serum
arginine (a precursor of NO) level in E+ fed cattle, resulting in nitric oxide (NO)
deficiency, which contributes to increased vasoactivity and blood platelet activation.
They also observed a significant reduction in total nitrite and nitrate levels in E+ fed
cattle, supporting the possibility of arginine-deficient status of E+ cattle. However, they
did not observe any difference in NO synthase activity between control and E+ fed cattle.
Nitric oxide synthase enzyme converts arginine to citrulline and it frees NO for
vasodilation. Al-Tamimi et al. (2007) reported a relief in E+ fed rats from HS, when they
were treated with NO donor agents. They also demonstrated that treatment with NO
donor agents overrides peripheral vasoconstrictive effects of E+ diet. In another study,
they compared ergovaline-treated cattle with controls during HS. They observed that
nitroglycerine could reverse the impact of HS in ergovaline-treated cattle, but not in
control group. Similar results were observed in ergot intoxicated humans, suffering with
vasospasm, when NO donor agents (nitroglycerine, nitroprusside) were used (Ashenburg
and Phillips, 1989). This suggests that vasodilators such as nitric oxide allow the animal
to reduce heat load under HS and thereby alleviate some of the clinical signs associated
with fescue toxicosis.
40
2. 4. Economic impact associated with endophyte-infected fescue
Fescue toxicosis is one of the most notorious grass-related livestock problems in
the United States, affecting more than 8.5 million beef cows and 700,000 horses
(Stuedemann and Seman, 2005). Annual economic losses to the beef industry from
decreased conception rate and weaning weight associated with fescue toxicosis have been
estimated at greater than $600 million (Hoveland, 1993). Further economic impacts occur
for the horse and sheep industry (Thompson et al., 2001). In addition, altered
thermoregulatory ability, decreased feed intake and reduced average daily gain in older
animals’ further increase the adverse economic effect of fescue toxicosis (Spiers et al.,
2005a). Considering inflation and losses to other livestock (e.g., diary cattle, horses and
sheep), the economic cost associates with this problem may be close to $1 billion per year
(Panaccione et al., 2001).
2. 5. Hepatic detoxification
Xenobiotic metabolizing enzymes play a central role in metabolism, elimination,
and detoxification of drugs and foreign compounds introduced into the body (Xu and
Kong, 2006). The detoxification system in animals is extensive, highly complex, and
influenced by myriad of regulatory mechanisms. The liver plays a major role in toxicant
clearance by biotransforming xenobiotics (Phase I metabolism) and the subsequent
conjugation (Phase II) of the resulting metabolites into compounds that can be excreted
from the body (Phase III) (Mannering, 1985). Most of the tissues and organs in the body
are well equipped with various xenobiotic metabolizing enzymes, including cytochrome
P450 (CYP), antioxidants, and drug efflux proteins (Xu and Kong, 2006). These enzymes
are present in abundance either at the basal, unstimulated level and/or are inducible to an
41
elevated level after exposure to xenobiotics (Xu and Kong, 2006). Cytochrome P450
enzymes are associated with several biological interactions involving hydroxylation,
epoxydation, oxygen and nitrogen dealkylation, oxidative deamination, dehydrogenation,
etc. (Bhaskarannair et al., 2006). While some P450 reactions are essential for the removal
of xenobiotics from the body, these reactions are also involved in the activation of
xenobiotics to active metabolites (Bhaskarannair et al., 2006). All aerobic cells contain a
battery of defenses, in the form of antioxidants, against reactive oxygen species and
active metabolites formed by CYPs (Tiedge et al., 1998). Cells containing low levels of
antioxidant enzymes are more vulnerable to oxidative damage (Tiedge et al., 1998). The
ATP-dependent drug efflux proteins are responsible for active transport of xenobiotics
and cellular metabolites out of the cell (Kalitsky-Szirtes et al., 2004). Phase I, II and III
enzymes act in great co-ordination to detoxify various toxicants or/and chemicals in an
animal.
2. 5. 1. Cytochrome P450
Cytochrome P450 (CYP) is a generic term for a large number of evolutionary-
related oxidative enzymes that are important in animal, plant, and bacterial physiology.
Homologs for CYPs have been sequenced from all lineages of organisms, including
mammals, birds, fish, insects, worms, sea squirts, sea urchins, plants, fungi, slime molds,
bacteria, and archaea (Zuber et al., 2002). Animal CYPs are primarily membrane-
associated proteins, located either in the inner membrane of mitochondria or in the
endoplasmic reticulum of cells. The CYPs metabolize thousands of endogenous and
exogenous compounds. Interestingly, most CYPs can metabolize multiple substrates, and
many can catalyze multiple reactions, which accounts for their central importance in
42
metabolizing many endogenous and exogenous molecules. Cytochrome P450 isoforms
are predominantly present in liver and metabolize various drugs and toxic compounds, as
well as metabolic by-products. Cytochrome P450 enzymes are also present in many other
tissues of the body, including the mucosa of the gastrointestinal tract, and plays important
roles in hormone synthesis and breakdown (including estrogen and testosterone synthesis
and metabolism), cholesterol synthesis, and vitamin D metabolism.
The major CYP enzymes involved in metabolism of drugs or exogenous toxins
are the CYP3A4 (orthologous to rat CYP3A1), 1A1, 1A2, 2D6 and 2C enzymes (Zuber
et al., 2002). The amount of each of these enzymes present in the liver reflects their
importance in drug metabolism. Rat CYP1A2 is one of the first isolated and characterized
enzymes and is an important drug-metabolizing enzyme in liver (Bertilsson et al., 1994).
Cytochrome P450 1A1 along with UDP-glucuronosyl-transferase plays a crucial role in
the metabolism of xenobiotic compounds (Nishizawa et al., 2005). The CYP3A4, along
with its closely related isoforms CYP3A5, are responsible for majority of drug metabolic
pathways, and they are also the most abundant form (30 to 60% of total CYP isoforms in
liver) in hepatic tissue. Cytochrome P450 3A7 has a specific role in 16 α-hydroxylation
of steroids (Daly, 2006), and bioactivation of several pro-mutagens, including aflatoxin
B1 (Li et al., 1997). The CYP2C enzymes are one of the most abundant CYP isoforms in
rat liver and they are associated with oxidation of a fungal toxicant, aflatoxin B1, along
with dihydropyridines. They also hydroxylate various steroids (Zuber et al., 2002). Their
expression and activity of various CYPs depend on multiple factors such as food,
genetics, environment, etc (Bauer et al., 2004).
43
Cytochrome P450 2E1 induces chronic oxidative stress by generating more
reactive oxygen species which further lead to hepatocyte injury and cell death
(Schattenberg et al., 2004). Hepatocytes containing CYP2E1 release diffusible mediators
which activate hepatic stellate cells, collagen, α smooth muscle actin, intracellular and
secreted collagen type 1 protein, intra and extra cellular H2O2 and lipid peroxidation
products (Nieto et al., 2002). Therefore, over-expressed CYP2E1 not only perturbs the
homoeostasis of hepatocytes, but also contribute to hepatic fibrosis, and generate reactive
oxygen species (Schattenberg et al., 2004).
Ergot alkaloids produced by various fungal organisms are known to be substrates
of CYP3A isoforms. Ergot alkaloid interactions with the CYP3A enzyme system has
been previously elucidated (Moubarak et al., 2003b). Moubarak and Rosenkrans (2000)
observed in vitro hydroxylation of ergotamine by a cytochrome isoform of CYP3A
present in beef liver microsomes. In another study, Moubarak et al. (2003b) induced
CYP3A levels in rat liver microsomes and then treated the preparation with ergotamine.
This produced a greater metabolism of ergotamine than in controls. Peyronneau et al.
(1994) reported metabolism of bromocriptine, an ergot alkaloid similar to ergotamine, by
CYP3A in rat liver microsomes treated with dexamethasone, a CYP3A inducer. They
also reported that ergopeptides, like bromocriptine, ergocryptine and dihydro-ergotamine,
exhibit greater affinity for rat CYP3A. Althus et al. (2000) observed the metabolism of
another ergot alkaloid, α-dihydroergocryptine, by CYP3A isoforms. Zanzalari et al.
(1989) and Thompson et al. (2001) reported an increase in hepatic mixed function
oxidases in sheep consuming E+ diet. These results suggest that ergot alkaloids are
44
metabolized by various CYP isoforms; however it is not clear if the metabolites are less
toxic than the parent compounds.
Transcriptional activation of CYPs is under the control of various nuclear
receptors. Nuclear receptors, pregnane X receptor (PXR) and retinoid X receptor (RXR),
are ligands that are activated by a large number of structurally and pharmacologically
diverse endogenous (steroid hormones, vitamins E and K, bile acids) and exogenous
compounds (rifampin and protease inhibitors), and environmental contaminants
(organochlorine pesticides) (Lamba et al., 2004). Pregnane X receptor serves as a
generalized sensor of hydrophobic toxins (Kliewer et al., 2002). Its activation results in
the induction of an elaborate network of CYP isoforms involved in all aspects of
xenobiotic detoxification and excretion (Kliewer, 2003). It is mainly expressed in liver,
small intestine, and colon (Bertilsson et al., 1998). Upon ligand binding, PXR forms a
heterodimer with the retinoid X receptor and binds to an upstream element in CYP genes
(Waxman, 1999). This is followed by recruitment of coactivator protein, SRC-1 (steroid
receptor coactivator-1), for transcriptional activation of the CYP gene (Savas et al.,
1999). Given the fact that CYP isoform expression is affected by various factors, there
are other nuclear receptors, such as aromatic hydrocarbon receptors, peroxisome
proliferator-activated receptor-α, and the constitutive androstane receptor, which induce
various CYP isoforms.
2. 5. 2. Antioxidants
As a consequence of increased CYP-associated xenobiotic metabolism, reactive
molecules, which may be more toxic than the parent molecule, are produced (Liska,
1998). Another potentially damaging effect of Phase I activity is the production of
45
oxygen-free radicals that occurs as a result of CYP activity (Percival, 1997). If these
reactive molecules are not further metabolized by Phase II conjugation, they may cause
damage to proteins, RNA and DNA within the cells (Percival, 1997; Liska, 1998).
Several studies have shown the evidence of association between induced Phase I
and/or decreased Phase II activities and an increased risk of disease, such as cancer,
systemic lupus erythematosus and Parkinson’s disease. This association is also
implicated in adverse drug responses (Liska, 1998). Phase II conjugation reactions
generally follow Phase I activation, resulting in transformation of a xenobiotic into a
water-soluble compound (Liska, 1998). The antioxidants can inhibit free radical
production by chelating the transition metal catalysts, breaking chain reactions, reducing
concentrations of ROS, and scavenging initiating radicals (Scandalios, 1997).
One of the primary enzymatic defenses against reactive oxygen species is
superoxide dismutase (SOD), which catalyses the conversion of superoxide anions into
H2O2 (a powerful and potentially harmful oxidizing agent). Mammalian cells have a
SOD enzyme containing manganese at its active site in mitochondria and one with copper
and zinc at the active site in the cytosol (Scandalios, 1997). Minor changes in the Mn-
SOD may have a significant impact on the antioxidant status of mitochondria; with
approximately a 50% reduction in Mn-SOD resulting in a functional decline of oxidative
phosphorylation, an increase in oxidative stress, and an increase in rates of apoptosis
(Wheeler et al., 2001).
Other phase II enzymes, such as catalase in peroxisomes and glutathione
peroxidase (GPx) in cytosol, are involved in the conversion of H2O2 to water and
molecular oxygen (Liska, 1998). It is anticipated that cells containing low levels of one or
46
more of these enzymes would be particularly vulnerable to oxidative damage (Liska,
1998; Tiedge et al., 1998). Of the two antioxidant enzymes, catalase is more effective
than GPx in protecting against high concentrations of H2O2, while GPx gives more
efficient protection than catalase when H2O2 concentrations are low (Tiedge et al., 1998).
The H2O2 undergoes hemolytic scission on the inner mitrochondrial membrane and
mitochondrial matrix causing site-specific damage of critical matrix targets. Its
decomposition outside the mitochondria may cause damage to the outer mitochondrial
membrane itself and /or cytosolic targets, within the diffusion limit of hydroxyl radical.
Furthermore, prolonged exposure to H2O2 could lead to lipid peroxidation. Increased
cellular H2O2 levels reduce SOD activity (Marczuk-Krynicka et al., 2003) resulting in
increased superoxide concentrations within the cell, which in turn reduce catalase activity
(Marczuk-Krynicka et al., 2003).
Tiedge et al. (1998) reported that cells transfected with SOD and catalase gave
better protection against H2O2, compared to cells transfected with SOD or catalase alone.
Similarly, cells transfected with catalase and GPx are better protection against H2O2 than
cells transfected with either enzyme alone. This suggests cooperation between
antioxidant enzymes in protecting against various oxidizing species.
Lakritz et al. (2002) reported reduced blood glutathione levels in E+ fed cattle
under HS environments. Gorini et al. (1988) observed reduction in forebrain glutathione
levels in male rats after chronic i.p. treatment with dihydroergocristine and
dihydroergocryptine. These results suggest that ergot alkaloids reduce antioxidant
potential of the animals thereby making them more susceptible to oxidative stress.
47
2. 5. 3. Antiporter system
Antiporter activity is an important factor in the first pass metabolism of
xenobiotics. It is an energy-dependent efflux pump, which pumps xenobiotics out of a
cell, thereby decreasing the intracellular concentration of xenobiotics (Liska, 1998).
Antiporter activity is co-regulated with CYP enzymes, to suggest that it may support and
promote detoxification (Liska, 1998). The multidrug resistance gene (MDR 1A and MDR
1B) and multidrug resistance associated protein 2 (MRP 2) are the two genes which
encode for antiporter activity in rats (Kalitsky-Szirtes et al., 2003). The MDR proteins are
responsible for the active excretion of a wide variety of lipophilic cationic drugs and
xenobiotics from liver, kidney and intestine, whereas MDR 2 proteins extrude various
lipophilic anions and their glutathione, glucuronide, and sulfate conjugates (Kalitsky-
Szirtes et al., 2003). Targeted disruption of the MDR 1a gene in mice increases the
concentration of xenobiotic by 2 to 100 fold in brain, liver, GIT (Schuetz et al., 1996).
Over expression of genes associated with antiporter system prevent intracellular
accumulation of drugs or xenobiotics (Schuetz et al., 1996), suggesting its significance in
reducing toxic load within the cell.
2. 6. Rat as a model for fescue toxicosis
Development of rat model for fescue toxicosis provides a rapid, economical tool
to determine the multiple effects of fescue toxicosis, and allows for preliminarily
evaluation of potential treatments (Spiers et al., 2005a). Rats exhibit general symptoms
that are characteristic of fescue toxicosis. Spiers et al. (2005a) used a dietary daily dose
of ergovaline, at a level that is 16 times greater than the amount required to produce
similar symptoms in cattle. The reason for the increased dose requirement in rats is that
48
the metabolic body size is approximately six times greater in rats compared to cattle
(Spiers et al., 2005a). As a result of this difference, cattle would be expected to
metabolize and eliminate E+ toxicants at a much slower rate compared to rats. In
addition, fescue diet may remain in ruminant stomach for a longer period to provide a
greater breakdown and extraction of toxicants than in the nonruminants (such as rats).
This require a higher dose in rats to produce a response that is identical to that in cattle
(Spiers et al., 2005a). Fescue toxicosis sensitive symptoms observed in cattle (reduced
feed intake, body weight, activity) are also observed in rats independent of Ta and level
of thermal stress (Spiers et al., 2005a). Cattle and rats exhibit similar short-term
thermoregulatory responses to E+ tall fescue toxins when tested under comparable
thermal conditions representative of similar levels of strain (Spiers et al., 2005a).
2. 7. MICROARRAYS
2. 7. 1. Introduction
DNA microarrays are usually used for global gene expression profiling. Recent
developments in microarray technology have provided a reliable platform for the study of
gene expression, regulation and function (Chaudhuri, 2005). It has tremendous potential
in the exploration of disease processes such as cancer, in drug discovery and
development, and also in investigations of population genetics. Notable examples of
which include, identification of regulatory genes in the cell cycle mechanism, and disease
causing genes in malignancies and certain neurodegenerative disorders (Chaudhuri,
2005). Thus, microarray-based studies provided necessary impetus for biomedical
experiments, particularly following the human genome sequencing. Traditional methods
49
in molecular biology work on a ‘one gene in one experiment’ basis, throughput is very
limited and the whole picture of cellular function is often difficult to understand.
Furthermore, those processes would require a long period before all the functions of a
gene and its interactions with other genes could be elucidated. In contrast, DNA
microarrays theoretically allow one to monitor the whole genome on a single chip, which
makes the technology very appealing as a shortcut towards data analysis, despite the large
financial and technical demands. The flexible nature of the microarray technique allows
for wide use in all fields of biology ranging from plants to animals and humans, and its
potential applications include, but not limited to: “(i) gene expression comparison under
different conditions such as in health, disease, after therapeutic interventions and
following exposure to drugs and radiation etc. (ii) identifying unique genes related to
different sub cellular organelles and tissues, (iii) analyzing gene function in various
metabolic pathways (iv) defining gene within an organism and compare it to a reference
organism and (v) detecting differences in single nucleotides between genomic samples
obtained from similar organisms etc” (Chaudhuri, 2005).
2. 7. 2. Recent applications of DNA microarrays to toxicology
The field of toxicogenomics has progressed rapidly since the application of DNA
chips to toxicology was proposed in the late 1990s (Afshari et al., 1999). One of the early
concerns about the use of DNA microarray in toxicology was how to properly compare
experiments that used a wide variety of commercial and proprietary platforms, protocols,
and analysis methods. In US, the National Institute of Environmental Health Sciences
(NIEHS) has created the National Center for Toxicogenomics (NCT) to provide a
reference system of genome-wide gene expression data and to develop a knowledge base
50
of chemical effects in biological systems (Tennant, 2002). The NCT has conducted some
proof-of principle experiments to establish signature profiles of known toxicants and to
link the pattern of altered gene expression to specific parameters of conventional indices
of toxicity (Hamadeh et al., 2002). These studies show that it is possible to identify a
signature of expressed gene patterns after exposure to a given toxicant (Tennant, 2002).
Recently, DNA microarrays have been used to develop a much deeper insight into the
mechanism of chemical toxicity at molecular level such as the effects of arsenic, nickel,
chromium and cadmium in human bronchial cells (Andrew et al., 2003). This and other
toxicogenomics studies show that “(i) patterns of gene expression relating to biological
pathways are robust enough to allow insight into mechanisms of toxicity, (ii) gene
expression data can provide meaningful information on the physical location of the
toxicity, (iii) dose-dependent changes can be observed and (iv) concerns about
oversensitivity of the technology are unfounded” (Pennie et al., 2004).
2. 7. 3. Application of microarray technology to fescue toxicosis
Microarray technique has recently been used in the field of fescue toxicosis to
identify the affected pathways due to intake of an E+ diet. Bhusari et al. (2006) used mice
as a model to study the effects of E+ diet on hepatic gene expression using a rat
oligonucleotide array (50 mer) containing 1,353 liver specific probes. They fed the mice
with E- or E+ diet for two weeks at TN (24ºC) or HS (34ºC) conditions. They observed
genes associated with sex steroid metabolism, cholesterol and lipid metabolism down-
regulated and ribosome and protein synthesis up-regulated in E+ mice under TN
conditions. Under HS conditions, genes associated with phase I detoxification,
antioxidants, denovo lipogenesis and lipid transport functions are up-regulated and genes
51
for DNA damage control and unfolded protein responses are down-regulated in E+ mice
(Bhusari et al., 2006).
Results from the above mentioned study encourage the use of high throughput
microarray technology to understand the global changes in gene expression as a result of
an E+ diet intake.
52
CHAPTER III
SHORT- AND LONG-TERM RESPONSES TO FESCUE
TOXICOSIS AT THERMONEUTRALITY OR DURING HEAT
STRESS
1. ABSTRACT
Rats were monitored under TN, short-term (SH) or long-term (LH) heat stress
(HS) conditions to determine the time-related changes associated with the intake of diets
containing either endophyte-infected (E+) or uninfected (E-) fescue seed. Core
temperature did not change in rats fed the E+ diet at TN, but increased with SH and LH
exposures. The E+ diet reduced feed intake and conversion efficiency, daily gain, serum
prolactin and cholesterol during TN and HS exposures. Rats exposed to one stressor (E+
or heat) exhibited greater adaptation than those simultaneously exposed to both stressors,
suggesting a greater shift from normalcy with multiple stressors.
2. INTRODUCTION
Tall fescue [Lolium arundinaceum (Schreb) Darbysh., formerly Festuca
arundinacea (Schreb)] is one of the major grasses grown in temperate regions of the
world (Zhang et al., 2005). Within the United States, more than 8.5 million cattle graze
on tall fescue, and more than half of the tall fescue forage is infected by the endophyte
53
Neotyphodium coenophialum (Jones et al., 2004). The endophyte maintains a symbiotic
relationship with the plant by improving its drought and heat tolerance (Malinowski et
al., 2005) but produces toxins (ergopeptine alkaloids) which interact with dopaminergic,
adrenergic and serotonergic receptors and reduce the heat tolerance, growth, and
performance of cattle grazing on the endophyte-infected tall fescue grass (Cross et al.,
1995; Oliver, 2005). The clinical signs associated with consumption of endophyte-
infected fescue are collectively referred as fescue toxicosis. Other species, including
horses (Cross et al., 1995), sheep (Gadberry et al., 2003), rabbits (Filipov et al., 1998),
rats (Spiers et al., 2005a), mice (Varney et al., 1991), meadow voles (Conover, 1998) and
birds (Zavos et al., 1993) exhibit some of the clinical manifestations of fescue toxicosis
that are seen in cattle.
Like cattle, rats fed a diet containing endophyte-infected fescue seed (E+) exhibit
reductions in average daily feed intake (FI) and growth (Spiers et al., 2005a), making the
rat a useful animal model for the study of fescue toxicosis under controlled
environmental conditions (Osborn et al., 1992; Spiers et al., 2005a). It has been noted
that many of the animal responses to ergopeptine alkaloids depend on Ta, with
augmented hyperthermic and hypothermic conditions observed in animals fed E+ diets in
hot and cold environments, respectively (Neal and Schmidt, 1985; Spiers et al., 1995).
Injection of rats with ergovaline (EV), the primary ergopeptine alkaloid found in
endophyte-infected fescue, (Zhang et al., 1994) results in hypothermia at TN and
hyperthermia under HS conditions.
The combination of altered thermoregulatory ability and reduced caloric intake
over an extended period of time will likely have a negative impact on general animal
54
health and performance. This effect has been documented, in part, using measurements of
FI, weight gain, and serum chemical parameters in cattle fed an E+ diet (Oliver et al.,
2000). However, little experimental data is available for a detailed comparative
evaluation of the effects of ergopeptine alkaloids on these research endpoints under
controlled conditions of short- and long-term exposures to heat, and such information
would facilitate the characterization of adaptation to one or both of these stressors (i.e.,
ergopeptine alkaloids and/or heat). The objective of the present study was to evaluate the
temporal effects of E+ and/or HS on various physiological responses, including Tc,
activity count, FI, feed conversion efficiency (FCE), average daily gain (ADG), selected
serum biochemical parameters and visceral organ weights associated with fescue
toxicosis. It was hypothesized that there are temporal differences in physiological
responses to tall fescue endophytic toxins under thermoneutral, short-term and long-term
heat conditions that characterize potentially adaptive processes.
3. MATERIALS AND METHODS
Experimental Design
Three experiments (Figure 3. 1) were performed during which different rats were
fed diets containing either E+ or non-endophyte-infected (E-) fescue seed, and
maintained under TN conditions (21◦C) for five days (pre-heat stress/thermoneutral), or
extended under TN or HS conditions (31◦C) for either three days (short-term heat stress)
or three weeks (long-term heat stress).
55
Animals and Treatment Diets
Male Sprague-Dawley rats (n = 24/Experiments 1 and 3 and 12/Experiment 2;
42 d of age at start; Charles River Laboratories, Willington, MA), were maintained on a
12 h light/dark cycle, with percent relative humidity (50 ± 5%) and selected temperature
condition as noted in an earlier study (Spiers et al., 2005a). Feed and water were provided
ad libitum throughout the experiment. Control and treatment diet compositions were
previously described, with the treatment diet adjusted to provide a specific amount of EV
(Spiers et al., 2005a). Ergovaline content in E- seed was almost negligible (23 ppb),
whereas E+ seed contained a concentration of 4,100 ppb on a DM basis as measured by
HPLC (detection limit = 50 ppb and CV = 7%; Rottinghaus et al., 1993). The E+ and E-
seed were also analyzed for the presence of ergopeptine alkaloids from Claviceps
purpurea using HPLC (Rottinghaus et al., 1993). All diets were stored at 4°C prior to
use. Animal procedures followed guidelines for humane treatment set by the University
of Missouri Animal Care and Use Committee.
Treatment Period and Sample Collection
The schedule in all three experiments consisted initially of an eight-day recovery
period after intraperitoneal implantation of telemetric transmitters (Model VM-FH; Mini-
Mitter Company, Inc., Bend, OR), followed by a five-day pretreatment period (d 1 to 5),
during which all rats received E- diet (Spiers et al., 2005a). Intraperitoneal transmitters
were used to collect Tc and activity count at hourly intervals, and then averaged to obtain
daily values for analysis. Rats in Experiment 1 were randomly assigned to either E- (n =
12) or E+ treatment (n = 12) groups and administered treatment at TN for 5 d (d 1 to 5;
Figure 3. 1) to determine the fescue toxicosis response in the absence of heat stress.
56
During short-term heat stress (Experiment 2), rats were exposed to heat stress (n = 6; 2
groups: E- HS and E+ HS) for three days. During long-term heat stress (Experiment 3),
rats were divided at random into four groups at the end of the TN period (n = 6; 4 groups:
E- TN, E- HS, E+ TN, and E+ HS) to determine adaptive responses to heat stress and
fescue toxicosis. Ambient temperature was held at 21°C (TN) during pre-heat period and
increased to 31°C (HS) during short- and long-term heat stress periods (Figure 3. 1). At
the end of each treatment period, rats from each group were anesthetized using a mixture
of ketamine (87 mg/ml) and xylazine (13 mg/ml) administered intramuscularly at 0.1
mg/100 g BW and blood was drawn via cardiac puncture for analysis. Selected visceral
organs (i.e., liver, adrenal, kidney, heart, and testes) were collected from each animal,
following euthanasia (rat cocktail and exsanguination) and wet organ weights were
measured.
Serum Chemistry
Collected blood was centrifuged immediately to obtain the serum, which was
frozen (-20˚C) for later use. Serum analyses included determinations of blood urea
nitrogen (BUN), glucose, ALP, cholesterol and various serum minerals using standard
procedures. Most of these measurements are components of a larger biochemical profile
produced by the Veterinary Medical Diagnostic Laboratory, University of Missouri-
Columbia using an auto-analyzer (Olympus AV400; Olympus America, Inc., Melville,
NY). Serum prolactin (PRL) concentrations were determined using rat prolactin enzyme
immunoassay kit (SPI – BIO, Massy Cedex, France) as previously reported (Duhau et al.,
1991).
57
Statistical Analysis
Data from the different studies was not combined for TN and short-term HS due
to unequal sample sizes. Instead, physiological parameters were only compared between
treatment groups within each experiment, and changes from pretreatment Day -1 were
determined. Data for Tc and activity count consisted of daily averages, calculated from
hourly values within each day, and used for comparison with other daily values (e.g., FI,
ADG). Mean for daily values were analyzed as a function of time and treatment group.
The above parameters were analyzed by repeated measures analysis of variance (mixed
procedure) of SAS (Littell et al., 1998) and standard least square model fit (JMP®, SAS
Institute Inc., Cary, NC). The statistical model consisted of treatment, time, and treatment
x time interactions. If a significant difference existed for any comparison, then a Tukey -
Kramer multiple comparisons test (Steele and Torrie, 1980) was performed (α = 0.05) to
determine specific effects. A significant effect implies that the p or α value is less than or
equal to 0.05. All data are reported as least square means + 1 SE.
4. RESULTS
Pretreatment values at TN
Average daily group Tc ranged from 37.5 to 38.2˚C before treatment, with no
difference across treatments in all three experiments, and, likewise, average group
activity count ranged from 23.2 to 39.1 counts/h and was not different across treatments
in each of the three experiments. Pretreatment group averages for FI did not differ
58
between treatments, and there were no differences between mean group values for body
weight as a function of treatment in all experiments. Feed conversion efficiency was
calculated as the ratio of changes in body weight to FI multiplied by 100, and there were
no differences between group pretreatment FCE values across treatments in any of the
experiments
Short- (Experiment 1) and long-term (Experiment 3) responses to treatment
diets at TN
Core temperature responses and activity count
The E+ diet produced no significant change in average daily group Tc compared
to E- groups during short- or long-term TN studies. Likewise, there was no significant
effect of diet on change in average daily activity count by treatment. Changes in daily Tc
and activity count over time were absent in both E- and E+ rats during short- or long-term
TN conditions.
Feed intake
There was a significant decrease in mean FI of E+ rats on Day 1 that was below
the level observed in rats fed E- diet during both short- and long-term periods (Figure 3.
2a). By the end of the short-term experiment (Day 5), E+ rats exhibited signs of
adaptation,, with a significant increase in FI from Day 1 level (Figure 3. 2a). Similarly,
E+-treated rats during the long-term period reached the mean level of FI for E- rats by
Day 9 (Figure 3. 2a).
Feed conversion efficiency (FCE)
Rats fed E+ diet significantly reduced mean FCE compared to E- rats (-38.89 ±
3.05 g BW/g FI versus -10.74 ± 3.05 g BW/g FI) by the end of the short-term experiment.
59
The initial significant reduction in average FCE of E+ rats occurred on Day 1, with an
indication of partial adaptation or recovery by Day 5. Feed conversation for E- rats did
not change during this period. Rats on the E+ diet during the long-term experiment also
had reduced average FCE (-10.69 ± 1.09 g BW/g FI) compared to E- rats (-6.18 ± 1.09 g
BW/g FI). The initial signs of significant reduction in average FCE of E+ rats occurred
within the first 24 hours of treatment. This level remained low in E+ rats until Day 3,
followed by significant adaptation or recovery by Day 4. The E- rats did not change FCE
during this period.
Body weight
Consumption of E+ diet significantly decreased average BW (Figure 3. 2b)
below E- level during both short- and long-term periods, and, similarly, the slope for
growth rate was significantly reduced for E+ compared to E- rats for both periods (Table
3. 1). The first indication of significant decrease in average BW of E+ rats below E- level
occurred on Day 1 (Figure 3. 2b). By the end of the short-term period, average BW of
E+ rats was not different from Day 1, and by the end of the long-term period the E+ rats
had increased their BW above Day 1 level to suggest partial adaptation or recovery,
However, average BW of E+ rats was always below that of rats fed the E- diet on any
day.
Serum biochemistry profile
Rats fed E+ diet had mean serum glucose, BUN, cholesterol and ALP values that
were significantly below E- level during the short-term period, with no long-term change
(Table 3. 2). Endophytic toxins did not alter serum sodium, potassium, calcium, chlorine
or phosphorus levels during either period (data not shown).
60
Visceral weights
Intake of E+ diet consistently resulted in a reduction (p ≤ 0.07) in mean wet
weight of liver, corrected to BW, for short- and long-term periods at TN (Table 3. 3). The
E+ group exhibited greater mean weight of testes, corrected to BW, at TN. Mean relative
wet weights of heart, adrenal and kidney did not differ among treatment groups for either
period (data not presented).
Short- (Experiment 2) and long- (Experiment 3) term responses to fescue
toxicosis during HS
Core temperature responses and activity count
Average daily Tc of E- rats increased significantly by 0.22˚C from Day 5 at TN
to Day 6 of HS. By Day 8, Tc of E- rats exposed to HS had returned to TN level. In
contrast, there was a significant increase (0.47˚C) in Tc of E+ rats by Day 6, with an
additional 0.20˚C increase to the end of short-term HS (Day 8).
During long-term HS, average daily Tc of E- rats significantly increased (0.26˚C)
from Day 5 to 6. Although their Tc continued to increase to Day 7 (0.45˚C), by Day 8 it
had returned to TN level. The increase in Tc of E+ rats within the first 24 hours of HS
(0.42˚C) was similar to short-term HS. However, this increase was not significant from
Day 5 because the variance was greater for long-term HS. A significant increase occurred
on Day 7 from Day 5 for this group with a continued rise in Tc to Day 8, when the
increase from Day 5 was 1.26˚C. The Tc of E+ rats remained elevated until Day 12 from
Day 5 level and by Day 13, values returned to preheat level. There was a significant
difference in Tc of E- and E+ groups from Day 8 to 10.
61
During short-term HS, average daily activity count of E- rats significantly
decreased (12.47 counts/h) from Day 5 to Day 8. Mean activity count of E+ rats was
significantly decreased (10.07 counts/h) within 24 hours of HS. The E+ rats continued to
decrease activity count until Day 8, when the reduction from Day 5 was 15.67 counts/h.
There was no significant E+ effect on activity count during short-term HS.
During long-term HS, average daily activity count was significantly decreased
(15.31 counts/h; p < 0.01) in E- rats by Day 6; however by Day 7, activity count of E-
rats returned to pretreatment level. Within 24 hours of HS, activity count of E+ rats
significantly decreased (11.19 counts/h). However, by Day 8 the values returned to TN
level. The E+ diet did not have a significant effect on activity count of E+ rats during
long-term HS.
Feed intake
Heat exposure resulted in a significant reduction in average FI in both E- and E+
rats from Day 5 level during both short- and long-term HS. The first sign of significant
reduction in FI occurred within 24 h of HS. During short-term HS, FI of E- rats was still
below Day 5 level on Day 8, however, E+ rats had returned to Day 5 level. This was
likely because FI for E+ rats was already extremely depressed on Day 5 and there was
little room for change. During long-term HS, FI values of E- and E+ rats never returned
to Day 5 level, even by the end of Day 26. Feed intake values were nearly always
significantly lower in E+ fed rats compared to E- rats during this period (Figure 3a).
Feed conversion efficiency
Heat exposure during short-term HS significantly reduced average FCE on Day 6
in both E- (101.44 g BW/g FI) and E+ (80.66 g BW/g FI)) rats from Day 5 level.
62
However, complete adaptation occurred in both treatment groups by Day 8, with return to
TN level. There was no treatment effect on FCE during short-term HS. During long-term
HS, FCE of E- (135.37 g BW/g FI) and E+ (202.95 g BW/g FI) groups on Day 6 were
significantly decreased from Day 5 level. Complete adaptation and return to TN level
occurred on Day 8 for E- rats and Day 9 for E+ rats. Treatment effect on FCE was also
absent during long-term HS.
Body weight and growth rate
During short-term HS, initial signs of significant reduction in mean BW from
preheat level occurred in E+ rats on Day 7, whereas E- rats did not exhibit this reduction.
Body weight and growth rate slopes (Table 3. 5) were lower in the E+ compared to the E-
groups during short-term HS (Figure 3. 3b). During long-term HS, there was an initial
reduction in BW on Days 6 and 7 below preheat level for E+ and E- rats, respectively.
Body weight of E- rats exhibited signs of adaptation to HS by Day 8, with a steady
increase in growth rate after this time. Reduction in BW of E+ rats continued until Day 8,
and by Day 9 there were signs of adaptation. Similarly, growth rate of E+ rats exhibited
partial adaptation to fescue toxicosis under HS and the values were not significantly
different from their E- counterparts (Table 3. 1).
Serum biochemistry profile
Short-term HS reduced serum glucose level in both E- and E+ rats compared to
TN counterparts; however, such an effect was absent during long-term HS (Tables 3. 2
and 3. 4). Long-term, but not short-term HS, decreased serum cholesterol and ALP levels
in E+ compared to E- rats (Table 3. 3). Both HS exposures increased serum PRL above
TN level in E- and E+ rats (Tables 3. 2 and 3. 4; no statistical comparison). Serum PRL
63
levels were significantly reduced in E+ compared to E- rats during both experiments
(Table 3. 3). Endophytic toxins did not alter serum sodium, potassium, calcium, chlorine
or phosphorus levels during short- and long-term HS (data not shown).
Visceral weights
The E+ diet significantly reduced BW-specific wet liver weight during all
exposures (Table 3. 3). Long-term HS reduced BW-specific wet liver weight in E- and
E+ rats compared to TN conditions (Table 3. 3). Such a comparison could not be
performed for short-term exposure since it encompassed two different experiments.
Body weight-specific wet testis weight was greater in E+ rats only during long-term HS
(p < 0.01), but not during the short-term HS (p ≥ 0.10; Table 3. 3). Long -term HS
increased BW-specific wet testis weight only in E+ rats compared to long-term TN
(Table 3. 3). In contrast, there was no effect of any treatment on BW-specific wet
weights of heart, adrenal and kidneys (data not presented).
5. DISCUSSION
Core temperature and activity count
There was no significant change in daily Tc of E+ rats at TN in the present study.
Others have observed a prominent acute reduction in rectal temperature of rats following
ip injection of EV at TN (Zhang et al., 1994; Spiers et al., 1995). Likewise, there is a
reduction in Tc of rats during intake of an E+ diet at TN (Spiers et al., 2005a). However,
this reduction, albeit significant, was only 0.2°C and well within the daily circadian cycle
for normal Tc. In a more recent study, Settivari et al. (2006) noted that night Tc was
64
significantly reduced within several days on an E+ diet at TN. However, this response
was transient and was not evident at the end of TN exposure. In support to the present
findings, Osborn et al. (1992) observed no change in rectal temperature of steers fed an
E+ (seed) diet for 28 days under TN conditions. Inconsistencies observed with regard to
the effects of fescue toxicants on Tc at TN warrant additional studies.
Short- and long-term exposure to HS increased average daily Tc of E- rats in the
present study. This Tc response is corroborated by previous reports noting that exposure
of male rats to 32 to 33ºC for 10 to 14 days (Shido et al., 1989; Matthew, 1997) results in
elevation of average Tc above TN level. Adaptation of average daily Tc to HS in the
present study is also in agreement with previous reports (Matthew, 1997). Even with the
elevated mean core body temperatures in rats fed E- diet during HS, E+ fed rats in short-
or long-term HS consistently exhibited increased average daily Tc compared to E- fed
rats, which is in agreement with the reports of Spiers et al. (2005a). Fescue toxicosis
produces a similar increase in body temperature in sheep (Hemken et al., 1979) and steers
(Osborn et al., 1992) during heat stress. This increase in temperature is attributed to
increased peripheral vasoconstriction (Aldrich et al. 1993), as a result of a reduction in
NO level (Al-Tamimi et al., 2007). Dietary long-term treatment of rats fed an E+ diet
with an NO donor (molsidomine; 120 mg/ml drinking water) during heat stress (32ºC)
reduces night hyperthermia associated with fescue toxicosis by ~0.4ºC (Al-Tamimi et al.,
2007). Adaptation observed in average daily Tc of E+ rats to HS are in agreement with
the observations of Spiers et al. (2005a). Rats adapt to HS by decreasing metabolic heat
production (Gordon, 1993), and increasing heat loss activities (Horowitz et al., 1983) and
65
this might explain the recovery observed in Tc values of E+ and E- fed rats. Additional
studies are needed to verify this.
Intake of an E+ diet under TN conditions in the present study did not produce a
consistent change in average daily activity count compared to E- fed rats. Spiers et al.
(2005a) observed a slight decrease in activity count of E+ compared to E- rats during TN,
which they attributed to added effects of stress and general sickness behavior.
In the present study, short- and long-term HS reduced the general activity count of
E- rats. Al-Tamimi et al. (2007) observed 32 to 34% decrease in average activity count
in rats exposed to HS conditions (32ºC), with greater reduction occurring during night
than day hours. They speculated that rats reduce activity count during HS to minimize
movements and thereby heat production, for reduction of heat load. Similar response of
rats to heat exposure has been reported by others (Spiers et al., 2005a; Gordon, 1993).
However, Spiers et al. (2005a) did not observe changes in activity count of E- rats during
long-term heat stress. As for Tc, this response appears to be transient and not consistent
across different studies. Intake of an E+ diet during HS did not alter activity count of E+
compared to E- fed rats in the present study, although Spiers et al. (2005a) reported a
long-term reduction in activity count in E+ compared to E- fed rats under this condition.
Additional studies are needed to determine the definitive effects of E+ diet on activity
count during heat exposure.
Feed intake
The effect of endophytic toxins on FI have been extensively studied in both
ruminants and monogastrics, and include rats (Spiers et al., 2005a; Roberts et al., 2002)
and steers (Osborn et al., 1992) under TN and HS conditions. The E+ diet in the present
66
study produced a decrease in mean FI within the first 24 hours at TN, demonstrating that
this particular response is independent of Ta. Heat stress-induced reduction in mean FI of
E- rats, in the present study (Figure 3. 3a) is in agreement with earlier reports (Johnson
and Cabanac, 1982; Spiers et al., 2005a). Al-Tamimi et al. (2007) reported that such
reduction in FI is a means for the heat-stressed animals to reduce their postprandial heat
increment and is a requirement to dissipate excess heat. Although, mean FI returned to
TN level during short-term HS, this adaptation did not occur during long-term HS. Spiers
et al. (2005a) did not observe signs of adaptation in FI of E- rats under HS conditions.
endophytic toxins. Reasons for the reduced caloric intake in E+ treated animals have not
been determined. Spiers et al. (2005a) ruled out the likelihood of palatability of ground
seed or amount of seed fed as the possible causes for the observed reduction in caloric
intake, since the E- diet containing similar content of fescue seed did not alter FI. Partial
FI recovery observed in E+ rats is in agreement with earlier reports (Spiers et al., 2005a).
Feed conversion efficiency
Consumption of an E+ diet at TN decreased FCE of E+ compared to E- rats.
Exposure to heat stress reduced FCE of both E- and E+ rats in the present study and has
previously been reported to reduce FCE (Baccari et al., 1983; Suk et al., 1995; Washburn
et al., 1995; Cooper and Washburn, 1998). During HS, E+ intake reduced FCE in E+
compared to E- rats, however, the difference was statistically insignificant due to greater
variance. Although FCE and FI recovered in E+ rats during TN and HS, BW did not
exhibit similar recovery. Reduced FCE in E+ rats could hinder the ability to utilize and
convert feed energy into productive aspects, and in farm animals could contribute to
impaired production associated with fescue toxicosis. Reduced FCE was reported earlier
67
in E+ fed rats (Neal and Schmidt, 1985) as well as in steers (Schmidt et al., 1982;
Hoveland, 1993). Donaldson et al. (1991) and Osborn et al. (1992) noted that reduced
growth rate in E+ steers, although maintained on high nutrient feed, was likely due to
reduced FCE. Al-Tamimi et al. (2007) observed 88.5% depression in FCE of E+ rats
under similar HS conditions from FCE values during HS alone. The toxic effects of
ergovaline at the level of gastrointestinal tract epithelium partially explain the suppressed
FCE in E+ rats.
Average daily gain
Poor weight gain is considered as one of the classical signs of fescue toxicosis. In
the present study, intake of an E+ diet under TN conditions reduced mean ADG and
growth rate in short-term experiment. However, during chronic exposure (Experiment 3),
only a partial adaptation occurred for growth rates of E+ rats, despite complete recovery
or FI and FCE. Both short- and long-term HS decreased ADG and growth rate of E- rats
to comparable level. The E+ diet intake under short-term HS decreased growth rate to
minimal level, however E+ rats during long-term HS exhibited partial adaptation with a
growth rate that was similar to E- rats. Reduced growth rate under HS conditions can
once again be attributed to reduced FI and FCE. Similar decrease in ADG have been
observed in rats (Spiers et al., 2005a; Al-Tamimi et al., 2007), sheep (Gadberry et al.,
2003), and cattle (Osborn et al., 1992) fed an E+ diets under TN or HS conditions.
Ergopeptine alkaloids are reported to affect hepatic mitochondrial genes associated with
ATP production at TN (Settivari et al., 2006), which might explain for reduced growth
rate in E+ rats, in spite of the recovery observed in FI and FCE.
68
Serum parameters
Reduction in serum PRL level is considered to be a reliable verification of fescue
toxicosis (Schultze et al., 1999). The hypoprolactinemia observed in the present study is
most likely due, at least in part, to the inhibitory effects of ergopeptine alkaloids on
lactotrophic cells present in the anterior pituitary (Strickland et al., 1993). Intake of the
E+ diet in the present study reduced mean serum PRL concentrations under both TN and
HS conditions when compared to E- rats. Variations observed in E- and E+ rat serum
PRL levels during the three studies could be due to seasonal variation in PRL secretion in
laboratory rats (Vazquez et al., 2006). Rats in the present study were tested between June
and November. Prolactin increases the circadian rhythm of lipogenesis and insulin
receptor numbers in hepatic tissue, and inhibition of PRL secretion decreases hepatic
lipogenic rates (Cincotta and Meier, 1989). Furthermore, PRL stimulates rat FI and BW
in a dose-dependent manner (Gerardo-Gettens et al., 1989). Therefore, hypoprolactinemia
associated with fescue toxicosis could contribute to reduced daily gain in E+ rats. In
addition distribution of PRL receptors in various tissues such as liver, kidney, cerebral
cortex, seminal vesicle suggests the involvement of PRL in various physiological
processes (Strickland et al., 1993); and therefore hypoprolactinemia associated with
fescue toxicosis could affect many vital organ functions in the body.
Exposure to HS, increased serum PRL level compared to TN exposure. Previous
studies have shown that HS increases circulating PRL level in rats (Neill, 1970), cows
(Johke, 1970) and poultry (Johnson, 1981).
69
Intake of an E+ diet decreased serum cholesterol level in E+ fed rats in both
environments, with the exception of short-term HS when E+ rats exhibited only a
tendency towards reduction. Stuedemann et al. (1985) observed a similar reduction in
serum cholesterol levels of cattle grazing on E+ fescue. Oliver et al. (2000) observed
reduced serum cholesterol levels in steers grazed on endophyte-infected tall fescue for
three years. Reduction in serum cholesterol levels is because ergopeptine alkaloids down-
regulate various genes associated with cholesterol biosynthesis (Settivari et al., 2006;
Bhusari et al., 2006). Lowered total serum cholesterol leads to lowered steroidogenesis
(Burke et al., 2001), which contributes to various reproductive problems often seen in E+
animals. Heat stress in the present study, did not affect serum cholesterol levels.
However, earlier studies reported negative effects of HS on serum cholesterol levels in
cows (Fuquay et al., 1980).
In rats, most ALP is located in the brush border of intestinal cells and is
functionally involved in nutrient absorption and transport of long chain fatty acids in the
intestinal mucosa (Kaur et al., 1996). Serum ALP concentrations in rats depend on FI
status, with a reduction occurring in fasting rats (Holt and Kotler, 1987). Endophytic
toxins reduced serum ALP during both short-term TN and long-term HS in the present
study. Therefore, reduction in serum ALP in E+ rats might represent reduced caloric
intake. Reduction in serum ALP was earlier reported in steers fed E+ diet under HS
conditions (Schultze et al., 1999). Reduced serum glucose levels in E+ rats further
represent reduced caloric intake leading reduced growth rate in E+ rats. Heat stress in the
present study increased serum ALP in E+ rats during short-term exposure, but decreased
in E- and E+ rats during long-term HS compared to E- and E+ rats at TN. Interestingly,
70
these results differ from those of Harada et al. (2003), who, observed that severe heat
stress (43ºC for one hour) induces gene and protein expression of intestinal alkaline
phosphatase in rats. The difference may be the intensity and duration of heat exposure.
Heat stress exposure in the present study reduced serum glucose levels in both E-
and E+ rats during short-term HS compared to short-term TN conditions, with no
changes during long-term exposures. Heat stress is known to increase glucose transport in
the intestine to compensate for reduced caloric intake (Garriga et al., 2005), resulting in
reduced serum glucose levels. Blood urea nitrogen level, a blood indicator of protein
metabolism, was also reduced during impaired nutrient absorption (Preston et al., 1965).
Endophytic toxins reduced BUN concentration in the present study only during short
term TN, with no difference between the treatment groups during long term TN and HS
periods. Heat stress did not affect BUN levels in E- and E+ rats in the present study.
However, Lee et al. (2005) reported increased levels of BUN in heat-stressed rats.
Visceral organ weights
Intake of E+ diet reduced average liver weight corrected to BW in both TN and
HS, agreeing with an earlier report by Chestnut et al. (1992). This reduction in liver
weight could be due to the combined effects of E+ toxicants and reduced caloric intake.
Exposure to short- and long-term HS reduced average liver weights corrected to BW.
These results can be partially attributed to the additional reduction in FI and ADG of HS
rats compared to rats maintained at TN (Gursoy et al., 2001). Testis weight relative to
body weight was greater in E+ compared to E- rats during TN and HS. However, this
increase in relative weight could be because of a greater reduction in BW than testis
weight.
71
Adaptive responses
In the present study, rats fed either E- or E+ diets exhibited signs of adaptation to
HS, with respect to Tc, after initial peaks during HS. However, E- rats recovered better
than rats fed E+ diets and exposed to similar HS. These findings are consistent with the
observations of Horowitz and Meiri (1993) and Matthew (1997), who exposed rats to 34
or 32 to33˚C for 14 days and observed that Tc declines 2 to 3 days after HS. Although
not measured in the present study, reductions in metabolic heat production or increases
heat loss mechanisms are two ways rats adapt to HS. Decreased metabolic heat
production during summer is achieved through reduced caloric intake and thermogenic
thyroid hormone production (Baccari et al., 1983). Similarly, rats increase their heat loss
mechanisms during heat stress by increasing splanchnic and peripheral vasodilatation
(Horowitz, 1998), respiratory (80%) and salivary (85%) evaporative water loss
(Schmidek et al., 1983), cutaneous evaporative water loss from skin surface by licking
highly vascularized body surfaces (paws, scrotum, tail), spreading saliva over the body
surface (Hubbard et al., 1982), and increasing the effective surface area for heat
dissipation (through extended body parts) (Gordon, 1993). Activation of genes associated
with gluconeogenesis, lipid metabolism and protein catabolism and hepatic detoxification
mechanisms (e.g., cytochrome P450 isozymes) in response E+ diet intake (Settivari et al.,
2006) may partially contribute to the adaptation observed in E+ rats.
72
6. CONCLUSION
Changes that occur during fescue toxicosis not only involve short-term and long-
term pathologies associated with distress, but also recovery that occurs over time. In fact,
the recovery observed in chronic exposure may be more representative of the problems
associated with fescue toxicosis than the acute effect. Rats fed ergopeptine alkaloids at
thermoneutrality adapted to fescue toxicosis, as reflected by the complete recovery in
feed intake and partial recovery in weight gain. However, rats simultaneously exposed to
a second stressor (i.e., heat), failed to show a similar rate of recovery. The long-term
depressant effect of heat stress seems to have a greater influence under these conditions
than intake of the endophyte diet which seemed to have a more transient response.
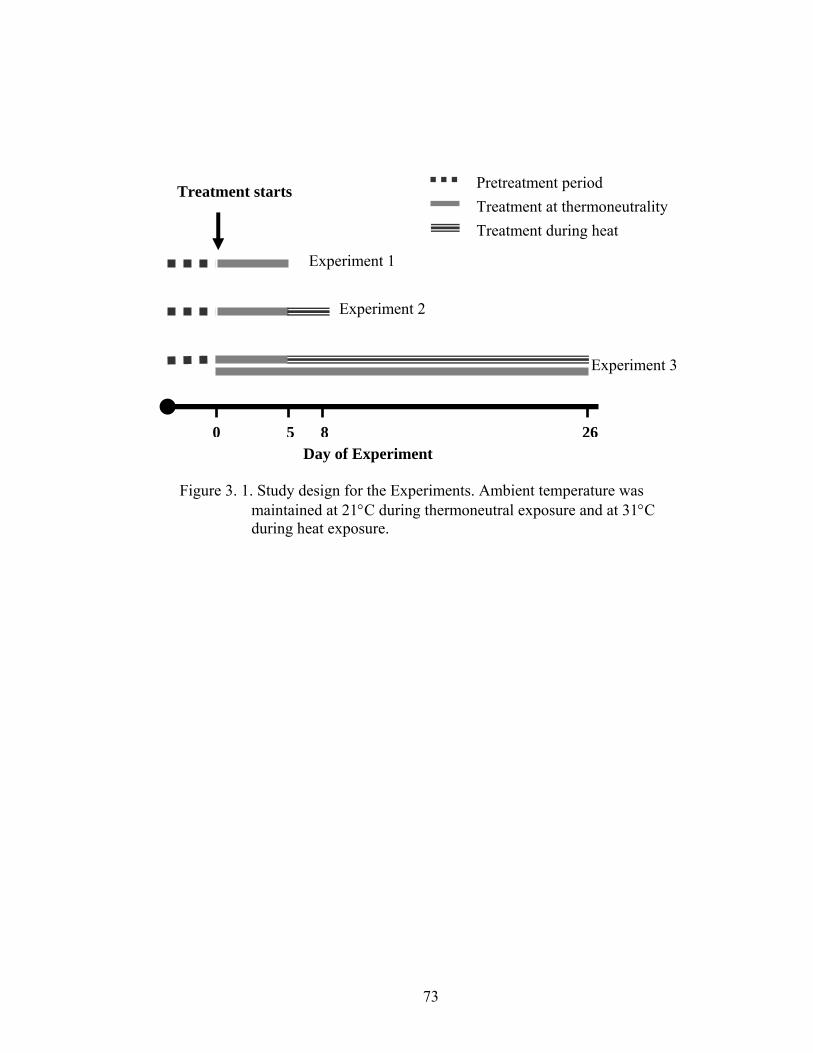
73
Day of Experiment
Figure 3. 1. Study design for the Experiments. Ambient temperature was maintained at 21°C during thermoneutral exposure and at 31°C during heat exposure.
Experiment 1
Pretreatment period Treatment at thermoneutrality Treatment during heat
Treatment starts
Experiment 2
Experiment 3
5 8 260
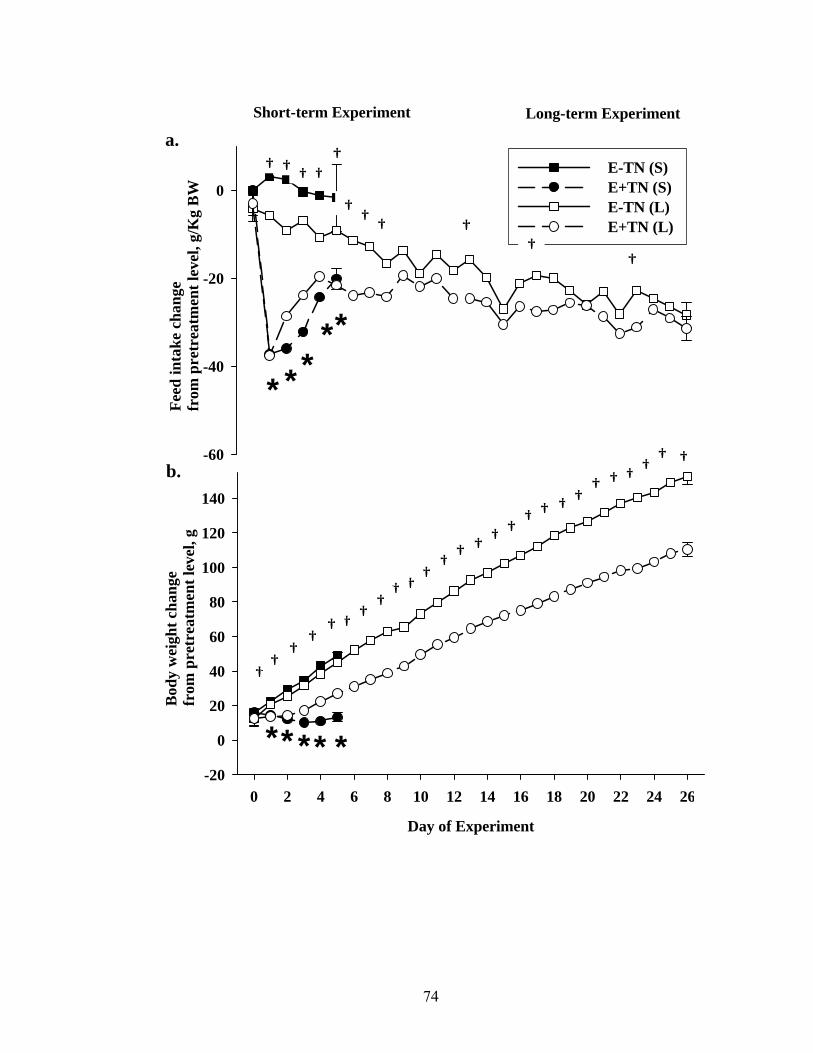
74
-60
-40
-20
0E-TN (S)E+TN (S)E-TN (L)E+TN (L)
Feed
inta
ke c
hang
efr
om p
retr
eatm
ent l
evel
, g/K
g B
W
Long-term ExperimentShort-term Experiment
Bod
y w
eigh
t cha
nge
from
pre
trea
tmen
t lev
el, g
Day of Experiment
0 2 4 6 8 10 12 14 16 18 20 22 24 26-20
0
20
40
60
80
100
120
140
*
†
†
††
††††
††
† †††
†† † † †
†
†††
†††
* *
**
* *** *
a.
b. † ††
†
††
†
†
††
†
75
Figure 3. 2. Group average values for average daily feed intake (a), and daily body weight (b) of rats fed either E- or E+ diets during short- (S; 5 days) or long-term (L; 26 days) exposures at thermoneutrality. An asterisk (*) shows a significant difference (p < 0.05) between E- and E+ groups during the short-term experiment, whereas a dagger (†) shows a significant difference (p < 0.05) between E- and E+ groups during the long-term exposure.
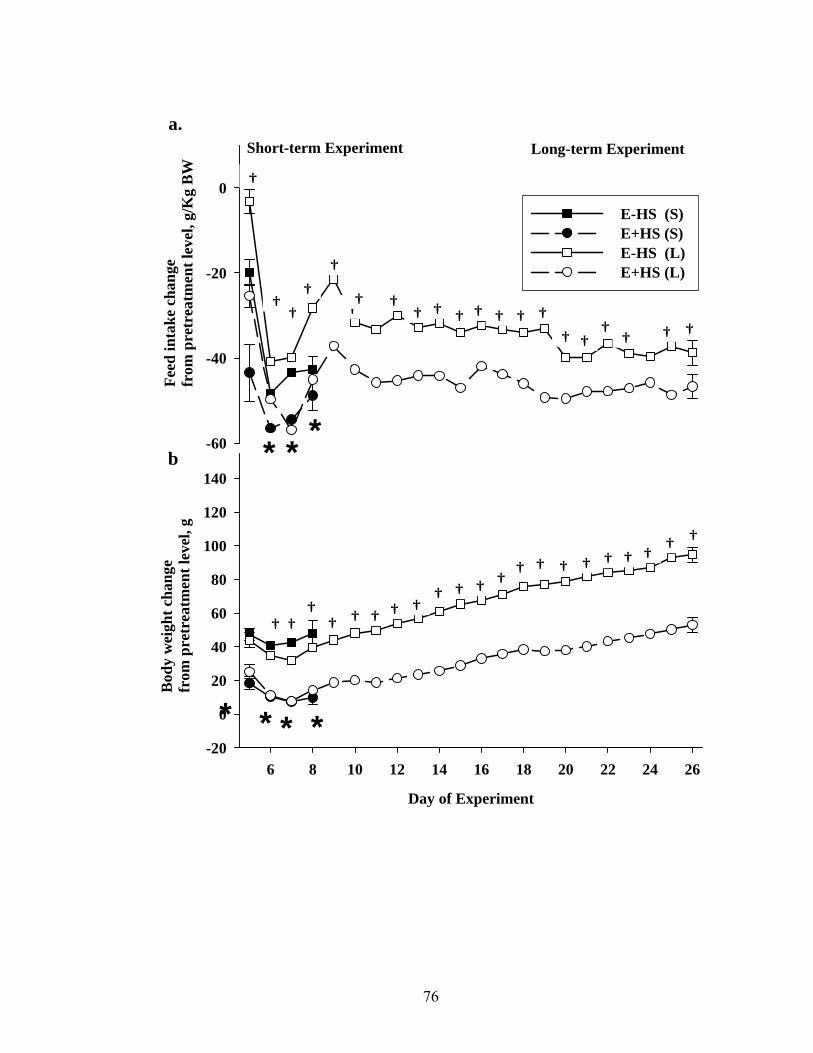
76
-60
-40
-20
0
E-HS (S)E+HS (S)E-HS (L)E+HS (L)
Feed
inta
ke c
hang
efr
om p
retr
eatm
ent l
evel
, g/K
g B
WB
ody
wei
ght c
hang
e fr
om p
retr
eatm
ent l
evel
, g
Long-term ExperimentShort-term Experiment
Day of Experiment
6 8 10 12 14 16 18 20 22 24 26-20
0
20
40
60
80
100
120
140
a.
b
†††
††††††
††
† † † †† † † † †
†
††††††
††
†† † † ††
† ††
†
***
* * * *
† †
† †
77
Figure 3. 3. Group average values for average daily feed intake (a), and daily body weight (b) of rats fed either E- or E+ diets during short- (S; 5 days) or long-term (L; 26 days) exposures at thermoneutrality. An asterisk (*) shows a significant difference (p < 0.05) between E- and E+ groups during the short-term exposure, whereas a dagger (†) shows a significant difference (p < 0.05) between E- and E+ groups during the long-term exposure.
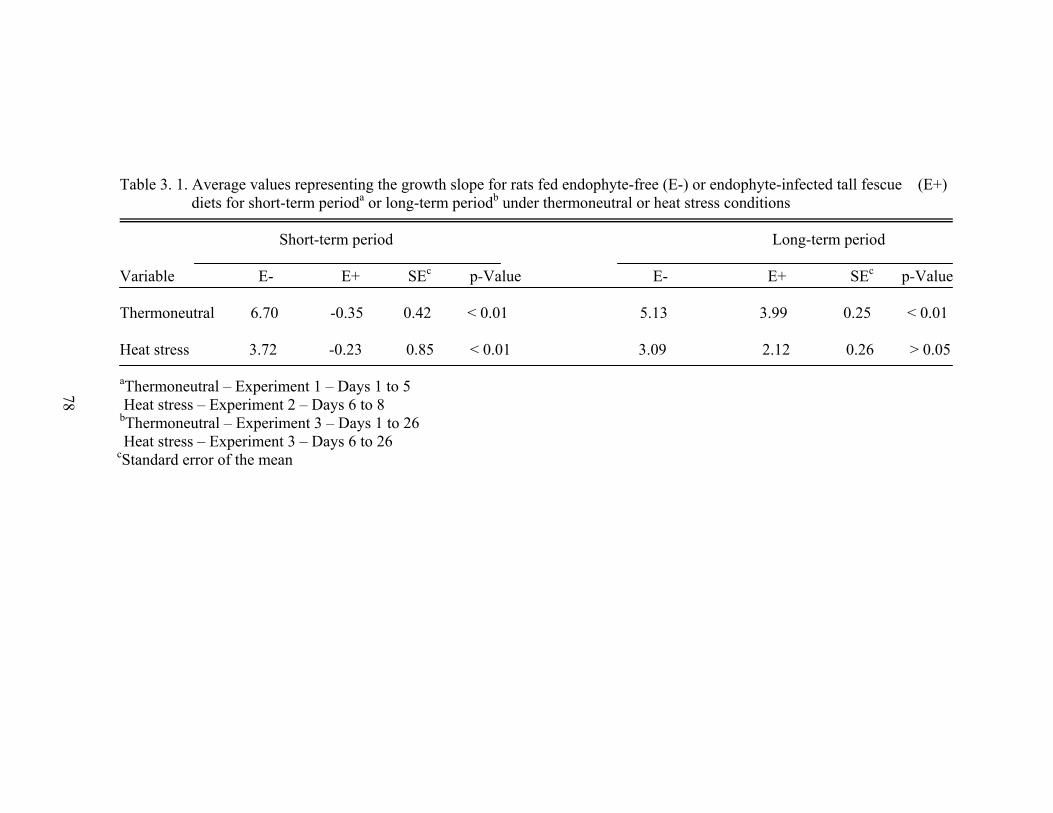
78
Table 3. 1. Average values representing the growth slope for rats fed endophyte-free (E-) or endophyte-infected tall fescue (E+) diets for short-term perioda or long-term periodb under thermoneutral or heat stress conditions
Short-term period Long-term period Variable E- E+ SEc p-Value E- E+ SEc p-Value Thermoneutral 6.70 -0.35 0.42 < 0.01 5.13 3.99 0.25 < 0.01 Heat stress 3.72 -0.23 0.85 < 0.01 3.09 2.12 0.26 > 0.05 aThermoneutral – Experiment 1 – Days 1 to 5 Heat stress – Experiment 2 – Days 6 to 8 bThermoneutral – Experiment 3 – Days 1 to 26 Heat stress – Experiment 3 – Days 6 to 26
cStandard error of the mean
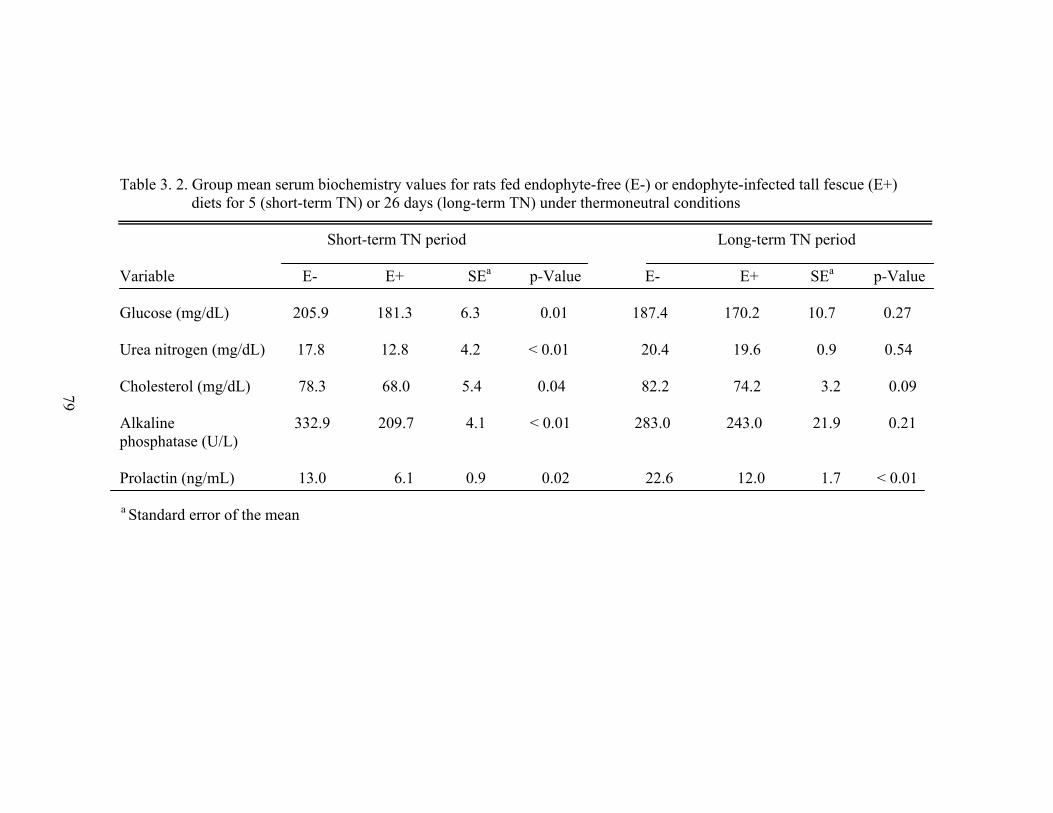
79
Table 3. 2. Group mean serum biochemistry values for rats fed endophyte-free (E-) or endophyte-infected tall fescue (E+) diets for 5 (short-term TN) or 26 days (long-term TN) under thermoneutral conditions
Short-term TN period Long-term TN period Variable E- E+ SEa p-Value E- E+ SEa p-Value
Glucose (mg/dL) 205.9 181.3 6.3 0.01 187.4 170.2 10.7 0.27 Urea nitrogen (mg/dL) 17.8 12.8 4.2 < 0.01 20.4 19.6 0.9 0.54 Cholesterol (mg/dL) 78.3 68.0 5.4 0.04 82.2 74.2 3.2 0.09 Alkaline 332.9 209.7 4.1 < 0.01 283.0 243.0 21.9 0.21 phosphatase (U/L) Prolactin (ng/mL) 13.0 6.1 0.9 0.02 22.6 12.0 1.7 < 0.01 a Standard error of the mean
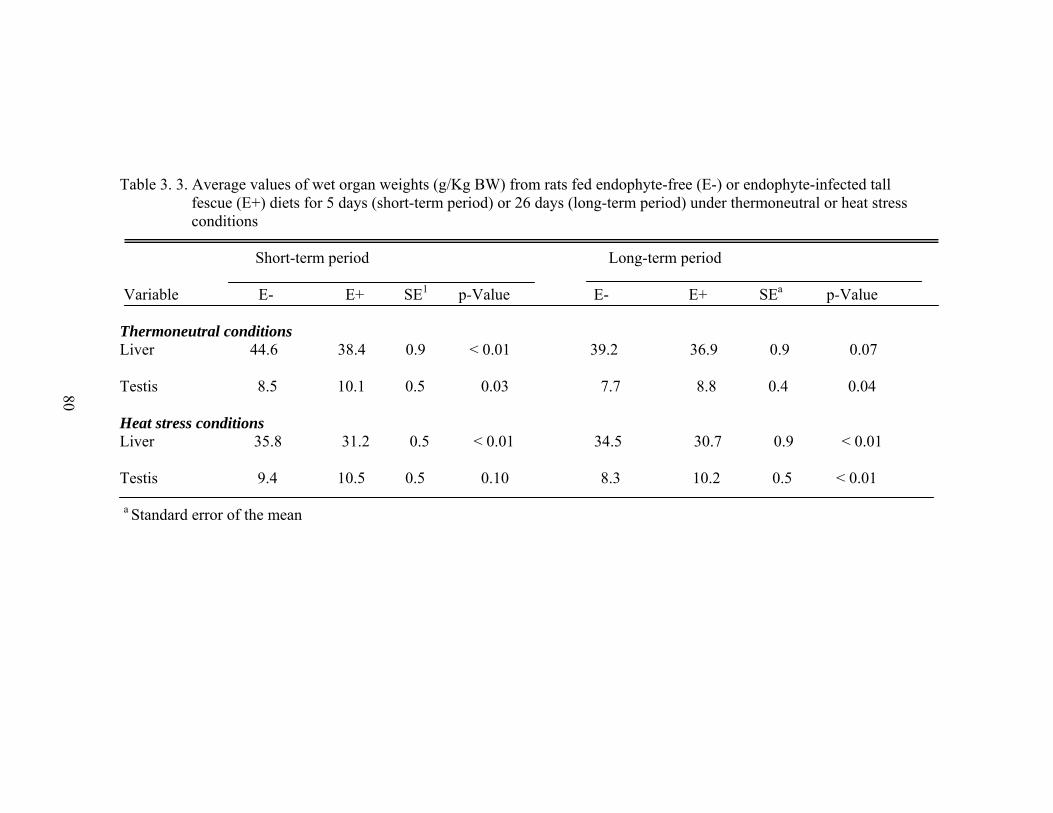
80
Table 3. 3. Average values of wet organ weights (g/Kg BW) from rats fed endophyte-free (E-) or endophyte-infected tall fescue (E+) diets for 5 days (short-term period) or 26 days (long-term period) under thermoneutral or heat stress conditions
Short-term period Long-term period Variable E- E+ SE1 p-Value E- E+ SEa p-Value
Thermoneutral conditions Liver 44.6 38.4 0.9 < 0.01 39.2 36.9 0.9 0.07 Testis 8.5 10.1 0.5 0.03 7.7 8.8 0.4 0.04 Heat stress conditions Liver 35.8 31.2 0.5 < 0.01 34.5 30.7 0.9 < 0.01 Testis 9.4 10.5 0.5 0.10 8.3 10.2 0.5 < 0.01
a Standard error of the mean
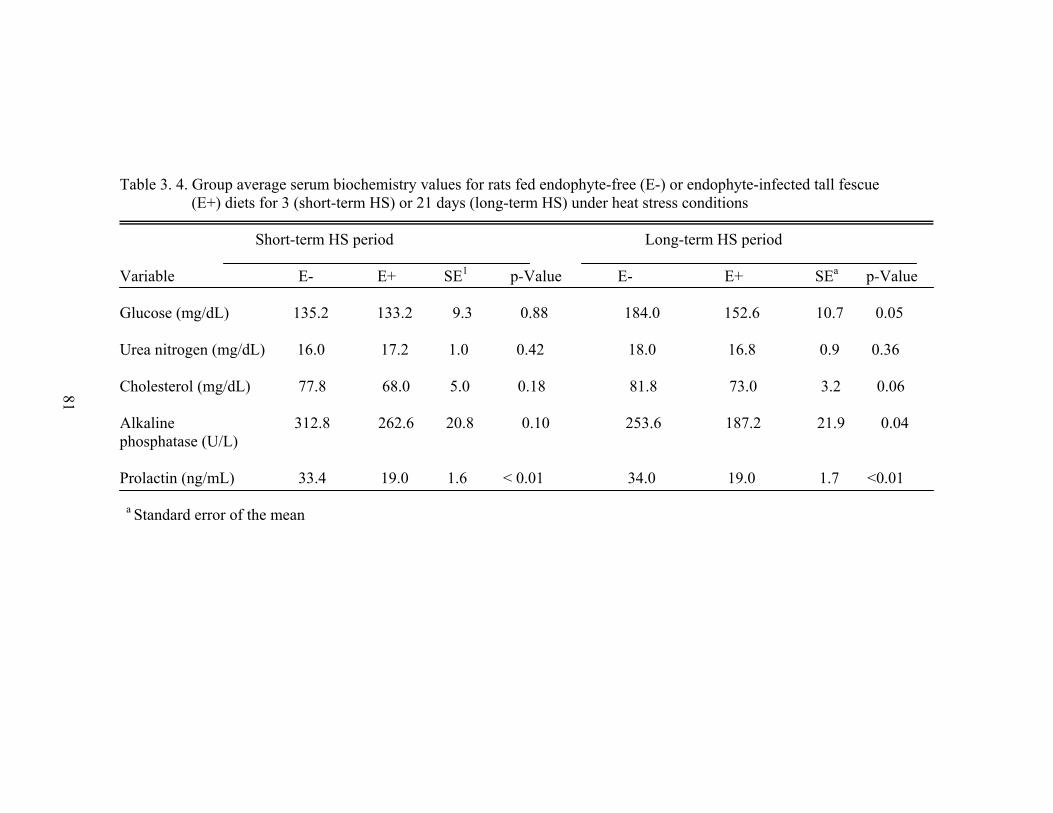
81
Table 3. 4. Group average serum biochemistry values for rats fed endophyte-free (E-) or endophyte-infected tall fescue (E+) diets for 3 (short-term HS) or 21 days (long-term HS) under heat stress conditions
Short-term HS period Long-term HS period Variable E- E+ SE1 p-Value E- E+ SEa p-Value
Glucose (mg/dL) 135.2 133.2 9.3 0.88 184.0 152.6 10.7 0.05 Urea nitrogen (mg/dL) 16.0 17.2 1.0 0.42 18.0 16.8 0.9 0.36 Cholesterol (mg/dL) 77.8 68.0 5.0 0.18 81.8 73.0 3.2 0.06 Alkaline 312.8 262.6 20.8 0.10 253.6 187.2 21.9 0.04 phosphatase (U/L) Prolactin (ng/mL) 33.4 19.0 1.6 < 0.01 34.0 19.0 1.7 <0.01 a Standard error of the mean
82
CHAPTER IV
GENOMIC ANALYSIS OF THE IMPACT OF FESCUE TOXICOSIS
ON HEPATIC FUNCTION
ABSTRACT
Fescue toxicosis is caused by consumption of toxins produced by an endophytic
fungus, Neotyphodium coenophialum, in tall fescue [Lolium arundinaceum (Schreb)
Darbysh]. Microarray analysis was used to identify shifts in genetic expression associated
with affected physiological processes to identify potential targets for future
pharmacological/toxicological studies. Male rats (n = 24) were implanted with
temperature transmitters which measure core temperature (Tc) every 5 min. Following an
8-d recovery, they were fed an endophyte-free (E-) diet for 5-d. During the following 5-d
treatment period, rats were fed either an E- or endophyte infected (E+; 91.5 μg EV·kg
BW-1·d-1) diets. At treatment end, rats were euthanized and liver was sampled. Feed
conversion efficiency (FCE) was calculated for both treatment groups. Serum prolactin
levels were measured using ELISA. Liver tissue RNA was reverse transcribed and
hybridized to an oligonucleotide microarray chip. Microarray data were analyzed using a
two-step ANOVA model, and validated by real-time PCR. Significant reductions in mean
Tc, feed intake, FCE, body weight (BW), mass-specific liver weight, and serum prolactin
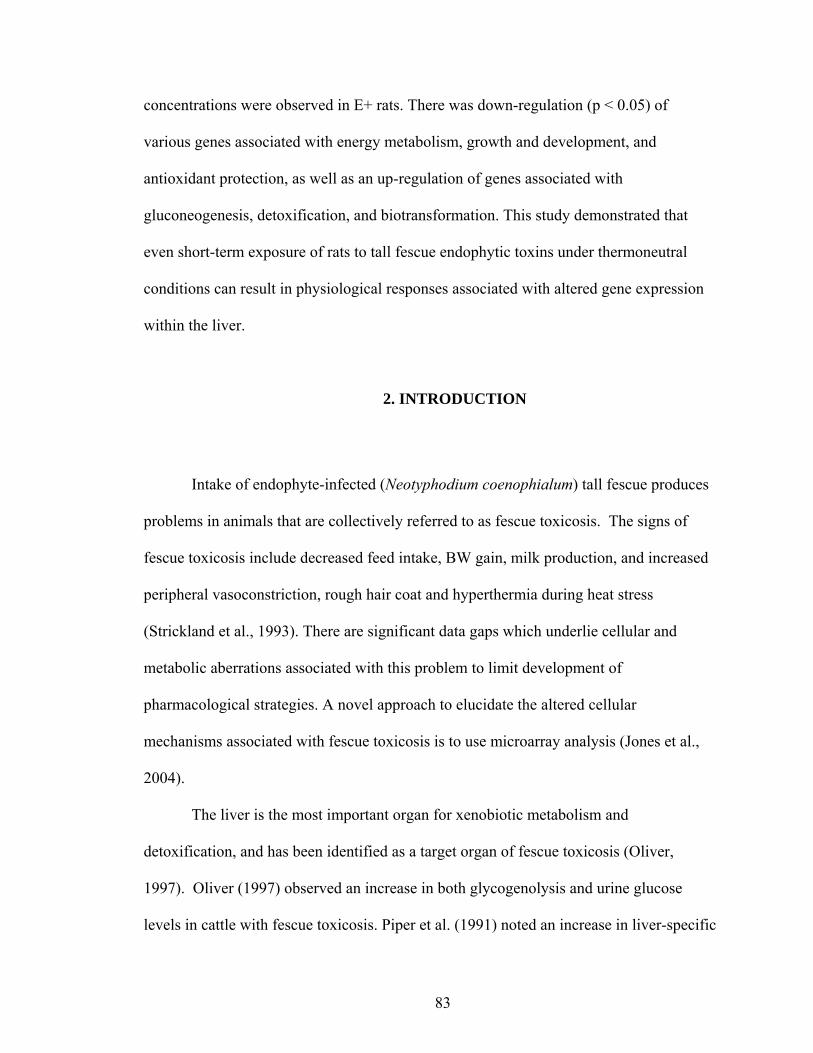
83
concentrations were observed in E+ rats. There was down-regulation (p < 0.05) of
various genes associated with energy metabolism, growth and development, and
antioxidant protection, as well as an up-regulation of genes associated with
gluconeogenesis, detoxification, and biotransformation. This study demonstrated that
even short-term exposure of rats to tall fescue endophytic toxins under thermoneutral
conditions can result in physiological responses associated with altered gene expression
within the liver.
2. INTRODUCTION
Intake of endophyte-infected (Neotyphodium coenophialum) tall fescue produces
problems in animals that are collectively referred to as fescue toxicosis. The signs of
fescue toxicosis include decreased feed intake, BW gain, milk production, and increased
peripheral vasoconstriction, rough hair coat and hyperthermia during heat stress
(Strickland et al., 1993). There are significant data gaps which underlie cellular and
metabolic aberrations associated with this problem to limit development of
pharmacological strategies. A novel approach to elucidate the altered cellular
mechanisms associated with fescue toxicosis is to use microarray analysis (Jones et al.,
2004).
The liver is the most important organ for xenobiotic metabolism and
detoxification, and has been identified as a target organ of fescue toxicosis (Oliver,
1997). Oliver (1997) observed an increase in both glycogenolysis and urine glucose
levels in cattle with fescue toxicosis. Piper et al. (1991) noted an increase in liver-specific
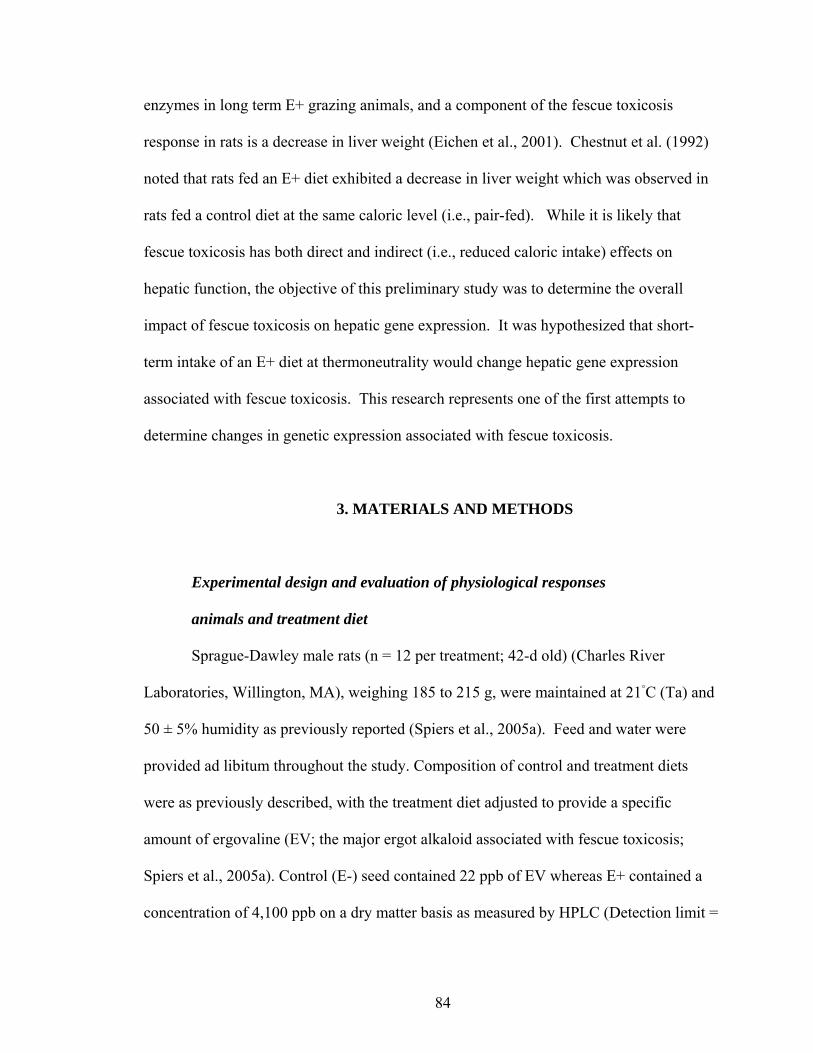
84
enzymes in long term E+ grazing animals, and a component of the fescue toxicosis
response in rats is a decrease in liver weight (Eichen et al., 2001). Chestnut et al. (1992)
noted that rats fed an E+ diet exhibited a decrease in liver weight which was observed in
rats fed a control diet at the same caloric level (i.e., pair-fed). While it is likely that
fescue toxicosis has both direct and indirect (i.e., reduced caloric intake) effects on
hepatic function, the objective of this preliminary study was to determine the overall
impact of fescue toxicosis on hepatic gene expression. It was hypothesized that short-
term intake of an E+ diet at thermoneutrality would change hepatic gene expression
associated with fescue toxicosis. This research represents one of the first attempts to
determine changes in genetic expression associated with fescue toxicosis.
3. MATERIALS AND METHODS
Experimental design and evaluation of physiological responses
animals and treatment diet
Sprague-Dawley male rats (n = 12 per treatment; 42-d old) (Charles River
Laboratories, Willington, MA), weighing 185 to 215 g, were maintained at 21◦C (Ta) and
50 ± 5% humidity as previously reported (Spiers et al., 2005a). Feed and water were
provided ad libitum throughout the study. Composition of control and treatment diets
were as previously described, with the treatment diet adjusted to provide a specific
amount of ergovaline (EV; the major ergot alkaloid associated with fescue toxicosis;
Spiers et al., 2005a). Control (E-) seed contained 22 ppb of EV whereas E+ contained a
concentration of 4,100 ppb on a dry matter basis as measured by HPLC (Detection limit =
85
50 ppb and CV = 7%; Rottinghaus et al., 1993). All procedures on animals followed the
guidelines for humane treatment set by the University of Missouri Animal Care and Use
Committee.
Treatment period and sample collection
The experimental schedule consisted initially of an 8-d recovery period after
surgery for intraperitoneal implantation of telemetric temperature transmitters (Model
VM-FH; Mini-Mitter Company, Inc., Bend, OR), followed by a 5-d pretreatment period
(d -1 to -5), during which Tc, feed intake, and BW measurements were collected to
establish a baseline for statistical analysis (Spiers et al., 2005a). During the 5-d duration
of treatment (d 1 to 5), rats were fed either E- or E+ (91.5 μg EV•kg BW-1•d-1) diets
while Tc, feed intake, and BW measurements were collected. At the end of study (d 6),
rats were anesthetized and exsanguinated, and the liver was collected and weighed. A
transverse section from the middle lobe of liver (~ 5 g) was fixed in 10% neutral buffered
formalin for histological examination, and another portion (~ 5 g) was snap-frozen in
liquid nitrogen for microarray experiments. Serum from the collected blood sample was
frozen at -20◦C for later use. Serum PRL concentrations were measured using ELISA,
following manufacturer’s protocol (Spi bio, Massy Cedex, France).
Histological examination of liver
Fixed liver sections were stained with hematoxylin and eosin (H & E) to study
the histological changes and with periodic Acid-Schiff (PAS) to compare the levels of
stored glycogen in E+ and E- rats. Images were captured at 400X magnification (Insight
Color Camera, Sterling Heights, MI). A scoring system (one to four) was devised, with
one denoting little or no vacuolation and four indicating marked vacuolation. A
86
vacuolation score was assigned to the liver sections by a board certified veterinary
pathologist, without prior knowledge of their treatment group assignment.
Statistical analysis of physiological responses
Mean values for Tc, feed intake and BW were computed as a function of time
and treatment group. The above parameters were analyzed by repeated measures analysis
of variance (mixed procedure) of SAS (Littell et al., 1998) using treatment, time, and
animal as class variables to determine overall treatment and time-related differences, and
treatment X time interactions.
Microarray and real-time PCR analyses of genomic responses
Selection of experimental animals
In the present study, eight out-bred rats (four per treatment group) were used to
study the genomic effects of fescue toxicosis. Because of the costs associated with
microarray analyses, the four E+ rats showing the most pronounced evidence of fescue
toxicosis were selected for microarray analysis. Selection was based on reduction in feed
intake, FCE, liver weight, and Tc. Real-time PCR (RT-PCR) was used for all 24 rats to
validate the microarray experimental results at the population level.
Microarray slide printing
Microarray slides were prepared by printing 1,353 Oligonucleotides (50 bases
long) specific to rat liver (MWG Biotech AG, Ebersberg, Germany) on pan epoxy glass
slides (MWG Biotech AG, Ebersberg, Germany) using a 16 pin robotic microarray
printer. Each block in the microarray slide also contained: 10 Arabidopsis thaliana plant
genes (Spot report oligoTM, Stratagene, Cedar Creek,TX) as external controls, 3X SSC as
87
negative controls, and rat Cot-1 DNA (Stratagene, Cedar Creek, TX) and poly A
(Stratagene, Cedar Creek, TX) to detect non-specific hybridization.
RNA extraction
Total RNA was extracted from liver samples using RNeasy Midi Kit (Qiagen
Inc., Valencia, CA), purified using DNase-1 (Ambion Inc., Austin, TX) and phenol,
chloroform, isoamyl alcohol (25:24:1) and concentrated using microcon filters (Amicon
Bioseparations, Bedford, MA) following the manufacturer’s instructions. The RNA
concentrations were measured using a ND-1000 Spectrophotometer (Nanodrop
Technologies, Wilmington, DE).
cDNA preparation
Concentrated E+ or E- total RNA (15 µg) was reverse transcribed to cDNA using
oligo dT (IDT DNA, Coralville, IA), random hexamers (IDT DNA, Coralville, IA), 50x
amino-allyl dUTP (Sigma Chemicals, St. Louis, MO) and reverse transcriptase
(StrataScript™ RT, Stratagene, La Jolla, CA). The resulting cDNA was purified using
Microcon-30 filters (Millipore Corp., Bedford, MA) and conjugated either with Cy3 or
Cy5 dyes separately by incubating in the dark for one hour. Conjugated oligonucleotides
were separated from free, unconjugated dye using Qia-quick PCR purification kit
(Quigen, City, Valencia, CA), following manufacturer’s instructions. The two cDNA
samples, labeled with Cy3 and Cy5 dyes, were mixed together and dried.
Microarray hybridization
Dried cDNA pellet was resuspended with the hybridization mixture, which
consisted of 1X 4-(2-hydroxyethyl)-1-piperazineethanesulfonic acid (HEPES; pH 7.0),
poly A (10 µg/µl) (Stratagene, Cedar Creek, TX), rat Cot-I DNA (3.2 µg/µl) 20X
88
standard saline citrate (SSC), (Stratagene, Cedar Creek, TX) and 10% sodium dodecyl
sulfate (SDS). The slides were incubated in a water bath (65°C) for 12 to16 h. Following
incubation, the slides were rinsed in Wash Solution I (20X SSC, and 10% SDS) and then
in Wash Solution II (20X SSC).
Microarray slide scanning and analysis
Microarray slides were scanned using GenePix 4000B Microarray Scanner (Axon
Instruments, Union City, CA). Signal intensity of each spot from the scanned image was
analyzed using Genepix Pro 3.0 software (Axon Instruments, Union City, CA). The spots
were filtered based on their spot intensities, and flagged bad if the number of pixels that
exceeded a background-related threshold (background intensity + 1 SD) lowers than
55%. The spots were flagged, “not found” when the spot had less than six pixels above
the background-related threshold, or if the spots overlapped the adjacent spots. The
microarray data was stored in the BioArray Software Environment database (Saal et al.,
2002).
Self-self hybridization
Six self-self hybridizations were performed to measure the variation in gene
expression due to technical errors. In these, the same rat was used for different RNA
isolations, labeling, and hybridizations. The slides were hybridized, scanned, and
analyzed as above. Means and standard deviations for Cy5 and Cy3 ratios were
calculated for the six hybridizations and a significant threshold was set as mean ± 2 SD,
which was ± 1.34. Genes with expression above or below this threshold were considered
as up- or down-regulated, and used for further analysis.
89
Microarray analysis using ANOVA model
A loop design was followed for the microarray experiments. Intensity readings
were transformed to log base two scales. The microarray data was analyzed using a two-
step mixed linear model following the procedures of Kerr and Churchill (2002) and
Wolfinger et al. (2001). The first step was normalization across genes, which identified
and removed the variation caused by the array, pin, and dye effects and all of their first
order interactions. The residuals from this model were used as the input for the second
stage to model and remove the animal and dye effects and their interactions. The residual
values from these analyses were the normalized data set. The use of ANOVA model
allowed experimental effects to be estimated through the partitioning of the variations in
the experiment and helped in inter-treatment comparisons without an internal reference.
First model (Normalization):
Where,
Yadgp = μ + Aa + Pp + Dd + (AP)ap + (AD)ad + (PD)pd + ε adgp
Where,
Yadgp: Log base two observed intensity of each experimental gene on the arrays
μ: Mean value across all genes and arrays
Aa: Array main effect
Pp: Pin, or panel, main effect
Dd: Dye main effect
(AP)ap: Pin by Array interaction effect
90
(AD)ad: Dye by Array interaction effect
(PD)pd: Pin by Dye interaction effect
ε adgp: Stochastic error term
The residual values from the normalization model were obtained by subtracting
the fitted value for the effects from the Yagp value. Variation due to pin and array effects
significantly contributed to gene expression (25%).
Second model (Gene specific model):
Rdgn = μg + (GAn)gn + (GD)gd + εdgn
Where,
μg: Mean value for gene g,
(GAn)gn: Random effect for gene g by animal An,
(GD)gd: Random effect for gene g by dye Dd. and
εdgn: Stochastic errors obtained from the gene-specific models.
The second model of the microarray analysis consisted of a gene specific model
for the output from the normalization model. Microarray analyses were computed using
Proc Mixed Procedure in SAS (SAS Institute Inc, Cary, NC). A t-test was used to find
differentially expressed genes, between treatment groups. The residual values obtained
after the normalization model were also analyzed using a nonparametric Kruskal-Wallis
method. Similar p-values were obtained for the differentially expressed genes using
either method.
The GA values obtained from the ANOVA model analysis were further analyzed
using Significance Analysis of Microarray (SAM) (Tusher et al., 2001) program. The
91
microarray data was permutated, using the following parameters: 2-class, unpaired, not
log transformed, 1,000 permutations. A hierarchical tree was built with the results from
SAM analysis using the TMev program (Eisen et al., 1998). The hierarchical tree was
confirmed using bootstrap (Kerr and Churchill, 2002). The DAVID (Dennis et al., 2003)
and Locuslink (http://www.ncbi.nlm.nih.gov/LocusLink) were used to find the gene
annotation, and the functions of differentially expressed genes.
Microarray raw data files were deposited with the National Center for
Biotechnology Information Gene Expression Omnibus
(http://www.ncbi.nlm.nih.gov/geo). The serial entry number for the microarray data is
GSE2452 with the platform number being GLP 1786. Each hybridization, in the
microarray experiment was given the following serial numbers: GSM46406, GSM46407,
GSM46408, GSM46409, GSM46410, GSM46411, GSM46412, GSM46413, GSM46414,
GSM46415, GSM46416, GSM46417, GSM46418, GSM46419, GSM46420, GSM46421,
GSM46422, GSM46423, GSM46424, GSM46425, GSM46426, GSM46427, GSM46428,
and GSM46429.
Quantitative real-time PCR
Real-time PCR was performed in a subset of eight representative genes for which
the fescue toxicosis-induced changes in expression were considered statistically
significant by microarray analysis and the pathways represented were of interest from the
perspective of fescue toxicosis-induced hepatic effects. Table 4. 1 shows the gene-
specific primers which were designed with the Primer Express program (Applied
Biosystems, Warrington, UK) using default settings (primer Tm = 58 to 60°C, GC
content = 30 to 80%, length = 9 to 40 nucleotides). Glyceraldehyde -3- phosphate
92
dehydrogenase (GAPDH) was used as the house keeping gene. The annealing
temperature for the primers was standardized using gradient PCR and 3% agarose gels.
The reaction mixture consisted of 2X SYBR Green PCR Master mix (Applied
Biosystems, Warrington, UK), 50 nM forward and reverse primers and 0.1 ng/µl cDNA.
Thermal cycling was carried out with an ABI Prism 7000 sequence detection system
(Applied Biosystems Warrington, UK) under factory default conditions (50°C, 2 min;
95°C 10 min; and 40 cycles at 95ºC, 15 sec; 60ºC, 1 min). Each gene was measured in
triplicates and the formation of single PCR product was confirmed using dissociation
curves. The normalized Ct values for each gene in all the 12 rats of each treatment group
were averaged and the relative percent change in the expression of the gene in E+ rats
was calculated. Student’s t-test was used to statistically compare the Ct values between
E+ and E- rats.
4. RESULTS
Physiological responses to fescue toxicosis
Core body temperature
A previously reported (Spiers et al., 2005a), circadian rhythm for the rat core
body temperature was also observed in this study. Consumption of E+ diet resulted in a
time related decrease (p = 0.04) in Tc (Figure 4. 1) in the E+ fed treatment group, with
the temperatures decreasing (p < 0.05) from d 4. In contrast, no significant decrease in Tc
was observed in E- rats during the treatment period.
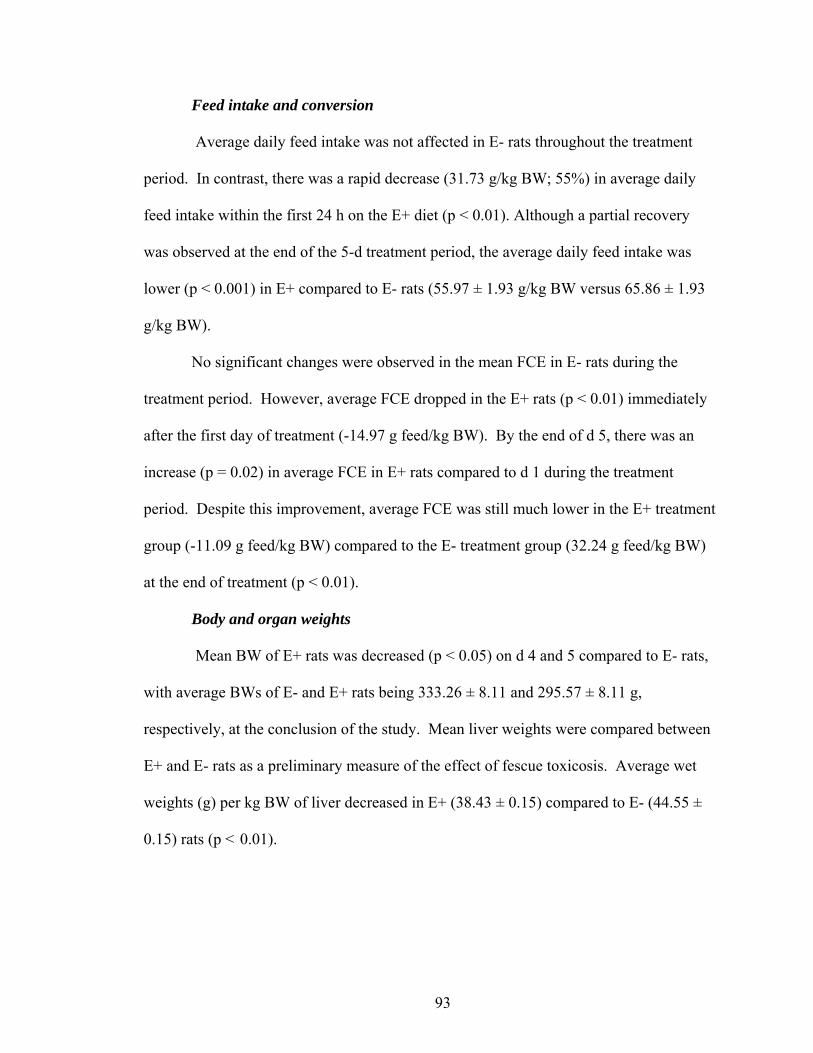
93
Feed intake and conversion
Average daily feed intake was not affected in E- rats throughout the treatment
period. In contrast, there was a rapid decrease (31.73 g/kg BW; 55%) in average daily
feed intake within the first 24 h on the E+ diet (p < 0.01). Although a partial recovery
was observed at the end of the 5-d treatment period, the average daily feed intake was
lower (p < 0.001) in E+ compared to E- rats (55.97 ± 1.93 g/kg BW versus 65.86 ± 1.93
g/kg BW).
No significant changes were observed in the mean FCE in E- rats during the
treatment period. However, average FCE dropped in the E+ rats (p < 0.01) immediately
after the first day of treatment (-14.97 g feed/kg BW). By the end of d 5, there was an
increase (p = 0.02) in average FCE in E+ rats compared to d 1 during the treatment
period. Despite this improvement, average FCE was still much lower in the E+ treatment
group (-11.09 g feed/kg BW) compared to the E- treatment group (32.24 g feed/kg BW)
at the end of treatment (p < 0.01).
Body and organ weights
Mean BW of E+ rats was decreased (p < 0.05) on d 4 and 5 compared to E- rats,
with average BWs of E- and E+ rats being 333.26 ± 8.11 and 295.57 ± 8.11 g,
respectively, at the conclusion of the study. Mean liver weights were compared between
E+ and E- rats as a preliminary measure of the effect of fescue toxicosis. Average wet
weights (g) per kg BW of liver decreased in E+ (38.43 ± 0.15) compared to E- (44.55 ±
0.15) rats (p < 0.01).
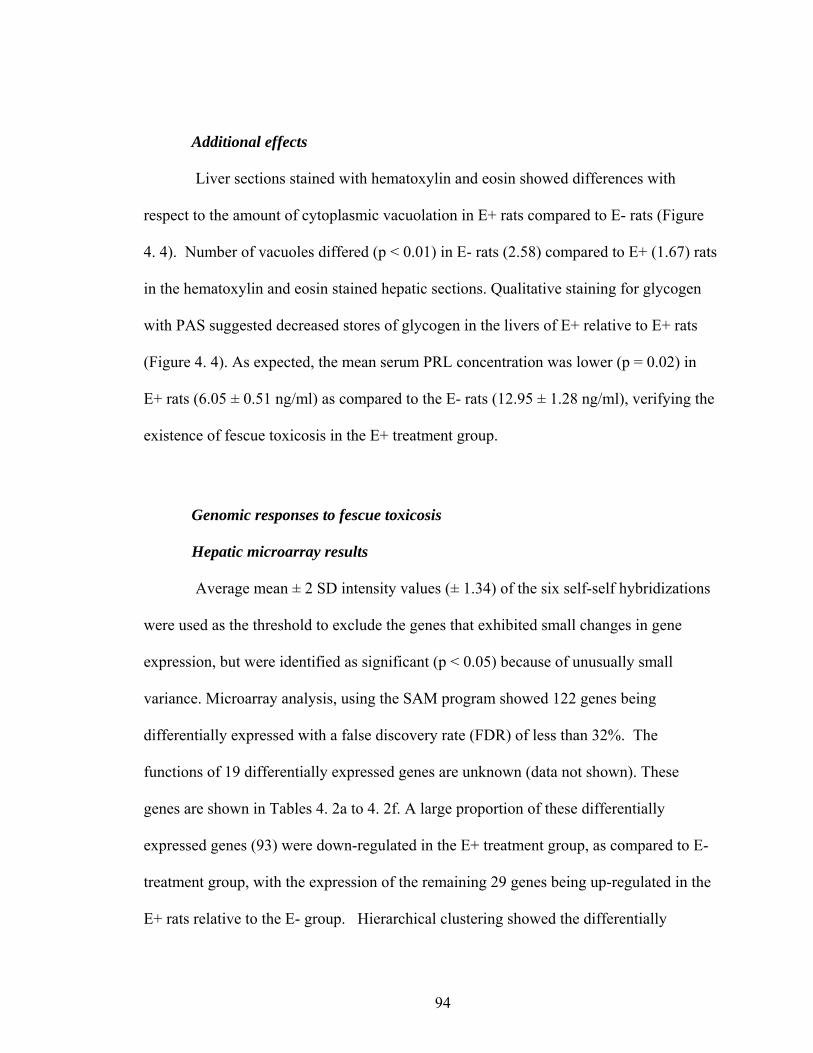
94
Additional effects
Liver sections stained with hematoxylin and eosin showed differences with
respect to the amount of cytoplasmic vacuolation in E+ rats compared to E- rats (Figure
4. 4). Number of vacuoles differed (p < 0.01) in E- rats (2.58) compared to E+ (1.67) rats
in the hematoxylin and eosin stained hepatic sections. Qualitative staining for glycogen
with PAS suggested decreased stores of glycogen in the livers of E+ relative to E+ rats
(Figure 4. 4). As expected, the mean serum PRL concentration was lower (p = 0.02) in
E+ rats (6.05 ± 0.51 ng/ml) as compared to the E- rats (12.95 ± 1.28 ng/ml), verifying the
existence of fescue toxicosis in the E+ treatment group.
Genomic responses to fescue toxicosis
Hepatic microarray results
Average mean ± 2 SD intensity values (± 1.34) of the six self-self hybridizations
were used as the threshold to exclude the genes that exhibited small changes in gene
expression, but were identified as significant (p < 0.05) because of unusually small
variance. Microarray analysis, using the SAM program showed 122 genes being
differentially expressed with a false discovery rate (FDR) of less than 32%. The
functions of 19 differentially expressed genes are unknown (data not shown). These
genes are shown in Tables 4. 2a to 4. 2f. A large proportion of these differentially
expressed genes (93) were down-regulated in the E+ treatment group, as compared to E-
treatment group, with the expression of the remaining 29 genes being up-regulated in the
E+ rats relative to the E- group. Hierarchical clustering showed the differentially
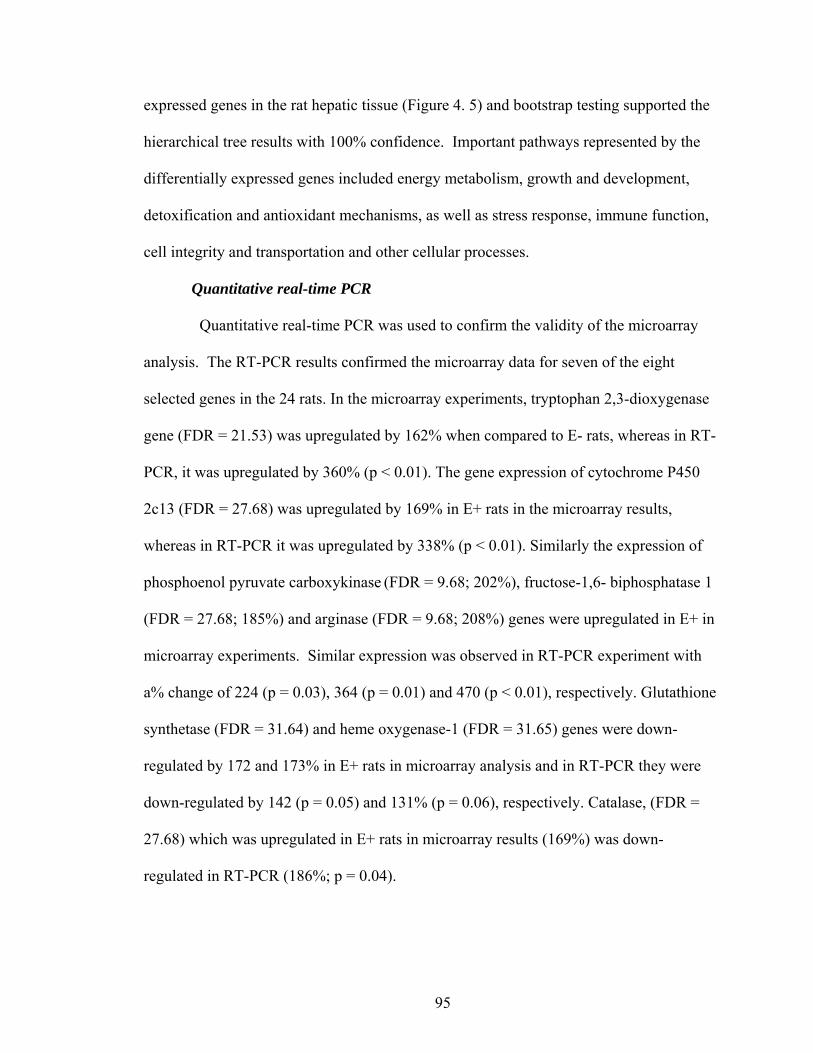
95
expressed genes in the rat hepatic tissue (Figure 4. 5) and bootstrap testing supported the
hierarchical tree results with 100% confidence. Important pathways represented by the
differentially expressed genes included energy metabolism, growth and development,
detoxification and antioxidant mechanisms, as well as stress response, immune function,
cell integrity and transportation and other cellular processes.
Quantitative real-time PCR
Quantitative real-time PCR was used to confirm the validity of the microarray
analysis. The RT-PCR results confirmed the microarray data for seven of the eight
selected genes in the 24 rats. In the microarray experiments, tryptophan 2,3-dioxygenase
gene (FDR = 21.53) was upregulated by 162% when compared to E- rats, whereas in RT-
PCR, it was upregulated by 360% (p < 0.01). The gene expression of cytochrome P450
2c13 (FDR = 27.68) was upregulated by 169% in E+ rats in the microarray results,
whereas in RT-PCR it was upregulated by 338% (p < 0.01). Similarly the expression of
phosphoenol pyruvate carboxykinase (FDR = 9.68; 202%), fructose-1,6- biphosphatase 1
(FDR = 27.68; 185%) and arginase (FDR = 9.68; 208%) genes were upregulated in E+ in
microarray experiments. Similar expression was observed in RT-PCR experiment with
a% change of 224 (p = 0.03), 364 (p = 0.01) and 470 (p < 0.01), respectively. Glutathione
synthetase (FDR = 31.64) and heme oxygenase-1 (FDR = 31.65) genes were down-
regulated by 172 and 173% in E+ rats in microarray analysis and in RT-PCR they were
down-regulated by 142 (p = 0.05) and 131% (p = 0.06), respectively. Catalase, (FDR =
27.68) which was upregulated in E+ rats in microarray results (169%) was down-
regulated in RT-PCR (186%; p = 0.04).
96
5. DISCUSSION
Physiological responses associated with fescue toxicosis
Fescue toxicosis in cattle is associated with a number of physiological responses,
including altered thermoregulation (Spiers et al., 1995; Stuedemann et al., 1985),
decreased feed intake and average daily gain (Nihsen et al., 2004), inefficient feed
conversion (Bush et al., 2001) and hypoprolactinemia (Schillo et al., 1988; Cross et al.,
1995). All except the last two responses have been previously reported in the rat model
for fescue toxicosis (Spiers et al., 2005a). However, all of these responses were observed
in the present study after only 5-d of exposure to an E+ diet at thermoneutrality (Figures
4. 1 to 4. 3).
Toxins associated with fescue toxicosis have high affinities for α-adrenergic,
dopaminergic and nearly all subtypes of serotinergic receptors (Oliver, 2005).
Interactions of E+ toxins with these receptors increase vasoconstriction (Oliver, 2005),
decrease feed intake, gastrointestinal secretions, segmental activity, nutrient absorption
(Oliver, 1997), and suppress prolactin secretion from the anterior pituitary (Elsasser and
Bolt, 1987).
Genomic responses associated with fescue toxicosis
It was hypothesized that short-term intake of an E+ diet at thermoneutrality would
result in changes in hepatic gene expression that is associated with the pathogenesis of
fescue toxicosis. The microarray and real-time PCR results demonstrated that the
expression of genes belonging to several important physiological pathways, including
energy metabolism, growth and development, detoxification and antioxidant activity, as
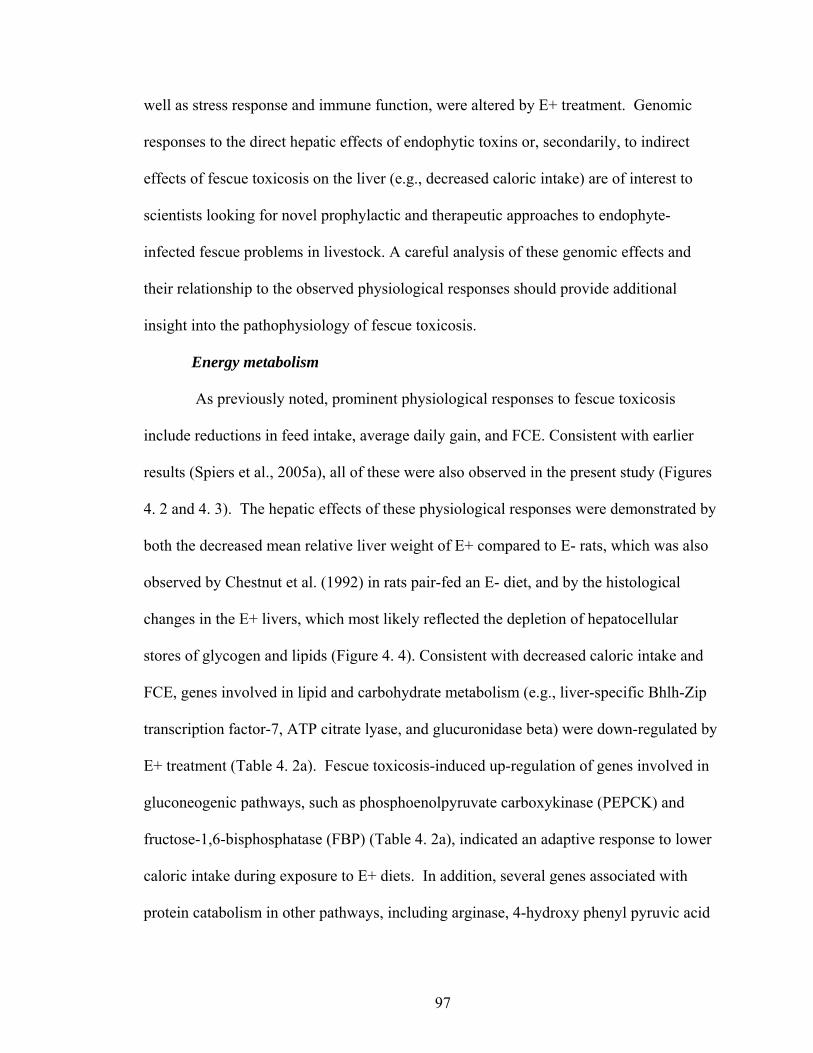
97
well as stress response and immune function, were altered by E+ treatment. Genomic
responses to the direct hepatic effects of endophytic toxins or, secondarily, to indirect
effects of fescue toxicosis on the liver (e.g., decreased caloric intake) are of interest to
scientists looking for novel prophylactic and therapeutic approaches to endophyte-
infected fescue problems in livestock. A careful analysis of these genomic effects and
their relationship to the observed physiological responses should provide additional
insight into the pathophysiology of fescue toxicosis.
Energy metabolism
As previously noted, prominent physiological responses to fescue toxicosis
include reductions in feed intake, average daily gain, and FCE. Consistent with earlier
results (Spiers et al., 2005a), all of these were also observed in the present study (Figures
4. 2 and 4. 3). The hepatic effects of these physiological responses were demonstrated by
both the decreased mean relative liver weight of E+ compared to E- rats, which was also
observed by Chestnut et al. (1992) in rats pair-fed an E- diet, and by the histological
changes in the E+ livers, which most likely reflected the depletion of hepatocellular
stores of glycogen and lipids (Figure 4. 4). Consistent with decreased caloric intake and
FCE, genes involved in lipid and carbohydrate metabolism (e.g., liver-specific Bhlh-Zip
transcription factor-7, ATP citrate lyase, and glucuronidase beta) were down-regulated by
E+ treatment (Table 4. 2a). Fescue toxicosis-induced up-regulation of genes involved in
gluconeogenic pathways, such as phosphoenolpyruvate carboxykinase (PEPCK) and
fructose-1,6-bisphosphatase (FBP) (Table 4. 2a), indicated an adaptive response to lower
caloric intake during exposure to E+ diets. In addition, several genes associated with
protein catabolism in other pathways, including arginase, 4-hydroxy phenyl pyruvic acid
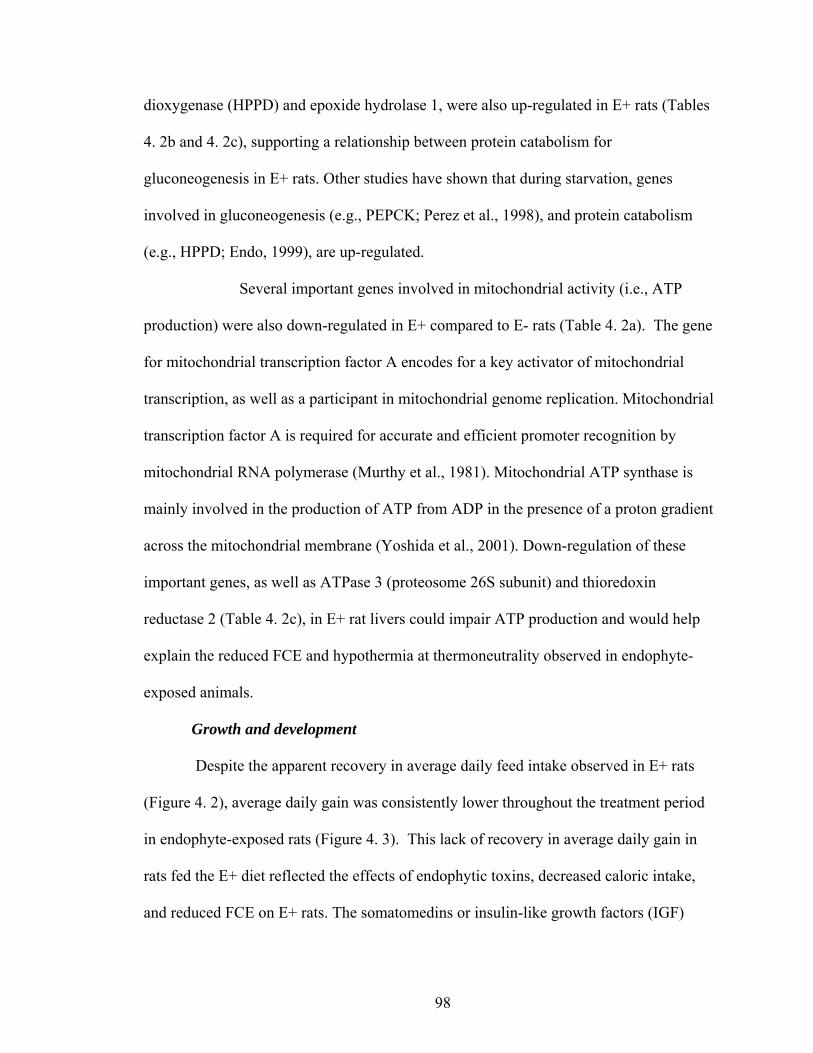
98
dioxygenase (HPPD) and epoxide hydrolase 1, were also up-regulated in E+ rats (Tables
4. 2b and 4. 2c), supporting a relationship between protein catabolism for
gluconeogenesis in E+ rats. Other studies have shown that during starvation, genes
involved in gluconeogenesis (e.g., PEPCK; Perez et al., 1998), and protein catabolism
(e.g., HPPD; Endo, 1999), are up-regulated.
Several important genes involved in mitochondrial activity (i.e., ATP
production) were also down-regulated in E+ compared to E- rats (Table 4. 2a). The gene
for mitochondrial transcription factor A encodes for a key activator of mitochondrial
transcription, as well as a participant in mitochondrial genome replication. Mitochondrial
transcription factor A is required for accurate and efficient promoter recognition by
mitochondrial RNA polymerase (Murthy et al., 1981). Mitochondrial ATP synthase is
mainly involved in the production of ATP from ADP in the presence of a proton gradient
across the mitochondrial membrane (Yoshida et al., 2001). Down-regulation of these
important genes, as well as ATPase 3 (proteosome 26S subunit) and thioredoxin
reductase 2 (Table 4. 2c), in E+ rat livers could impair ATP production and would help
explain the reduced FCE and hypothermia at thermoneutrality observed in endophyte-
exposed animals.
Growth and development
Despite the apparent recovery in average daily feed intake observed in E+ rats
(Figure 4. 2), average daily gain was consistently lower throughout the treatment period
in endophyte-exposed rats (Figure 4. 3). This lack of recovery in average daily gain in
rats fed the E+ diet reflected the effects of endophytic toxins, decreased caloric intake,
and reduced FCE on E+ rats. The somatomedins or insulin-like growth factors (IGF)
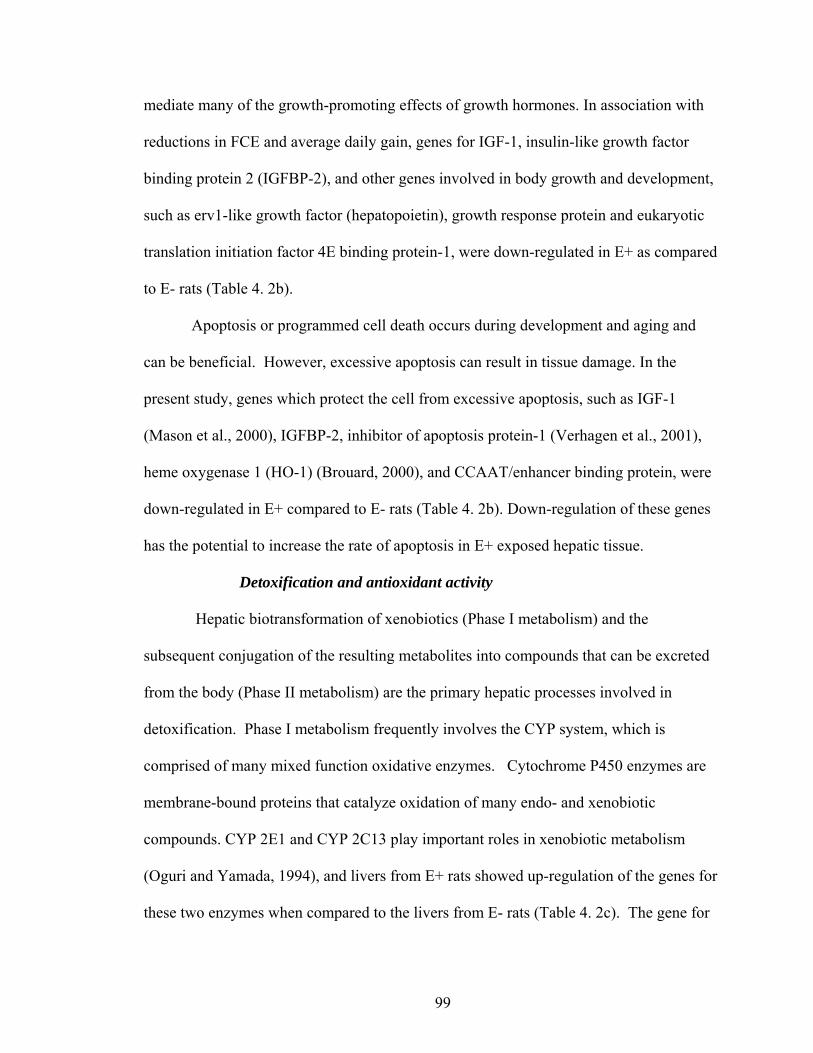
99
mediate many of the growth-promoting effects of growth hormones. In association with
reductions in FCE and average daily gain, genes for IGF-1, insulin-like growth factor
binding protein 2 (IGFBP-2), and other genes involved in body growth and development,
such as erv1-like growth factor (hepatopoietin), growth response protein and eukaryotic
translation initiation factor 4E binding protein-1, were down-regulated in E+ as compared
to E- rats (Table 4. 2b).
Apoptosis or programmed cell death occurs during development and aging and
can be beneficial. However, excessive apoptosis can result in tissue damage. In the
present study, genes which protect the cell from excessive apoptosis, such as IGF-1
(Mason et al., 2000), IGFBP-2, inhibitor of apoptosis protein-1 (Verhagen et al., 2001),
heme oxygenase 1 (HO-1) (Brouard, 2000), and CCAAT/enhancer binding protein, were
down-regulated in E+ compared to E- rats (Table 4. 2b). Down-regulation of these genes
has the potential to increase the rate of apoptosis in E+ exposed hepatic tissue.
Detoxification and antioxidant activity
Hepatic biotransformation of xenobiotics (Phase I metabolism) and the
subsequent conjugation of the resulting metabolites into compounds that can be excreted
from the body (Phase II metabolism) are the primary hepatic processes involved in
detoxification. Phase I metabolism frequently involves the CYP system, which is
comprised of many mixed function oxidative enzymes. Cytochrome P450 enzymes are
membrane-bound proteins that catalyze oxidation of many endo- and xenobiotic
compounds. CYP 2E1 and CYP 2C13 play important roles in xenobiotic metabolism
(Oguri and Yamada, 1994), and livers from E+ rats showed up-regulation of the genes for
these two enzymes when compared to the livers from E- rats (Table 4. 2c). The gene for
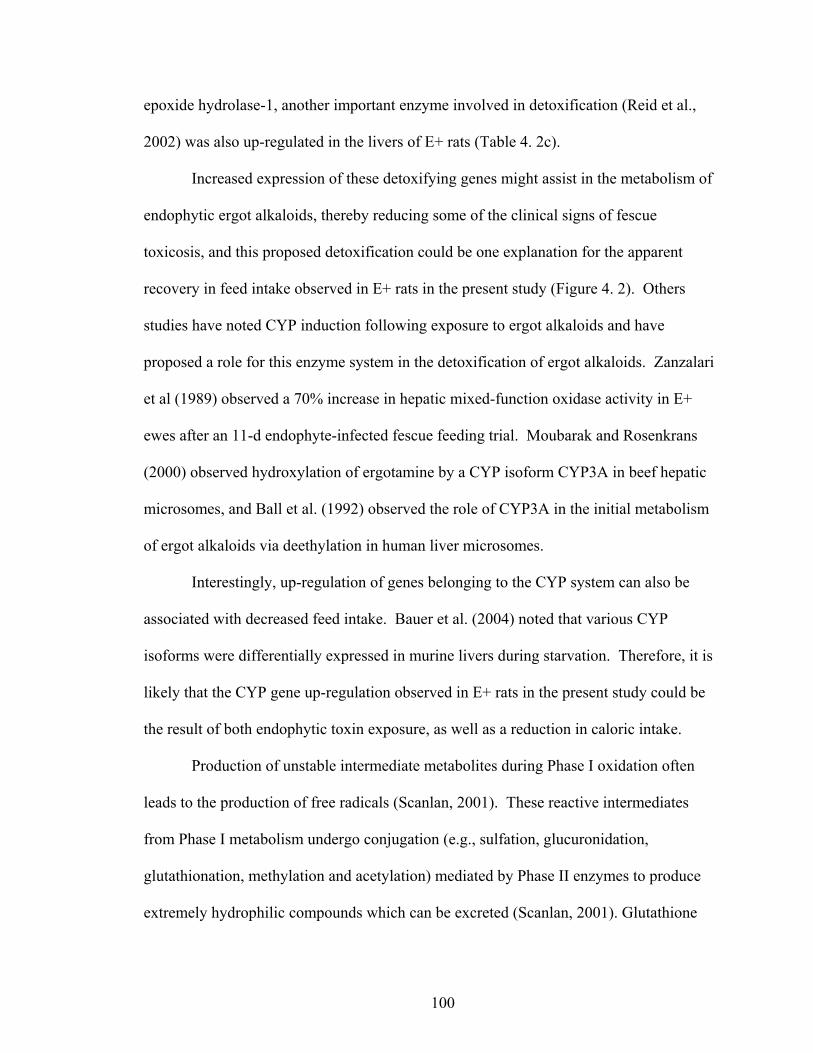
100
epoxide hydrolase-1, another important enzyme involved in detoxification (Reid et al.,
2002) was also up-regulated in the livers of E+ rats (Table 4. 2c).
Increased expression of these detoxifying genes might assist in the metabolism of
endophytic ergot alkaloids, thereby reducing some of the clinical signs of fescue
toxicosis, and this proposed detoxification could be one explanation for the apparent
recovery in feed intake observed in E+ rats in the present study (Figure 4. 2). Others
studies have noted CYP induction following exposure to ergot alkaloids and have
proposed a role for this enzyme system in the detoxification of ergot alkaloids. Zanzalari
et al (1989) observed a 70% increase in hepatic mixed-function oxidase activity in E+
ewes after an 11-d endophyte-infected fescue feeding trial. Moubarak and Rosenkrans
(2000) observed hydroxylation of ergotamine by a CYP isoform CYP3A in beef hepatic
microsomes, and Ball et al. (1992) observed the role of CYP3A in the initial metabolism
of ergot alkaloids via deethylation in human liver microsomes.
Interestingly, up-regulation of genes belonging to the CYP system can also be
associated with decreased feed intake. Bauer et al. (2004) noted that various CYP
isoforms were differentially expressed in murine livers during starvation. Therefore, it is
likely that the CYP gene up-regulation observed in E+ rats in the present study could be
the result of both endophytic toxin exposure, as well as a reduction in caloric intake.
Production of unstable intermediate metabolites during Phase I oxidation often
leads to the production of free radicals (Scanlan, 2001). These reactive intermediates
from Phase I metabolism undergo conjugation (e.g., sulfation, glucuronidation,
glutathionation, methylation and acetylation) mediated by Phase II enzymes to produce
extremely hydrophilic compounds which can be excreted (Scanlan, 2001). Glutathione
101
synthase is involved in a variety of biological functions, including protection of cells
from oxidative damage by free radicals, detoxification of xenobiotics, and membrane
transport (Grant et al., 1997). A variety of other enzymes are also involved in preventing
oxidative damage in the liver. Heme oxygenase is a microsomal enzyme that catalyzes
the oxidation of heme to the antioxidant molecules, biliverdin (Maines, 2000). Propyl 4-
hydroxylase alpha neutralizes superoxides (Aravind et al., 2001), and thioredoxin
reductase-2 reduces disulfide in oxidized thioredoxin to a redox-active disulfide.
Decrease in the disulfide reducing activity of thioredoxin reductase-2 leads to a large
increase in the NADPH oxide activity, thereby producing more free radicals (Arner et al.,
1995).
Microarray analysis in the present study showed that the genes involved in
glutathione biosynthesis and glutathione synthetase were down-regulated in E+ rat liver
(Table 4. 2c). Additional genes having antioxidant activity, such as HO-1, thioredoxin
reductase-2, propyl 4-hydroxylase alpha subunit, and peroxiredoxin-3 were also down-
regulated in E+ compared to E- rats (Table 4. 2c).
Down-regulation of the genes for antioxidants in the present study could lead to
the accumulation of free radicals within the cell and is consistent with the results of
earlier studies. Lakritz et al. (2002) observed lowered blood levels of glutathione and
feed intake during fescue toxicosis in cattle under heat stress conditions. Oliver (1997)
observed a decrease in the mean plasma antioxidant capacity in E+ steers seven times
below that of E- animals. Oliver (1997) hypothesized that the reactive oxygen species
might contribute to the inflammatory response in E+ fed animals.
102
It is unclear whether the down-regulation of genes associated with antioxidant
activity in the liver in E+ rats is a direct effect of endophytic toxins or is secondary to a
reduction in antioxidant precursors associated with decreased feed intake and FCE.
Regardless, decreased antioxidant activity in the liver of endophyte-exposed animals is a
possible mechanism for some of the clinical signs associated with fescue toxicosis. This
potential for fescue toxicosis-associated oxidative stress is enhanced if Phase I enzymatic
activity is high while the activities of Phase II enzymes and other hepatic antioxidants are
low in endophyte-exposed animals (Scanlan, 2001). Therefore, the up-regulation of genes
for Phase I enzymes and the down-regulation of genes involved in antioxidant activity in
fescue toxicosis could lead to the accumulation of free radicals within the cells due to the
impairment of cellular antioxidative mechanisms.
Stress response
Acute phase proteins are serum proteins that increase in animals under stress
conditions (Lopez-Hellin et al., 2005). Genes involved in acute phase response such as
bile acid coenzyme A, bile acid coenzyme ligase A, and coagulation factor-2 were up-
regulated in the livers of E+ rats, as compared to the livers of E- rats (Table 4. 2d). Heat
shock proteins, which are usually up-regulated in response to stress in order to protect
cellular proteins (Gonzalez and Manso, 2004), were actually down-regulated in the
present study in E+ compared to E- rats. These down-regulated heat shock protein genes
in E+ rats included small stress protein, crystalline alpha B, and serine proteinase (Table
4. 2d). Fescue toxicosis has been reported to increase rat susceptibility to various
stressors. In two separate studies, Filipov et al. (1999a, b) observed greater susceptibility
of E+ mice to subcutaneous injections of cytokines and greater susceptibility of cattle
103
grazing on E+ pastures to the effects of lipopolysacharides than their respective E-
cohorts.
Immune function
Several genes associated with immune function, such as tubulin beta-5,
scavenger receptor class B member 1, interferon beta 1, interleukin receptor accessory
protein, and tubulin tyrosine ligase were down-regulated in the livers of E+ rats compared
to the livers of E- rats (Table 4. 2e). Altered immune responses and inflammatory
changes are commonly observed in fescue toxicosis (Filipov et al., 1999). Rodents fed
E+ toxins exhibited a lowered red and white blood cell counts, reduced response to
mitogens, and increased T suppressor cell numbers in spleen compared to E- rats (Dew et
al., 1990).
Cellular integrity, transportation, and other processes
Twenty-five genes having to do with cell integrity and transportation, as well as
another 25 genes involved in other cellular processes, were differentially expressed in the
livers of rats fed E+ diets (Tables 4. 2f and 4. 2g). Of these 50 differentially expressed
genes, only seven genes involved in structural and membrane transport processes were
up-regulated. Given the relative lack of documentation of the effects of fescue toxicosis
on these pathways, it is difficult to comment at length on the possible role of these genes
in the pathogenesis of fescue toxicosis. However, future studies with pair-fed animals
will help to determine whether the differential hepatic expression of these genes is related
to the direct effects of endophytic toxins or to secondary effects on the liver associated
with the reduction in caloric intake.
104
6. CONCLUSION
The present study provides information regarding specific hepatic genes which
are differentially expressed in rats following intake of E+ diets at thermoneutrality. It has
also helped to elucidate the cellular mechanisms involved in the pathogenesis of fescue
toxicosis. Of particular interest are the pathophysiological roles of reduced caloric intake
and FCE, as well as oxidative stress, in the development of signs of fescue toxicosis. The
results of this study emphasize the importance of the inclusion of pair-fed treatment
groups in future studies to differentiate the direct hepatic effects of endophytic toxins
from the secondary effects on the liver that are associated with decreased feed intake.
Future studies should be designed to identify differentially expressed genes during
various time periods after exposure to endophyte-infected fescue and heat stress, in order
to determine specific markers to be targeted for prophylactic and/or therapeutic
interventions.
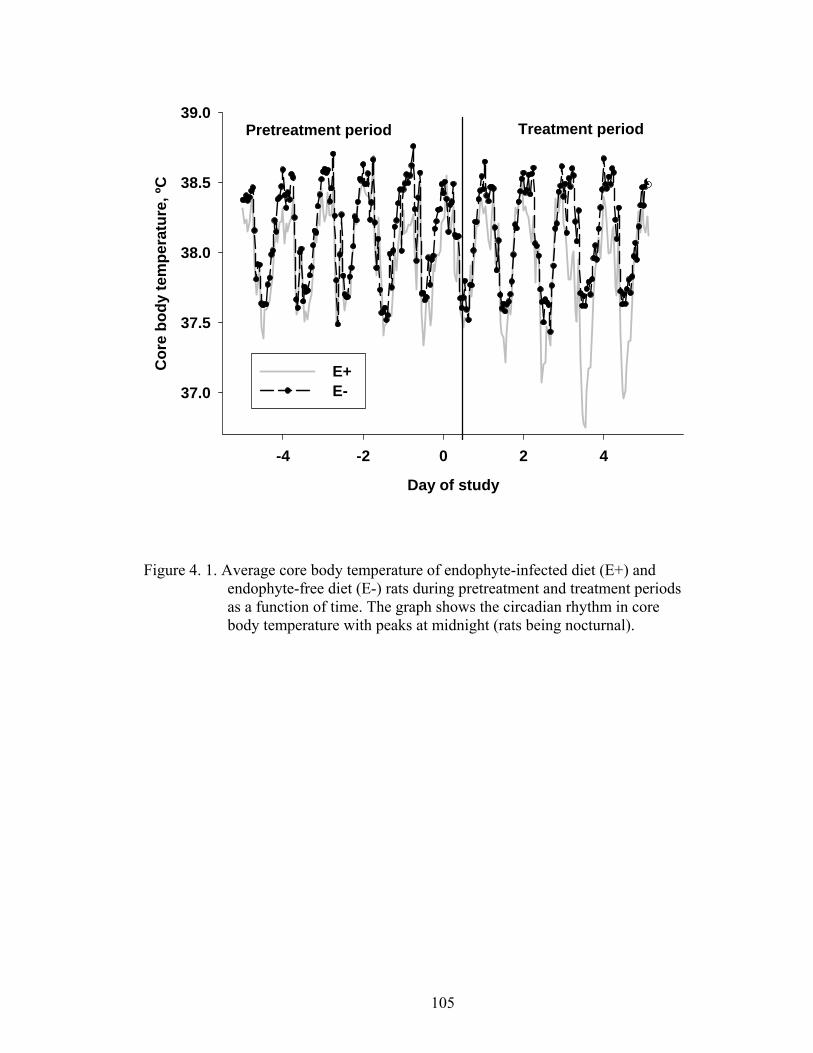
105
Day of study
-4 -2 0 2 4
Cor
e bo
dy te
mpe
ratu
re, º
C
37.0
37.5
38.0
38.5
39.0
E+ E-
Treatment periodPretreatment period
Figure 4. 1. Average core body temperature of endophyte-infected diet (E+) and
endophyte-free diet (E-) rats during pretreatment and treatment periods as a function of time. The graph shows the circadian rhythm in core body temperature with peaks at midnight (rats being nocturnal).
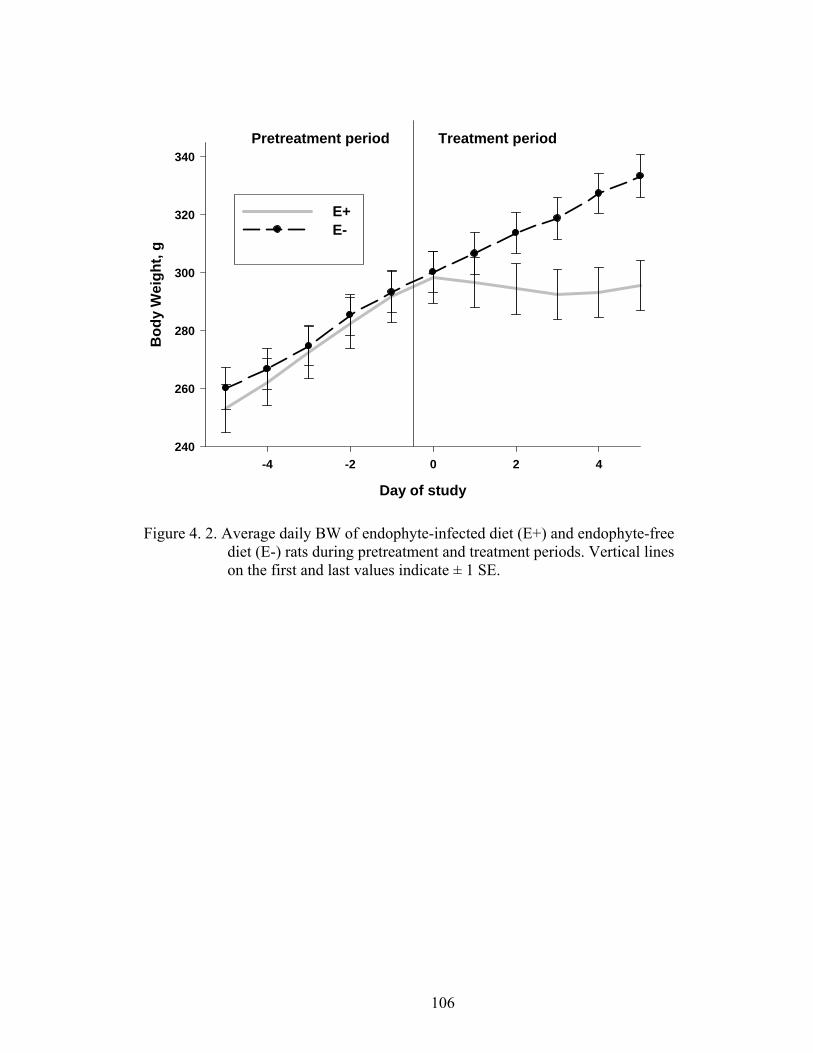
106
Day of study
-4 -2 0 2 4
Bod
y W
eigh
t, g
240
260
280
300
320
340
E+ E-
Treatment periodPretreatment period
Figure 4. 2. Average daily BW of endophyte-infected diet (E+) and endophyte-free diet (E-) rats during pretreatment and treatment periods. Vertical lines on the first and last values indicate ± 1 SE.
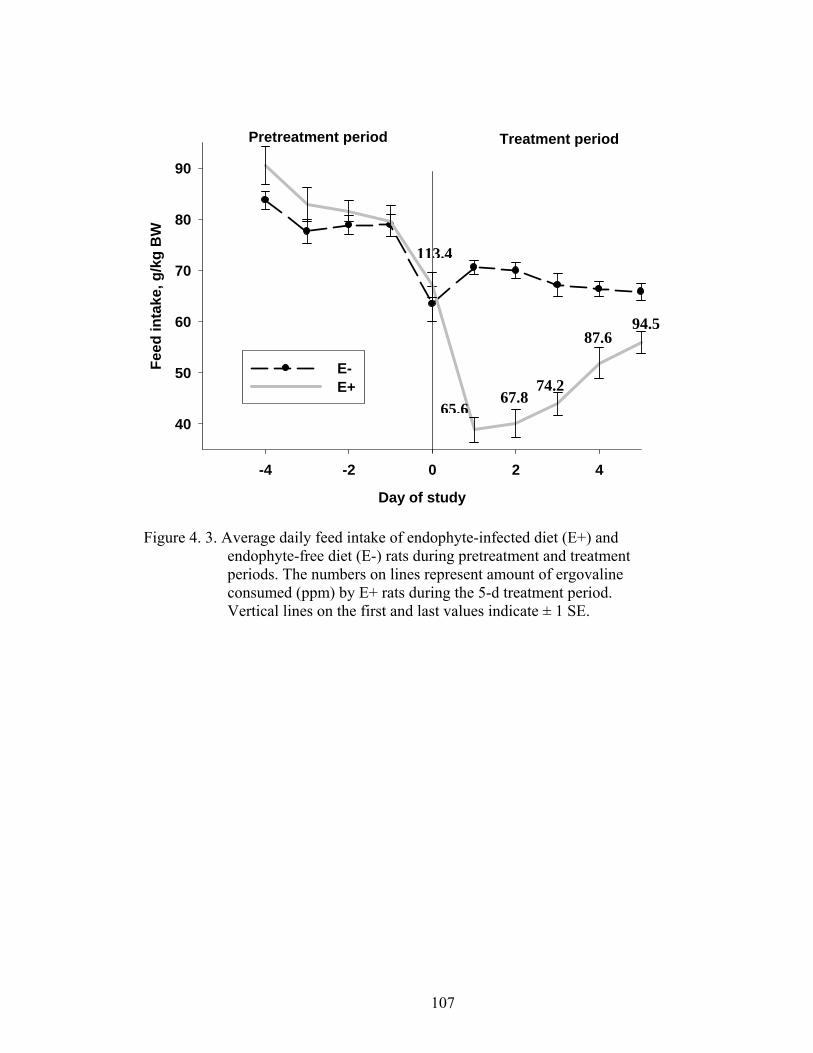
107
Day of study
-4 -2 0 2 4
Feed
inta
ke, g
/kg
BW
40
50
60
70
80
90
E-E+
Treatment periodPretreatment period
Figure 4. 3. Average daily feed intake of endophyte-infected diet (E+) and endophyte-free diet (E-) rats during pretreatment and treatment periods. The numbers on lines represent amount of ergovaline consumed (ppm) by E+ rats during the 5-d treatment period. Vertical lines on the first and last values indicate ± 1 SE.
67.8 74.2
87.6 94.5
65.6
113.4
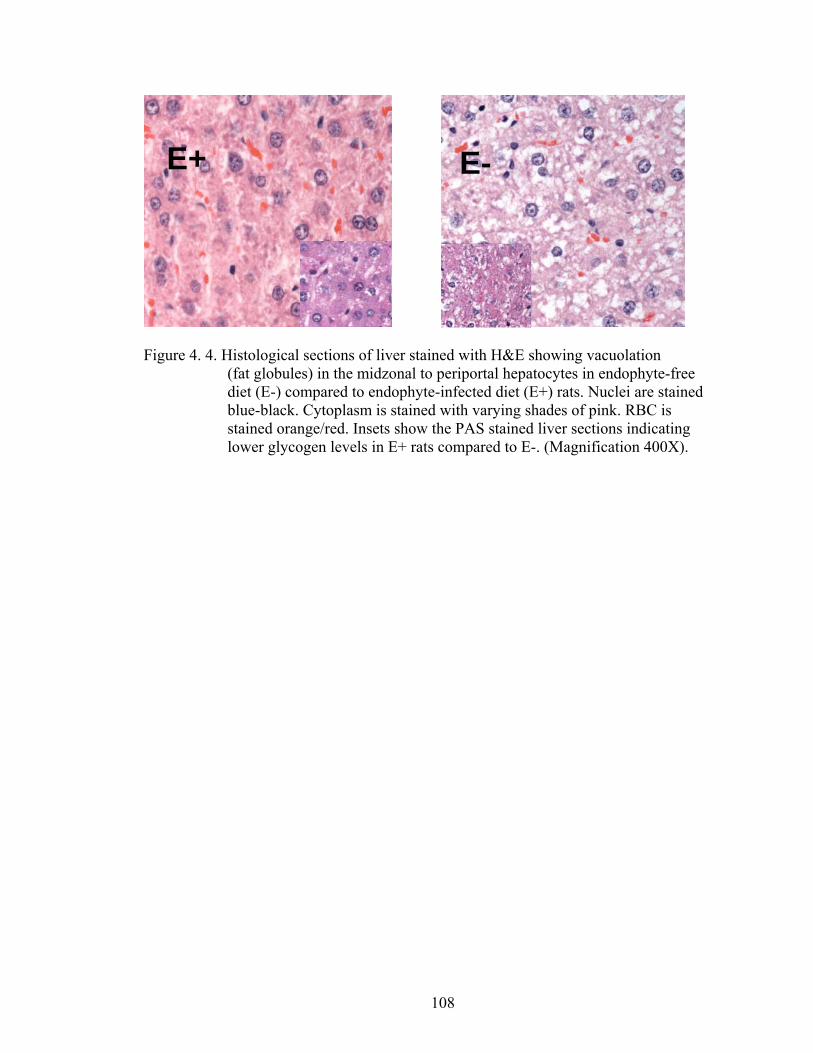
108
Figure 4. 4. Histological sections of liver stained with H&E showing vacuolation (fat globules) in the midzonal to periportal hepatocytes in endophyte-free diet (E-) compared to endophyte-infected diet (E+) rats. Nuclei are stained blue-black. Cytoplasm is stained with varying shades of pink. RBC is stained orange/red. Insets show the PAS stained liver sections indicating lower glycogen levels in E+ rats compared to E-. (Magnification 400X).
E+ E-
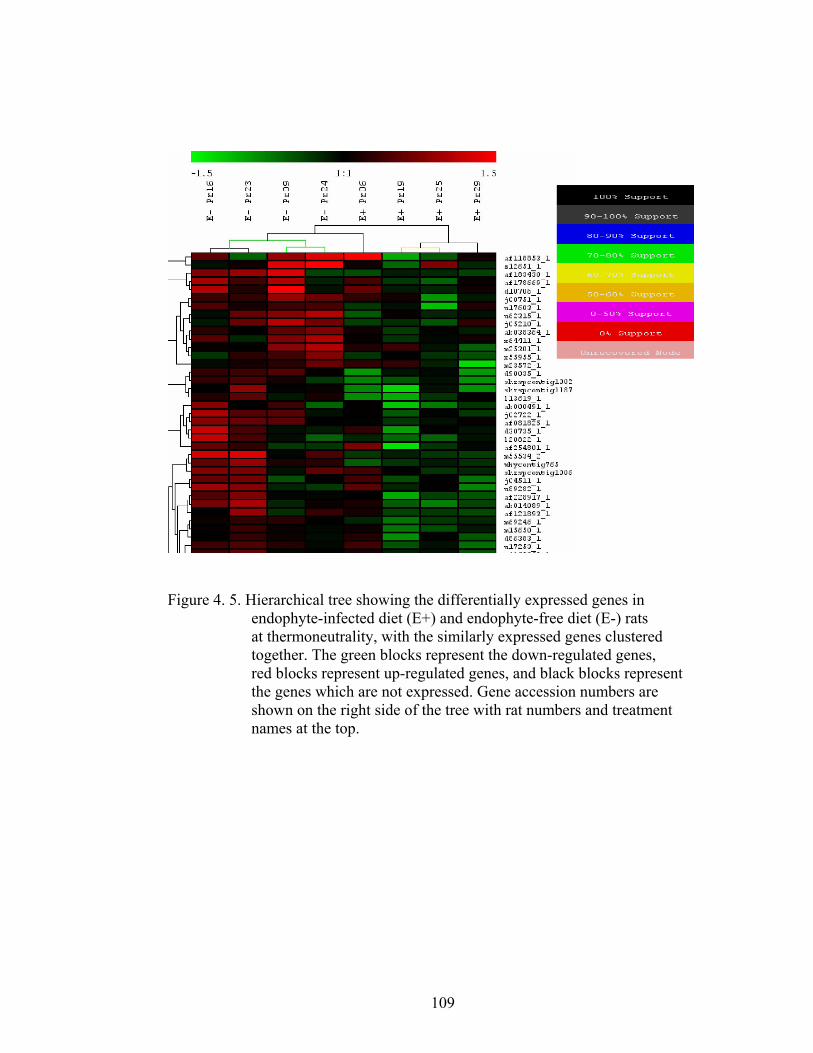
109
Figure 4. 5. Hierarchical tree showing the differentially expressed genes in
endophyte-infected diet (E+) and endophyte-free diet (E-) rats at thermoneutrality, with the similarly expressed genes clustered together. The green blocks represent the down-regulated genes, red blocks represent up-regulated genes, and black blocks represent the genes which are not expressed. Gene accession numbers are shown on the right side of the tree with rat numbers and treatment names at the top.
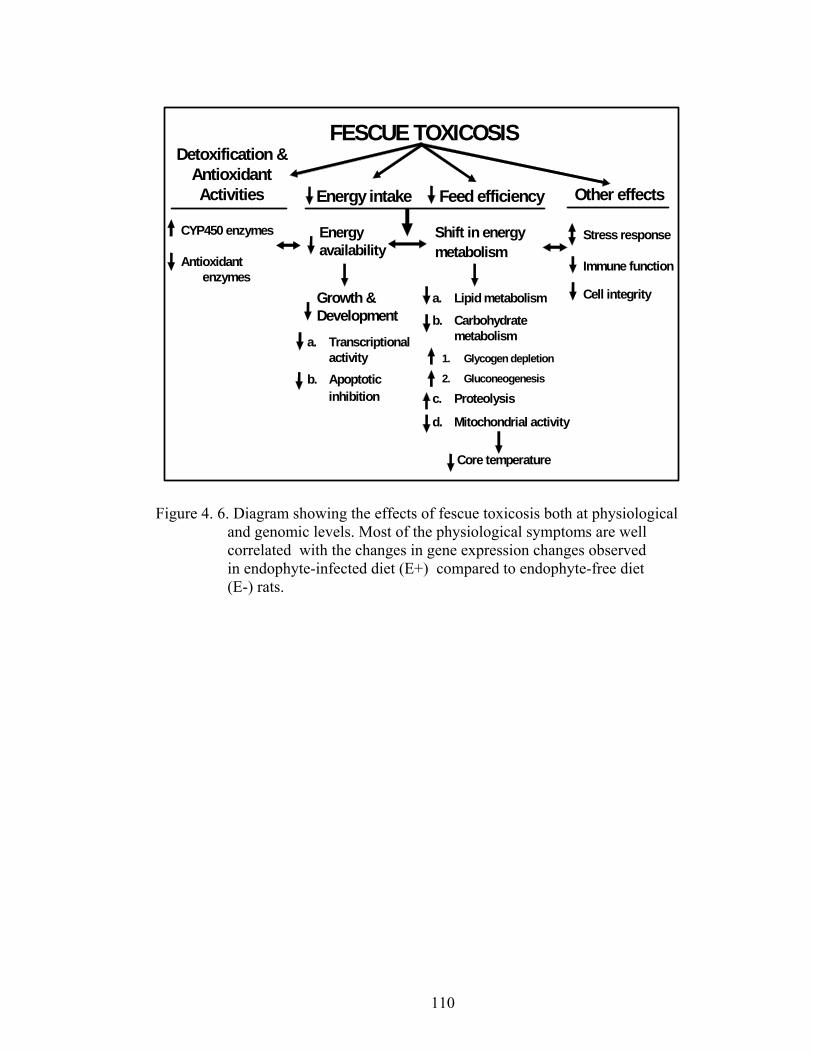
110
Other effects
CYP450 enzymes
Antioxidantenzymes
FESCUE TOXICOSIS
Energy intake Feed efficiency
Energy availability
Shift in energy metabolism
Growth &Development
a. Transcriptional activity
b. Apoptotic inhibition
Stress response
Immune function
Cell integrity
Detoxification & Antioxidant Activities
b. Carbohydrate metabolism
1. Glycogen depletion
2. Gluconeogenesis
c. Proteolysis
d. Mitochondrial activity
Core temperature
a. Lipid metabolism
Figure 4. 6. Diagram showing the effects of fescue toxicosis both at physiological and genomic levels. Most of the physiological symptoms are well correlated with the changes in gene expression changes observed in endophyte-infected diet (E+) compared to endophyte-free diet (E-) rats.
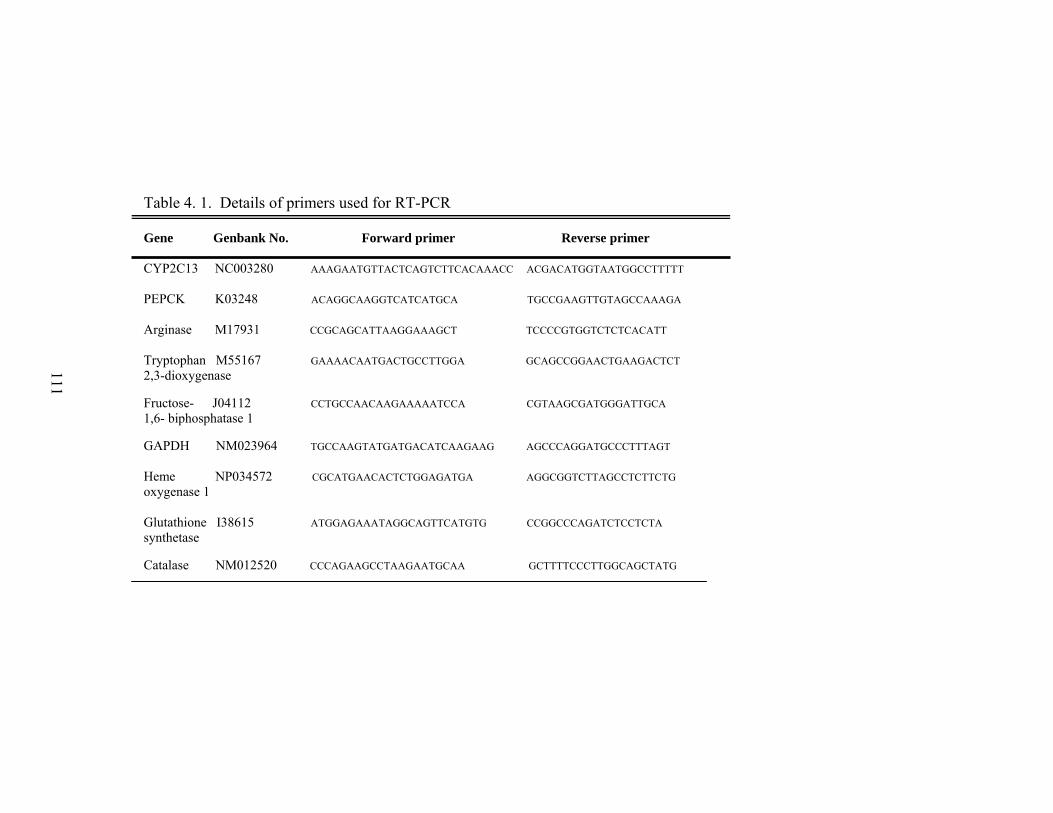
111
Table 4. 1. Details of primers used for RT-PCR
Gene Genbank No. Forward primer Reverse primer
CYP2C13 NC003280 AAAGAATGTTACTCAGTCTTCACAAACC ACGACATGGTAATGGCCTTTTT
PEPCK K03248 ACAGGCAAGGTCATCATGCA TGCCGAAGTTGTAGCCAAAGA
Arginase M17931 CCGCAGCATTAAGGAAAGCT TCCCCGTGGTCTCTCACATT
Tryptophan M55167 GAAAACAATGACTGCCTTGGA GCAGCCGGAACTGAAGACTCT 2,3-dioxygenase Fructose- J04112 CCTGCCAACAAGAAAAATCCA CGTAAGCGATGGGATTGCA 1,6- biphosphatase 1 GAPDH NM023964 TGCCAAGTATGATGACATCAAGAAG AGCCCAGGATGCCCTTTAGT
Heme NP034572 CGCATGAACACTCTGGAGATGA AGGCGGTCTTAGCCTCTTCTG oxygenase 1 Glutathione I38615 ATGGAGAAATAGGCAGTTCATGTG CCGGCCCAGATCTCCTCTA synthetase Catalase NM012520 CCCAGAAGCCTAAGAATGCAA GCTTTTCCCTTGGCAGCTATG
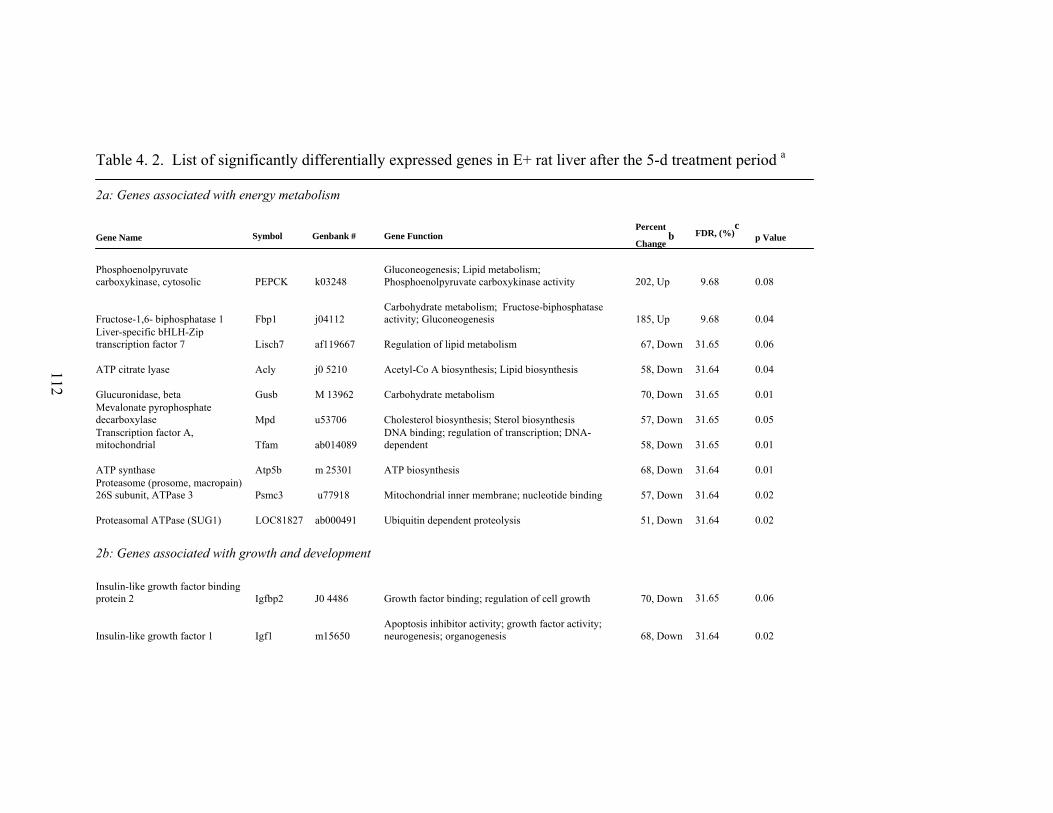
112
Table 4. 2. List of significantly differentially expressed genes in E+ rat liver after the 5-d treatment period a
2a: Genes associated with energy metabolism Gene Name Symbol Genbank # Gene Function
Percent
Change b
FDR, (%)c
p Value
Phosphoenolpyruvate carboxykinase, cytosolic PEPCK k03248
Gluconeogenesis; Lipid metabolism; Phosphoenolpyruvate carboxykinase activity 202, Up
9.68
0.08
Fructose-1,6- biphosphatase 1 Fbp1 j04112 Carbohydrate metabolism; Fructose-biphosphatase activity; Gluconeogenesis 185, Up
9.68
0.04
Liver-specific bHLH-Zip transcription factor 7 Lisch7 af119667 Regulation of lipid metabolism 67, Down
31.65
0.06
ATP citrate lyase Acly j0 5210 Acetyl-Co A biosynthesis; Lipid biosynthesis 58, Down 31.64
0.04
Glucuronidase, beta Gusb M 13962 Carbohydrate metabolism 70, Down 31.65
0.01
Mevalonate pyrophosphate decarboxylase Mpd u53706 Cholesterol biosynthesis; Sterol biosynthesis 57, Down
31.65
0.05
Transcription factor A, mitochondrial Tfam ab014089
DNA binding; regulation of transcription; DNA-dependent 58, Down
31.65
0.01
ATP synthase Atp5b m 25301 ATP biosynthesis 68, Down 31.64
0.01
Proteasome (prosome, macropain) 26S subunit, ATPase 3 Psmc3 u77918 Mitochondrial inner membrane; nucleotide binding 57, Down
31.64
0.02
Proteasomal ATPase (SUG1) LOC81827 ab000491 Ubiquitin dependent proteolysis 51, Down 31.64
0.02
2b: Genes associated with growth and development Insulin-like growth factor binding protein 2 Igfbp2 J0 4486 Growth factor binding; regulation of cell growth 70, Down
31.65
0.06
Insulin-like growth factor 1 Igf1 m15650 Apoptosis inhibitor activity; growth factor activity; neurogenesis; organogenesis 68, Down
31.64
0.02
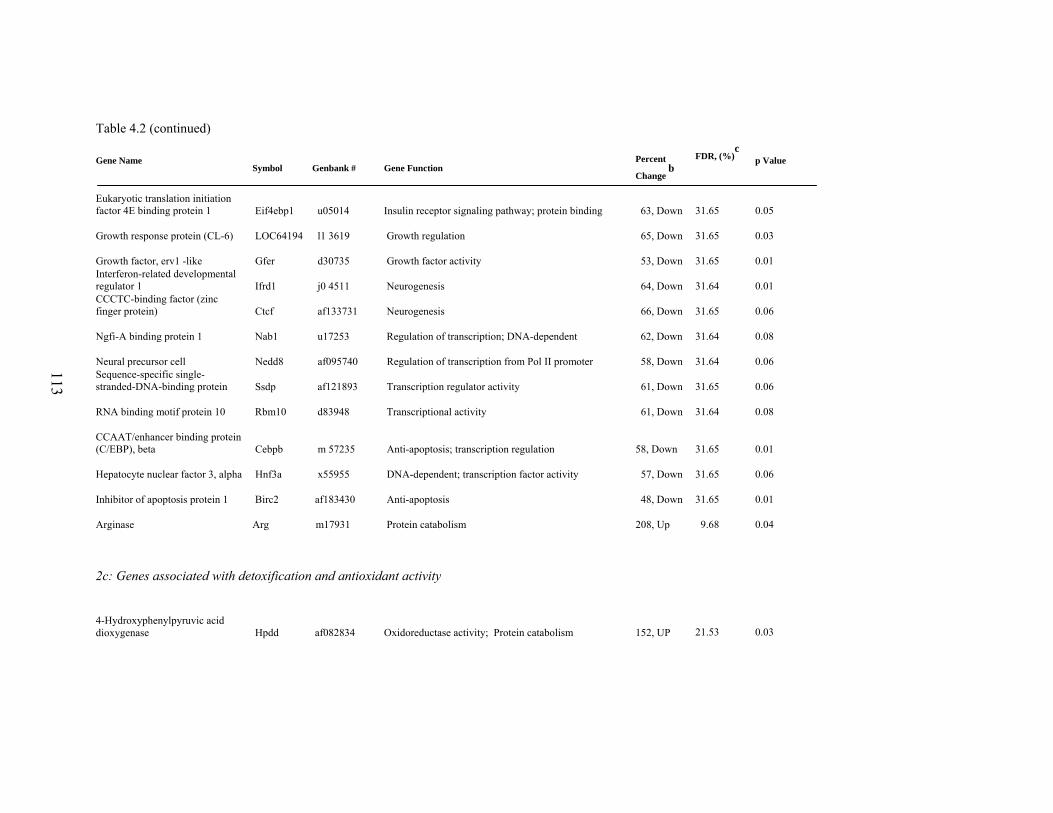
113
Table 4.2 (continued) Gene Name
Symbol Genbank # Gene Function Percent
Change b
FDR, (%)c
p Value
Eukaryotic translation initiation factor 4E binding protein 1 Eif4ebp1 u05014 Insulin receptor signaling pathway; protein binding 63, Down
31.65
0.05
Growth response protein (CL-6) LOC64194 l1 3619 Growth regulation 65, Down 31.65
0.03
Growth factor, erv1 -like Gfer d30735 Growth factor activity 53, Down 31.65
0.01
Interferon-related developmental regulator 1 Ifrd1 j0 4511 Neurogenesis 64, Down
31.64
0.01
CCCTC-binding factor (zinc finger protein) Ctcf af133731 Neurogenesis 66, Down
31.65
0.06
Ngfi-A binding protein 1 Nab1 u17253 Regulation of transcription; DNA-dependent 62, Down 31.64
0.08
Neural precursor cell Nedd8 af095740 Regulation of transcription from Pol II promoter 58, Down 31.64
0.06
Sequence-specific single-stranded-DNA-binding protein Ssdp af121893 Transcription regulator activity 61, Down
31.65
0.06
RNA binding motif protein 10 Rbm10 d83948 Transcriptional activity 61, Down 31.64
0.08
CCAAT/enhancer binding protein (C/EBP), beta Cebpb m 57235 Anti-apoptosis; transcription regulation
58, Down
31.65
0.01
Hepatocyte nuclear factor 3, alpha Hnf3a x55955 DNA-dependent; transcription factor activity 57, Down 31.65
0.06
Inhibitor of apoptosis protein 1 Birc2 af183430 Anti-apoptosis 48, Down 31.65
0.01
Arginase Arg m17931 Protein catabolism 208, Up 9.68
0.04
2c: Genes associated with detoxification and antioxidant activity 4-Hydroxyphenylpyruvic acid dioxygenase Hpdd af082834 Oxidoreductase activity; Protein catabolism 152, UP
21.53
0.03
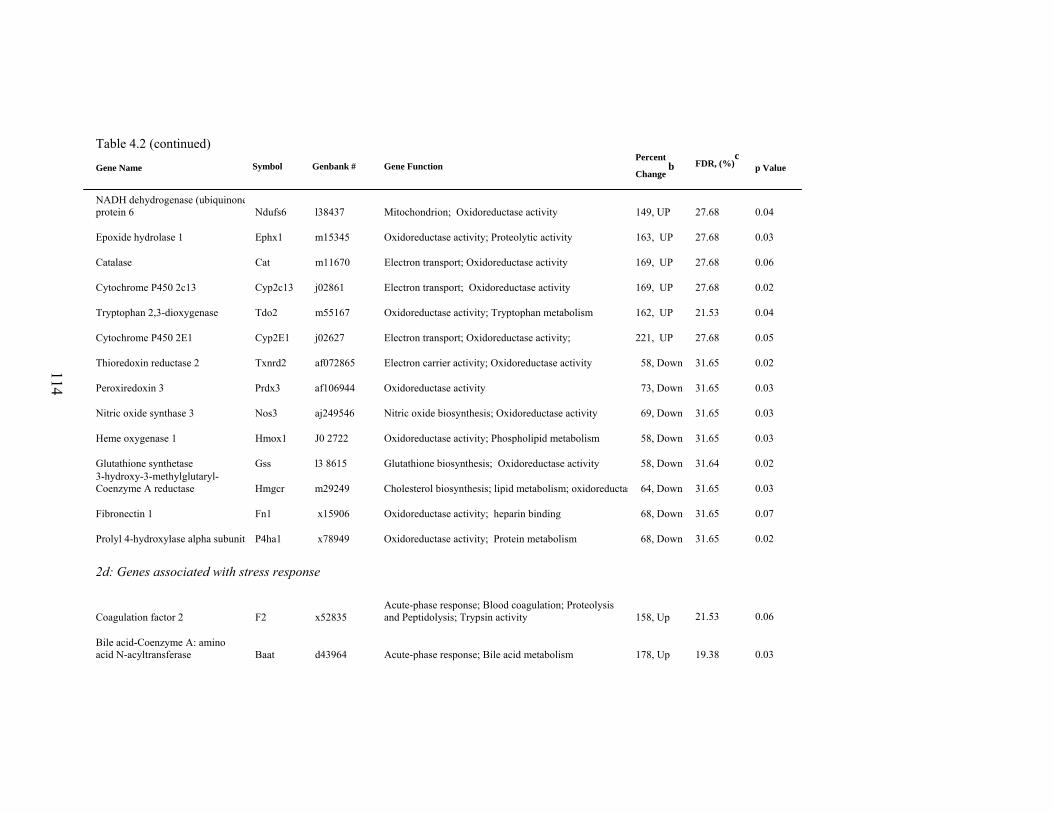
114
Table 4.2 (continued) Gene Name Symbol Genbank # Gene Function
Percent
Change b
FDR, (%)c
p Value
NADH dehydrogenase (ubiquinoneprotein 6 Ndufs6 l38437 Mitochondrion; Oxidoreductase activity 149, UP
27.68
0.04
Epoxide hydrolase 1 Ephx1 m15345 Oxidoreductase activity; Proteolytic activity 163, UP 27.68
0.03
Catalase Cat m11670 Electron transport; Oxidoreductase activity 169, UP 27.68
0.06
Cytochrome P450 2c13 Cyp2c13 j02861 Electron transport; Oxidoreductase activity 169, UP 27.68
0.02
Tryptophan 2,3-dioxygenase Tdo2 m55167 Oxidoreductase activity; Tryptophan metabolism 162, UP 21.53
0.04
Cytochrome P450 2E1 Cyp2E1 j02627 Electron transport; Oxidoreductase activity; 221, UP 27.68
0.05
Thioredoxin reductase 2 Txnrd2 af072865 Electron carrier activity; Oxidoreductase activity 58, Down 31.65
0.02
Peroxiredoxin 3 Prdx3 af106944 Oxidoreductase activity 73, Down 31.65
0.03
Nitric oxide synthase 3 Nos3 aj249546 Nitric oxide biosynthesis; Oxidoreductase activity 69, Down 31.65
0.03
Heme oxygenase 1 Hmox1 J0 2722 Oxidoreductase activity; Phospholipid metabolism 58, Down 31.65
0.03
Glutathione synthetase Gss l3 8615 Glutathione biosynthesis; Oxidoreductase activity 58, Down 31.64
0.02
3-hydroxy-3-methylglutaryl- Coenzyme A reductase Hmgcr m29249 Cholesterol biosynthesis; lipid metabolism; oxidoreductas 64, Down
31.65
0.03
Fibronectin 1 Fn1 x15906 Oxidoreductase activity; heparin binding 68, Down 31.65
0.07
Prolyl 4-hydroxylase alpha subunit P4ha1 x78949 Oxidoreductase activity; Protein metabolism 68, Down 31.65
0.02
2d: Genes associated with stress response
Coagulation factor 2 F2 x52835 Acute-phase response; Blood coagulation; Proteolysis and Peptidolysis; Trypsin activity 158, Up
21.53
0.06
Bile acid-Coenzyme A: amino acid N-acyltransferase Baat d43964 Acute-phase response; Bile acid metabolism 178, Up
19.38
0.03
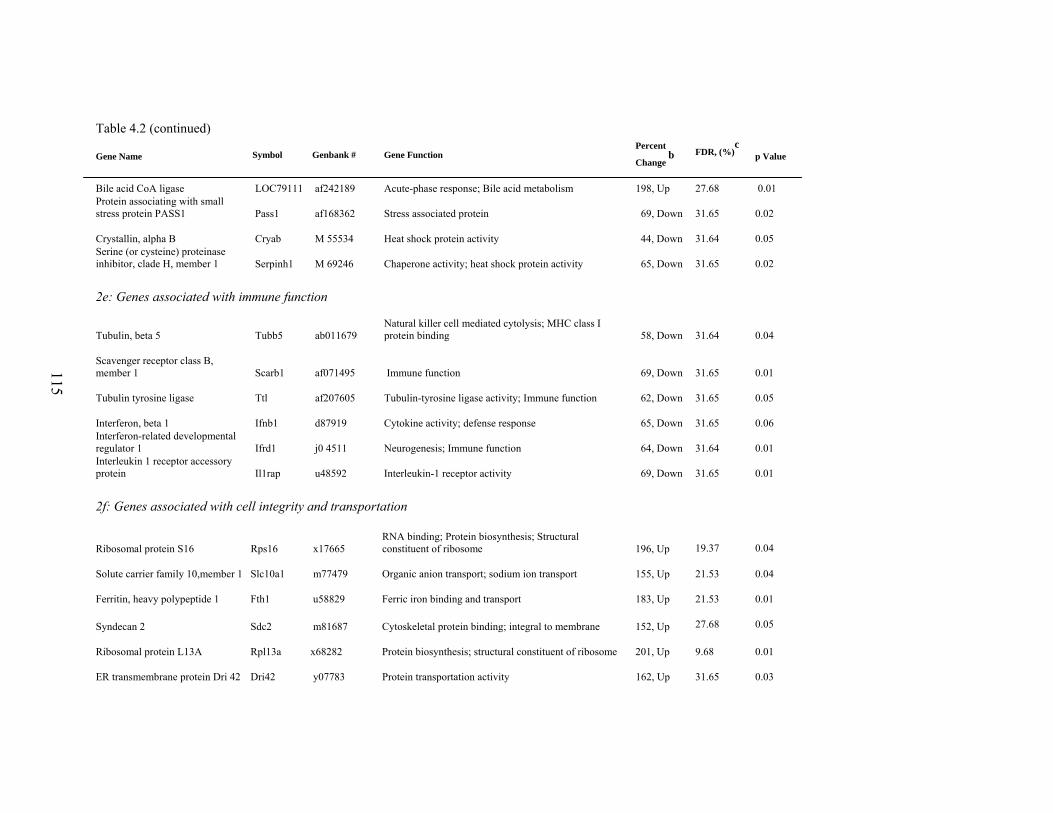
115
Table 4.2 (continued) Gene Name Symbol Genbank # Gene Function
Percent
Change b
FDR, (%)c
p Value
Bile acid CoA ligase LOC79111 af242189 Acute-phase response; Bile acid metabolism 198, Up 27.68
0.01
Protein associating with small stress protein PASS1 Pass1 af168362 Stress associated protein 69, Down
31.65
0.02
Crystallin, alpha B Cryab M 55534 Heat shock protein activity 44, Down 31.64
0.05
Serine (or cysteine) proteinase inhibitor, clade H, member 1 Serpinh1 M 69246 Chaperone activity; heat shock protein activity 65, Down
31.65
0.02
2e: Genes associated with immune function
Tubulin, beta 5 Tubb5 ab011679 Natural killer cell mediated cytolysis; MHC class I protein binding 58, Down
31.64
0.04
Scavenger receptor class B, member 1 Scarb1 af071495 Immune function 69, Down
31.65
0.01
Tubulin tyrosine ligase Ttl af207605 Tubulin-tyrosine ligase activity; Immune function 62, Down 31.65
0.05
Interferon, beta 1 Ifnb1 d87919 Cytokine activity; defense response 65, Down 31.65
0.06
Interferon-related developmental regulator 1 Ifrd1 j0 4511 Neurogenesis; Immune function 64, Down
31.64
0.01
Interleukin 1 receptor accessory protein Il1rap u48592 Interleukin-1 receptor activity 69, Down
31.65
0.01
2f: Genes associated with cell integrity and transportation
Ribosomal protein S16 Rps16 x17665 RNA binding; Protein biosynthesis; Structural constituent of ribosome 196, Up
19.37
0.04
Solute carrier family 10,member 1 Slc10a1 m77479 Organic anion transport; sodium ion transport 155, Up 21.53
0.04
Ferritin, heavy polypeptide 1 Fth1 u58829 Ferric iron binding and transport 183, Up 21.53
0.01
Syndecan 2 Sdc2 m81687 Cytoskeletal protein binding; integral to membrane 152, Up 27.68
0.05
Ribosomal protein L13A Rpl13a x68282 Protein biosynthesis; structural constituent of ribosome 201, Up 9.68
0.01
ER transmembrane protein Dri 42 Dri42 y07783 Protein transportation activity 162, Up 31.65
0.03
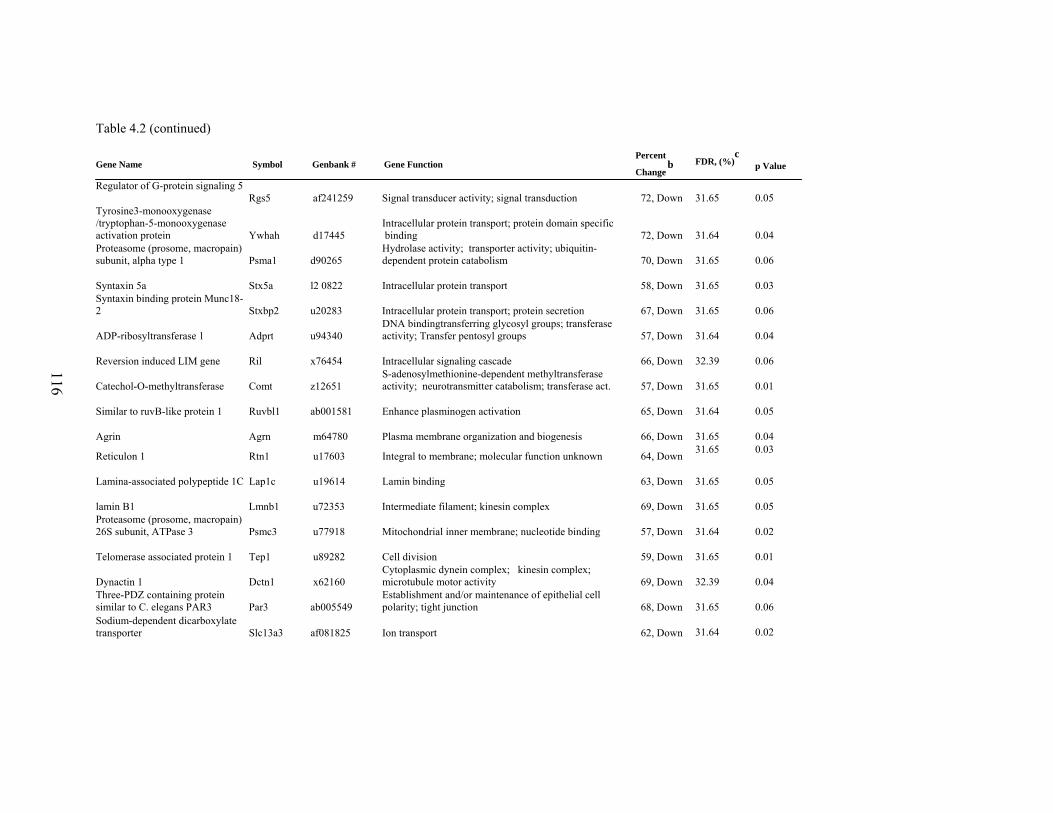
116
Table 4.2 (continued)
Gene Name Symbol Genbank # Gene Function Percent
Change b FDR, (%)
c
p Value
Regulator of G-protein signaling 5 Rgs5 af241259 Signal transducer activity; signal transduction 72, Down
31.65
0.05
Tyrosine3-monooxygenase /tryptophan-5-monooxygenase activation protein Ywhah d17445
Intracellular protein transport; protein domain specific binding 72, Down
31.64
0.04
Proteasome (prosome, macropain) subunit, alpha type 1 Psma1 d90265
Hydrolase activity; transporter activity; ubiquitin- dependent protein catabolism 70, Down
31.65
0.06
Syntaxin 5a Stx5a l2 0822 Intracellular protein transport 58, Down 31.65
0.03
Syntaxin binding protein Munc18-2 Stxbp2 u20283 Intracellular protein transport; protein secretion 67, Down
31.65
0.06
ADP-ribosyltransferase 1 Adprt u94340 DNA bindingtransferring glycosyl groups; transferase activity; Transfer pentosyl groups 57, Down
31.64
0.04
Reversion induced LIM gene Ril x76454 Intracellular signaling cascade 66, Down 32.39
0.06
Catechol-O-methyltransferase Comt z12651 S-adenosylmethionine-dependent methyltransferase activity; neurotransmitter catabolism; transferase act. 57, Down
31.65
0.01
Similar to ruvB-like protein 1 Ruvbl1 ab001581 Enhance plasminogen activation 65, Down 31.64
0.05
Agrin Agrn m64780 Plasma membrane organization and biogenesis 66, Down 31.65
0.04
Reticulon 1 Rtn1 u17603 Integral to membrane; molecular function unknown 64, Down 31.65 0.03
Lamina-associated polypeptide 1C Lap1c u19614 Lamin binding 63, Down
31.65
0.05
lamin B1 Lmnb1 u72353 Intermediate filament; kinesin complex 69, Down 31.65
0.05
Proteasome (prosome, macropain) 26S subunit, ATPase 3 Psmc3 u77918 Mitochondrial inner membrane; nucleotide binding 57, Down
31.64
0.02
Telomerase associated protein 1 Tep1 u89282 Cell division 59, Down 31.65
0.01
Dynactin 1 Dctn1 x62160 Cytoplasmic dynein complex; kinesin complex; microtubule motor activity 69, Down
32.39
0.04
Three-PDZ containing protein similar to C. elegans PAR3 Par3 ab005549
Establishment and/or maintenance of epithelial cell polarity; tight junction 68, Down
31.65
0.06
Sodium-dependent dicarboxylate transporter Slc13a3 af081825 Ion transport 62, Down
31.64
0.02
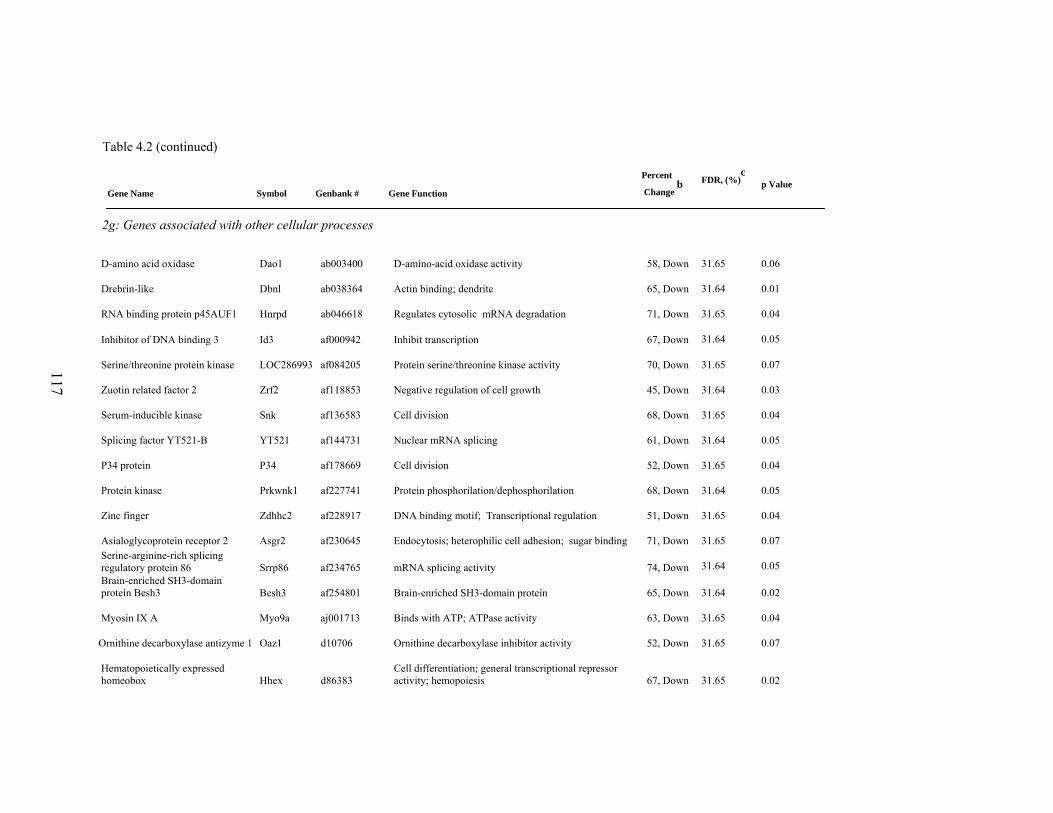
117
Table 4.2 (continued)
Gene Name Symbol Genbank # Gene Function
Percent
Change b
FDR, (%)c
p Value
2g: Genes associated with other cellular processes
D-amino acid oxidase Dao1 ab003400 D-amino-acid oxidase activity 58, Down 31.65
0.06
Drebrin-like Dbnl ab038364 Actin binding; dendrite 65, Down 31.64
0.01
RNA binding protein p45AUF1 Hnrpd ab046618 Regulates cytosolic mRNA degradation 71, Down 31.65
0.04
Inhibitor of DNA binding 3 Id3 af000942 Inhibit transcription 67, Down 31.64
0.05
Serine/threonine protein kinase LOC286993 af084205 Protein serine/threonine kinase activity 70, Down 31.65
0.07
Zuotin related factor 2 Zrf2 af118853 Negative regulation of cell growth 45, Down 31.64
0.03
Serum-inducible kinase Snk af136583 Cell division 68, Down 31.65
0.04
Splicing factor YT521-B YT521 af144731 Nuclear mRNA splicing 61, Down 31.64
0.05
P34 protein P34 af178669 Cell division 52, Down 31.65
0.04
Protein kinase Prkwnk1 af227741 Protein phosphorilation/dephosphorilation 68, Down 31.64
0.05
Zinc finger Zdhhc2 af228917 DNA binding motif; Transcriptional regulation 51, Down 31.65
0.04
Asialoglycoprotein receptor 2 Asgr2 af230645 Endocytosis; heterophilic cell adhesion; sugar binding 71, Down 31.65
0.07
Serine-arginine-rich splicing regulatory protein 86 Srrp86 af234765 mRNA splicing activity 74, Down
31.64
0.05
Brain-enriched SH3-domain protein Besh3 Besh3 af254801 Brain-enriched SH3-domain protein 65, Down
31.64
0.02
Myosin IX A Myo9a aj001713 Binds with ATP; ATPase activity 63, Down 31.65
0.04
Ornithine decarboxylase antizyme 1 Oaz1 d10706 Ornithine decarboxylase inhibitor activity 52, Down 31.65
0.07
Hematopoietically expressed homeobox Hhex d86383
Cell differentiation; general transcriptional repressor activity; hemopoiesis 67, Down
31.65
0.02
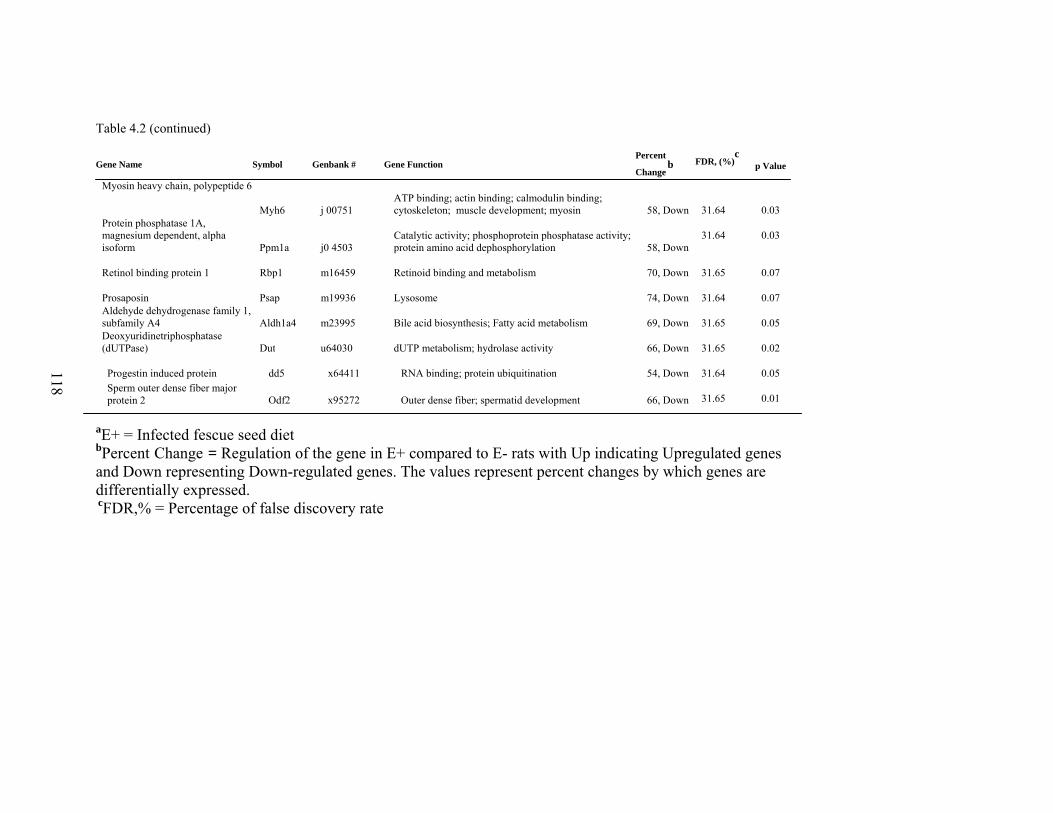
118
Table 4.2 (continued)
Gene Name Symbol Genbank # Gene Function Percent
Change b FDR, (%)
c
p Value
Myosin heavy chain, polypeptide 6
Myh6 j 00751 ATP binding; actin binding; calmodulin binding; cytoskeleton; muscle development; myosin 58, Down
31.64
0.03
Protein phosphatase 1A, magnesium dependent, alpha isoform Ppm1a j0 4503
Catalytic activity; phosphoprotein phosphatase activity; protein amino acid dephosphorylation 58, Down
31.64
0.03
Retinol binding protein 1 Rbp1 m16459 Retinoid binding and metabolism 70, Down 31.65
0.07
Prosaposin Psap m19936 Lysosome 74, Down 31.64
0.07
Aldehyde dehydrogenase family 1, subfamily A4 Aldh1a4 m23995 Bile acid biosynthesis; Fatty acid metabolism
69, Down
31.65
0.05
Deoxyuridinetriphosphatase (dUTPase) Dut u64030 dUTP metabolism; hydrolase activity 66, Down
31.65
0.02
Progestin induced protein dd5 x64411 RNA binding; protein ubiquitination 54, Down 31.64
0.05
Sperm outer dense fiber major protein 2 Odf2 x95272 Outer dense fiber; spermatid development 66, Down
31.65
0.01
aE+ = Infected fescue seed diet bPercent Change = Regulation of the gene in E+ compared to E- rats with Up indicating Upregulated genes and Down representing Down-regulated genes. The values represent percent changes by which genes are differentially expressed. cFDR,% = Percentage of false discovery rate
119
CHAPTER V
EFFECT OF ERGOT ALKALOIDS ASSOCIATED WITH FESCUE
TOXICOSIS ON HEPATIC CYTOCHROME P450 AND
ANTIOXIDANT PROTEINS
1. ABSTRACT
Intake of ergot alkaloids found in endophyte-infected tall fescue grass is
associated with decreased feed intake, and reduction in body weight (BW) gain. The liver
is one of the target organs of fescue toxicosis with up-regulation of genes involved in
xenobiotic metabolism and down-regulation of genes associated with antioxidant
pathways. It was hypothesized that short-term exposure of rats to ergot alkaloids would
change hepatic cytochrome P450 (CYP) and antioxidant expression, as well as reduce
antioxidant enzyme activity and hepatocellular proliferation rates. Hepatic gene
expression of various CYPs, selected nuclear receptors associated with the CYP
induction, and antioxidant enzymes were measured using real-time PCR. Hepatic
expression of CYP, antioxidant and proliferating cell nuclear antigen (PCNA) proteins
were measured using western blots. The CYP3A1 protein expression was evaluated using
primary rat hepatocellular cultures treated with ergovaline, one of the major ergot
120
alkaloids produced by fescue endophyte, in order to assess the direct role of ergot
alkaloids on CYP induction. The enzyme activities of selected antioxidants were assayed
spectrophotometrically. While hepatic CYP and nuclear receptor expression were
increased in ergot alkaloid-exposed rats, the expression and activity of antioxidant
enzymes were reduced. This could potentially lead to increased oxidative stress, which
might be responsible for the decrease in hepatocellular proliferation after ergot alkaloid
exposure. This study demonstrated that even short-term exposure to ergot alkaloids can
potentially induce hepatic oxidative stress which can contribute to the pathogenesis of
fescue toxicosis.
2. INTRODUCTION
Exposure to ergot alkaloids in endophyte (Neotyphodium coenophialum)-infected
tall fescue [Lolium arundinaceum (Schreb.) Darbysh., formerly Festuca arundinacea
(Schreb.)] is associated with various pathophysiological problems in both ruminant and
nonruminant animals which are collectively referred to as fescue toxicosis (Schoning et
al., 2001, Settivari et al., 2006). Over half of the tall fescue in the United States is
infected with endophyte, resulting in more than $600 million in losses per year to the beef
cattle industry (Hoveland, 1993). The clinical signs of fescue toxicosis include decreased
feed intake, body weight (BW) gain, conception rate, milk production, and offspring
survival, as well as increased abortion rate, placenta size, peripheral vasoconstriction,
rough hair coat, salivation, and hyperthermia during heat stress (Cross et al., 1995;
Strickland et al., 1993). However, there are significant data gaps regarding the underlying
121
cellular and metabolic aberrations associated with exposure to ergot alkaloids which limit
the development of pharmacological strategies to reduce these problems (Settivari et al.,
2006).
Xenobiotic-metabolizing enzymes play a central role in the metabolism,
elimination and detoxification of drugs and foreign compounds introduced into the body
(Xu and Kong, 2006). These enzymes are present in abundance at either a basal
unstimulated level and/or are inducible after exposure to xenobiotics (Xu and Kong,
2006). Cytochrome P450 (CYP) enzymes are associated with several biological
interactions involving hydroxylation, epoxidation, dehydrogenation, and nitrogen
dealkylation, and oxidative deamination (Bhaskarannair et al., 2006). Although CYP-
mediated reactions are essential for xenobiotic detoxification, they can also generate
reactive oxygen species (ROS) (Bhaskarannair et al., 2006). All aerobic cells contain a
battery of defenses to prevent cellular oxidative damage associated with ROS and/or
active metabolites generated by CYPs, especially when there are low cellular
concentrations of antioxidant enzymes (Tiedge et al., 1998).
While most of the tissues and organs in the body are well equipped with CYPs
and antioxidant enzymes (Xu and Kong, 2006), the liver is the most important organ for
xenobiotic metabolism and detoxification and has been identified as one of the target
organs of fescue toxicosis in cattle (Oliver, 1997; 2005). Piper et al. (1991) noted that
liver-specific enzymes increased in animals following long-term exposure to endophyte-
infected fescue, and a component of the fescue toxicosis response in rats is a decrease in
liver weight (Settivari et al., 2006).
122
Although not completely understood, interactions have previously been reported
between ergot alkaloids and CYPs (Moubarak et al., 2000; 2003b), as well as
antioxidants (Lakritz et al., 2002); and differentially-expressed genes in the livers of rats
fed ergot alkaloids include up-regulation of those involved in xenobiotic metabolism and
down-regulation of genes associated with antioxidant pathways (Settivari et al., 2006).
The primary objective of this study was to determine the overall impact of ergot alkaloids
on hepatic CYP and antioxidant proteins and to demonstrate hepatocellular damage
induced by those effects. In addition, CYP3A1 protein expression was evaluated in
primary hepatocellular cultures treated with ergovaline (EV), one of the major ergot
alkaloids produced by fescue endophyte (Garner et al., 1993), in order to assess the direct
effect on CYP induction. It was hypothesized that short-term intake of ergot alkaloids by
rats kept at thermoneutrality would change hepatic CYP and antioxidant expression, as
well as reduce antioxidant enzyme activity and hepatocellular proliferation rates.
3. MATERIALS AND METHODS
Animals and treatment diets
Sprague-Dawley male rats (n = 12 per treatment group; 42 days of age; 185 to
215 g BW; Charles River Laboratories, Willington, MA), were maintained at 21°C
ambient temperature and 50 ± 5% relative humidity as previously reported (Spiers et al.,
2005a). Throughout the study, feed and water were provided ad libitum. Composition of
control and treatment diets were as previously described, with the ergot alkaloid-
containing diet (E+) adjusted to provide a specific amount (91.5 μg/kg BW/day) of EV,
123
which is known to produce clinical signs of fescue toxicosis in rats (Spiers et al., 2005a).
The E+ diet contained 4,100 ppb of EV, whereas the control (E-) contained a
concentration of 22 ppb on dry matter basis as measured by HPLC (Rottinghaus et al.,
1993). All procedures on animals followed guidelines for humane treatment set by the
University of Missouri Animal Care and Use Committee.
Treatment period and sample collection
The treatment schedule consisted of an eight-day recovery period after surgery to
implant telemetric transmitters ip, followed by a five-day pretreatment period and five
days of exposure to either E+ or E- diets. After the five days of exposure, rats were
euthanized using ketamine (87 mg/ml) and xylazine (13 mg/ml) at 0.1 mg/100 gm BW,
administered im, followed by blood collection via intracardiac puncture. As reported
previously (Settivari et al., 2006), selected visceral organs (i.e., liver, adrenal, kidney,
heart, and testes) were collected from each animal following euthanasia and weighed. A
transverse section from the middle lobe of the liver (approximately 5 g) was fixed in 10%
neutral buffered formalin for histological examination. Another portion (approximately 5
g) was placed in RNase-free Eppendorf tubes (Eppendorf Biopur, Westbury, NY) and
snap-frozen in liquid nitrogen for real-time PCR (RT-PCR).
RNA extraction and cDNA conversion
Total RNA was extracted from liver samples using RNeasy Midi Kit (Qiagen Inc.,
Valencia, CA) and purified using rDNase–1 (Ambion Inc., Austin, TX). The rDNase-1
enzyme in the RNA sample was inactivated using heat (70˚C) and a phenol, chloroform,
isoamyl alcohol solution (25:24:1). Purified total RNA was concentrated using Microcon
filters (Amicon Bioseparations, Bedford, MA), following manufacturer’s instructions.
124
The RNA concentrations were measured using a ND–1000 spectrophotometer (Nanodrop
Technology, Wilmington, DE). Concentrated total RNA (15 µg) from rats fed E+ or E-
diet was reverse – transcribed to cDNA using oligo dT (IDT DNA, Coralville, IA),
random hexamers (IDT DNA, Coralville, IA) and reverse transcriptase (Stratagene, La
Jolla, CA). The cDNA obtained, was purified using Microcon YM30 filters (Millipore
Corp., Bedford, MA).
Quantitative RT - PCR
Quantitative RT – PCR assays were performed to measure the relative hepatic
expression of mRNA representing various CYP isoforms, selected nuclear receptors
associated with the CYP induction, and antioxidant enzymes. The coding sequence and
chromosome contiguous sequence for each gene were acquired through the NCBI public
database (www.ncbi.nlm.nih.gov) and the exon-exon junctions were determined using
BLAT Search Genome (Kent, 2002). Gene-specific primers were designed with Primer
Express program (Applied Biosystems, Warrington, UK) using default settings (primer
Tm = 58 to 60°C, GC content = 30 to 80%, length = 9 to 40 nucleotides). The primers
were designed to be exon-spanning to avoid amplification of contaminating genomic
DNA (Tables 5. 1 and 5. 2). Glyceraldehydes -3- phosphate dehydrogenase (GAPDH)
was used as the house keeping gene and the PCR results were normalized to rat GAPDH
expression. The annealing temperature for the primers was standardized using gradient
PCR and 3% agar gels. The reaction mixture consisted of 2X SYBR Green PCR Master
mix (Applied Biosystems, Warrington, UK), 50 nM forward and reverse primers and 0.1
ng/µl cDNA. Thermal cycling was carried out with an ABI Prism 7000 sequence
detection system (Applied Biosystems Warrington, UK) under factory default conditions
125
( 50°C, 2 min; 95°C 10 min; and 40 cycles at 95ºC, 15 sec; 60ºC, 1 min). Each gene was
measured in triplicates and the formation of a single PCR product was confirmed using
dissociation curves. Negative controls, which consisted of all of the components of PCR
mix except cDNA, were used for all the primers. The normalized Ct (the cycle number at
which the fluorescence passes the threshold) values for each gene in all the 12 animals of
each group were averaged, and the relative fold-change in the expression of the gene in
animals fed E+ versus E- diet was calculated. Statistical analysis of the data was
performed by comparing the CT values of E+TN and E+HS rats for each gene using one-
way analysis of variance.
Primary hepatocellular cultures
Rat hepatocytes were isolated by a previously described collagenase-perfusion
protocol (Seglen, 1976). The abdomens of anesthetized rats were opened, and the portal
veins were cannulated. The inferior vena cava of each rat was ligated above the level of
the renal veins to prevent the perfusion to kidneys. The chest was opened, and the right
atrium portion was cannulated. To remove the blood, each rat’s liver was first perfused
with Krebs-Ringer-bicarbonate buffer (KRB) containing 0.25 mM EGTA for 1 to 2 min
and then with KRB containing 2 mM CaCl2 and collagenase (35 mg/100 ml) for 10 to 15
min. The liver was then removed from each rat and transferred to a beaker containing 10
to 15 ml KRB buffer medium. The liver tissue was minced to disperse cells using
scissors. The cell suspension was filtered through a nylon mesh and centrifuged at 50 X g
for 30 s at 24°C. Isolated hepatocytes were washed twice with 50 ml KRB buffer
containing 0.5% bovine serum albumin and 15 mM glucose by centrifugation as above
and resuspended in the same buffer. Cell viability, as assessed by the exclusion of trypan
126
blue, was 85 ± 5%. The hepatocytes (3 X 10⁶ cells/60 mm dish) were plated on to
collagen-coated culture dishes in Dulbecco’s modified Eagle’s medium (DMEM)
containing 10% fetal bovine serum. After 24 hours of incubation at 37°C in a 5% CO2
incubator, the medium was changed to DMEM containing 0.1% fetal bovine serum with
or without EV (i.e., 0, 1, 10, or 100 nM). After an additional 24 hours of incubation at
37°C in DMEM with or without EV, cells were treated with trypsin and collagenase for 5
min, followed by neutralization with medium. After centrifugation of the cell suspension
at 1,500 rpm for 5 min. and removal of the supernatant, the pellet was stored at -80˚C
until immunoblots were performed.
Immunoblots
Protein levels of CYP3A1 and selected antioxidants were evaluated in liver
samples collected from rats exposed to either E+ or E- diet using standard immunoblot
protocols described by Bowles et al. (2004). Liver samples were minced thoroughly in
200 µl of ice-cold buffer (50 mM Tris-HCl; pH 7.4, 0.1 mM EDTA, 0.1 mM EGTA,
0.1% β-mercaptoethanol, 1 nM PMSF, 2 nM leupeptin, 1 nM pepstatin A, 10% vol/vol
glycerol) and subjected to 4 X 30 s homogenizations at a speed of 4.0 to 5.0 using a
FASTPREP rapid homogenizing system (QBiogene, Carlsbad, CA) with samples cooled
on ice for 5 min between pulses. For primary hepatocellular cultures, cells were thawed
and homogenized as described above. Whole cell homogenates were centrifuged at 500 g
for 5 min and pellets containing debris were discarded. With respect to PCNA protein,
nuclear extracts were prepared from the livers of rats exposed to either E+ or E- diet
following the manufacturer’s protocol (Nuclear Extraction Kit, Active Motif, Carlsbad,
CA). These extracts were later used to determine the amount PCNA protein as a marker
127
for hepatocellular proliferation. Protein concentrations for all fractions were determined
using a Bradford protein assay kit (BioRad). Thirty micrograms of protein was
electrophoresed on 4 to 15% SDS polyacrylamide gels and transferred to nitrocellulose
membrane at 100 V for 1 h at 4°C. Following transfer, nitrocellulose membranes were
blocked for 1 h in Tris-buffered saline solution containing 5% dry milk, 0.1% Tween-20
and probed with rabbit polyclonal antibodies (Abcam Inc., Cambridge, MA) overnight at
4°C as follows: CYP3A1 (1:1000; Ab3572), GPx (1:1000; Ab16798), SOD (1:1000;
Ab13498), Catalase (1:500; Ab16731) and PCNA (1:500; Ab2426). The primary
antibody used to detect hepatic CYP3A1 was specific for human CYP3A4 and had cross
reactivity with rat CYP3A1. Nitrocellulose membranes were then washed and incubated
in horseradish peroxidase-labeled secondary antibody for 1 h. Enhanced
chemiluminescence techniques were used to visualize the immunoblots following
manufacturer's protocol (ECL, Amersham, Piscataway, NJ). Digitized images of the
luminograms were used for densitometric measurements with Scion Image software
(NIH, Bethesda, MD) with care taken to prevent saturation
Immunohistochemical staining for CYP3A1 in histological sections of rat livers
Protein expression of CYP3A1 was visualized in the liver of rats exposed to E+ or
E- diet using a standard immunohistochemical staining. Liver samples were fixed in
neutral buffered 10% formalin for a minimum of 24 hours, embedded in paraffin and
sectioned serially at 4 μm thickness. Sections were floated onto positively charged slides
(Thomas Sci, Swedesboro, NJ), deparaffinized and steamed in citrate buffer at pH 6.0 for
30 min to achieve antigen retrieval. Sections were then incubated with avidin-biotin two-
step blocking solution to inhibit background staining and in 3% H2O2 to inhibit
128
endogenous peroxidase. The sections were incubated overnight at 4°C with a 1: 500
dilution of primary rabbit monoclonal antibody to CYP3A1 (Abcam Inc., Cambridge,
MA), which has cross-reactivity with rat CYP3A1. Following the incubation, sections
were incubated with biotinylated anti-rabbit secondary antibody in PBS containing 15
mM sodium azide and peroxidase-labeled streptavidin (Dako LSAB+ kit, peroxidase,
K0690). Images were captured at 400X magnification (Insight Color Camera Sterling
Heights, MI).
Antioxidant activity assays
Rat liver samples from both treatment groups were homogenized as described
earlier and total protein concentrations were determined using a Bradford protein assay
kit (BioRad). The enzyme activities of superoxide dismutases (SODs), catalase and
glutathione peroxidase (GPx) were assayed spectrophotometrically following
manufacturer’s protocol (Cayman Chemical Company, Ann Arbor, MI). The specific
activity of hepatic GPx, SODs and catalase was expressed as unit µg-1 liver total protein.
Glutathione peroxidase activity was measured indirectly by a coupled reaction with
glutathione reductase. Glutathione peroxidase reduces hydroperoxides and results in the
production of oxidized glutathione, which in turn is recycled to its reduced state by
glutathione reductase and NADPH. Glutathione reductase oxidizes NADPH to NADP+,
and it is accompanied by a decrease in absorbance at 340 nm. The rate of decrease in the
A340 is directly proportional to the GPx activity in the sample. Hepatic SOD activity was
assayed using a tetrazolium salt for detection of superoxide radicals generated by
xanthine oxidase and hypoxanthine. The enzyme activity (1 unit) was measured as the
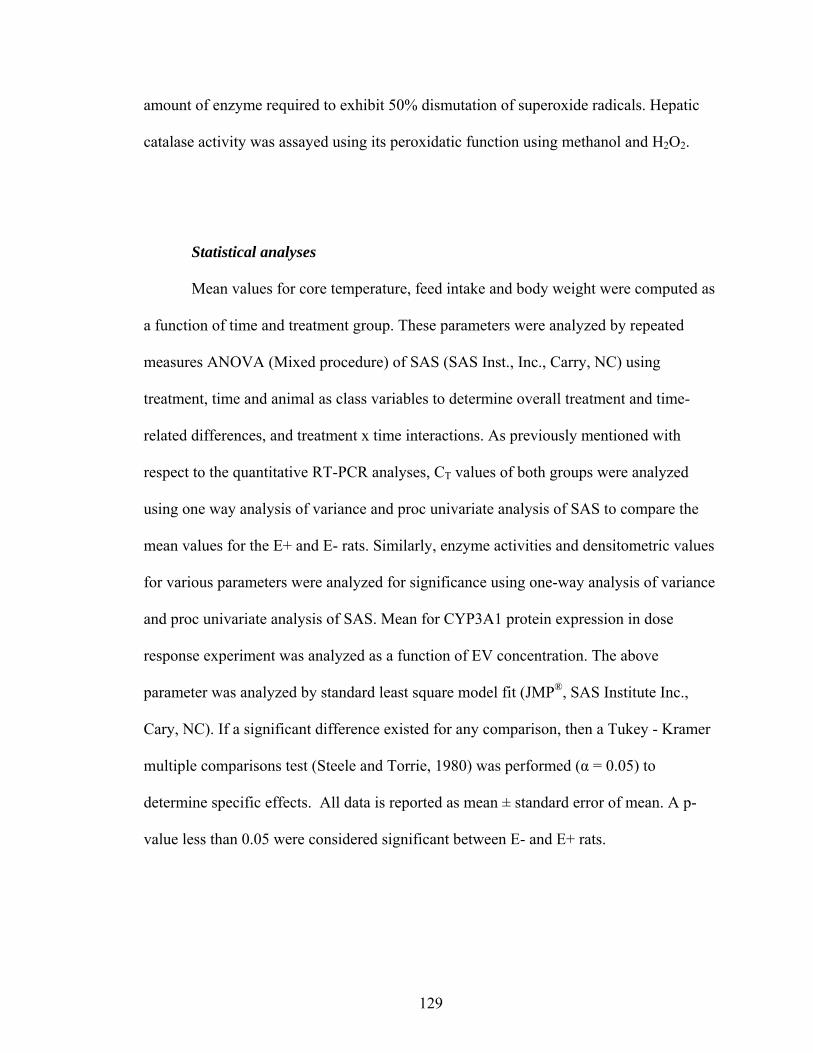
129
amount of enzyme required to exhibit 50% dismutation of superoxide radicals. Hepatic
catalase activity was assayed using its peroxidatic function using methanol and H2O2.
Statistical analyses
Mean values for core temperature, feed intake and body weight were computed as
a function of time and treatment group. These parameters were analyzed by repeated
measures ANOVA (Mixed procedure) of SAS (SAS Inst., Inc., Carry, NC) using
treatment, time and animal as class variables to determine overall treatment and time-
related differences, and treatment x time interactions. As previously mentioned with
respect to the quantitative RT-PCR analyses, CT values of both groups were analyzed
using one way analysis of variance and proc univariate analysis of SAS to compare the
mean values for the E+ and E- rats. Similarly, enzyme activities and densitometric values
for various parameters were analyzed for significance using one-way analysis of variance
and proc univariate analysis of SAS. Mean for CYP3A1 protein expression in dose
response experiment was analyzed as a function of EV concentration. The above
parameter was analyzed by standard least square model fit (JMP®, SAS Institute Inc.,
Cary, NC). If a significant difference existed for any comparison, then a Tukey - Kramer
multiple comparisons test (Steele and Torrie, 1980) was performed (α = 0.05) to
determine specific effects. All data is reported as mean ± standard error of mean. A p-
value less than 0.05 were considered significant between E- and E+ rats.
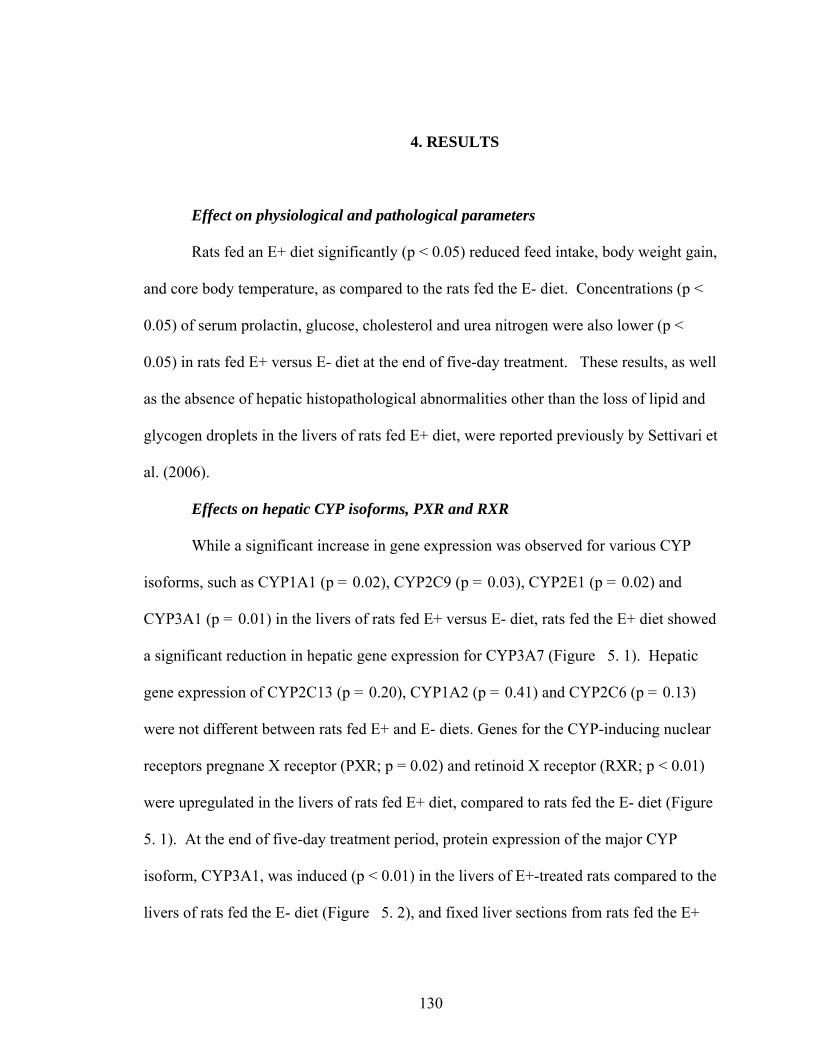
130
4. RESULTS
Effect on physiological and pathological parameters
Rats fed an E+ diet significantly (p < 0.05) reduced feed intake, body weight gain,
and core body temperature, as compared to the rats fed the E- diet. Concentrations (p <
0.05) of serum prolactin, glucose, cholesterol and urea nitrogen were also lower (p <
0.05) in rats fed E+ versus E- diet at the end of five-day treatment. These results, as well
as the absence of hepatic histopathological abnormalities other than the loss of lipid and
glycogen droplets in the livers of rats fed E+ diet, were reported previously by Settivari et
al. (2006).
Effects on hepatic CYP isoforms, PXR and RXR
While a significant increase in gene expression was observed for various CYP
isoforms, such as CYP1A1 (p = 0.02), CYP2C9 (p = 0.03), CYP2E1 (p = 0.02) and
CYP3A1 (p = 0.01) in the livers of rats fed E+ versus E- diet, rats fed the E+ diet showed
a significant reduction in hepatic gene expression for CYP3A7 (Figure 5. 1). Hepatic
gene expression of CYP2C13 (p = 0.20), CYP1A2 (p = 0.41) and CYP2C6 (p = 0.13)
were not different between rats fed E+ and E- diets. Genes for the CYP-inducing nuclear
receptors pregnane X receptor (PXR; p = 0.02) and retinoid X receptor (RXR; p < 0.01)
were upregulated in the livers of rats fed E+ diet, compared to rats fed the E- diet (Figure
5. 1). At the end of five-day treatment period, protein expression of the major CYP
isoform, CYP3A1, was induced (p < 0.01) in the livers of E+-treated rats compared to the
livers of rats fed the E- diet (Figure 5. 2), and fixed liver sections from rats fed the E+
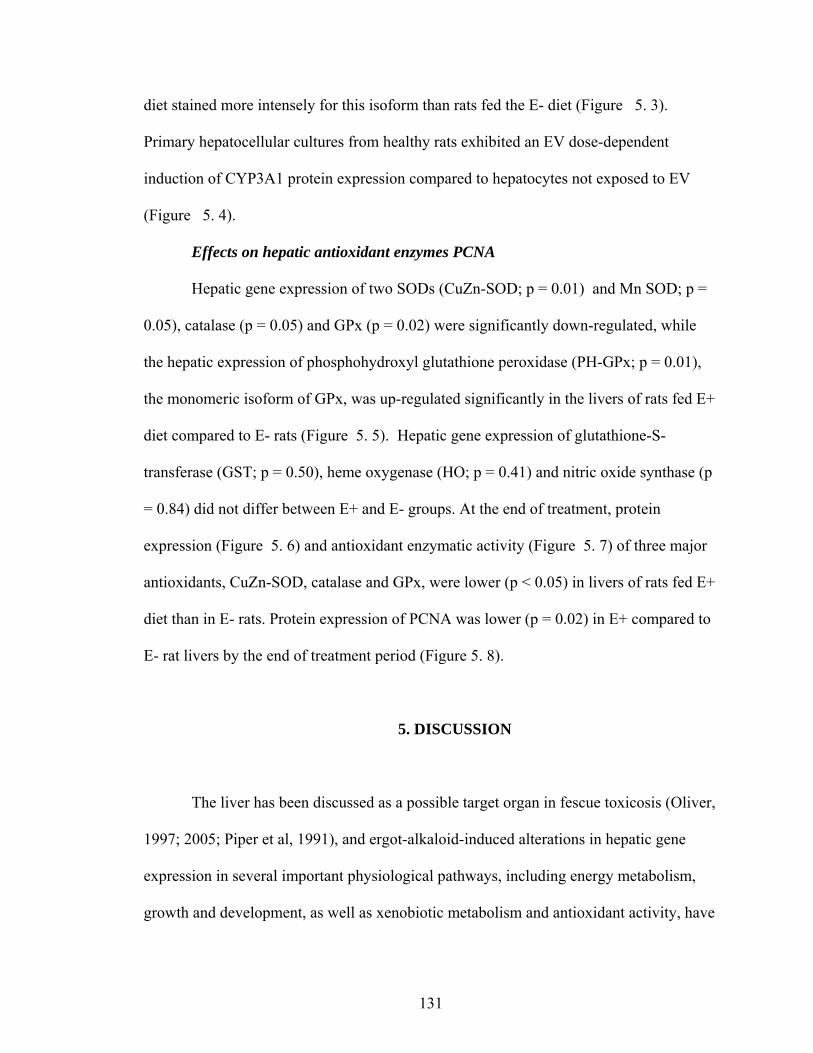
131
diet stained more intensely for this isoform than rats fed the E- diet (Figure 5. 3).
Primary hepatocellular cultures from healthy rats exhibited an EV dose-dependent
induction of CYP3A1 protein expression compared to hepatocytes not exposed to EV
(Figure 5. 4).
Effects on hepatic antioxidant enzymes PCNA
Hepatic gene expression of two SODs (CuZn-SOD; p = 0.01) and Mn SOD; p =
0.05), catalase (p = 0.05) and GPx (p = 0.02) were significantly down-regulated, while
the hepatic expression of phosphohydroxyl glutathione peroxidase (PH-GPx; p = 0.01),
the monomeric isoform of GPx, was up-regulated significantly in the livers of rats fed E+
diet compared to E- rats (Figure 5. 5). Hepatic gene expression of glutathione-S-
transferase (GST; p = 0.50), heme oxygenase (HO; p = 0.41) and nitric oxide synthase (p
= 0.84) did not differ between E+ and E- groups. At the end of treatment, protein
expression (Figure 5. 6) and antioxidant enzymatic activity (Figure 5. 7) of three major
antioxidants, CuZn-SOD, catalase and GPx, were lower (p < 0.05) in livers of rats fed E+
diet than in E- rats. Protein expression of PCNA was lower (p = 0.02) in E+ compared to
E- rat livers by the end of treatment period (Figure 5. 8).
5. DISCUSSION
The liver has been discussed as a possible target organ in fescue toxicosis (Oliver,
1997; 2005; Piper et al, 1991), and ergot-alkaloid-induced alterations in hepatic gene
expression in several important physiological pathways, including energy metabolism,
growth and development, as well as xenobiotic metabolism and antioxidant activity, have
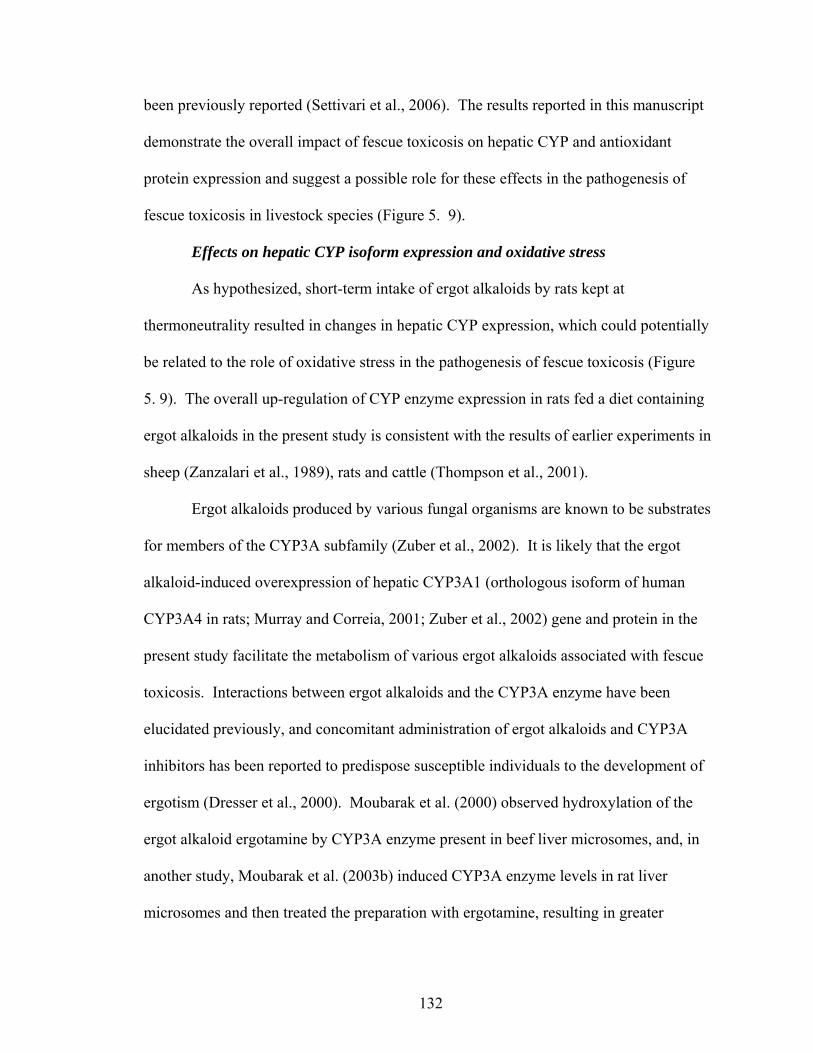
132
been previously reported (Settivari et al., 2006). The results reported in this manuscript
demonstrate the overall impact of fescue toxicosis on hepatic CYP and antioxidant
protein expression and suggest a possible role for these effects in the pathogenesis of
fescue toxicosis in livestock species (Figure 5. 9).
Effects on hepatic CYP isoform expression and oxidative stress
As hypothesized, short-term intake of ergot alkaloids by rats kept at
thermoneutrality resulted in changes in hepatic CYP expression, which could potentially
be related to the role of oxidative stress in the pathogenesis of fescue toxicosis (Figure
5. 9). The overall up-regulation of CYP enzyme expression in rats fed a diet containing
ergot alkaloids in the present study is consistent with the results of earlier experiments in
sheep (Zanzalari et al., 1989), rats and cattle (Thompson et al., 2001).
Ergot alkaloids produced by various fungal organisms are known to be substrates
for members of the CYP3A subfamily (Zuber et al., 2002). It is likely that the ergot
alkaloid-induced overexpression of hepatic CYP3A1 (orthologous isoform of human
CYP3A4 in rats; Murray and Correia, 2001; Zuber et al., 2002) gene and protein in the
present study facilitate the metabolism of various ergot alkaloids associated with fescue
toxicosis. Interactions between ergot alkaloids and the CYP3A enzyme have been
elucidated previously, and concomitant administration of ergot alkaloids and CYP3A
inhibitors has been reported to predispose susceptible individuals to the development of
ergotism (Dresser et al., 2000). Moubarak et al. (2000) observed hydroxylation of the
ergot alkaloid ergotamine by CYP3A enzyme present in beef liver microsomes, and, in
another study, Moubarak et al. (2003b) induced CYP3A enzyme levels in rat liver
microsomes and then treated the preparation with ergotamine, resulting in greater
133
metabolism of ergotamine and production of dihydroxy derivatives than in controls due
to CYP3A-induced microsomes. Peyronneau et al. (1994) reported metabolism of
bromocriptine, an ergot alkaloid similar to ergotamine, by CYP3A subfamily in rat liver
microsomes treated with dexamethasone, a CYP3A inducer, and Althus et al. (2000)
observed the metabolism of another ergot alkaloid, alpha-dihydroergocryptine, by
CYP3A isoforms. Interestingly enough, the gene for CYP3A7, which has a specific role
in 16 alpha-hydroxylation of steroids (Daly, 2006) and the bioactivation of several pro-
mutagens, including aflatoxin B1 (Li et al., 1997), was down-regulated in the livers of E+
rats in the present study. While the role of this member of the CYP3A subfamily in the
metabolism of ergot alkaloids has yet to be elucidated, it is possible that the observed
alteration in this gene is similar to the effect of E+ diet in mice, where hepatic expression
of enzymes involved in steroid metabolism was decreased (Bhusari et al., 2006).
Like the CYP3A subfamily, the CYP2C enzymes are abundant in rat liver. Of the
three CYP2C isoforms tested in this study, two (CYP2C9, CYP2C13) appeared to be up-
regulated in E+ fed rats, with only CYP2C9 expression reaching statistically significant
level (Figure 5. 1). The CYP2C isoforms are associated with oxidation of the mycotoxin
aflatoxin B1 as well as dihydropyridines, and these enzymes also hydroxylate various
steroids (Zuber et al., 2002). It is possible that CYP2C isoforms may oxidize ergot
alkaloids, as well as aflatoxins.
Rats fed an E+ diet in the present study increased CYP2E1 gene expression in
hepatic tissue. Overexpression of CYP2E1 has been shown to induce chronic oxidative
stress by generating more ROS, possibly leading to hepatocellular injury and death
(Schattenberg et al., 2004). Hepatocytes containing over-expressed CYP2E1 have been
134
reported to release diffusible mediators which activate hepatic stellate cells and alpha
smooth muscle actin, as well as intracellular and secreted collagen type 1 protein, intra-
and extracellular hydrogen peroxide,, and lipid peroxidation products (Nieto et al., 2002).
Intake of an E+ diet in the present study increased hepatic gene expression of
CYP1A1 with no change in CYP1A2. Along with UDP-glucuronosyl transferase,
CYP1A1 plays a crucial role in the metabolism of xenobiotic compounds (Nishizawa et
al., 2005). It is known that CYP1A1, 1A2 and 3A4 isoforms bioactivate certain endo and
xenobiotics (Bhaskarannair et al., 2006; Haas et al., 2006). These isoforms convert
estrogens into quinones and semiquinones resulting in oxidative damage to DNA and to
lipids (Gallicchio et al., 2006). It is evident from the results of the present study that
transcriptional activation of CYP1A1, as well other CYP isoforms, in response to ergot
alkaloids has the potential to increase oxidative stress.
Direct versus indirect effects on hepatic CYP isoform expression
While, in all likelihood, the overall impact of fescue toxicosis on hepatic CYP
proteins involves both direct and indirect effects of ergot alkaloids, the results of the
present study helped to elucidate the direct effects of ergot alkaloids on hepatic CYP
expression from indirect effects of endophytic toxins related to decreased nutrient and
caloric intake and/or utilization. The dose-dependent induction of CYP3A1 protein
expression in primary hepatocellular cultures in response to ergovaline, one of the
primary ergot alkaloids associated with fescue toxicosis, clearly demonstrated the ability
of ergopeptine alkaloids to directly induce various CYP isoforms independent of reduced
nutrient and caloric intake. Based on the differential expression of hepatic CYP isoforms
in starved mice which was attributed by Bauer et al. (2004) to reduced feed intake, it is
135
likely that the overexpression of CYP isoforms and potential production of ROS observed
in the present study were also due, in part, to reduced nutrient and caloric intake.
Effects on hepatic gene expression of selected CYP-inducing nuclear receptors
Fescue toxicosis induced the up-regulation of selected hepatic nuclear receptor
genes PXR and RXR. Both these nuclear receptors are ligand-activated by a large number
of structurally and physiologically diverse endogenous ligands (e.g., steroid hormones,
vitamins and, bile acids), as well as a wide range of xenobiotics, such as rifampin,
protease inhibitors and environmental contaminants (Lamba et al., 2004). Pregnane X
receptor is an important component of the body’s defense mechanism against toxic
substances, and it serves as a generalized sensor for exposure to hydrophobic xenobiotics
(Kliewer et al., 2002). The activation of PXR results in the induction of an elaborate
network of genes involved in all aspects of xenobiotic metabolism and detoxification
(Kliewer, 2003), and PXR, which is primarily expressed in liver, small intestine and
colon, induces multiple CYP isoforms (Bertilsson et al., 1998; Pascussi et al., 2000).
Upon ligand binding, PXR forms a heterodimer with the retinoid X receptor and
transactivates ER6 (everted repeat with a 6 bp spacer) elements upstream of the CYP
genes (Waxman, 1999). This transactivation is followed by recruitment of co-activator
protein, SRC-1 (steroid receptor coactivator-1), leading to transcriptional activation of
genes, which code for CYPs (Savas et al., 1999). Therefore the up-regulation of these
nuclear receptors provides a mechanism for the induction of various CYP isoforms in
response to either endophyte toxins themselves and/or, due to reduced feed intake (Bauer
et al., 2004).
136
Effect on hepatic antioxidant enzyme expression and activity and oxidative
stress
Short-term intake of ergot alkaloids in the present study changed hepatic
antioxidant enzyme expression and activity, and it was potentially related to the role of
oxidative stress in the pathogenesis of fescue toxicosis (Figure 5. 9). The possible
consequences of increased CYP-associated xenobiotic metabolism include the production
of reactive molecules, which may be more toxic than the parent xenobiotic, as well as
oxygen free radicals (Liska, 1998; Percival, 1997). Antioxidant enzymes can inhibit free
radical production by chelating the transition metal catalysts, breaking chain reactions,
reducing concentrations of ROS, and scavenging initiating radicals (Liska, 1998;
Scandalios, 1997). The decreased hepatic expression and activity of antioxidant
enzymes, as observed in the study, have the potential to predispose animals to hepatic
insult induced by oxidative stress (Tiedge et al., 1998)
This is the first report, to our knowledge, of the effect of ergot alkaloids on
hepatic expression and activity of SOD, which catalyses the conversion of superoxide
anions into H2O2 and is one of the primary enzymatic defenses against ROS. Mammalian
cells have a SOD enzyme containing manganese at its active site in mitochondria and one
with copper and zinc at the active site in the cytosol (Scandalios, 1997). Minor changes in
Mn-SOD expression can have a significant impact on the antioxidant status of
mitochondria, since a 50% reduction in its expression results in a functional decline of
oxidative phosphorylation, an increase in oxidative stress, and an increase in apoptosis
rate (Wheeler et al., 2001). In the present study, hepatic gene expression of both forms of
137
SOD was down-regulated in rats fed an E+ diet. This down-regulation in SOD gene
expression, in conjunction with diminished activity, could potentially increase superoxide
anions within the mitochondria and cytoplasm. Likewise, there could be impairment of
cellular function with increased oxidative stress that is possibly related to superoxide
radical-induced inhibition of catalase activity (Marczuk-Krynicka et al., 2003).
Intake of an E+ diet in the present study also reduced gene and protein expression
and activity of GPx and catalase. Catalase is an important antioxidant enzyme located
within the peroxisomes and GPx is located in the cytosol (Liska, 1998). These enzymes
are involved in the conversion of hydrogen peroxide, a powerful and potentially harmful
oxidizing agent, into water and molecular oxygen (Liska, 1998). It is anticipated that cells
containing low levels of one or more of these enzymes would be particularly vulnerable
to oxidative damage (Liska, 1998; Tiedge et al., 1998), and this appears to be the case
with the rats fed the E+ diet in the present study. Reductions in catalase and GPx
antioxidant enzyme expression and activity in E+ rats would impair conversion of
hydrogen peroxide to water and resulting in persistence of the hydroxyl radical within
hepatocytes. The resulting hydroxyl radicals cause site-specific damage on the inner
mitochondrial membrane and critical cellular components leading to cellular function
impairment and apoptosis (Tiedge et al., 1998).
While most of the genes for antioxidant enzymes evaluated in this experiment
were down-regulated following exposure to ergot alkaloids, the gene for PH-GPx was
actually up-regulated. The selenium-dependent enzyme PH-GPx detoxifies
hydroperoxides by reducing them to alcohols (Godeas et al., 1994). While the basis for
the up-regulation of this gene in the present study is unknown, the increased expression
138
of this gene as an adaptive mechanism to increased peroxide concentration within
hepatocytes cannot be ruled out. It is also possible that there is some relationship
between the up-regulation of this gene and the observed down- regulation of the hepatic
gene expression, as well as enzymatic activity, of GPx. Reduced antioxidant activities of
E+ rats in the present study are consistent with earlier reports. Lakritz et al. (2002)
reported reduced blood glutathione levels in cattle fed ergot-alkaloid containing diet
during heat stress. Gorini et al. (1988) observed a reduction in forebrain glutathione
levels in male rats after chronic i.p. treatment with dihydroergocristine and
dihydroergocriptine.
As with the expression of CYP isoforms and the expression of genes for the PXR
and RXR nuclear receptors, it is very likely that the overall impact of fescue toxicosis on
hepatic antioxidant enzymes is at least, in part, a result of decreased nutrient and caloric
intake, rather than a direct effect of endophytic toxins. Cho et al. (1981) reported reduced
glutathione concentrations in starved rats, and Marczuk-Krynicka et al. (2003) observed
reduced expression of catalase and CuZn-SOD but not GPx in rats deprived of feed. The
effects of reduced feed intake on PH-GPx have not been elucidated. This effect was
incorporated into this preliminary study in an effort to determine both the direct and
indirect effects of fescue toxicosis on this particular system.
Effects on hepatocellular proliferation
To evaluate the adverse hepatic effects of short-term exposure to ergot alkaloids
associated with fescue toxicosis, in the absence of histological abnormalities, PCNA was
measured as an indicator of hepatocellular proliferation. It was evident that fewer
hepatocytes were replicating in the livers of rats exposed to ergot alkaloids. It is very
139
likely that oxidative stress, in part due to the direct effects of endophytic toxins and also
as a physiological response to decreased nutrient and caloric intake, contributed to the
diminished hepatocellular proliferation observed in these rats.
6. CONCLUSION
The results of the present study show the effects of ergot alkaloids on the
hepatic expression of CYP and antioxidant proteins in rats and offer explanation as to
how those alterations might contribute to the clinical signs of fescue toxicosis. CYP
protein expression was up-regulated in as a detoxification mechanism and, as a response
to decreased nutrient and caloric intake. In contrast, there was diminished expression and
activity of hepatic antioxidant enzymes. With the supposition that up-regulation of
hepatic CYP isoforms will result in increased reactive xenobiotic metabolites, including
ROS, it is likely that the reduced antioxidant activity predisposes ergot alkaloid-exposed
animals to hepatic oxidative stress. The results of the present study emphasize the
potential role of even short-term endophytic toxin-associated oxidative damage in the
pathogenesis of fescue toxicosis.
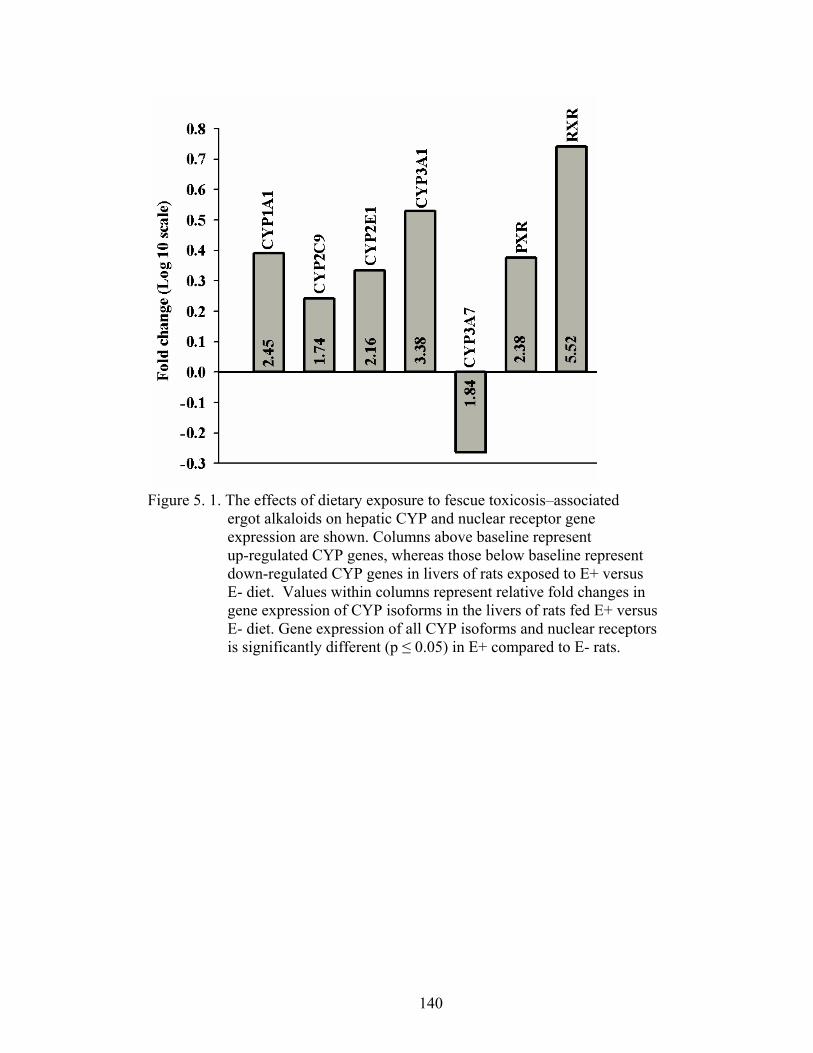
140
Figure 5. 1. The effects of dietary exposure to fescue toxicosis–associated
ergot alkaloids on hepatic CYP and nuclear receptor gene expression are shown. Columns above baseline represent up-regulated CYP genes, whereas those below baseline represent down-regulated CYP genes in livers of rats exposed to E+ versus E- diet. Values within columns represent relative fold changes in gene expression of CYP isoforms in the livers of rats fed E+ versus E- diet. Gene expression of all CYP isoforms and nuclear receptors is significantly different (p ≤ 0.05) in E+ compared to E- rats.
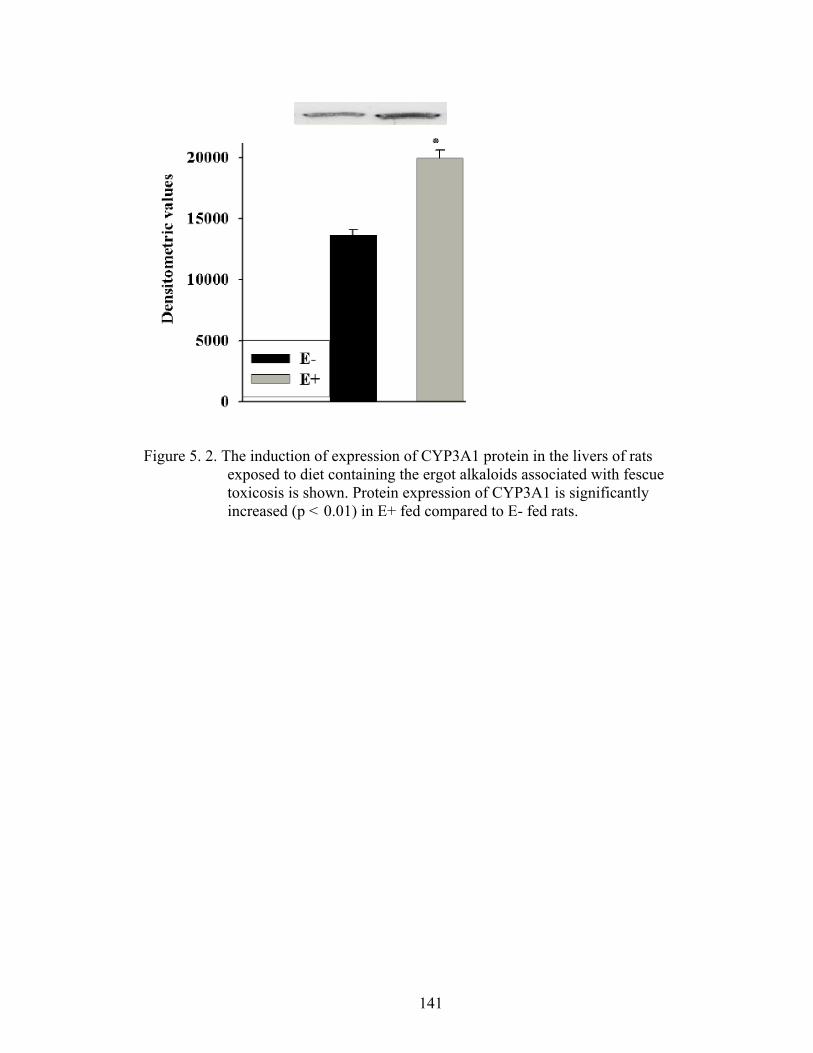
141
Figure 5. 2. The induction of expression of CYP3A1 protein in the livers of rats exposed to diet containing the ergot alkaloids associated with fescue toxicosis is shown. Protein expression of CYP3A1 is significantly increased (p < 0.01) in E+ fed compared to E- fed rats.
٭
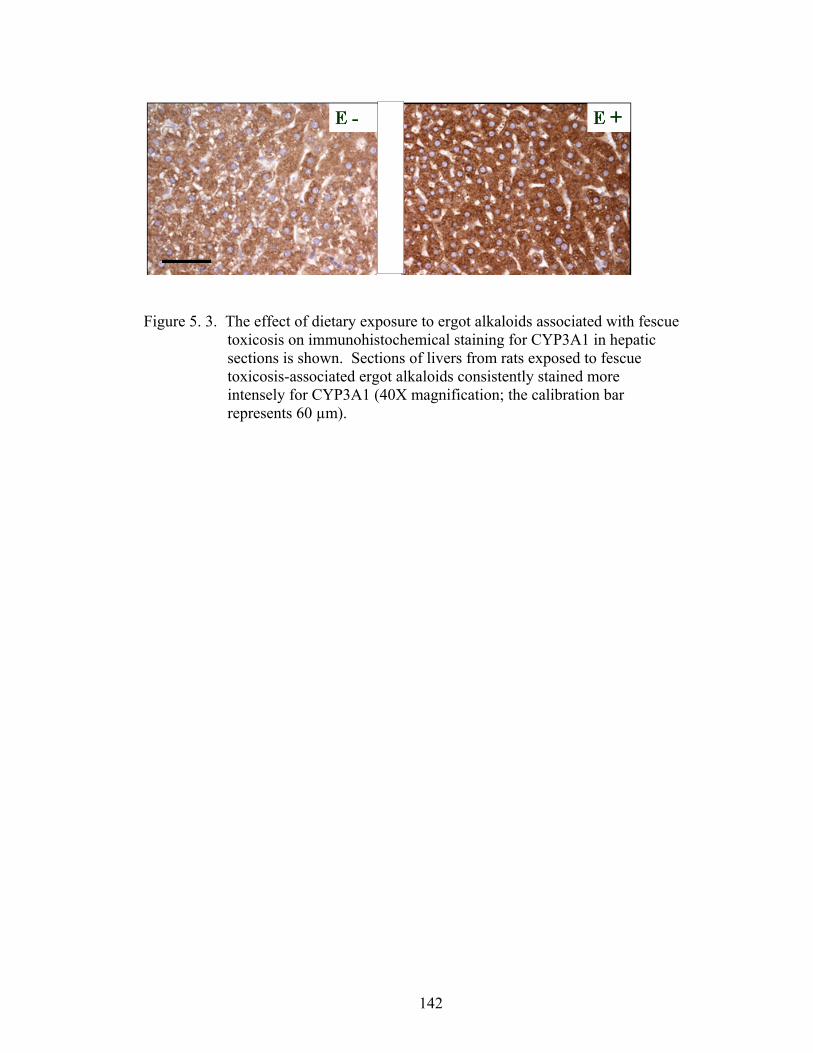
142
Figure 5. 3. The effect of dietary exposure to ergot alkaloids associated with fescue toxicosis on immunohistochemical staining for CYP3A1 in hepatic sections is shown. Sections of livers from rats exposed to fescue toxicosis-associated ergot alkaloids consistently stained more intensely for CYP3A1 (40X magnification; the calibration bar represents 60 µm).
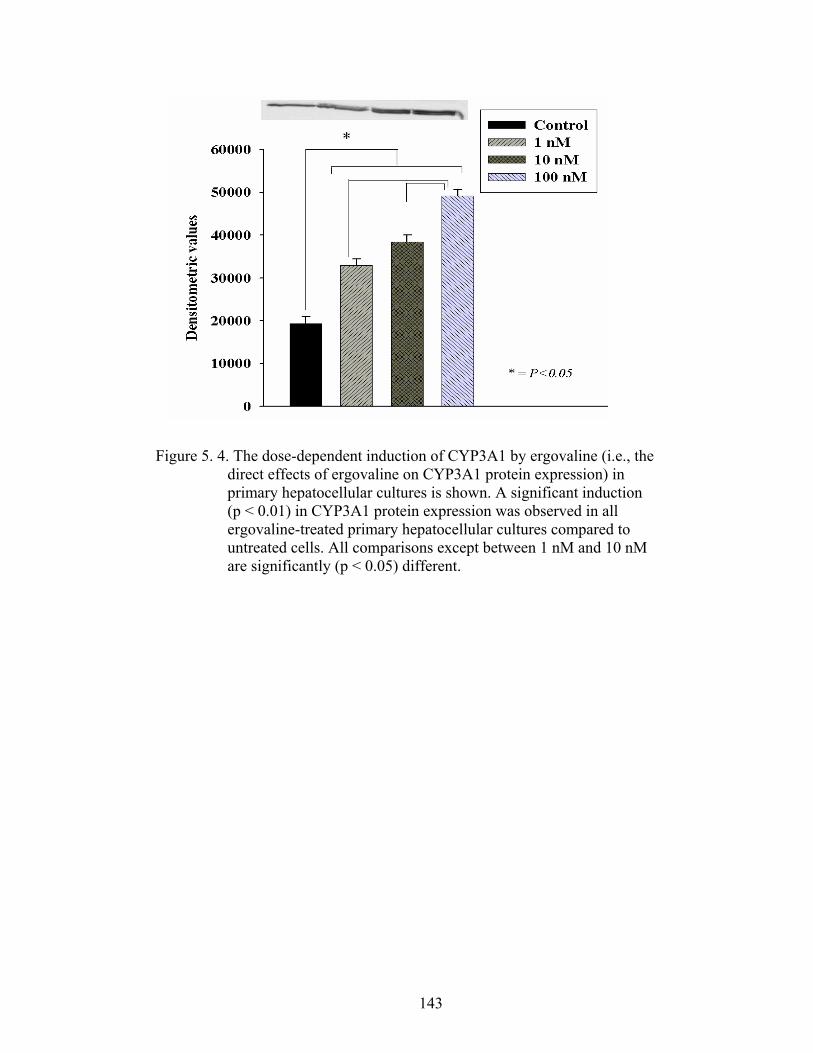
143
Figure 5. 4. The dose-dependent induction of CYP3A1 by ergovaline (i.e., the direct effects of ergovaline on CYP3A1 protein expression) in primary hepatocellular cultures is shown. A significant induction (p < 0.01) in CYP3A1 protein expression was observed in all ergovaline-treated primary hepatocellular cultures compared to untreated cells. All comparisons except between 1 nM and 10 nM are significantly (p < 0.05) different.
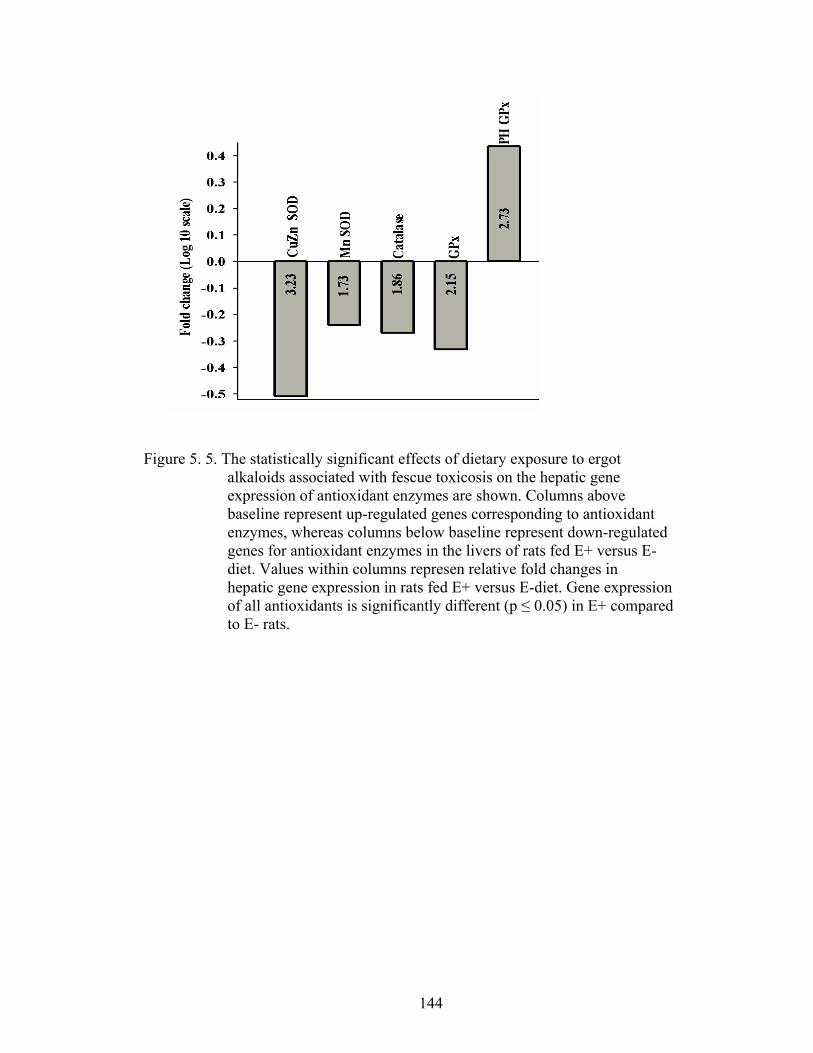
144
Figure 5. 5. The statistically significant effects of dietary exposure to ergot
alkaloids associated with fescue toxicosis on the hepatic gene expression of antioxidant enzymes are shown. Columns above baseline represent up-regulated genes corresponding to antioxidant enzymes, whereas columns below baseline represent down-regulated genes for antioxidant enzymes in the livers of rats fed E+ versus E- diet. Values within columns represen relative fold changes in hepatic gene expression in rats fed E+ versus E-diet. Gene expression of all antioxidants is significantly different (p ≤ 0.05) in E+ compared to E- rats.
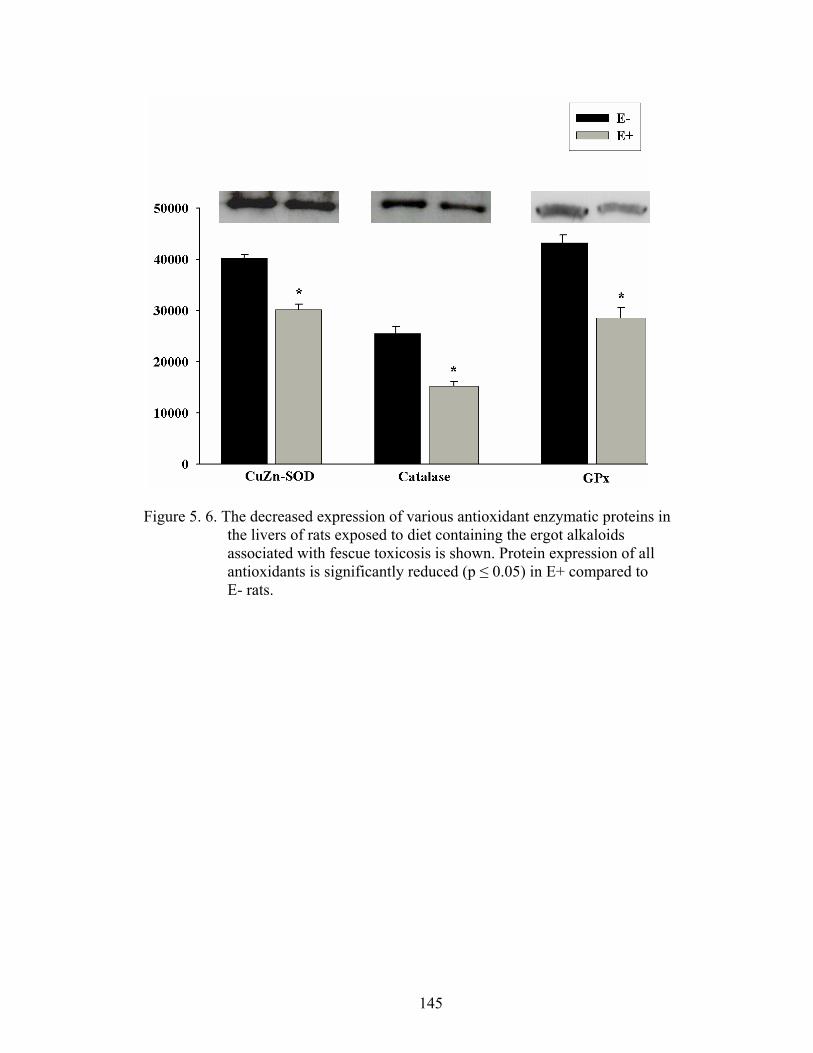
145
Figure 5. 6. The decreased expression of various antioxidant enzymatic proteins in the livers of rats exposed to diet containing the ergot alkaloids associated with fescue toxicosis is shown. Protein expression of all antioxidants is significantly reduced (p ≤ 0.05) in E+ compared to E- rats.
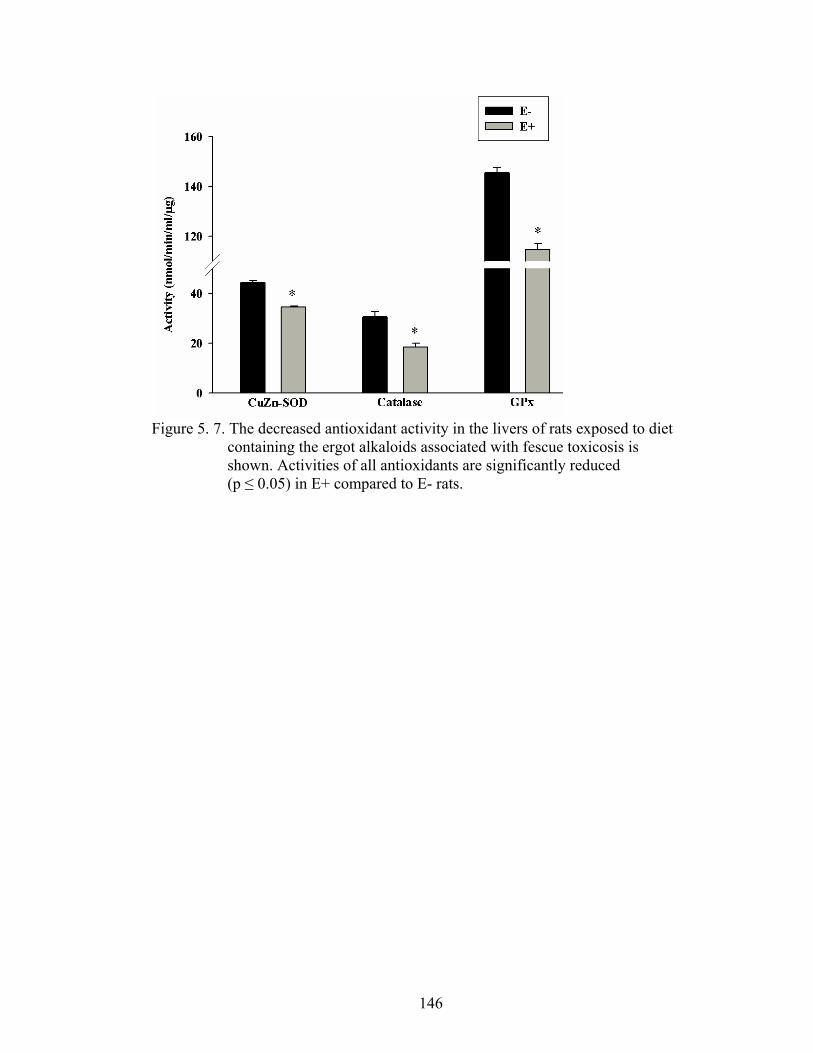
146
Figure 5. 7. The decreased antioxidant activity in the livers of rats exposed to diet
containing the ergot alkaloids associated with fescue toxicosis is shown. Activities of all antioxidants are significantly reduced (p ≤ 0.05) in E+ compared to E- rats.
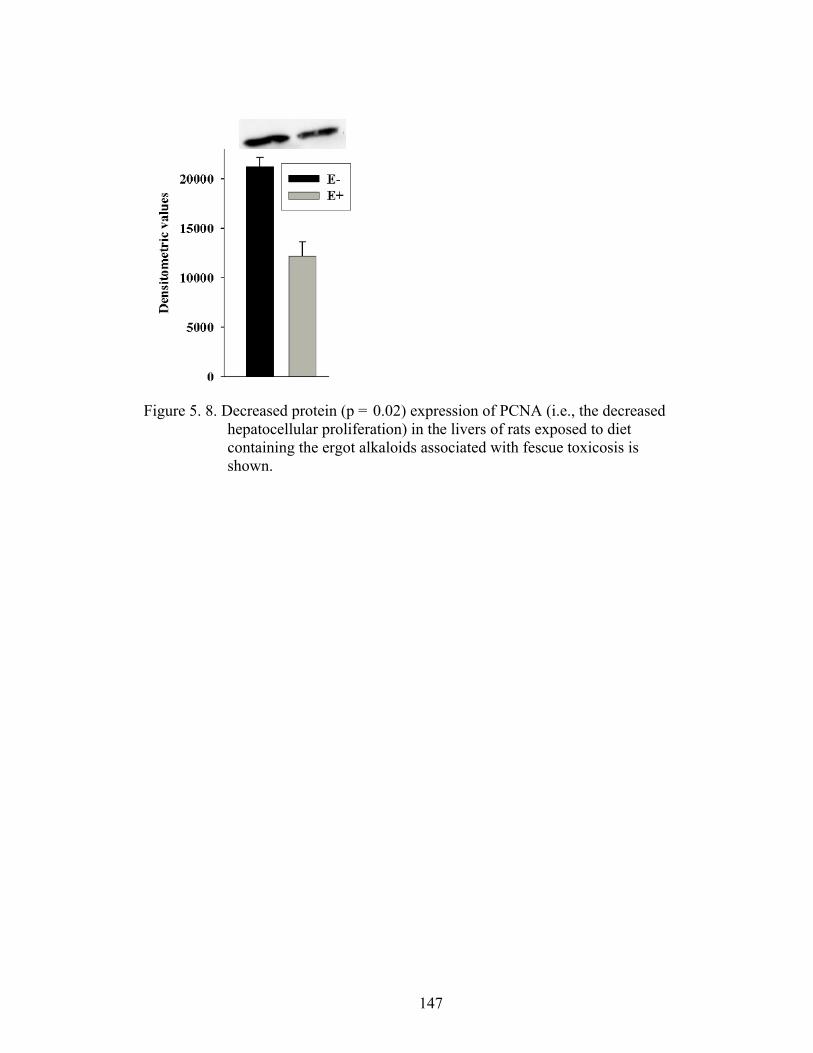
147
Figure 5. 8. Decreased protein (p = 0.02) expression of PCNA (i.e., the decreased hepatocellular proliferation) in the livers of rats exposed to diet containing the ergot alkaloids associated with fescue toxicosis is shown.
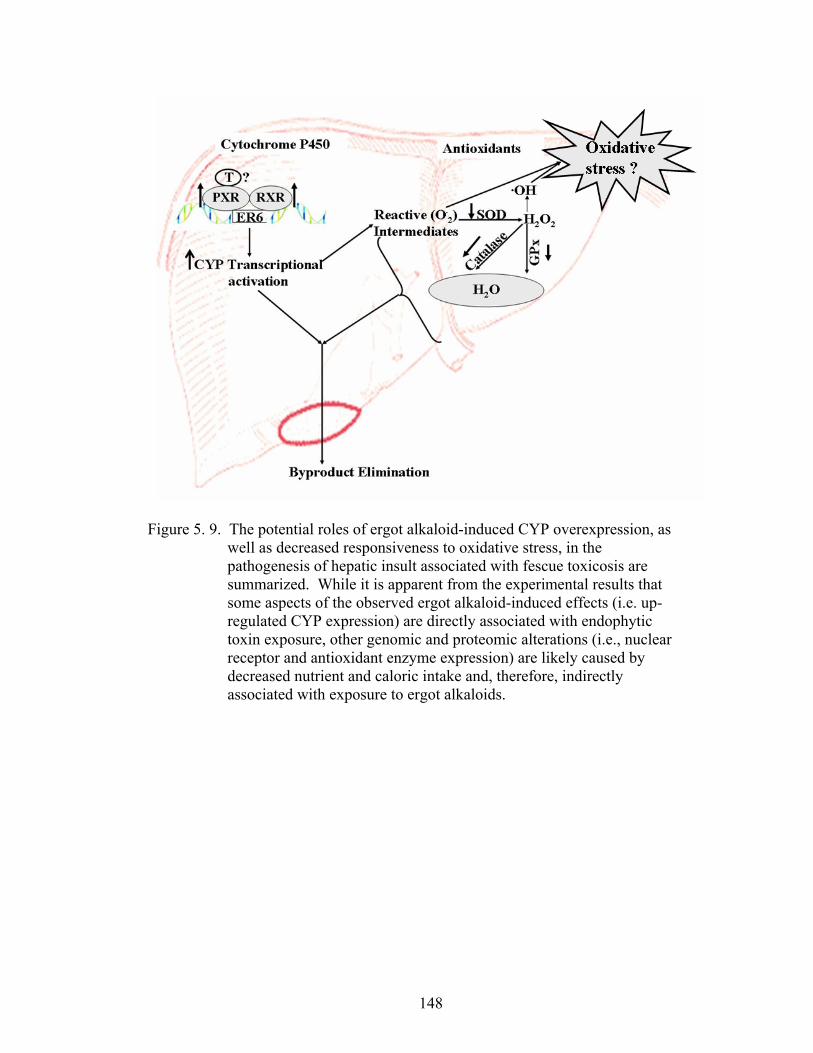
148
Figure 5. 9. The potential roles of ergot alkaloid-induced CYP overexpression, as well as decreased responsiveness to oxidative stress, in the pathogenesis of hepatic insult associated with fescue toxicosis are summarized. While it is apparent from the experimental results that some aspects of the observed ergot alkaloid-induced effects (i.e. up-regulated CYP expression) are directly associated with endophytic toxin exposure, other genomic and proteomic alterations (i.e., nuclear receptor and antioxidant enzyme expression) are likely caused by decreased nutrient and caloric intake and, therefore, indirectly associated with exposure to ergot alkaloids.
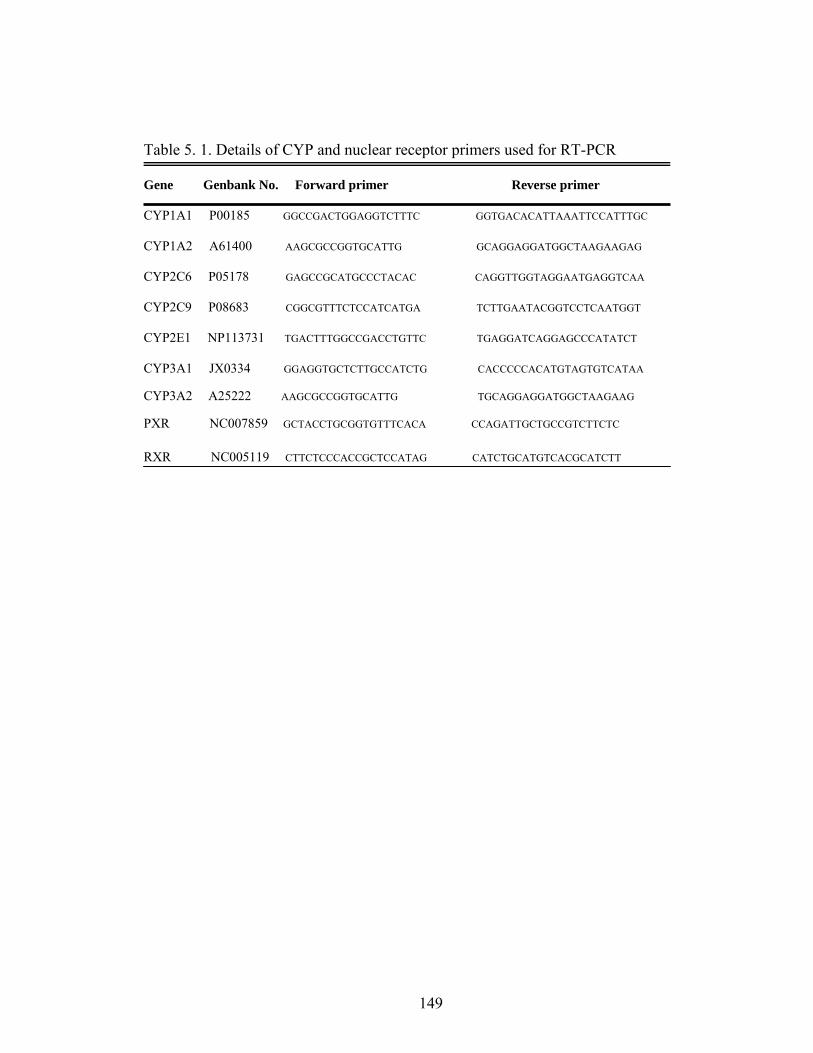
149
Table 5. 1. Details of CYP and nuclear receptor primers used for RT-PCR
Gene Genbank No. Forward primer Reverse primer
CYP1A1 P00185 GGCCGACTGGAGGTCTTTC GGTGACACATTAAATTCCATTTGC
CYP1A2 A61400 AAGCGCCGGTGCATTG GCAGGAGGATGGCTAAGAAGAG
CYP2C6 P05178 GAGCCGCATGCCCTACAC CAGGTTGGTAGGAATGAGGTCAA
CYP2C9 P08683 CGGCGTTTCTCCATCATGA TCTTGAATACGGTCCTCAATGGT CYP2E1 NP113731 TGACTTTGGCCGACCTGTTC TGAGGATCAGGAGCCCATATCT CYP3A1 JX0334 GGAGGTGCTCTTGCCATCTG CACCCCCACATGTAGTGTCATAA CYP3A2 A25222 AAGCGCCGGTGCATTG TGCAGGAGGATGGCTAAGAAG PXR NC007859 GCTACCTGCGGTGTTTCACA CCAGATTGCTGCCGTCTTCTC RXR NC005119 CTTCTCCCACCGCTCCATAG CATCTGCATGTCACGCATCTT
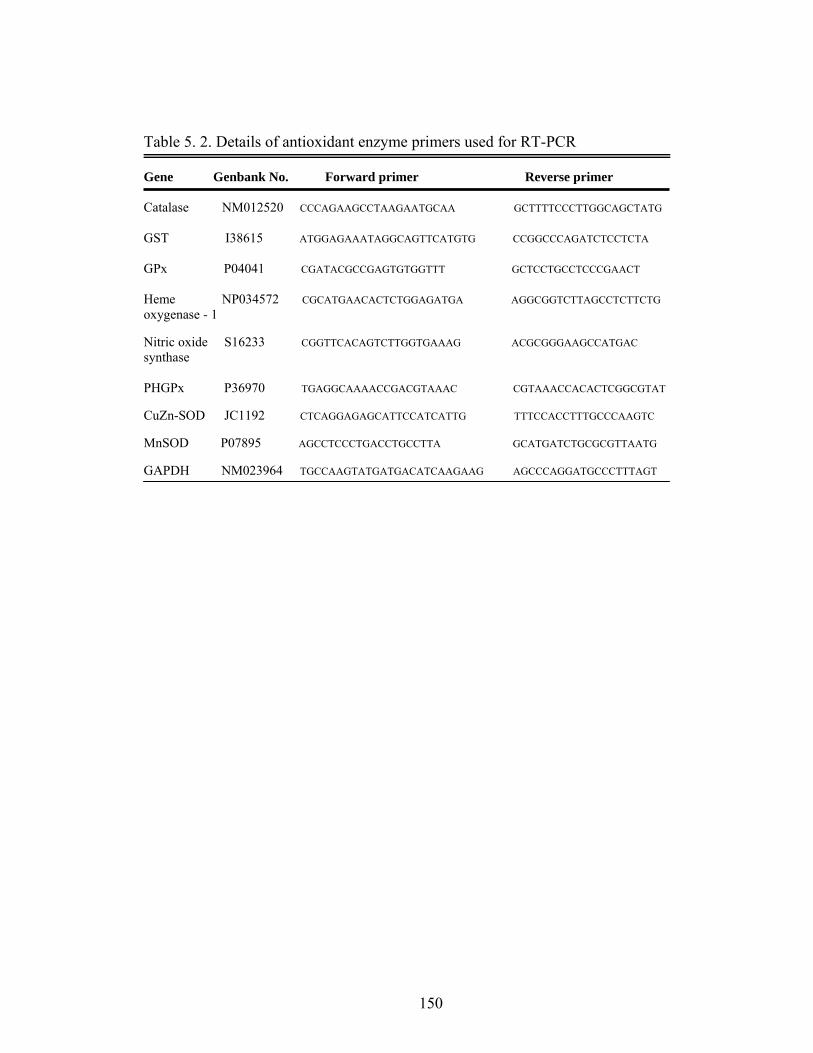
150
Table 5. 2. Details of antioxidant enzyme primers used for RT-PCR
Gene Genbank No. Forward primer Reverse primer
Catalase NM012520 CCCAGAAGCCTAAGAATGCAA GCTTTTCCCTTGGCAGCTATG
GST I38615 ATGGAGAAATAGGCAGTTCATGTG CCGGCCCAGATCTCCTCTA
GPx P04041 CGATACGCCGAGTGTGGTTT GCTCCTGCCTCCCGAACT
Heme NP034572 CGCATGAACACTCTGGAGATGA AGGCGGTCTTAGCCTCTTCTG oxygenase - 1 Nitric oxide S16233 CGGTTCACAGTCTTGGTGAAAG ACGCGGGAAGCCATGAC synthase PHGPx P36970 TGAGGCAAAACCGACGTAAAC CGTAAACCACACTCGGCGTAT CuZn-SOD JC1192 CTCAGGAGAGCATTCCATCATTG TTTCCACCTTTGCCCAAGTC MnSOD P07895 AGCCTCCCTGACCTGCCTTA GCATGATCTGCGCGTTAATG GAPDH NM023964 TGCCAAGTATGATGACATCAAGAAG AGCCCAGGATGCCCTTTAGT
151
CHAPTER VI
EFFECTS OF ACUTE HEAT STRESS ON ERGOT ALKALOID-
INDUCED ALTERATIONS IN HEPATIC GENE EXPRESSION
ABSTRACT
Intake of ergot alkaloids associated with endophyte-infected fescue (E+) has
adverse effects on animal health and productivity, which is collectively referred to as
fescue toxicosis. These effects are exacerbated under hot and humid environmental
conditions. A rat model for was used to evaluate the effect of endophytic toxins on
hepatic gene expression under acute heat stress (HS). Rats implanted with telemetric
transmitters (n = 12) were fed ad libitum an E+ diet and maintained under thermoneutral
(TN) conditions (21˚C) for five days, followed by TN or HS (31˚C) conditions for three
days. Core temperature (Tc) was monitored continuously and feed intake (FI) and body
weight (BW) were measured daily. Both E+ and HS induced alterations in hepatic genes
were evaluated using DNA microarrays in flash-frozen samples of liver collected at the
end of the exposure. Protein expression of cytochrome P450 3A1 (CYP3A1), the
enzymatic activities of superoxide dismutase (SOD), catalase (CAT) and glutathione
peroxidase (GPx) and the rate of hepatocytic apoptosis using the TUNEL assay were also
determined in these samples. As expected, intake of E+ reduced FI and BW from
152
pretreatment levels under both TN and HS conditions, with a greater reduction occurring
during acute HS. Core temperature at TN did not change from pretreatment levels but
increased during HS, and, as anticipated, serum prolactin decreased with E+ treatment
but increased during HS. Genes associated with apoptosis were upregulated following
acute HS, and genes involved with ATP synthesis, antioxidant function, chaperone
activity, xenobiotic metabolism and immune function, were down-regulated with acute
HS. The TUNEL positive hepatic nuclei and CYP3A1 protein expression increased in
E+HS with a reduction in SOD and GPx activities. The results of the present study
indicate that the anticipated exacerbation of the adverse physiological effects of ergot
alkaloid exposure by acute heat stress are associated with upregulation of genes involved
in apoptosis and suppression of the expression of genes associated with ATP synthesis,
immune system function and chaperone, xenobiotic metabolizing and antioxidant
activities, which could ultimately increase the stress resulting in various pathological
abnormalities. The added effects of acute heat stress on ergot alkaloid–induced
alterations in hepatic gene expression very likely play an important role in the
pathogenesis of the adverse effects of ergot alkaloids on various animal species.
2. INTRODUCTION
Consumption of ergot alkaloids by cattle, produced by the fungus Neotyphodium
coenophialum, results in a disease syndrome called fescue toxicosis. One of the
characteristic features of fescue toxicosis is peripheral vasoconstriction resulting from the
interactions of ergot alkaloids with alpha-2 adrenergic, seratonergic and dopaminergic
153
receptors (Oliver, 2005). Other characteristics of fescue toxicosis include reduced feed
intake, and both serum prolactin and cholesterol levels (Porter and Thompson, 1992;
Aldrich et al., 1993; Paterson et al., 1995). Fescue toxicosis-related problems get
exacerbated during heat stress as the animal’s ability to dissipate excess body heat is
impaired, resulting in hyperthermia and reduced growth rate (Spiers et al., 2005a). The
clinical signs of fescue toxicosis in cattle appear to be primarily dependent on the level of
heat (Hemken et al., 1981). Rats also exhibit the characteristics clinical signs of fescue
toxicosis and are sensitive to the adverse effects of the ergot alkaloids associated with
fescue toxicosis under both thermoneutral (TN) and heat stress (HS) conditions (Spiers et
al., 2005a).
The liver is one of the most important organs for the regulation of carbohydrate,
lipid, protein and xenobiotic metabolism, and has been identified as a target organ of
fescue toxicosis (Oliver, 1997). Long-term intake of E+ diet in cattle, increases liver-
specific enzymes (Piper et al., 1991), and a component of the fescue toxicosis response in
rats is reduced liver weight (Settivari et al., 2006). Chestnut et al. (1992) noted that this
reduction in liver weight in rats fed an E+ diet is also observed in rats fed a control diet at
the same caloric level (i.e., pair-fed group). Although it is possible that the clinical signs
associated with fescue toxicosis are due to both direct and indirect (i.e., reduced caloric
intake) effects on hepatic function, the objective of this preliminary study was to
determine the overall impact of fescue toxicosis on hepatic gene expression under short-
term heat stress conditions. A previous study at TN revealed that various genes associated
with energy metabolism, and both antioxidant and immune systems were down-regulated,
whereas genes involving xenobiotic metabolism and gluconeogenesis were up-regulated
154
in rats fed an E+ diet for five days (Settivari et al., 2006). This research is one of the first
attempts to determine changes in hepatic gene expression associated with fescue toxicosis
during short-term heat stress. It was hypothesized that the exacerbated clinical signs of
ergot alkaloid exposure observed in rats following short-term heat stress would be
associated with significant genomic alterations consistent with the pathogenesis of fescue
toxicosis in animal species.
3. MATERIALS AND METHODS
Animals and treatment diets
Male Sprague-Dawley rats (n = 12; 42 days of age at start; Charles River
Laboratories, Willington, MA), were maintained on a 12 h light/dark cycle and at TN as
described earlier (Spiers et al., 2005a; Settivari et al., 2006). Feed and water were
provided ad libitum throughout the study. Uninfected control (E-, containing endophyte
free fescue seed) and treatment diet compositions were as previously described, with the
treatment diet adjusted to provide a specific amount of ergovaline (EV) (Spiers et al.,
2005a), which is considered to be the major ergopeptine alkaloid in E+ seed. Ergovaline
content in E+ seed was 4,100 ppb on a DM basis, as measured by HPLC (detection limit
= 50 ppb and CV = 7 %; Rottinghaus et al., 1993). All diets were stored at 4°C prior to
use. Animal procedures followed guidelines for humane treatment set by the University
of Missouri Animal Care and Use Committee.
155
Treatment period and sample collection
The experimental schedule consisted initially of an 8 day recovery period after
i.p. implantation of telemetric temperature transmitters (Model VM-FH; Mini-Mitter
Company, Inc., Bend, OR) to monitor Tc. This was followed by a 5 day pretreatment
period, during which Tc, FI and BW were collected to establish a baseline for statistical
analysis (Spiers et al., 2005a). During recovery and pretreatment periods, rats were fed
the E- diet, whereas during the 8 day treatment period, the rats were fed the E+ (91.5 µg
of EV.kg of BW-1.day-1) diet. At the end of 5 days of treatment, rats were divided into
two groups, one maintained under continuous HS (31˚C) and the other continuing at TN
for three additional days. During treatment Tc was collected at 10 minute intervals, with
daily measurement of FI and BW at 0800 hour. At the end of the study, rats were
anesthetized by i.m. injection of a xylazine (13 mg/mL)-ketamine (87 mg/mL) cocktail
(0.1 mL/100g) and exsanguinated, and liver was collected and weighed. A transverse
section from the middle lobe of liver (~5 g) was fixed in 10% neutral buffered formalin
for CYP3A1 immunohistochemistry (IHC)and terminal dUTP nick-end labeling
(TUNEL), and another portion (~5 g) was snap-frozen in liquid nitrogen for microarray,
real time-PCR, and antioxidant enzyme activity analysis. Serum prolactin (PRL)
concentrations were determined using rat prolactin enzyme immunoassay kit (SPI – BIO,
Massy Cedex, France) as previously reported (Duhau et al., 1991).
Statistical analysis of physiological responses
Daily average values for Tc, FI and BW were computed as a function of time and
treatment group. These parameters were analyzed by repeated measures ANOVA (Mixed
procedure) of SAS (SAS Inst., Inc., Cary, NC) standard least square model fit (JMP®,
156
SAS Institute Inc., Cary, NC) using treatment, time and animal as class variables to
determine overall treatment and time-related differences, and treatment X time
interactions. Enzyme activities and densitometric values for various parameters were
analyzed for significance using one-way analysis of variance and proc univariate analysis
of SAS. If a significant difference existed for any comparison, then a Tukey - Kramer
multiple comparisons test (Steele and Torrie, 1980) was performed (α = 0.05) to
determine specific effects. All data is reported as mean ± standard error of mean. A p-
value less than 0.05 were considered significant between E- and E+ rats.
Microarray slide preparation
Microarray slides were prepared by printing 27,000 oligonucleotides (70 mer
probes with an amino modification on the 5’ end) specific to mouse liver (Oligator
MEEBO mouse genome set, Illumina Inc., Hayward, CA) on GAPS II glass slides
(Corning Incorporated, Corning, NY) using a 32-pin robotic microarray printer. Prior to
hybridization, the microarray slides were re-hydrated to increase the spot size and spread
the DNA more uniformly within each spot. Following the re-hydration for 30 seconds at
55°C, the slides were snap-dried on a 100°C hot plate surface for 5 seconds. Then the
slides were UV cross-linked using UV cross-linker (600 mJoules). Microarray slides
were then incubated in 0.2% I-block (Tropix/Serva, Heidelberg, Germany) in 1 × PBS
buffer for at least one hour at 42˚C to decrease background and increase specificity. The
slides were then washed with 0.2% SDS once and water twice (three minutes per wash).
The slides were then dried by centrifugation and stored in dark until used.
157
RNA extraction
Total RNA was extracted from the liver samples using an RNeasy Midi Kit
(Qiagen Inc., Valencia, CA), purified using DNase-1 (Ambion Inc., Austin, TX) and
phenol:chloroform:isoamyl alcohol (25:24:1), and concentrated using Microcon YM30
filters (Millipore Corp., Bedford, MA) as described earlier (Settivari et al., 2006). The
quality and integrity of the purified RNA was checked through agarose gel
electrophoresis and the quantity was measured using an ND-1000 spectrophotometer
(Nanodrop Technologies, Wilmington, DE; Flanagan, 2005). The purified RNA samples
were preserved at -80˚C until used.
Microarray hybridization
A loop design was used for microarray experiments, with six biological replicates
(six animals/treatment group) and three technical replicates (each RNA sample repeated
on three different arrays). Concentrated and purified total RNA (15 µg) from each rat
liver was reverse-transcribed to cDNA using oligo dT (IDT DNA, Coralville, IA),
random hexamers (IDT DNA), 50 x amino-allyl dUTP (Sigma Chemicals, St. Louis,
MO), and reverse transcription (StrataScript RT, Stratagene, La Jolla, CA). Resulting
cDNA was purified using Microcon-30 filters (Millipore) and conjugated with either Cy3
or Cy5 mono reaction dyes separately by incubating in the dark for one hour. Conjugated
cDNA was separated from free, unconjugated dye using a Qia-quick PCR purification kit
(Qiagen) following the manufacturer’s instructions. The two cDNA samples, labeled with
Cy3 and Cy5 dyes, were mixed together and dried. The dried cDNA pellet was
resuspended with the hybridization mixture, which consisted of 1 × 4-(2-hydroxyethyl)-
1-piperazineethanesulfonic acid (pH 7.0), poly A (10 µg/µL; Stratagene), rat Cot-I DNA
158
(3.2 µg/µL), 20 × standard saline citrate (SSC; Stratagene), and 10% sodium dodecyl
sulfate (SDS). The slides were incubated in a water bath (60°C) for 12 to 16 h. After
incubation, the slides were rinsed in wash solution I (20 × SSC, and 10% SDS) and then
in wash solution II (20 × SSC).
Microarray slide scanning and analysis
Microarray slides were scanned using a GenePix 4000B Microarray Scanner
(Axon Instruments, Union City, CA) at five µm resolution, and the image was analyzed
using GenePix Pro 4.0.1.12 software (Axon Instruments Inc., Union City, CA). The
resulting files and the images were linked together and stored in the local BioArray
Software Environment (BASE) database (Saal et al., 2002). Microarray raw data files
were deposited with the National Center for Biotechnology Information Gene Expression
Omnibus (http://www.ncbi.nlm.nih.gov/projects/geo/). The serial entry number for the
microarray data was GSE8390, and the platform number was GPL5357. Each
hybridization in the microarray experiment was given the following serial numbers:
GSM202415, GSM206879, GSM206881, GSM206885, GSM206897, GSM206901,
GSM206903, GSM206905, GSM206906, GSM206983, GSM206984, GSM207053,
GSM207096 , GSM207097, GSM207098, GSM207099, GSM207100 , GSM207101,
GSM207102, GSM207103, GSM207105, GSM207106, GSM207107, GSM207115,
GSM207117, GSM207118, GSM207119, GSM207126, GSM207130, GSM207135,
GSM207141, GSM207143.
Self-self hybridization
Five self-self hybridizations were performed to measure the variation in gene
expression due to technical errors. In these, the same rat was used for different RNA
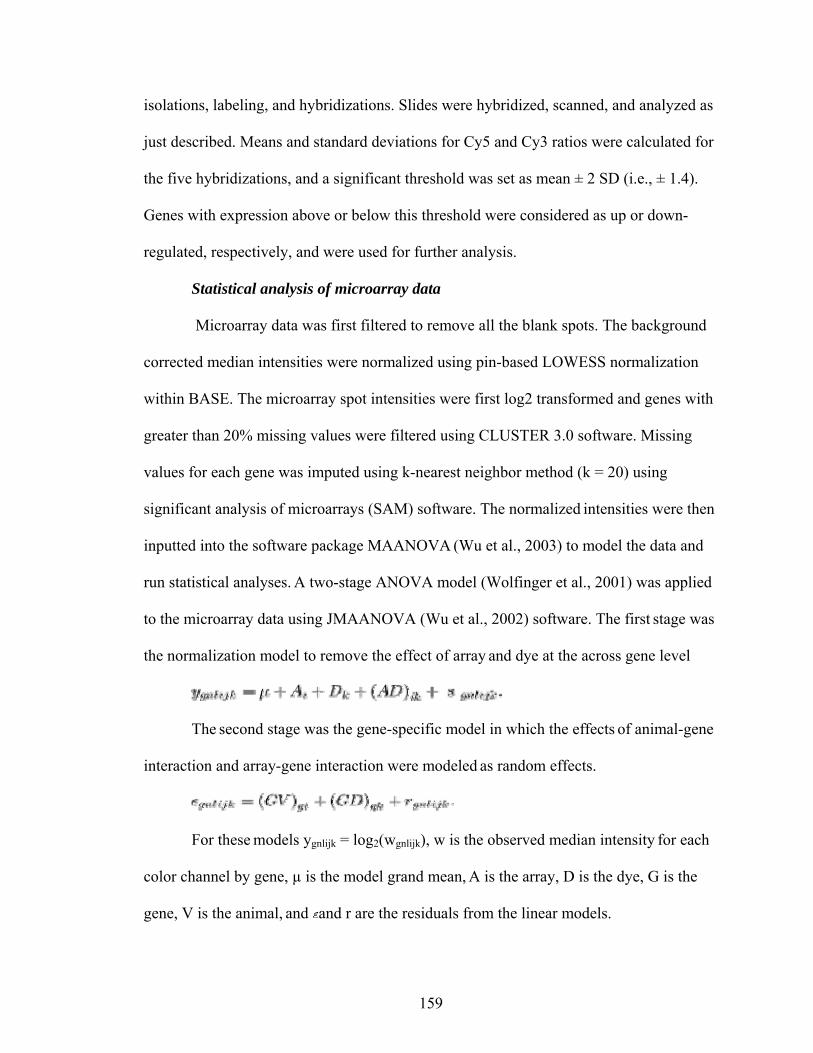
159
isolations, labeling, and hybridizations. Slides were hybridized, scanned, and analyzed as
just described. Means and standard deviations for Cy5 and Cy3 ratios were calculated for
the five hybridizations, and a significant threshold was set as mean ± 2 SD (i.e., ± 1.4).
Genes with expression above or below this threshold were considered as up or down-
regulated, respectively, and were used for further analysis.
Statistical analysis of microarray data
Microarray data was first filtered to remove all the blank spots. The background
corrected median intensities were normalized using pin-based LOWESS normalization
within BASE. The microarray spot intensities were first log2 transformed and genes with
greater than 20% missing values were filtered using CLUSTER 3.0 software. Missing
values for each gene was imputed using k-nearest neighbor method (k = 20) using
significant analysis of microarrays (SAM) software. The normalized intensities were then
inputted into the software package MAANOVA (Wu et al., 2003) to model the data and
run statistical analyses. A two-stage ANOVA model (Wolfinger et al., 2001) was applied
to the microarray data using JMAANOVA (Wu et al., 2002) software. The first stage was
the normalization model to remove the effect of array and dye at the across gene level
The second stage was the gene-specific model in which the effects of animal-gene
interaction and array-gene interaction were modeled as random effects.
For these models ygnlijk = log2(wgnlijk), w is the observed median intensity for each
color channel by gene, µ is the model grand mean, A is the array, D is the dye, G is the
gene, V is the animal, and and r are the residuals from the linear models.
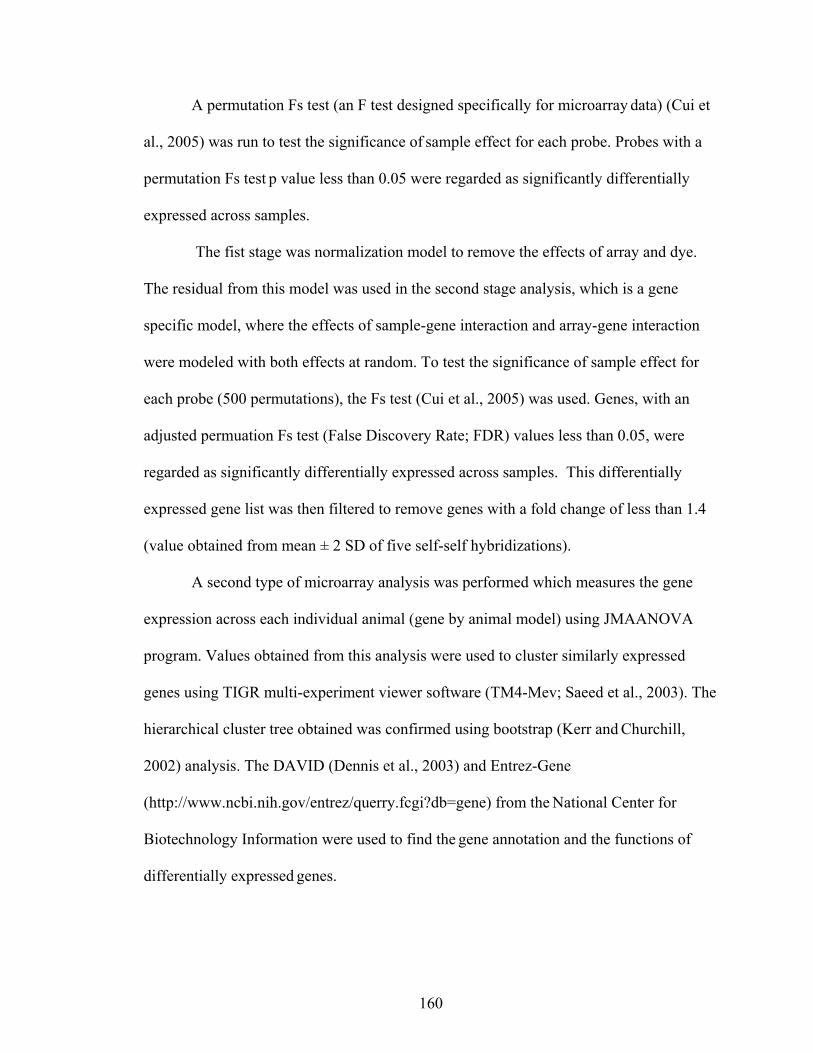
160
A permutation Fs test (an F test designed specifically for microarray data) (Cui et
al., 2005) was run to test the significance of sample effect for each probe. Probes with a
permutation Fs test p value less than 0.05 were regarded as significantly differentially
expressed across samples.
The fist stage was normalization model to remove the effects of array and dye.
The residual from this model was used in the second stage analysis, which is a gene
specific model, where the effects of sample-gene interaction and array-gene interaction
were modeled with both effects at random. To test the significance of sample effect for
each probe (500 permutations), the Fs test (Cui et al., 2005) was used. Genes, with an
adjusted permuation Fs test (False Discovery Rate; FDR) values less than 0.05, were
regarded as significantly differentially expressed across samples. This differentially
expressed gene list was then filtered to remove genes with a fold change of less than 1.4
(value obtained from mean ± 2 SD of five self-self hybridizations).
A second type of microarray analysis was performed which measures the gene
expression across each individual animal (gene by animal model) using JMAANOVA
program. Values obtained from this analysis were used to cluster similarly expressed
genes using TIGR multi-experiment viewer software (TM4-Mev; Saeed et al., 2003). The
hierarchical cluster tree obtained was confirmed using bootstrap (Kerr and Churchill,
2002) analysis. The DAVID (Dennis et al., 2003) and Entrez-Gene
(http://www.ncbi.nih.gov/entrez/querry.fcgi?db=gene) from the National Center for
Biotechnology Information were used to find the gene annotation and the functions of
differentially expressed genes.
161
Quantitative real-time PCR (qRT-PCR)
Two-step qRT-PCR was used to confirm expression patterns of differentially
expressed genes in the study. Expression profile of eight randomly selected genes (Table
6. 1) was measured with qRT-PCR. From each rat, 10 µg of total RNA was reverse
transcribed using Stratascript RT (Stratagene, La Jolla, CA) with oligo dT and random
hexamer primers. Then 6.25 ng of cDNA were added to a 25 µL PCR reaction to get a
final concentration of 0.25 ng/µL of cDNA in a SYBR green assay (Applied Biosystems,
Warrington, UK). Forward and reverse primer final concentrations were 100 nM in the
SYBR green assay. Primers were designed using Primer3 program with an annealing
temperature of 60˚C and amplification size of less than 250 base pairs. Glyceraldehyde
phosphate dehydrogenase (GAPDH) was used as the endogenous control gene in the
qRT-PCR experiments. Thermal cycling was carried out with an ABI Prism 7500
sequence detection system (Applied Biosystems Warrington, UK) under factory default
conditions ( 50°C, 2 min; 95°C 10 min; and 40 cycles at 95ºC, 15 sec; 60ºC 1 min). Each
gene was measured in triplicates and the formation of single PCR product was confirmed
using dissociation curves. Negative controls, which consisted of all the components of
PCR mix except cDNA, were used for all the primers. The relative quantification of gene
expression changes were recorded after normalizing for GAPDH gene expression
computed by using the 2-ΔΔCT method (user manual #2, ABI Prism 7700 SDS). In the 2-
ΔΔCT analysis, the threshold cycle (CT) from E+TN rats was used as a calibrator sample.
Statistical analyses of the data were performed by comparing E+HS CT with E+TN CT for
each gene using a two-tailed t-test with unequal group variance.
162
Hepatic CYP3A1 protein expression
Protein expressions were determined using a standard immunohistochemistry
protocol as described earlier (Bowles et al., 2004). Briefly, liver samples were fixed in
neutral buffered 10% formalin for a minimum of 24 hours, embedded in paraffin, and
sectioned serially at 4 μm thicknesses. Sections were floated onto positively charged
slides (Thomas Sci, Swedesboro, NJ), deparaffinized, and steamed in citrate buffer at pH
6.0 for 30 min to achieve antigen retrieval. Sections were then incubated with avidin-
biotin two step blocking solution to inhibit background staining and in 3% H2O2 to inhibit
endogenous peroxidase. The sections were incubated overnight at 4°C with a 1:500
dilution of primary rabbit monoclonal antibody to CYP3A1 (Santa Cruz, CA). Following
incubation, sections were incubated with biotinylated anti-rabbit secondary antibody in
PBS containing 15 mM sodium azide and peroxidase-labeled streptavidin (Dako LSAB+
kit, peroxidase, K0690). Images were captured at 400 x magnification (Insight Color
Camera Sterling Heights, MI).
Hepatic anti-oxidant enzyme activities
Rat liver samples of both groups were homogenized as described earlier and total
protein concentrations were determined using a Bradford protein assay kit (BioRad). The
enzyme activities of superoxide dismutase (SOD), catalase (CAT), and glutathione
peroxidase (GPx) were assayed spectrophotometrically following manufacturer’s
protocol (Cayman Chemical Company, Ann Arbor, MI). The specific activity of hepatic
GPx, SOD, and CAT was expressed as unit µg-1 liver total protein. Glutathione
peroxidase activity was measured indirectly by a coupled reaction with glutathione
163
reductase. Glutathione peroxidase reduces hydroperoxides and result in production of
oxidized glutathione, which in turn is recycled to its reduced state by glutathione
reductase and NADPH. Glutathione reductase oxidizes NADPH to NADP+, and is
accompanied by a decrease in absorbance at 340 nm. The rate of decrease in the A340 is
directly proportional to the GPx activity in the sample. One unit was defined as the
amount of enzyme that oxidized 1.0 nmol of NADPH to NADP+ per minute at 25ºC.
Hepatic SOD activity was assayed using a tetrazolium salt for detection of superoxide
radicals generated by xanthine oxidase and hypoxanthine. The enzyme activity (one unit)
was measured as the amount of enzyme required to exhibit 50% dismutation of
superoxide radicals. Hepatic catalase has peroxidatic activity, by which it acts on low
molecular weight alcohols to convert them into formaldehyde. The formaldehyde formed
was measured spectrophotometrically. Purpald, which gives maximal absorbance at 540
nm was used as a chromogen. One unit was defined as the amount of enzyme that
produced 1.0 nmol of formaldehyde per minute at 25ºC.
Apoptosis assay
Paraffin-fixed liver sections from both treatment groups were used to identify the
apoptosis rates in E+HS vs E+TN rats using TUNEL assay as previously described (Hao
et al., 2003). Fixed liver sections were deparaffinized using xylene, 100, 90 and 70%
ethanol, washed in PBS with triton X and incubated in TUNEL reaction medium (in situ
Cell Death Detection Kit, AP; Roche diagnostics corporation, Indianapolis, IN) at 37˚C
for one hour in the dark. Then the sections were washed in PBS, transferred onto 2 µg/ml
of DAPI (4’, 6-diamidine-2’-penylindole dihydrochloride; Roche), and mounted on the
slides with ProLong Antifade kit (Molecular Probes, Eugene, OR). As negative controls
164
for TUNEL, fixed hepatic sections were incubated in TUNEL reaction medium which
lacked the TdT enzyme solution. Liver sections were studied with an epifluorescent
microscope (Nikon, Tokyo, Japan) using detection for TUNEL and DAPI to visualize
apoptotic cells and DNA, respectively. The number of apoptotic nuclei and total number
of nuclei were determined for 500 cells randomly.
4. RESULTS
Physiological responses to fescue toxicosis
Pretreatment values at TN (Days -2 to 0)
Pretreatment group averages for Tc were not different (p = 0.43). Likewise,
average group feed intake (p = 0.76) and water intake (p = 0.90) did not differ during
pretreatment period. Feed conversion efficiency (FCE) was calculated as the ratio of
changes in body weight to FI multiplied by 100. There were no differences (p = 0.10)
between group pretreatment FCE. Finally, there were no differences between group
values for body weight (p = 0.19) and growth rate (p = 0.07) as a function of treatment
during pretreatment period.
Physiological responses to treatment diet at thermoneutrality (Days 1 to 5)
During TN treatment period, intake of the E+ diet did not produce significant
change (p > 0.43) in daily average Tc of E+TN and E+HS from pretreatment level.
Similarly, Tc between E+TN and E+HS was not different (p = 0.20) during this period.
Furthermore, time-related (day) changes in Tc of E+TN and E+HS rats were absent (p >
0.05) during TN treatment period.
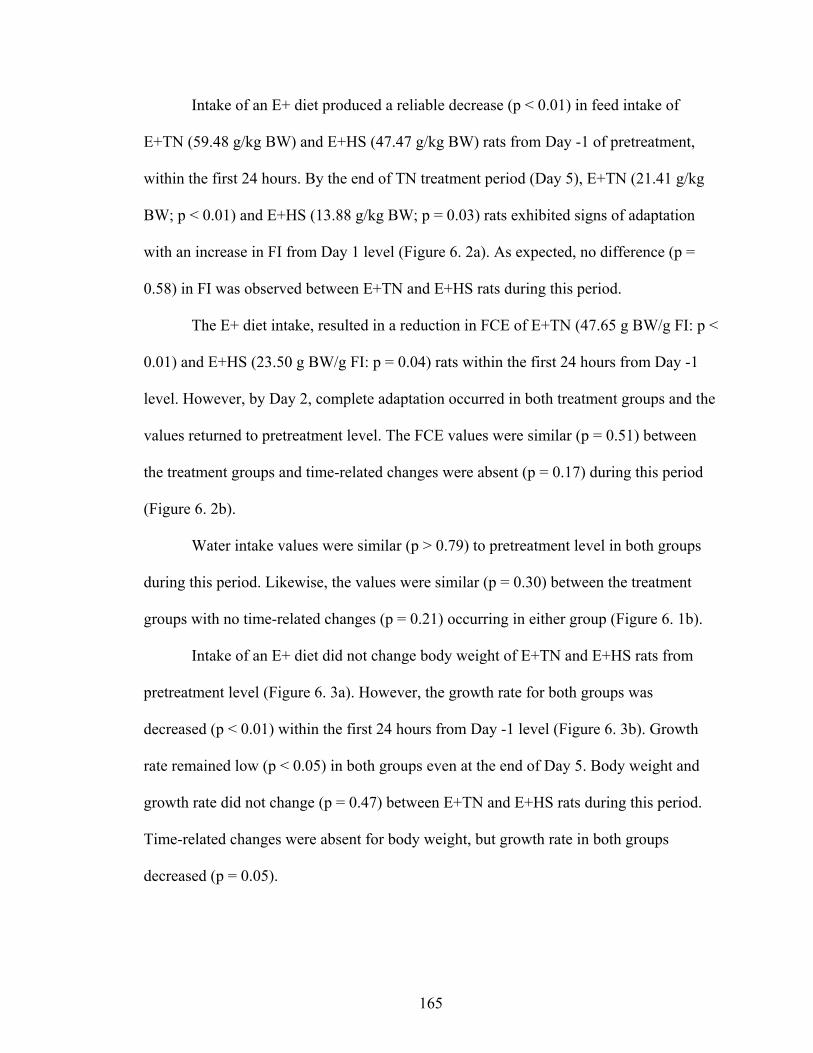
165
Intake of an E+ diet produced a reliable decrease (p < 0.01) in feed intake of
E+TN (59.48 g/kg BW) and E+HS (47.47 g/kg BW) rats from Day -1 of pretreatment,
within the first 24 hours. By the end of TN treatment period (Day 5), E+TN (21.41 g/kg
BW; p < 0.01) and E+HS (13.88 g/kg BW; p = 0.03) rats exhibited signs of adaptation
with an increase in FI from Day 1 level (Figure 6. 2a). As expected, no difference (p =
0.58) in FI was observed between E+TN and E+HS rats during this period.
The E+ diet intake, resulted in a reduction in FCE of E+TN (47.65 g BW/g FI: p <
0.01) and E+HS (23.50 g BW/g FI: p = 0.04) rats within the first 24 hours from Day -1
level. However, by Day 2, complete adaptation occurred in both treatment groups and the
values returned to pretreatment level. The FCE values were similar (p = 0.51) between
the treatment groups and time-related changes were absent (p = 0.17) during this period
(Figure 6. 2b).
Water intake values were similar (p > 0.79) to pretreatment level in both groups
during this period. Likewise, the values were similar (p = 0.30) between the treatment
groups with no time-related changes (p = 0.21) occurring in either group (Figure 6. 1b).
Intake of an E+ diet did not change body weight of E+TN and E+HS rats from
pretreatment level (Figure 6. 3a). However, the growth rate for both groups was
decreased (p < 0.01) within the first 24 hours from Day -1 level (Figure 6. 3b). Growth
rate remained low (p < 0.05) in both groups even at the end of Day 5. Body weight and
growth rate did not change (p = 0.47) between E+TN and E+HS rats during this period.
Time-related changes were absent for body weight, but growth rate in both groups
decreased (p = 0.05).
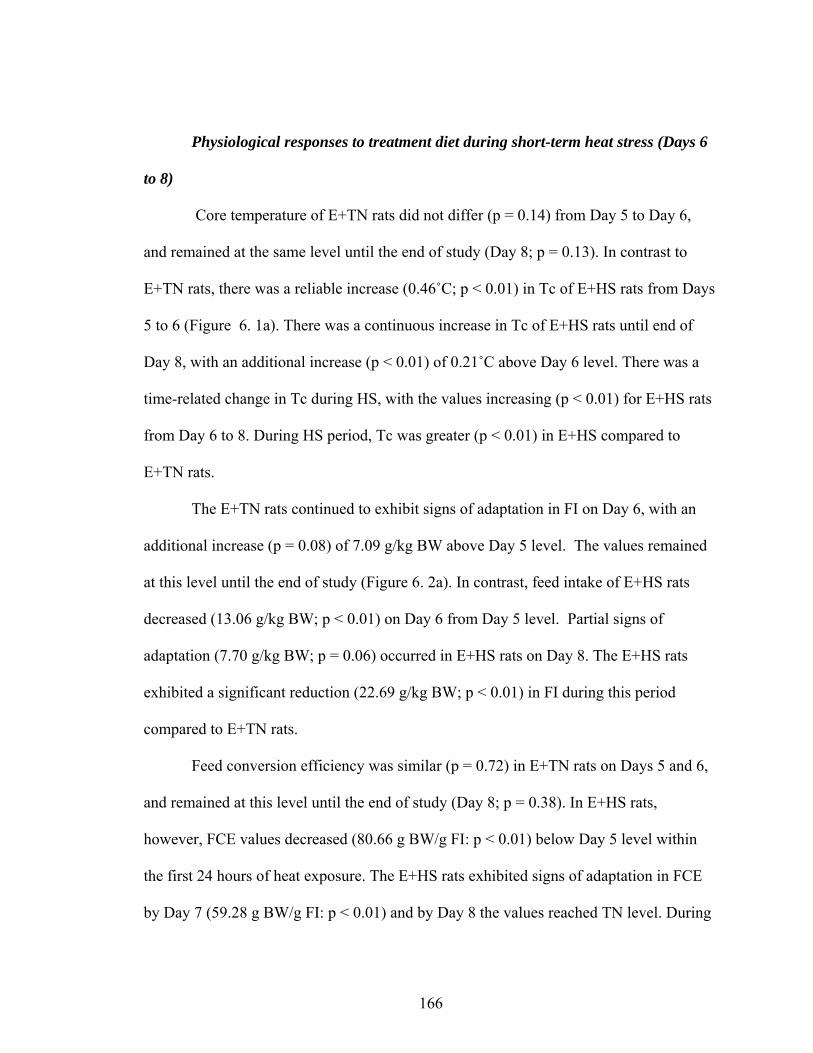
166
Physiological responses to treatment diet during short-term heat stress (Days 6
to 8)
Core temperature of E+TN rats did not differ (p = 0.14) from Day 5 to Day 6,
and remained at the same level until the end of study (Day 8; p = 0.13). In contrast to
E+TN rats, there was a reliable increase (0.46˚C; p < 0.01) in Tc of E+HS rats from Days
5 to 6 (Figure 6. 1a). There was a continuous increase in Tc of E+HS rats until end of
Day 8, with an additional increase (p < 0.01) of 0.21˚C above Day 6 level. There was a
time-related change in Tc during HS, with the values increasing (p < 0.01) for E+HS rats
from Day 6 to 8. During HS period, Tc was greater (p < 0.01) in E+HS compared to
E+TN rats.
The E+TN rats continued to exhibit signs of adaptation in FI on Day 6, with an
additional increase (p = 0.08) of 7.09 g/kg BW above Day 5 level. The values remained
at this level until the end of study (Figure 6. 2a). In contrast, feed intake of E+HS rats
decreased (13.06 g/kg BW; p < 0.01) on Day 6 from Day 5 level. Partial signs of
adaptation (7.70 g/kg BW; p = 0.06) occurred in E+HS rats on Day 8. The E+HS rats
exhibited a significant reduction (22.69 g/kg BW; p < 0.01) in FI during this period
compared to E+TN rats.
Feed conversion efficiency was similar (p = 0.72) in E+TN rats on Days 5 and 6,
and remained at this level until the end of study (Day 8; p = 0.38). In E+HS rats,
however, FCE values decreased (80.66 g BW/g FI: p < 0.01) below Day 5 level within
the first 24 hours of heat exposure. The E+HS rats exhibited signs of adaptation in FCE
by Day 7 (59.28 g BW/g FI: p < 0.01) and by Day 8 the values reached TN level. During
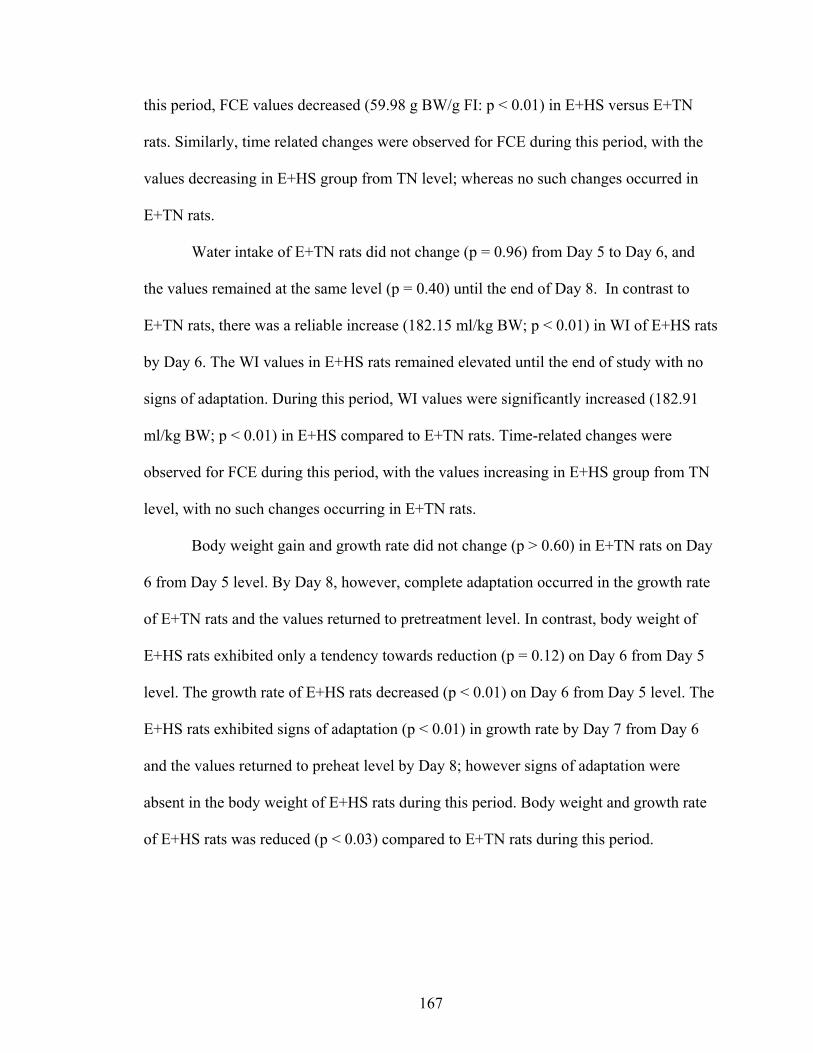
167
this period, FCE values decreased (59.98 g BW/g FI: p < 0.01) in E+HS versus E+TN
rats. Similarly, time related changes were observed for FCE during this period, with the
values decreasing in E+HS group from TN level; whereas no such changes occurred in
E+TN rats.
Water intake of E+TN rats did not change (p = 0.96) from Day 5 to Day 6, and
the values remained at the same level (p = 0.40) until the end of Day 8. In contrast to
E+TN rats, there was a reliable increase (182.15 ml/kg BW; p < 0.01) in WI of E+HS rats
by Day 6. The WI values in E+HS rats remained elevated until the end of study with no
signs of adaptation. During this period, WI values were significantly increased (182.91
ml/kg BW; p < 0.01) in E+HS compared to E+TN rats. Time-related changes were
observed for FCE during this period, with the values increasing in E+HS group from TN
level, with no such changes occurring in E+TN rats.
Body weight gain and growth rate did not change (p > 0.60) in E+TN rats on Day
6 from Day 5 level. By Day 8, however, complete adaptation occurred in the growth rate
of E+TN rats and the values returned to pretreatment level. In contrast, body weight of
E+HS rats exhibited only a tendency towards reduction (p = 0.12) on Day 6 from Day 5
level. The growth rate of E+HS rats decreased (p < 0.01) on Day 6 from Day 5 level. The
E+HS rats exhibited signs of adaptation (p < 0.01) in growth rate by Day 7 from Day 6
and the values returned to preheat level by Day 8; however signs of adaptation were
absent in the body weight of E+HS rats during this period. Body weight and growth rate
of E+HS rats was reduced (p < 0.03) compared to E+TN rats during this period.
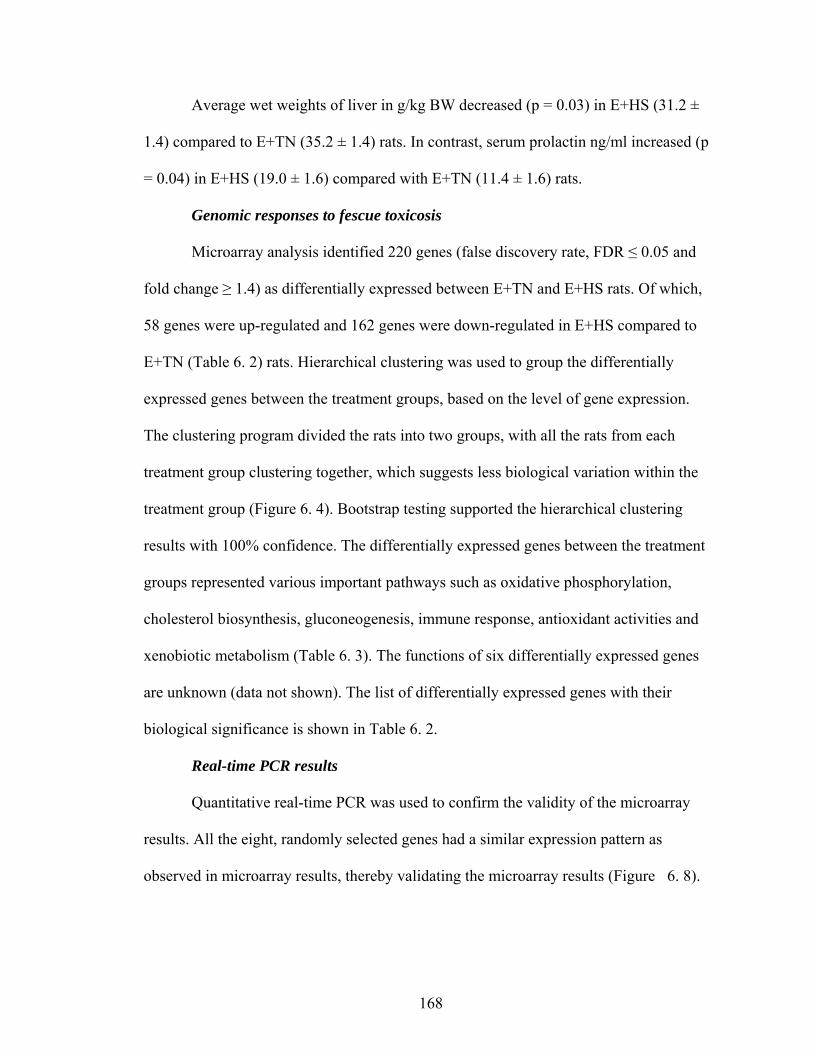
168
Average wet weights of liver in g/kg BW decreased (p = 0.03) in E+HS (31.2 ±
1.4) compared to E+TN (35.2 ± 1.4) rats. In contrast, serum prolactin ng/ml increased (p
= 0.04) in E+HS (19.0 ± 1.6) compared with E+TN (11.4 ± 1.6) rats.
Genomic responses to fescue toxicosis
Microarray analysis identified 220 genes (false discovery rate, FDR ≤ 0.05 and
fold change ≥ 1.4) as differentially expressed between E+TN and E+HS rats. Of which,
58 genes were up-regulated and 162 genes were down-regulated in E+HS compared to
E+TN (Table 6. 2) rats. Hierarchical clustering was used to group the differentially
expressed genes between the treatment groups, based on the level of gene expression.
The clustering program divided the rats into two groups, with all the rats from each
treatment group clustering together, which suggests less biological variation within the
treatment group (Figure 6. 4). Bootstrap testing supported the hierarchical clustering
results with 100% confidence. The differentially expressed genes between the treatment
groups represented various important pathways such as oxidative phosphorylation,
cholesterol biosynthesis, gluconeogenesis, immune response, antioxidant activities and
xenobiotic metabolism (Table 6. 3). The functions of six differentially expressed genes
are unknown (data not shown). The list of differentially expressed genes with their
biological significance is shown in Table 6. 2.
Real-time PCR results
Quantitative real-time PCR was used to confirm the validity of the microarray
results. All the eight, randomly selected genes had a similar expression pattern as
observed in microarray results, thereby validating the microarray results (Figure 6. 8).
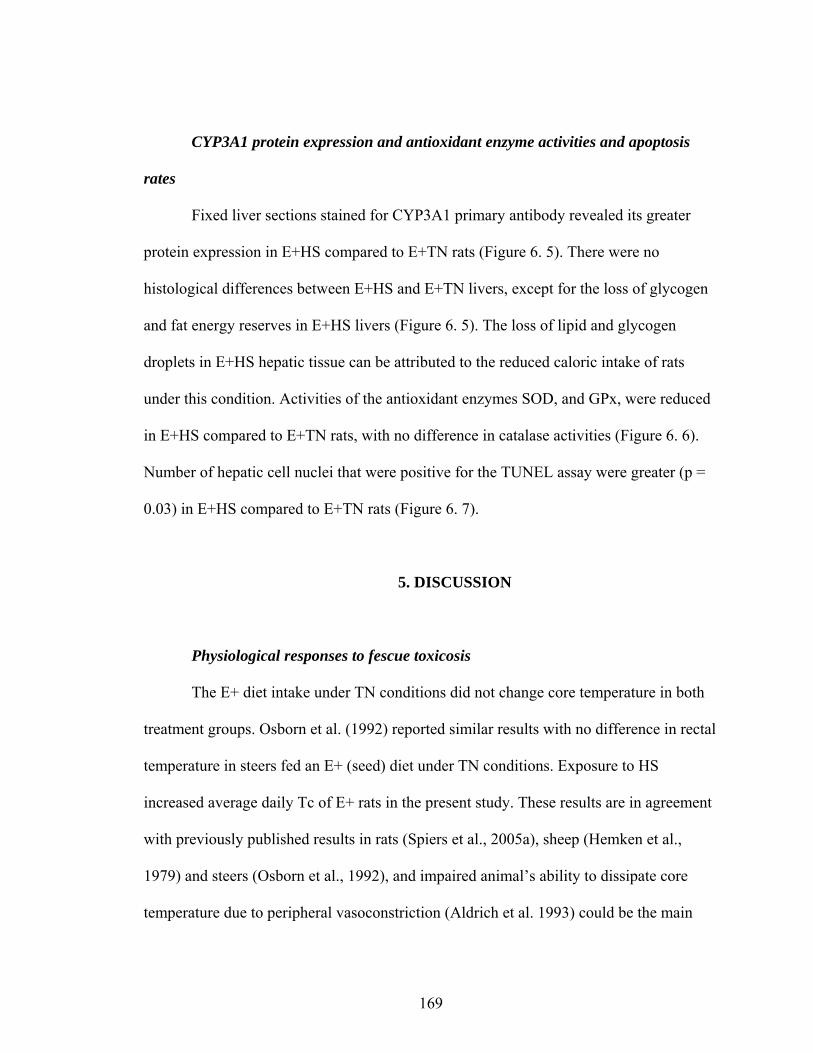
169
CYP3A1 protein expression and antioxidant enzyme activities and apoptosis
rates
Fixed liver sections stained for CYP3A1 primary antibody revealed its greater
protein expression in E+HS compared to E+TN rats (Figure 6. 5). There were no
histological differences between E+HS and E+TN livers, except for the loss of glycogen
and fat energy reserves in E+HS livers (Figure 6. 5). The loss of lipid and glycogen
droplets in E+HS hepatic tissue can be attributed to the reduced caloric intake of rats
under this condition. Activities of the antioxidant enzymes SOD, and GPx, were reduced
in E+HS compared to E+TN rats, with no difference in catalase activities (Figure 6. 6).
Number of hepatic cell nuclei that were positive for the TUNEL assay were greater (p =
0.03) in E+HS compared to E+TN rats (Figure 6. 7).
5. DISCUSSION
Physiological responses to fescue toxicosis
The E+ diet intake under TN conditions did not change core temperature in both
treatment groups. Osborn et al. (1992) reported similar results with no difference in rectal
temperature in steers fed an E+ (seed) diet under TN conditions. Exposure to HS
increased average daily Tc of E+ rats in the present study. These results are in agreement
with previously published results in rats (Spiers et al., 2005a), sheep (Hemken et al.,
1979) and steers (Osborn et al., 1992), and impaired animal’s ability to dissipate core
temperature due to peripheral vasoconstriction (Aldrich et al. 1993) could be the main
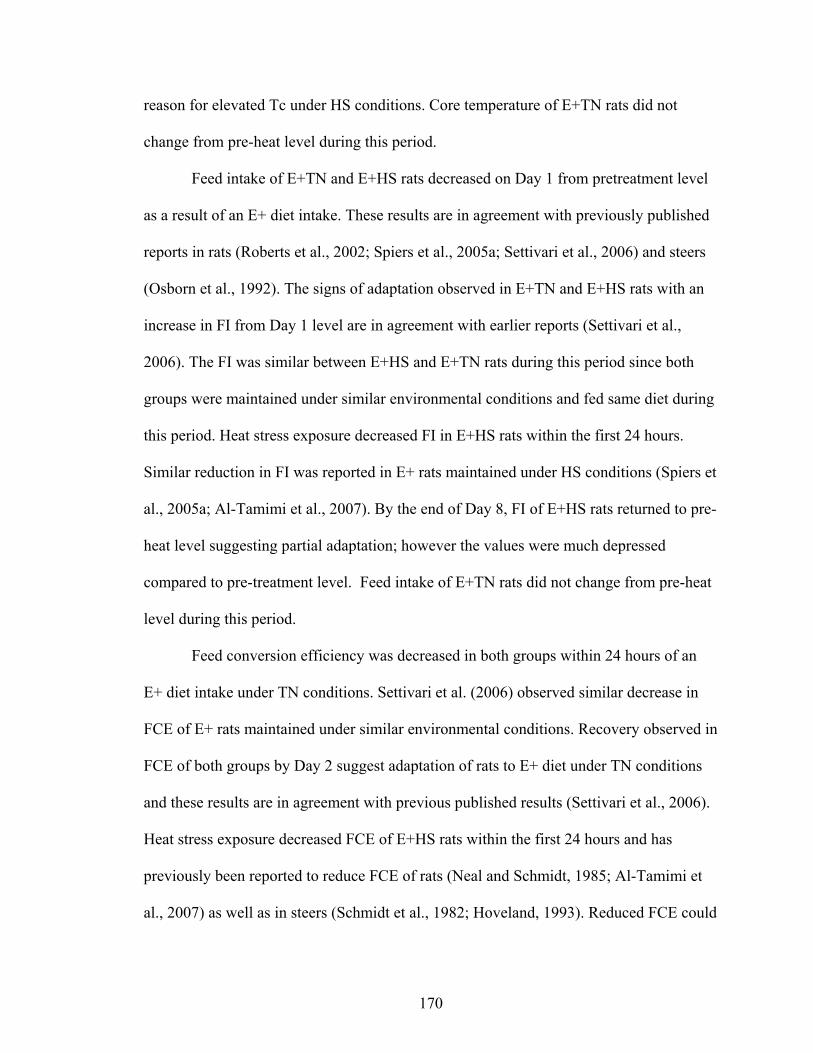
170
reason for elevated Tc under HS conditions. Core temperature of E+TN rats did not
change from pre-heat level during this period.
Feed intake of E+TN and E+HS rats decreased on Day 1 from pretreatment level
as a result of an E+ diet intake. These results are in agreement with previously published
reports in rats (Roberts et al., 2002; Spiers et al., 2005a; Settivari et al., 2006) and steers
(Osborn et al., 1992). The signs of adaptation observed in E+TN and E+HS rats with an
increase in FI from Day 1 level are in agreement with earlier reports (Settivari et al.,
2006). The FI was similar between E+HS and E+TN rats during this period since both
groups were maintained under similar environmental conditions and fed same diet during
this period. Heat stress exposure decreased FI in E+HS rats within the first 24 hours.
Similar reduction in FI was reported in E+ rats maintained under HS conditions (Spiers et
al., 2005a; Al-Tamimi et al., 2007). By the end of Day 8, FI of E+HS rats returned to pre-
heat level suggesting partial adaptation; however the values were much depressed
compared to pre-treatment level. Feed intake of E+TN rats did not change from pre-heat
level during this period.
Feed conversion efficiency was decreased in both groups within 24 hours of an
E+ diet intake under TN conditions. Settivari et al. (2006) observed similar decrease in
FCE of E+ rats maintained under similar environmental conditions. Recovery observed in
FCE of both groups by Day 2 suggest adaptation of rats to E+ diet under TN conditions
and these results are in agreement with previous published results (Settivari et al., 2006).
Heat stress exposure decreased FCE of E+HS rats within the first 24 hours and has
previously been reported to reduce FCE of rats (Neal and Schmidt, 1985; Al-Tamimi et
al., 2007) as well as in steers (Schmidt et al., 1982; Hoveland, 1993). Reduced FCE could
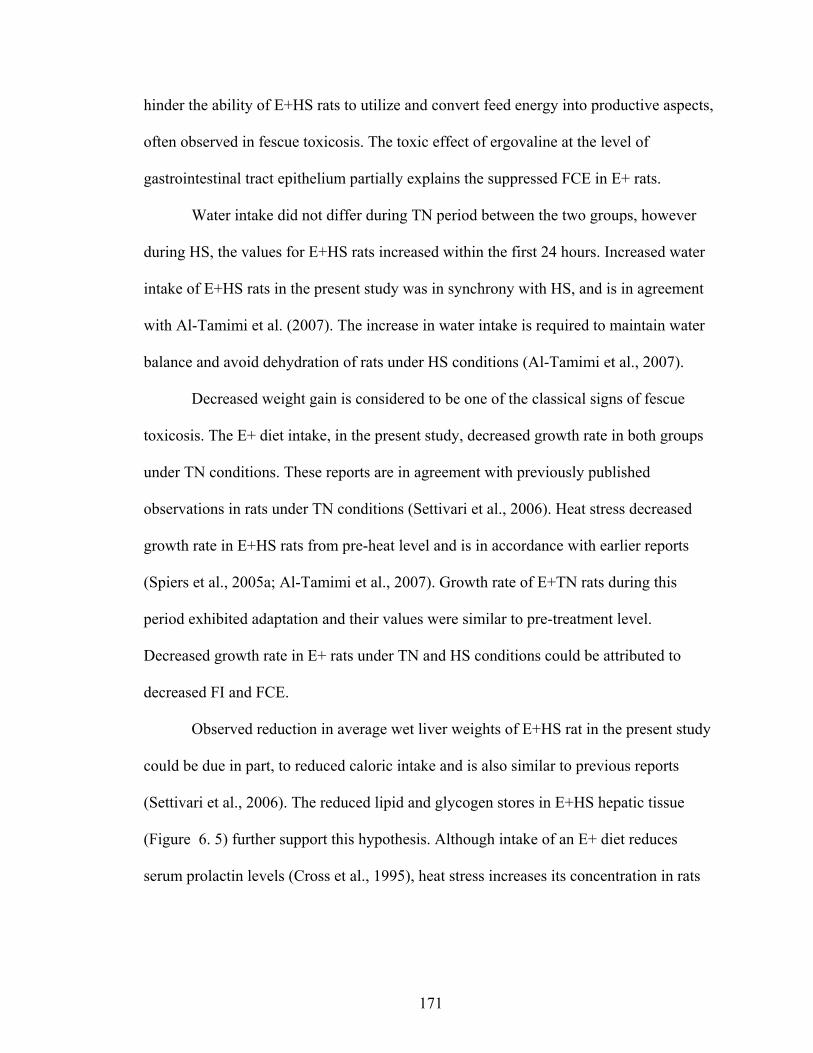
171
hinder the ability of E+HS rats to utilize and convert feed energy into productive aspects,
often observed in fescue toxicosis. The toxic effect of ergovaline at the level of
gastrointestinal tract epithelium partially explains the suppressed FCE in E+ rats.
Water intake did not differ during TN period between the two groups, however
during HS, the values for E+HS rats increased within the first 24 hours. Increased water
intake of E+HS rats in the present study was in synchrony with HS, and is in agreement
with Al-Tamimi et al. (2007). The increase in water intake is required to maintain water
balance and avoid dehydration of rats under HS conditions (Al-Tamimi et al., 2007).
Decreased weight gain is considered to be one of the classical signs of fescue
toxicosis. The E+ diet intake, in the present study, decreased growth rate in both groups
under TN conditions. These reports are in agreement with previously published
observations in rats under TN conditions (Settivari et al., 2006). Heat stress decreased
growth rate in E+HS rats from pre-heat level and is in accordance with earlier reports
(Spiers et al., 2005a; Al-Tamimi et al., 2007). Growth rate of E+TN rats during this
period exhibited adaptation and their values were similar to pre-treatment level.
Decreased growth rate in E+ rats under TN and HS conditions could be attributed to
decreased FI and FCE.
Observed reduction in average wet liver weights of E+HS rat in the present study
could be due in part, to reduced caloric intake and is also similar to previous reports
(Settivari et al., 2006). The reduced lipid and glycogen stores in E+HS hepatic tissue
(Figure 6. 5) further support this hypothesis. Although intake of an E+ diet reduces
serum prolactin levels (Cross et al., 1995), heat stress increases its concentration in rats
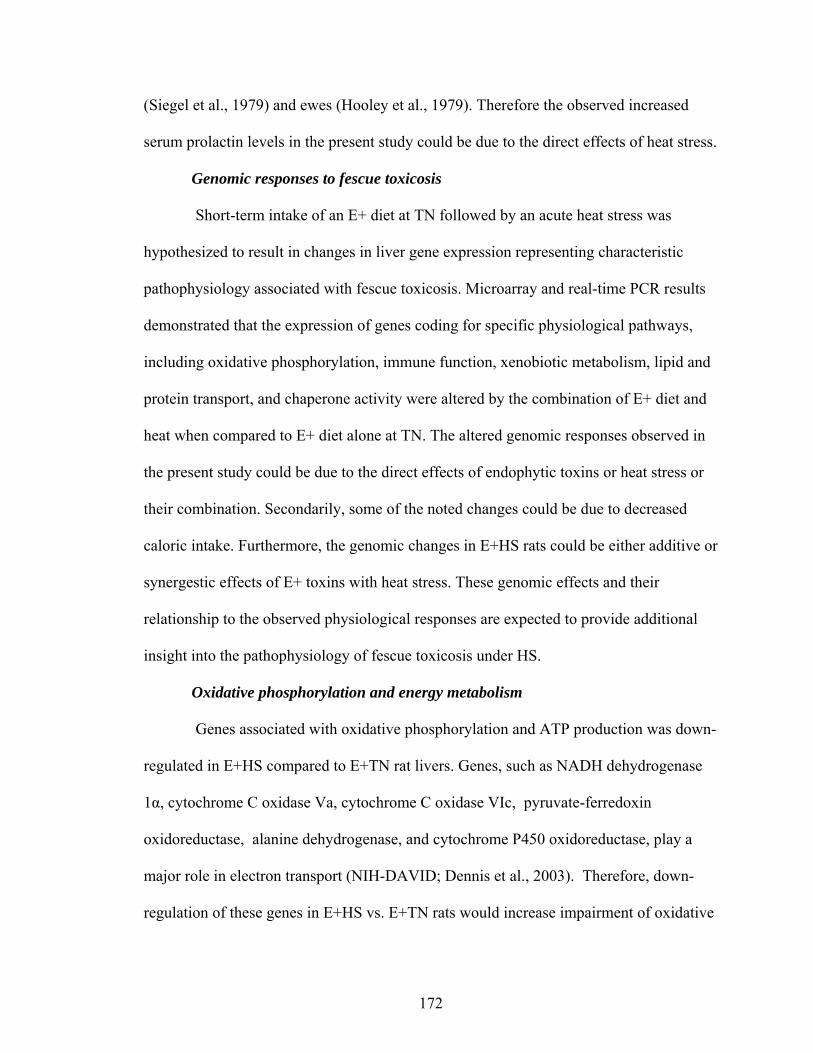
172
(Siegel et al., 1979) and ewes (Hooley et al., 1979). Therefore the observed increased
serum prolactin levels in the present study could be due to the direct effects of heat stress.
Genomic responses to fescue toxicosis
Short-term intake of an E+ diet at TN followed by an acute heat stress was
hypothesized to result in changes in liver gene expression representing characteristic
pathophysiology associated with fescue toxicosis. Microarray and real-time PCR results
demonstrated that the expression of genes coding for specific physiological pathways,
including oxidative phosphorylation, immune function, xenobiotic metabolism, lipid and
protein transport, and chaperone activity were altered by the combination of E+ diet and
heat when compared to E+ diet alone at TN. The altered genomic responses observed in
the present study could be due to the direct effects of endophytic toxins or heat stress or
their combination. Secondarily, some of the noted changes could be due to decreased
caloric intake. Furthermore, the genomic changes in E+HS rats could be either additive or
synergestic effects of E+ toxins with heat stress. These genomic effects and their
relationship to the observed physiological responses are expected to provide additional
insight into the pathophysiology of fescue toxicosis under HS.
Oxidative phosphorylation and energy metabolism
Genes associated with oxidative phosphorylation and ATP production was down-
regulated in E+HS compared to E+TN rat livers. Genes, such as NADH dehydrogenase
1α, cytochrome C oxidase Va, cytochrome C oxidase VIc, pyruvate-ferredoxin
oxidoreductase, alanine dehydrogenase, and cytochrome P450 oxidoreductase, play a
major role in electron transport (NIH-DAVID; Dennis et al., 2003). Therefore, down-
regulation of these genes in E+HS vs. E+TN rats would increase impairment of oxidative
173
phosphorylation as well as electron leak, resulting in formation of superoxide radicals.
Furthermore, down-regulation of genes associated with ATP production, such as ATPase
H+ transporting and ATP synthase, could reduce energy utilization (NIH-DAVID; Dennis
et al., 2003). Settivari et al. (2006) observed down-regulation of various genes associated
with oxidative phosphorylation and ATP synthesis in E+ compared to E- rats at
thermoneutral conditions. Therefore, it can be speculated that under HS, oxidative
phosphorylation and ATP synthesis pathways are more severely affected in E+ fed
animals.
Optimum concentration of cellular sodium and potassium are essential for
maintenance of cell potential and regulation of cellular volume. Sodium export from cell
provides the driving force for several facilitated transports, which import glucose, amino
acids and other nutrients into cell (NIH-DAVID; Dennis et al., 2003). The intracellular
Na and K concentrations are maintained by NA+/K+- ATPase (Konobasova et al., 1985).
Also, carnitine palmitoyl transferase 1a (CPT1A) transports long chain fatty acids into
mitochondria for energy release especially when the hepatic glycogen is depleted during
starvation (Shin et al., 2006). Down-regulation of NA+/K+- ATPase and CPT1A genes in
E+HS compared to E+TN rats might further result in impaired energy utilization.
Various genes associated with nutrient transportation are down-regulated in E+ compared
to E- rats at TN (Settivari et al., 2006). Down-regulation of various transporter genes in
E+HS in the present study compared to E+TN rats suggest greater impact of E+ diet
under HS conditions. Impaired energy utilization was previously reported in calves
exposed to HS alone (Baccari et al., 1983) or E+ fed rats (Neal and Schmidt, 1985) under
HS condition. To compensate for the reduced caloric intake and energy utilization, genes
174
associated with carbohydrate, lipid and protein metabolism were up-regulated to turn on
the gluconeogenesis pathways (Table 6. 2). However, under TN genes associated with
lipid and carbohydrate metabolism were down-regulated, but protein catabolism was up-
regulated in E+ versus E- rats. Greater reduction in feed intake and FCE in E+ fed rats
during HS might explain the reason for up regulation of various gluconeogenic genes in
the present study.
Serum lipid and cholesterol levels
Various genes associated with lipogenesis, such as stearoyl-coenzyme A
desaturase, thyroid hormone-responsive spot 14, thyroid hormone-responsive spot 14
homolog, lipogenic protein S14, putative delta 6-fatty acid desaturase, fatty acid
desaturase 1, arylformamidase, triose-phosphate isomerase, isopentinyl-diphosphate delta
isomerase 1, acetyl co A acetyltransferase 2, and adipose differentiation related protein
were down-regulated in E+HS compared to E+TN rats. Similarly, many genes coding for
cholesterol biosynthesis, such as NADPH-dependent butanol dehydrogenase, Cyp51,
protein kinase AMP activated beta 1 non-catalytic subunit, insulin induced gene 1,
isopentinyl diphosphate delta isomerase, NADPH steroid dehydrogenase-like protein, IPP
isomerase, and 24-dehydroxy cholesterol reductase were down-regulated in E+HS
compared to E+TN rats. Vimentin transports majority of the cholesterol into
mitochondria, where it is converted to steroids (NIH-DAVID; Dennis et al., 2003).
Down-regulation of vimentin in E+HS vs. E+TN rats could result in impaired
steroidogenesis. In addition, many other genes associated with steroidogenesis such as
RAR-related orphan receptor c, ald protein, and t-complex protein 1 were also down-
regulated in E+HS compared to E+TN rats. Cytochrome P450 8B1 plays a major role in
175
cholic acid biosynthesis from cholesterol and its expression is inversely proportional to
serum cholesterol levels (Chen et al., 2005). Up-regulation of this gene in E+HS versus
E+TN further suggests a possible mechanism for reduction of serum cholesterol levels in
E+HS rats. Cytochrome P450 7A1 is a rate-limiting enzyme for bile acid synthesis from
cholesterol (Chen et al., 2005). Down-regulation of this gene in E+HS versus E+TN
could impair the ability to absorb dietary lipids in the intestine. Reduced serum
cholesterol and total lipid levels have been reported in cattle grazing on E+ pasture under
HS conditions (Stuedemann et al., 1985). Intake of an E+ diet at TN down-regulates
various genes associated with sex-steroid metabolism, cholesterol, and lipid metabolism
in mice (Bhusari et al., 2006) and rats (Settivari et al., 2006). Down-regulation of these
pathways in E+HS in the present study suggest greater impact of fescue toxicants on
cholesterol and steroid biosynthesis under HS, which again support the well-
characterized clinical sign of fescue toxicosis (i.e., reduced male and female reproductive
efficiency).
Immune response
Many genes associated with immune function, such as haptoglobin, conserved
helix-loop-helix ubiquitous kinase, protein tyrosine phosphatase 4a1, ccaat/enhancer
binding protein beta, cyclophilin, rap guanine nucleotide exchange factor, fc fragment of
igg receptor transporter alpha, fc receptor igg alpha chain transporter, neonatal fc
receptor, macrophage migration inhibitor factor, and il2-inducible t-cell kinase were
down-regulated in E+HS compared to E+TN rats. Similar reduction in genes coding for
immune system was reported earlier in E+ versus E- rats under TN conditions (Settivari
et al., 2006). Present results suggest a further reduction in the immune system efficiency
176
in E+ fed rats under HS conditions. Decreased immune response, red and white blood cell
counts, response to mitogens, and increased T-suppressor cell number in the spleen were
previously observed in fescue toxicosis (Dew et al., 1999; Filipov et al., 1999). Greater
susceptibility of E+ mice to subcutaneous injection of cytokines, and less tolerance of
cattle grazing on E+ pastures to the effects of lipopolysaccharides (Filipov et al., 1999a,
b) further suggest that fescue toxicants make animals more susceptible to various
stressors.
Detoxification and antioxidant activity
Primary hepatic detoxification processes include xenobiotic biotransformation
(phase I metabolism) and the subsequent conjugation of the resulting metabolites (phase
II metabolism), making them more water soluble and available for excretion from the
body. Phase I metabolism mainly involves the cytochrome P450 (CYP) and flavin
monooxygenase enzymes. Cytochrome P450 2B10, which is orthologous to human
CYP2B6, is known to metabolize various drugs and xenobiotics (Gnerre et al., 2005).
Similarly, CYP2J13 is orthologous to human CYP2J2 and is known to be actively
involved in xenobiotic metabolism (Yamazaki et al., 2006). The flavin-containing
monooxygenase gene catalyzes the NADPH and oxygen-dependent oxidation of several
drugs and xenobiotics (Ziegler, 2002). Down-regulation of this gene further hampers
E+HS rat’s ability for detoxification. Other genes associated with xenobiotic metabolism
include CYP51, CYP2C70, and alcohol dehydrogenase. All these genes were down-
regulated in E+HS compared to E+TN rats, to potentially impair xenobiotic metabolism.
In contrast to the present findings, E+ fed rats under TN condition (Settivari et al., 2006)
had greater gene expression for various CYP isoforms compared to controls.
177
Hepatic protein expression of CYP3A1 was greater in E+HS versus E+TN
(Figure 6. 5) in the present study. Bhusari et al. (2006) observed a similar increase in
CYP3A expression in E+HS mice compared to E+TN mice. Moubarak et al. (2000)
observed hydroxylation of ergotamine (a constituent of fescue toxins) by CYP3A present
in beef liver microsomes. In another study, Moubarak et al. (2003b) induced CYP3A
levels in rat liver microsomes and then treated the preparation with ergotamine. This
produced a greater metabolism of ergotamine than in controls due to CYP3A-induced
microsomes, and resulted in production of dihydroxy derivatives. Peyronneau et al.
(1994) reported metabolism of bromocriptine, an ergot alkaloid similar to ergotamine, by
CYP3A in rat liver microsomes treated with dexamethasone, a CYP3A inducer. They
also reported that ergopeptides, like bromocriptine, ergocryptine, and dihydro-
ergotamine, exhibit high affinity for rat CYP3A. Althus et al. (2000) observed the
metabolism of another ergot alkaloid, alpha-dihydroergocryptine, by CYP3A isoforms.
Therefore, it can be speculated that up-regulation of CYP3A1 in E+HS would result in
greater metabolism of ergot alkaloids associated with fescue toxicosis. Differences in the
expression pattern of various CYP isoforms, in the present study, suggest the complexity
associated with the effects of E+ diet on different CYP isoforms.
The liver is one of the major sites for heme synthesis, and 2/3rd of the heme
synthesized in liver is utilized for the formation of CYP (Fujita, 1997). However, many
genes associated with heme biosynthesis such as transferrin, transferrin receptor,
aminolevulinic acid synthase (rate limiting enzyme for heme biosynthesis),
uroporphyrinogen decarboxylase, and kallikrein b were down-regulated in E+HS
compared to E+TN rat hepatic tissue. Down-regulation of various genes associated with
178
heme biosynthesis could, at least in part, explain the reason for reduced CYP gene
expression in E+HS rats.
Gamma glutamate-cysteine ligase (GCL), a rate-limiting enzyme in glutathione
(GSH) synthesis, was down-regulated in E+HS rats in the present study. Glutathione,
which constitutes up to 10% of cytosolic proteins in mammalian cells, is also an
important free radical scavenger in the cell (DuTeaux et al., 2004). Therefore, down-
regulation of GCL in E+HS compared to E+TN rats could hamper the rat’s ability for
glutathionation, thereby altering its redox status. Other important enzymes which play a
major role in hepatic phase II detoxification and free radical neutralization, such as
epoxide hydrolases (Ephx), hydroxyl glutathione hydrolase, and triosephosphate
isomerase, superoxide dismutase and stearoyl-coenzyme A desaturase I, were down-
regulated in E+HS compared to E+TN rats. Down-regulation of the above mentioned
genes in E+HS rats would result in reduced ability of the rats to neutralize various free
radicals, such as superoxide radicals, produced as a result of electron leak during
oxidative phosphorylation.
One of the primary enzymatic defenses against reactive oxygen species is SOD,
which catalyses the conversion of superoxide anions into H2O2 (Scandalios, 1997).
Enzyme activity of SOD was reduced in E+HS versus E+TN rats in the present study
(Figure 6. 6), making them more susceptible to superoxide radical associated oxidative
stress. About 50% reduction in SOD results in a functional decline of oxidative
phosphorylation and an increase in oxidative stress apoptosis rates (Wheeler et al., 2001).
Another important antioxidant enzyme in cell, GPx converts harmful H2O2 into water and
molecular oxygen (Liska, 1998). In the present study, decreased enzyme activity of GPx
179
in E+HS rats could hamper the rat’s ability to neutralize H2O2. The H2O2 undergo
hemolytic scission on the inner mitrochondrial membrane and mitochondrial matrix
causing site-specific damage of critical matrix targets. Its decomposition outside the
mitochondria may cause damage to the outer mitochondrial membrane itself and /or
cytosolic targets, within the diffusion limit of hydroxyl radical (Liska, 1998). It is
anticipated that cells containing low levels of one or more of these enzymes would be
particularly vulnerable to oxidative damage (Liska, 1998; Tiedge et al., 1998). Lakritz et
al. (2002) reported reduced blood glutathione levels in E+ fed cattle, compared to
controls, during heat stress. Gorini et al. (1988) observed a reduction in forebrain
glutathione levels in male rats after repeated ip injection of dihydroergocristine and
dihydroergocryptine. Earlier reports suggest that rats fed with an E+ diet at TN exhibit a
similar reduction in gene expression of various phase II enzymes and antioxidants
(Settivari et al., 2006). The current findings imply that E+ diet fed rats experience greater
oxidative stress and impaired detoxification processes under HS than at TN conditions. In
contrast to the present findings, Bhusari et al. (2007) observed an up-regulation of
various antioxidants in E+ diet fed mice at the end of two week HS exposure. Differences
in the species and exposure time could be the reasons for the observed alterations for the
effects of E+ on antioxidant enzymes.
Cell proliferation and apoptosis
Intake of an E+ diet during HS down-regulated various genes associated with
apoptosis inhibition, including apoptosis inhibitor 5, neuronal apoptosis inhibitory protein
related sequence 4, and prothymosin alpha. Also, the genes associated with apoptosis,
such as amyloid beta precursor protein binding protein 1, notch gene homolog 2,
180
peptidyl-prolyl cis-trans isomerase a, and ring finger protein 125 were up-regulated in
E+HS compared to E+TN rats. Earlier reports suggest similar hepatic gene expression
pattern in E+ diet fed rats, even under TN conditions (Settivari et al., 2006). Therefore,
the present study implies that intake of the E+ diet during HS produces a greater
hepatocyte apoptosis rate. Increased TUNEL positive hepatocytes, observed with
TUNEL assay, further validated the current microarray results (Figure 6. 7). A
combination of E+ toxins, heat stress, and reduced caloric intake could have contributed
to the increased TUNEL positive hepatic nuclei in the E+HS group.
Cell proliferation is a representation of cell growth and active division. Fescue
toxicants, in the present study, down-regulated many genes associated with cell
proliferation, including microtubule-associated protein rp/eb family member 2, ornithine
decarboxylase, phosphoinositide-3-kinase regulatory subunit, beta actin, glycogen
synthase kinase 3 beta, protein phosphatase 2 a catalytic subunit alpha, cyclin D1, cyclin
A2, cyclin L2, tyrosine protein kinase, go/g1 switch gene 2, eukaryotic translation
initiation factor 4a1, lim and senescent cell antigen-like domain 1, and eukaryotic
translation initiation factor 4a in E+HS compared to E+TN rats. Down-regulation of these
genes could contribute to reduce cell proliferation rates in E+ diet fed rats under HS.
Chaperones
Chaperones, such as heat shock proteins, are up-regulated in response to a wide
variety of stressors, including oxidative stress, starvation, hyperthermia, and exercise
(Marshall et al., 2006). The E+HS rats in the present study were exposed to three
different stressors i.e., E+ toxicants, heat stress, and reduced caloric intake; and therefore
the chaperone activity in this group was expected to be greater compared to E+TN rats.
181
However, genes coding for chaperone activity such as peptidyl-prolyl cis trans isomerase
a, peptidyl prolyl isomerase a, homocysteine-inducible endoplasmic reticulum stress
inducible ubiquitin like domain member 1, heat shock protein 70 kda protein 8 (Hspa8),
heat shock protein 90 kda protein 1 beta, heat shock protein 105 (Hsp105), chaperone
containing tcp1 subunit 5, dnaj (hsp40) homolog subfamily b1, dnaj (hsp40) homolog
subfamily b6, dnaj (hsp40) homolog subfamily b11, dnaj (hsp40) homolog subfamily a2,
and rotamase were down-regulated in E+HS compared to E+TN rats. Real-time PCR
further confirmed the down-regulation of Hspa8 and Hsp105 in E+HS vs. E+TN rats
(Figure 6. 8). In stressed cells, heat shock factor 1 (HSF1) mediates the induction of heat
shock protein gene expression. In response to stress, HSF1 undergoes stress-induced
modifications at lysine 298 by the small ubiquitin-like modifier 1 (SUMO-1). Upon this
modification, HSFI acquires DNA binding ability and localizes to nuclear stress granules,
to drive the expression of various HSPs (Hong et al., 2001). In the present study, gene
expression of HSF1 and SUMO-1 was measured using real-time PCR. Gene expression
of HSF1 was similar (p = 0.95) between E+HS (dCT value = 1.58) and E+TN (dCT value
= 1.57) rat livers; however the expression for SUMO-1 was significantly (p = 0.01)
reduced in E+HS vs. E+TN rats (Figure 6. 8). Therefore, down-regulation of SUMO-1
could hamper HSF1‘s DNA binding activity and thereby HSP transcriptional activation.
Settivari et al. (2006) reported similar reduction in hepatic chaperone gene expression in
E+ fed rats compared to E- controls under TN conditions. Present findings suggest
greater reduction in gene expression of various chaperones in E+ diet fed rats under HS
than at TN conditions. Other unidentified mechanisms may also contribute to these
182
unexpected results and further studies are required in this area for better understanding of
the mechanisms involved.
E-HS vs E+HS
Microarray analysis between E- and E+ rats under HS conditions, identified 11
genes as differentially expressed of which, five were up-regulated and six genes were
down-regulated in E+HS rats. Of the differentially expressed, genes coding for
antioxidant as well as glucose and lipid metabolism were down-regulated and CYP2C37
was up-regulated in E+HS rats. Since the number of differentially expressed genes
representing each pathway were very few, it is hard to draw conclusions for this
comparison. One possible reason for less genomic variation between these two groups
could be the high biological variation observed within each treatment group, which is
evident in the hierarchical map (Figure 6. 9).
6. CONCLUSION
The current study provides information regarding specific hepatic genes, which
are differentially expressed in E+ rats when exposed to short-term heat stress. The
cellular mechanisms involved in the pathogenesis of fescue toxicosis under heat stress
conditions were elucidated. Of particular interest were the pathophysiological roles of
reduced energy utilization, electron leak resulting in oxidative stress, and impaired
detoxification, immune and chaperone functions, making animals more susceptible to
183
various stressors. Likewise, the development of genomic signs of fescue toxicosis during
heat stress was important.
Intake of E+ diet at TN conditions resulted in up-regulation of genes associated
with CYPs, but down-regulated genes associated with chaperone, antioxidant and
immune systems (Settivari et al., 2006). The present study suggested that added effects of
HS on E+ intake further impaired the animal’s defense mechanisms (chaperone,
antioxidant and immune systems) beyond the effect at thermoneutrality, thereby making
them more susceptible to various stressors. This might explain why HS exacerbates the
clinical signs associated with fescue toxicosis, apart from hyperthermia associated with
peripheral vasoconstriction. The present study emphasizes the importance of the
inclusion of pair-fed treatment groups in future studies to differentiate the direct hepatic
effects of E+ toxins from the secondary effects on the liver that are associated with
reduced caloric intake. Future studies should be designed to identify differentially
expressed genes after exposure to E+ toxicants under chronic heat stress conditions, to
determine specific markers that might be targeted for prophylactic and therapeutic
interventions.
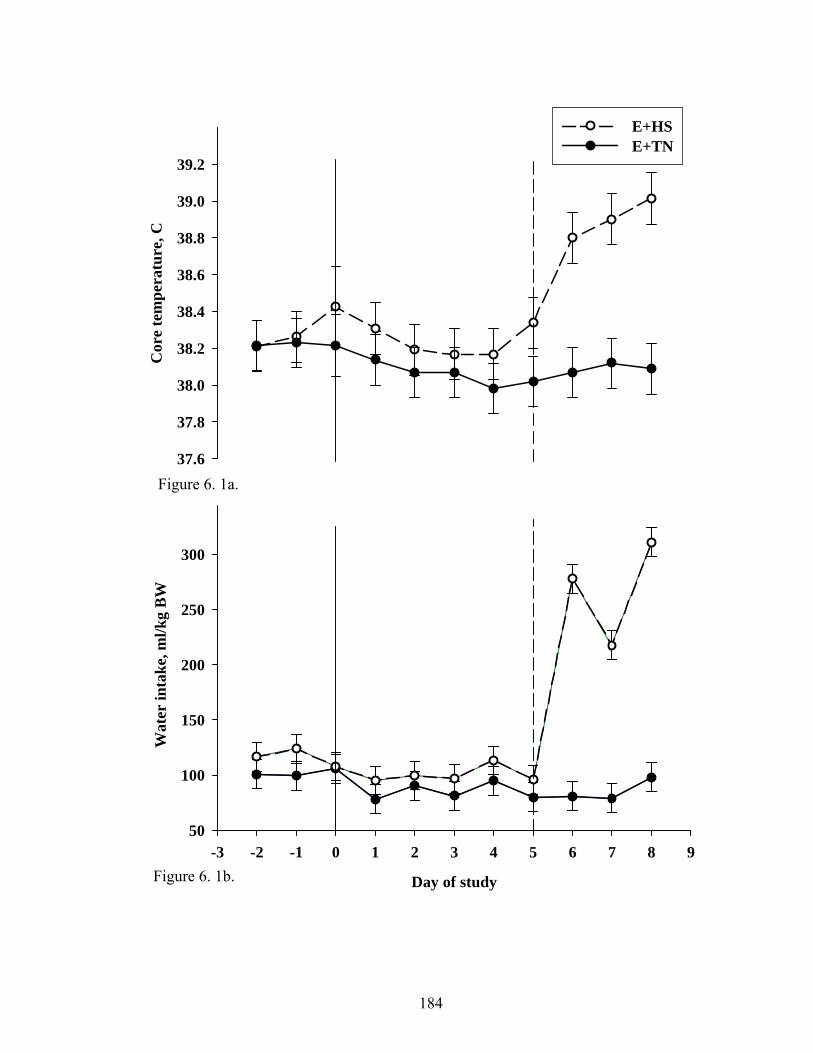
184
Cor
e te
mpe
ratu
re, C
37.6
37.8
38.0
38.2
38.4
38.6
38.8
39.0
39.2
E+HSE+TN
Day of study
-3 -2 -1 0 1 2 3 4 5 6 7 8 9
Wat
er in
take
, ml/k
g B
W
50
100
150
200
250
300
350
Figure 6. 1a.
Figure 6. 1b.
185
Figure 6. 1a. Average core body temperature of rats fed E+ diet and maintained under TN (21˚C) for five days, and then extended under TN or HS conditions (31˚C) for three days. Core temperature for E+HS was greater (p < 0.05) during HS period from E+TN level.
Figure 6. 1b. Average water intake of rats fed E+ diet and maintained under TN (21˚C) for five days, and then extended under TN or HS conditions (31˚C) for three days. Water intake for E+HS was greater (p < 0.05) during HS period from E+TN level.
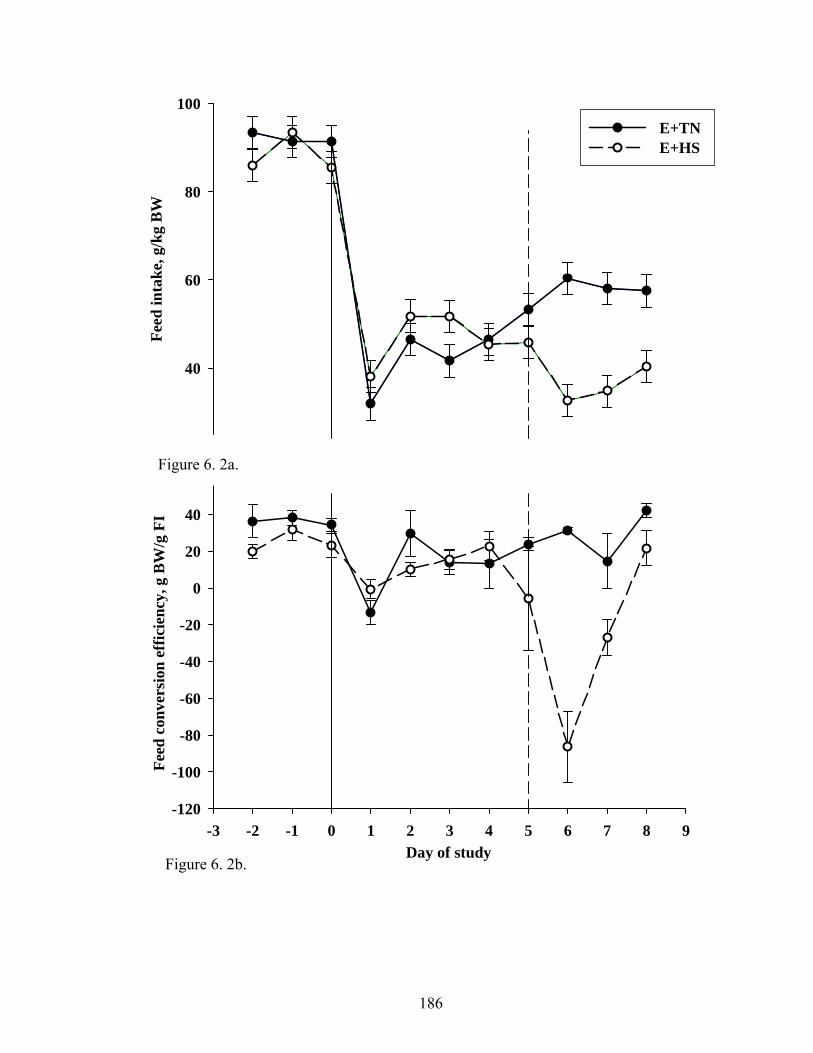
186
Feed
inta
ke, g
/kg
BW
40
60
80
100E+TN E+HS
Day of study-3 -2 -1 0 1 2 3 4 5 6 7 8 9
Feed
con
vers
ion
effic
ienc
y, g
BW
/g F
I
-120
-100
-80
-60
-40
-20
0
20
40
60
Figure 6. 2a.
Figure 6. 2b.
187
Figure 6. 2a. Fescue toxicosis-induced reduction in average daily feed intake during the eight-day treatment period for E+TN and E+HS groups. Feed intake for E+HS was significantly reduced (p < 0.05) from E+TN during HS period.
Figure 6. 2b. Fescue toxicosis-induced reduction in average feed conversion efficiency during the eight-day treatment period for E+TN and E+HS groups. Feed conversion efficiency for E+HS was significantly reduced (p < 0.05) from E+TN during HS period.
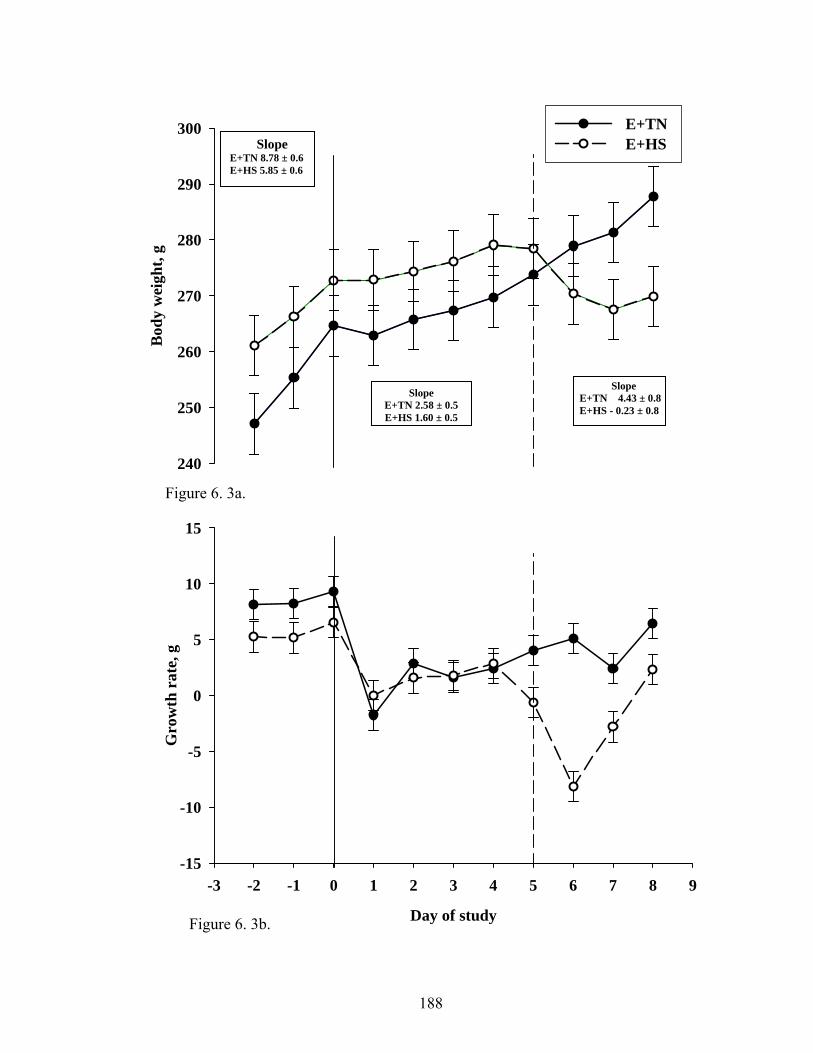
188
Bod
y w
eigh
t, g
240
250
260
270
280
290
300 E+TN E+HS
Day of study
-3 -2 -1 0 1 2 3 4 5 6 7 8 9
Gro
wth
rat
e, g
-15
-10
-5
0
5
10
15
Slope E+TN 8.78 ± 0.6 E+HS 5.85 ± 0.6
Slope E+TN 2.58 ± 0.5 E+HS 1.60 ± 0.5
Slope E+TN 4.43 ± 0.8 E+HS - 0.23 ± 0.8
Figure 6. 3b.
Figure 6. 3a.
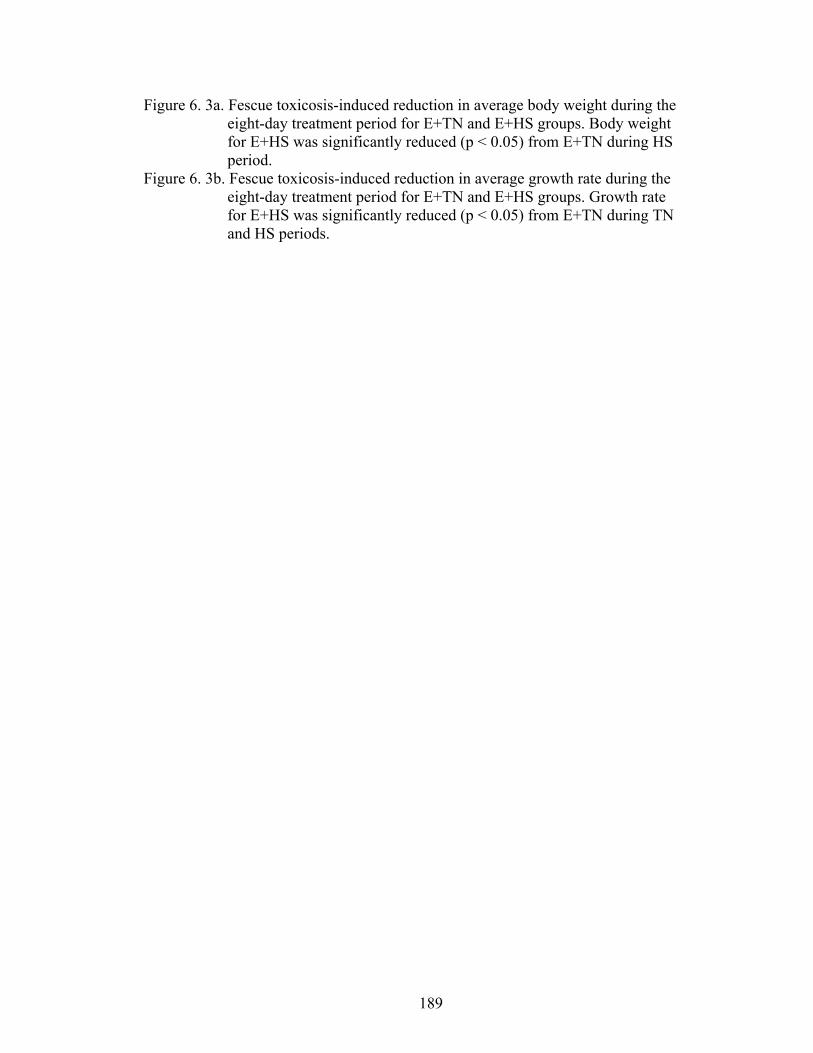
189
Figure 6. 3a. Fescue toxicosis-induced reduction in average body weight during the eight-day treatment period for E+TN and E+HS groups. Body weight for E+HS was significantly reduced (p < 0.05) from E+TN during HS period.
Figure 6. 3b. Fescue toxicosis-induced reduction in average growth rate during the eight-day treatment period for E+TN and E+HS groups. Growth rate for E+HS was significantly reduced (p < 0.05) from E+TN during TN and HS periods.
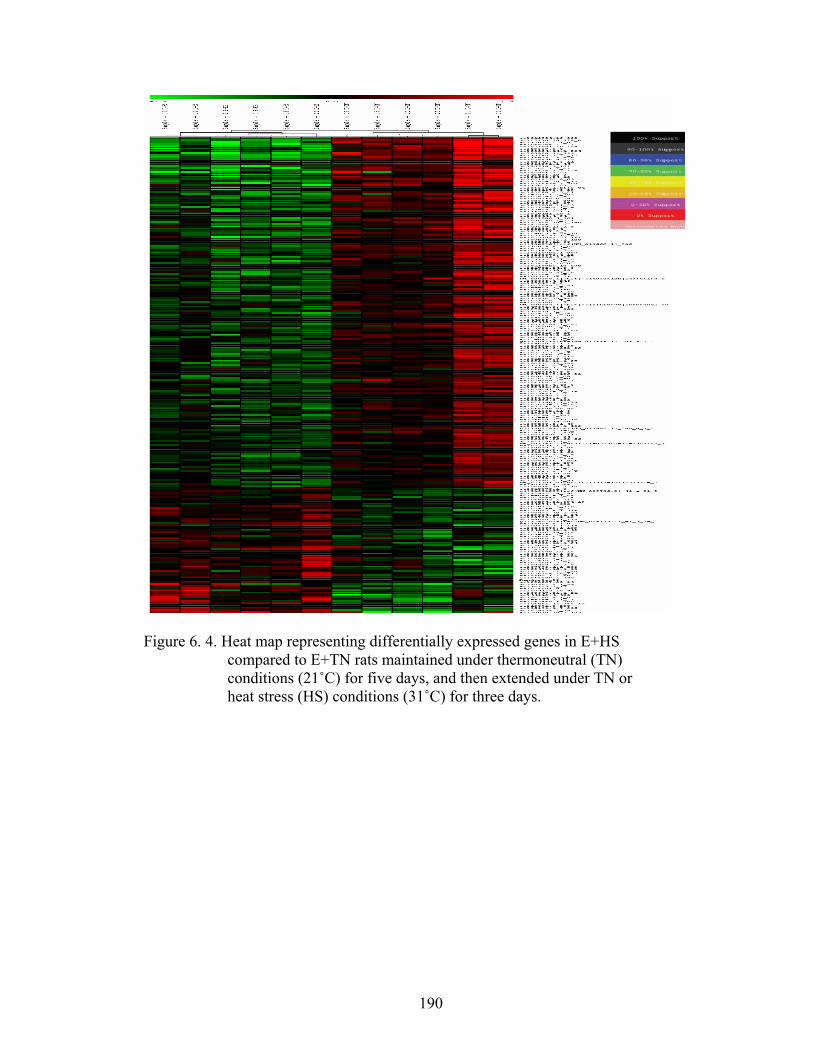
190
Figure 6. 4. Heat map representing differentially expressed genes in E+HS
compared to E+TN rats maintained under thermoneutral (TN) conditions (21˚C) for five days, and then extended under TN or heat stress (HS) conditions (31˚C) for three days.
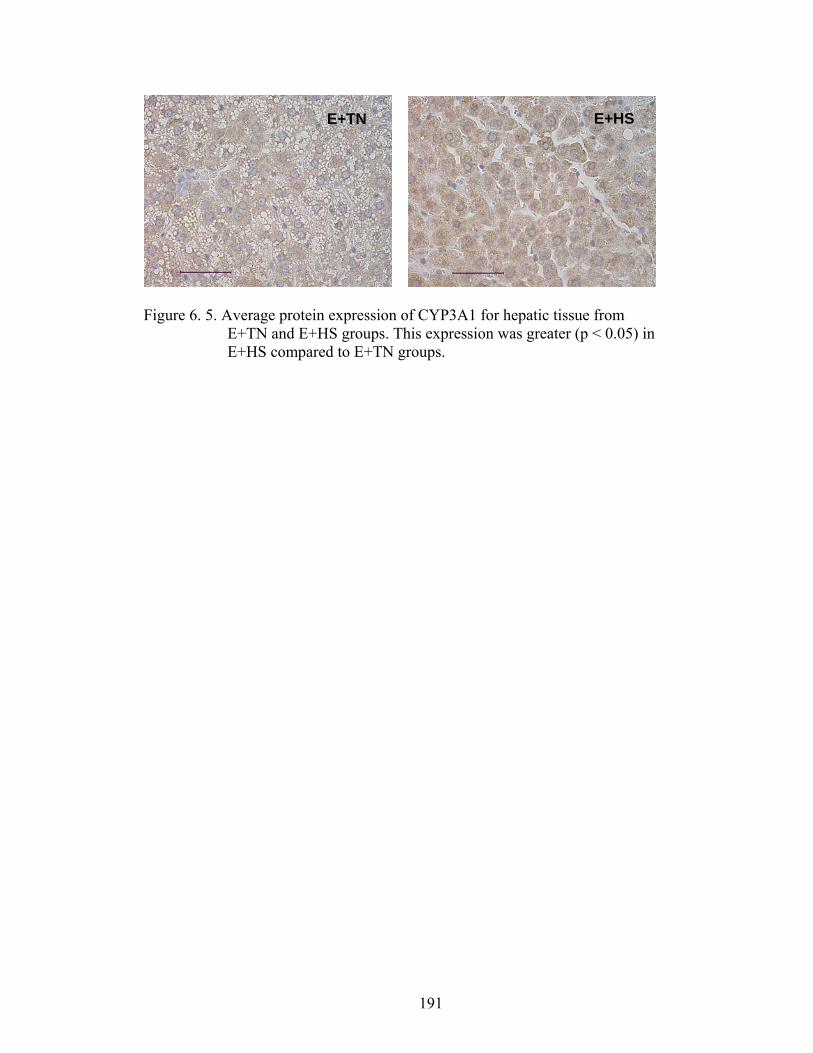
191
Figure 6. 5. Average protein expression of CYP3A1 for hepatic tissue from
E+TN and E+HS groups. This expression was greater (p < 0.05) in E+HS compared to E+TN groups.
E+TN E+HS
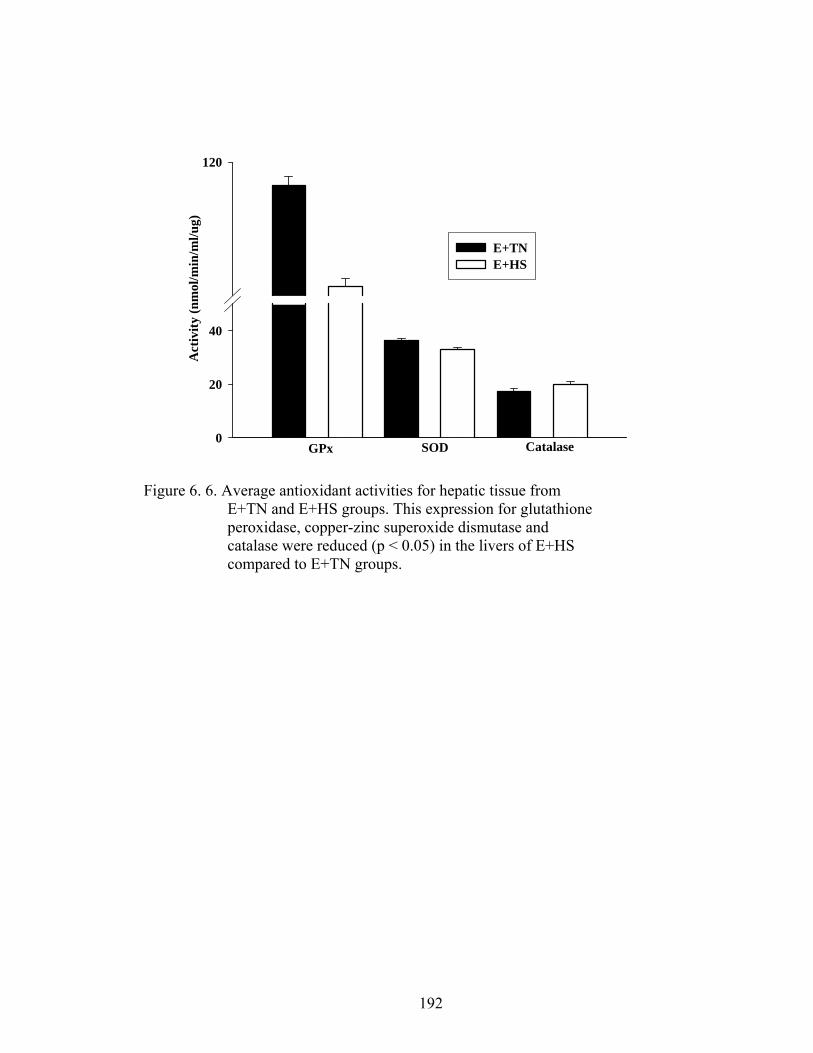
192
Figure 6. 6. Average antioxidant activities for hepatic tissue from
E+TN and E+HS groups. This expression for glutathione peroxidase, copper-zinc superoxide dismutase and catalase were reduced (p < 0.05) in the livers of E+HS compared to E+TN groups.
0
20
40
120
E+TNE+HS
GPx SOD Catalase
Act
ivity
(nm
ol/m
in/m
l/ug)
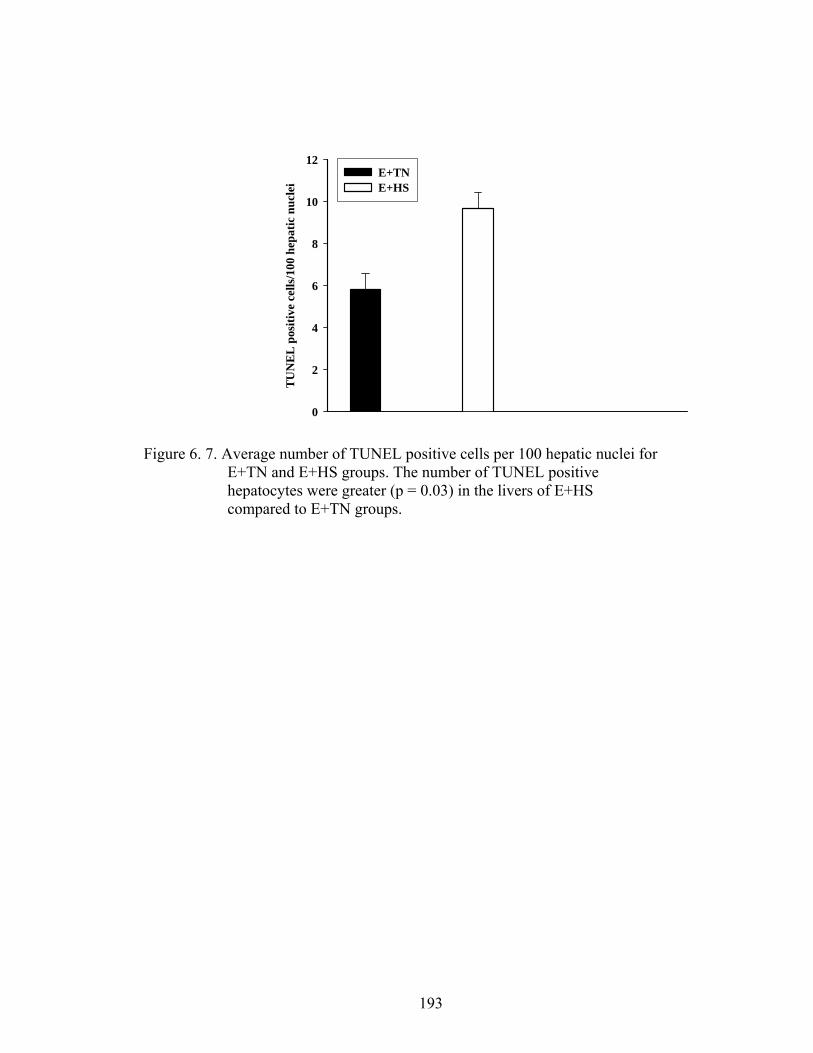
193
Figure 6. 7. Average number of TUNEL positive cells per 100 hepatic nuclei for
E+TN and E+HS groups. The number of TUNEL positive hepatocytes were greater (p = 0.03) in the livers of E+HS compared to E+TN groups.
TU
NE
L p
ositi
ve c
ells
/100
hep
atic
nuc
lei
0
2
4
6
8
10
12E+TNE+HS
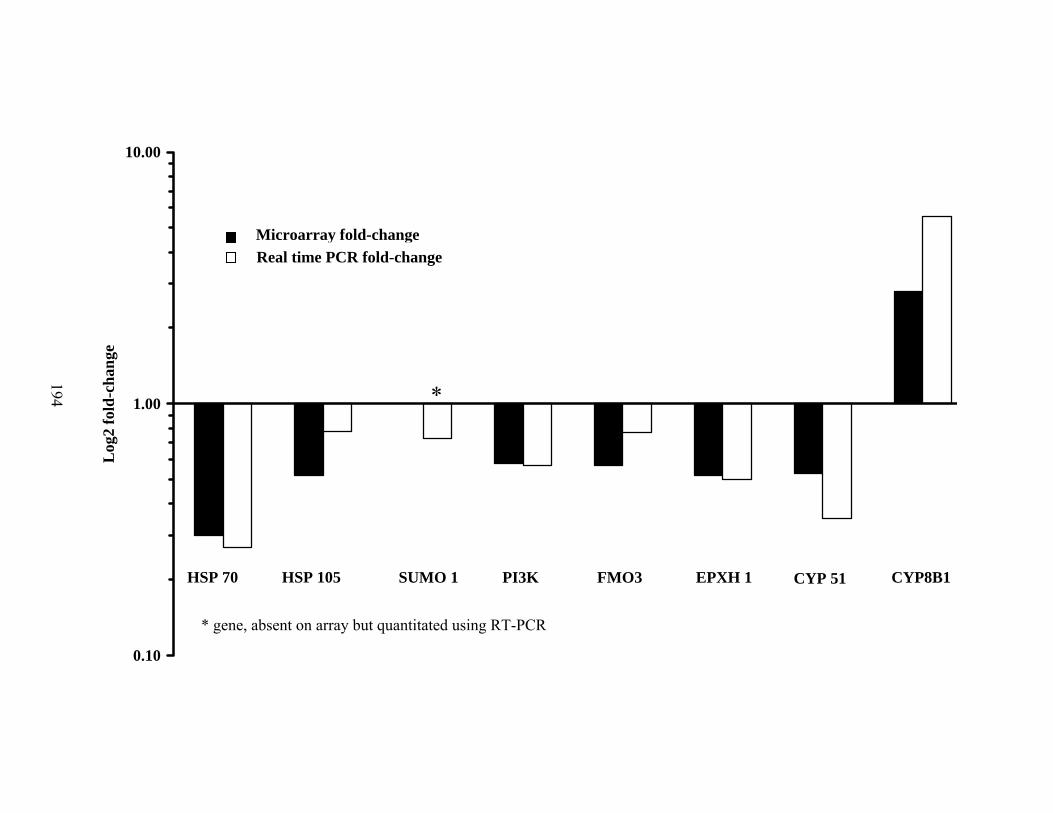
194
0.10
1.00
10.00
Log
2 fo
ld-c
hang
e
HSP 70 HSP 105 SUMO 1 PI3K FMO3 EPXH 1 CYP 51 CYP8B1
*
Microarray fold-change Real time PCR fold-change
* gene, absent on array but quantitated using RT-PCR
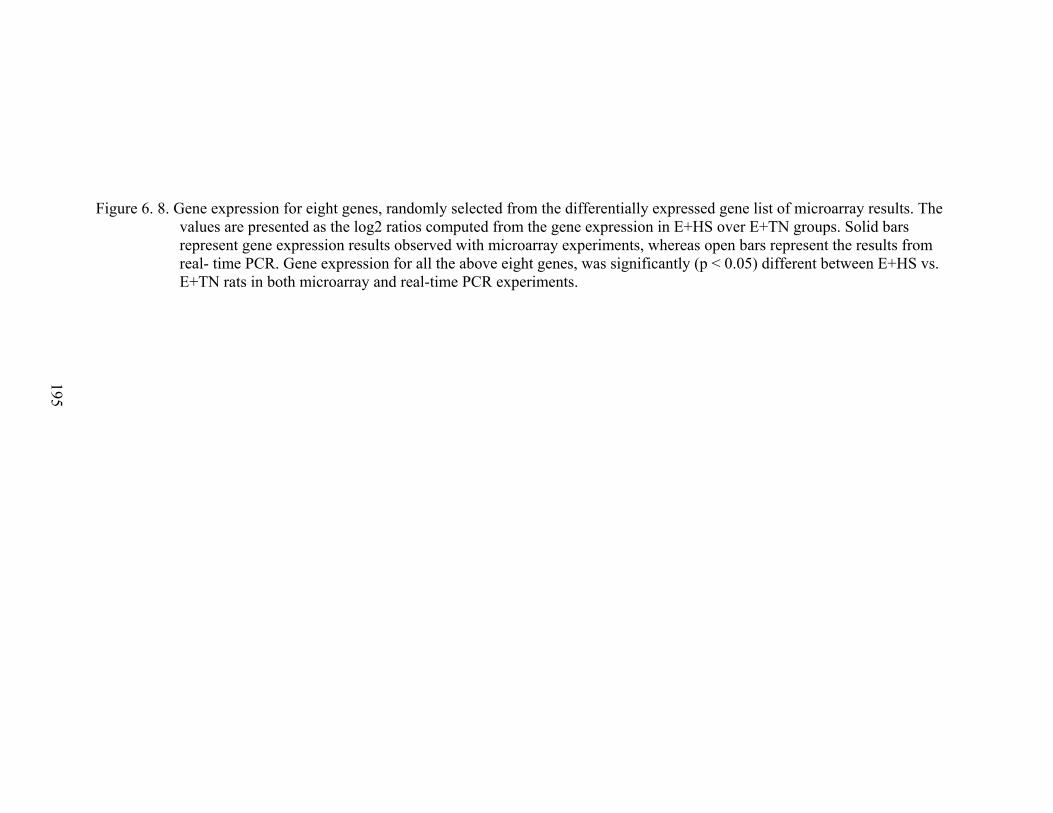
195
Figure 6. 8. Gene expression for eight genes, randomly selected from the differentially expressed gene list of microarray results. The
values are presented as the log2 ratios computed from the gene expression in E+HS over E+TN groups. Solid bars represent gene expression results observed with microarray experiments, whereas open bars represent the results from real- time PCR. Gene expression for all the above eight genes, was significantly (p < 0.05) different between E+HS vs. E+TN rats in both microarray and real-time PCR experiments.
196
Figure 6. 9. Heat map representing differentially expressed genes in E+HS compared to E-HS rats maintained under thermoneutral (TN) conditions (21˚C) for five days, and then extended under heat stress (HS) conditions (31˚C) for three days.
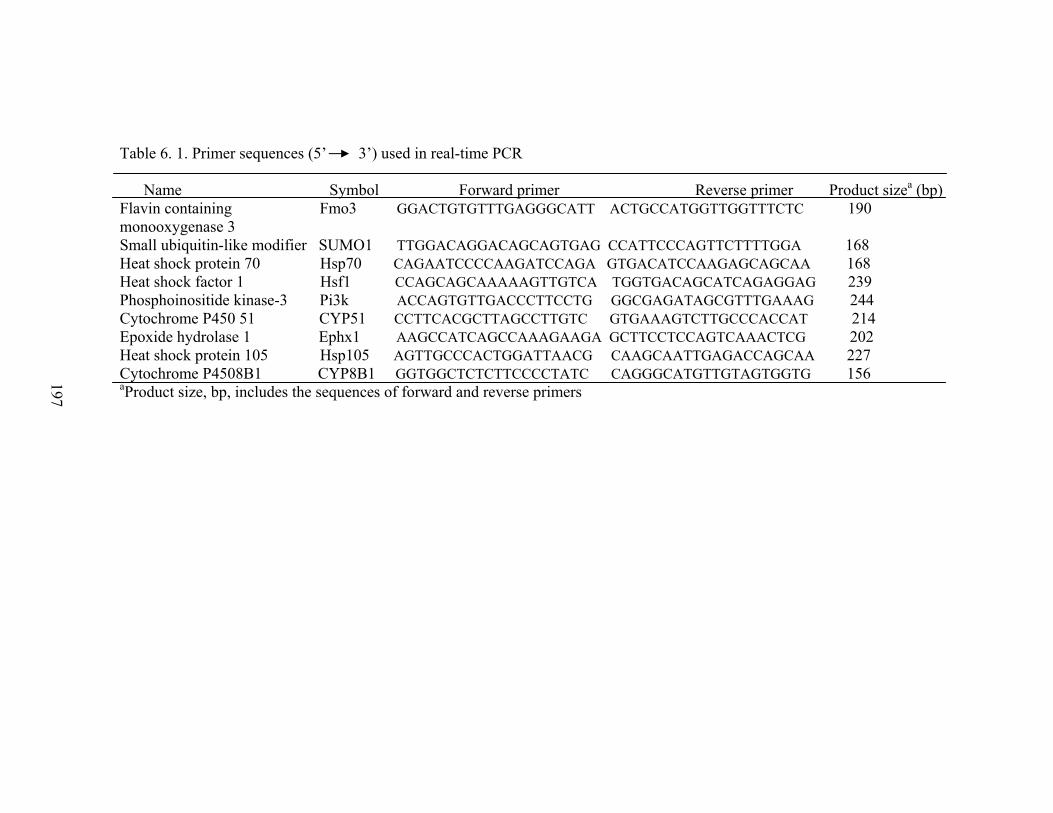
197
Table 6. 1. Primer sequences (5’ 3’) used in real-time PCR Name Symbol Forward primer Reverse primer Product sizea (bp) Flavin containing Fmo3 GGACTGTGTTTGAGGGCATT ACTGCCATGGTTGGTTTCTC 190 monooxygenase 3 Small ubiquitin-like modifier SUMO1 TTGGACAGGACAGCAGTGAG CCATTCCCAGTTCTTTTGGA 168 Heat shock protein 70 Hsp70 CAGAATCCCCAAGATCCAGA GTGACATCCAAGAGCAGCAA 168 Heat shock factor 1 Hsf1 CCAGCAGCAAAAAGTTGTCA TGGTGACAGCATCAGAGGAG 239 Phosphoinositide kinase-3 Pi3k ACCAGTGTTGACCCTTCCTG GGCGAGATAGCGTTTGAAAG 244 Cytochrome P450 51 CYP51 CCTTCACGCTTAGCCTTGTC GTGAAAGTCTTGCCCACCAT 214 Epoxide hydrolase 1 Ephx1 AAGCCATCAGCCAAAGAAGA GCTTCCTCCAGTCAAACTCG 202 Heat shock protein 105 Hsp105 AGTTGCCCACTGGATTAACG CAAGCAATTGAGACCAGCAA 227 Cytochrome P4508B1 CYP8B1 GGTGGCTCTCTTCCCCTATC CAGGGCATGTTGTAGTGGTG 156 aProduct size, bp, includes the sequences of forward and reverse primers
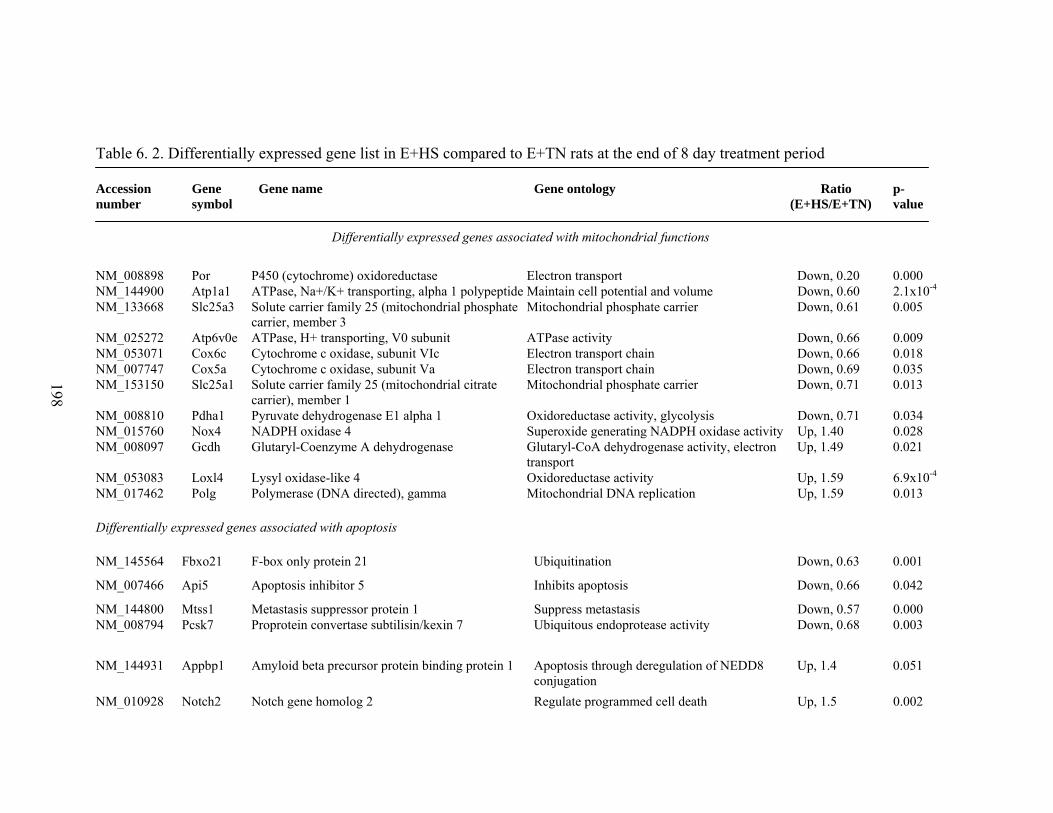
198
Table 6. 2. Differentially expressed gene list in E+HS compared to E+TN rats at the end of 8 day treatment period Accession number
Gene symbol
Gene name Gene ontology Ratio (E+HS/E+TN)
p- value
NM_008898 Por P450 (cytochrome) oxidoreductase Electron transport Down, 0.20 0.000 NM_144900 Atp1a1 ATPase, Na+/K+ transporting, alpha 1 polypeptide Maintain cell potential and volume Down, 0.60 2.1x10⁻⁴ NM_133668 Slc25a3 Solute carrier family 25 (mitochondrial phosphate
carrier, member 3 Mitochondrial phosphate carrier Down, 0.61 0.005
NM_025272 Atp6v0e ATPase, H+ transporting, V0 subunit ATPase activity Down, 0.66 0.009 NM_053071 Cox6c Cytochrome c oxidase, subunit VIc Electron transport chain Down, 0.66 0.018 NM_007747 Cox5a Cytochrome c oxidase, subunit Va Electron transport chain Down, 0.69 0.035 NM_153150 Slc25a1 Solute carrier family 25 (mitochondrial citrate
carrier), member 1 Mitochondrial phosphate carrier Down, 0.71 0.013
NM_008810 Pdha1 Pyruvate dehydrogenase E1 alpha 1 Oxidoreductase activity, glycolysis Down, 0.71 0.034 NM_015760 Nox4 NADPH oxidase 4 Superoxide generating NADPH oxidase activity Up, 1.40 0.028 NM_008097 Gcdh Glutaryl-Coenzyme A dehydrogenase Glutaryl-CoA dehydrogenase activity, electron
transport Up, 1.49 0.021
NM_053083 Loxl4 Lysyl oxidase-like 4 Oxidoreductase activity Up, 1.59 6.9x10⁻⁴ NM_017462 Polg Polymerase (DNA directed), gamma Mitochondrial DNA replication Up, 1.59 0.013 Differentially expressed genes associated with apoptosis NM_145564 Fbxo21 F-box only protein 21 Ubiquitination Down, 0.63 0.001
NM_007466 Api5 Apoptosis inhibitor 5 Inhibits apoptosis Down, 0.66 0.042
NM_144800 Mtss1 Metastasis suppressor protein 1 Suppress metastasis Down, 0.57 0.000 NM_008794 Pcsk7 Proprotein convertase subtilisin/kexin 7 Ubiquitous endoprotease activity Down, 0.68 0.003
NM_144931 Appbp1 Amyloid beta precursor protein binding protein 1 Apoptosis through deregulation of NEDD8 conjugation
Up, 1.4 0.051
NM_010928 Notch2 Notch gene homolog 2 Regulate programmed cell death Up, 1.5 0.002
Differentially expressed genes associated with mitochondrial functions
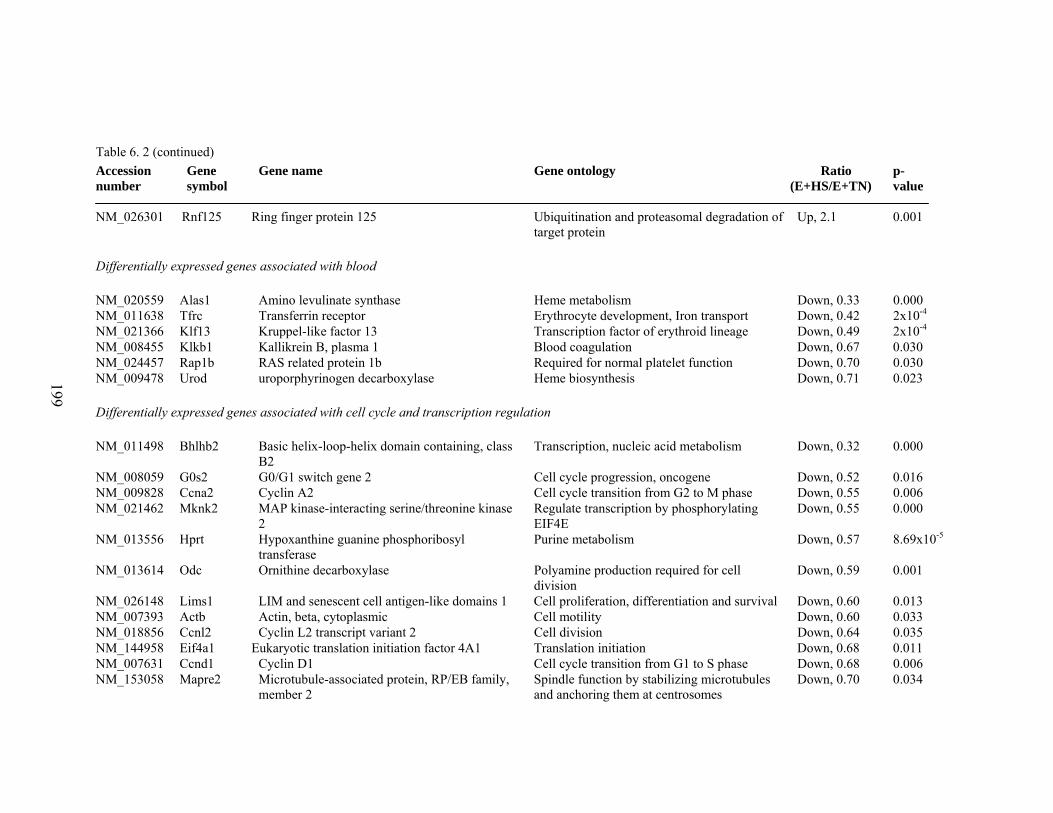
199
Table 6. 2 (continued) Accession number
Gene symbol
Gene name Gene ontology Ratio (E+HS/E+TN)
p- value
NM_026301 Rnf125 Ring finger protein 125 Ubiquitination and proteasomal degradation of target protein
Up, 2.1 0.001
Differentially expressed genes associated with blood NM_020559 Alas1 Amino levulinate synthase Heme metabolism Down, 0.33 0.000 NM_011638 Tfrc Transferrin receptor Erythrocyte development, Iron transport Down, 0.42 2x10⁻⁴ NM_021366 Klf13 Kruppel-like factor 13 Transcription factor of erythroid lineage Down, 0.49 2x10⁻⁴ NM_008455 Klkb1 Kallikrein B, plasma 1 Blood coagulation Down, 0.67 0.030 NM_024457 Rap1b RAS related protein 1b Required for normal platelet function Down, 0.70 0.030 NM_009478 Urod uroporphyrinogen decarboxylase Heme biosynthesis Down, 0.71 0.023 Differentially expressed genes associated with cell cycle and transcription regulation NM_011498 Bhlhb2 Basic helix-loop-helix domain containing, class
B2 Transcription, nucleic acid metabolism Down, 0.32 0.000
NM_008059 G0s2 G0/G1 switch gene 2 Cell cycle progression, oncogene Down, 0.52 0.016 NM_009828 Ccna2 Cyclin A2 Cell cycle transition from G2 to M phase Down, 0.55 0.006 NM_021462 Mknk2 MAP kinase-interacting serine/threonine kinase
2 Regulate transcription by phosphorylating EIF4E
Down, 0.55 0.000
NM_013556 Hprt Hypoxanthine guanine phosphoribosyl transferase
Purine metabolism Down, 0.57 8.69x10⁻⁵
NM_013614 Odc Ornithine decarboxylase Polyamine production required for cell division
Down, 0.59 0.001
NM_026148 Lims1 LIM and senescent cell antigen-like domains 1 Cell proliferation, differentiation and survival Down, 0.60 0.013 NM_007393 Actb Actin, beta, cytoplasmic Cell motility Down, 0.60 0.033 NM_018856 Ccnl2 Cyclin L2 transcript variant 2 Cell division Down, 0.64 0.035 NM_144958 Eif4a1 Eukaryotic translation initiation factor 4A1 Translation initiation Down, 0.68 0.011 NM_007631 Ccnd1 Cyclin D1 Cell cycle transition from G1 to S phase Down, 0.68 0.006 NM_153058 Mapre2 Microtubule-associated protein, RP/EB family,
member 2 Spindle function by stabilizing microtubules and anchoring them at centrosomes
Down, 0.70 0.034
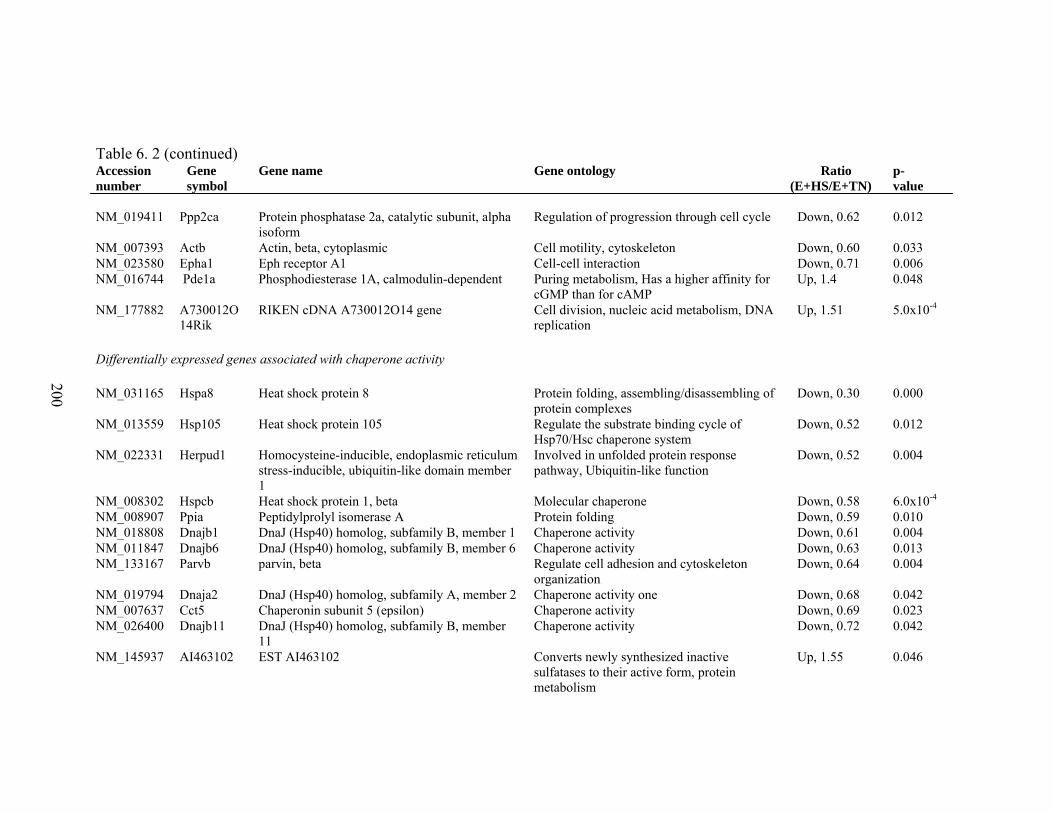
200
Table 6. 2 (continued) Accession number
Gene symbol
Gene name Gene ontology Ratio (E+HS/E+TN)
p- value
NM_019411 Ppp2ca Protein phosphatase 2a, catalytic subunit, alpha isoform
Regulation of progression through cell cycle Down, 0.62 0.012
NM_007393 Actb Actin, beta, cytoplasmic Cell motility, cytoskeleton Down, 0.60 0.033 NM_023580 Epha1 Eph receptor A1 Cell-cell interaction Down, 0.71 0.006 NM_016744 Pde1a Phosphodiesterase 1A, calmodulin-dependent Puring metabolism, Has a higher affinity for
cGMP than for cAMP Up, 1.4 0.048
NM_177882 A730012O14Rik
RIKEN cDNA A730012O14 gene Cell division, nucleic acid metabolism, DNA replication
Up, 1.51 5.0x10⁻⁴
Differentially expressed genes associated with chaperone activity NM_031165 Hspa8 Heat shock protein 8 Protein folding, assembling/disassembling of
protein complexes Down, 0.30 0.000
NM_013559 Hsp105 Heat shock protein 105 Regulate the substrate binding cycle of Hsp70/Hsc chaperone system
Down, 0.52 0.012
NM_022331 Herpud1 Homocysteine-inducible, endoplasmic reticulum stress-inducible, ubiquitin-like domain member 1
Involved in unfolded protein response pathway, Ubiquitin-like function
Down, 0.52 0.004
NM_008302 Hspcb Heat shock protein 1, beta Molecular chaperone Down, 0.58 6.0x10⁻⁴ NM_008907 Ppia Peptidylprolyl isomerase A Protein folding Down, 0.59 0.010 NM_018808 Dnajb1 DnaJ (Hsp40) homolog, subfamily B, member 1 Chaperone activity Down, 0.61 0.004 NM_011847 Dnajb6 DnaJ (Hsp40) homolog, subfamily B, member 6 Chaperone activity Down, 0.63 0.013 NM_133167 Parvb parvin, beta Regulate cell adhesion and cytoskeleton
organization Down, 0.64 0.004
NM_019794 Dnaja2 DnaJ (Hsp40) homolog, subfamily A, member 2 Chaperone activity one Down, 0.68 0.042 NM_007637 Cct5 Chaperonin subunit 5 (epsilon) Chaperone activity Down, 0.69 0.023 NM_026400 Dnajb11 DnaJ (Hsp40) homolog, subfamily B, member
11 Chaperone activity Down, 0.72 0.042
NM_145937 AI463102 EST AI463102 Converts newly synthesized inactive sulfatases to their active form, protein metabolism
Up, 1.55 0.046
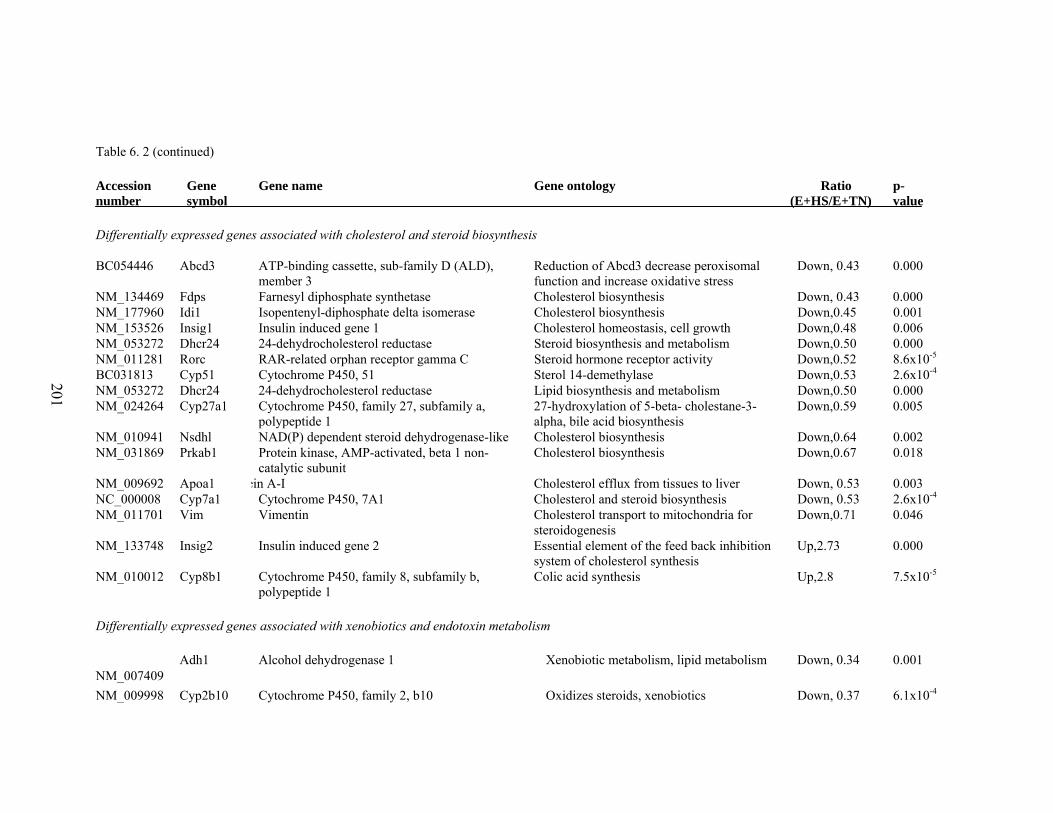
201
Table 6. 2 (continued) Accession number
Gene symbol
Gene name Gene ontology Ratio (E+HS/E+TN)
p- value
Differentially expressed genes associated with cholesterol and steroid biosynthesis BC054446 Abcd3 ATP-binding cassette, sub-family D (ALD),
member 3 Reduction of Abcd3 decrease peroxisomal function and increase oxidative stress
Down, 0.43 0.000
NM_134469 Fdps Farnesyl diphosphate synthetase Cholesterol biosynthesis Down, 0.43 0.000 NM_177960 Idi1 Isopentenyl-diphosphate delta isomerase Cholesterol biosynthesis Down,0.45 0.001 NM_153526 Insig1 Insulin induced gene 1 Cholesterol homeostasis, cell growth Down,0.48 0.006 NM_053272 Dhcr24 24-dehydrocholesterol reductase Steroid biosynthesis and metabolism Down,0.50 0.000 NM_011281 Rorc RAR-related orphan receptor gamma C Steroid hormone receptor activity Down,0.52 8.6x10⁻⁵ BC031813 Cyp51 Cytochrome P450, 51 Sterol 14-demethylase Down,0.53 2.6x10⁻⁴ NM_053272 Dhcr24 24-dehydrocholesterol reductase Lipid biosynthesis and metabolism Down,0.50 0.000 NM_024264 Cyp27a1 Cytochrome P450, family 27, subfamily a,
polypeptide 1 27-hydroxylation of 5-beta- cholestane-3-alpha, bile acid biosynthesis
Down,0.59 0.005
NM_010941 Nsdhl NAD(P) dependent steroid dehydrogenase-like Cholesterol biosynthesis Down,0.64 0.002 NM_031869 Prkab1 Protein kinase, AMP-activated, beta 1 non-
catalytic subunit Cholesterol biosynthesis Down,0.67 0.018
NM_009692 Apoa1 ein A-I Cholesterol efflux from tissues to liver Down, 0.53 0.003 NC_000008 Cyp7a1 Cytochrome P450, 7A1 Cholesterol and steroid biosynthesis Down, 0.53 2.6x10⁻⁴ NM_011701 Vim Vimentin Cholesterol transport to mitochondria for
steroidogenesis Down,0.71 0.046
NM_133748 Insig2 Insulin induced gene 2 Essential element of the feed back inhibition system of cholesterol synthesis
Up,2.73 0.000
NM_010012 Cyp8b1 Cytochrome P450, family 8, subfamily b, polypeptide 1
Colic acid synthesis Up,2.8 7.5x10⁻⁵
Differentially expressed genes associated with xenobiotics and endotoxin metabolism
NM_007409 Adh1 Alcohol dehydrogenase 1 Xenobiotic metabolism, lipid metabolism Down, 0.34 0.001
NM_009998 Cyp2b10 Cytochrome P450, family 2, b10 Oxidizes steroids, xenobiotics Down, 0.37 6.1x10⁻⁴
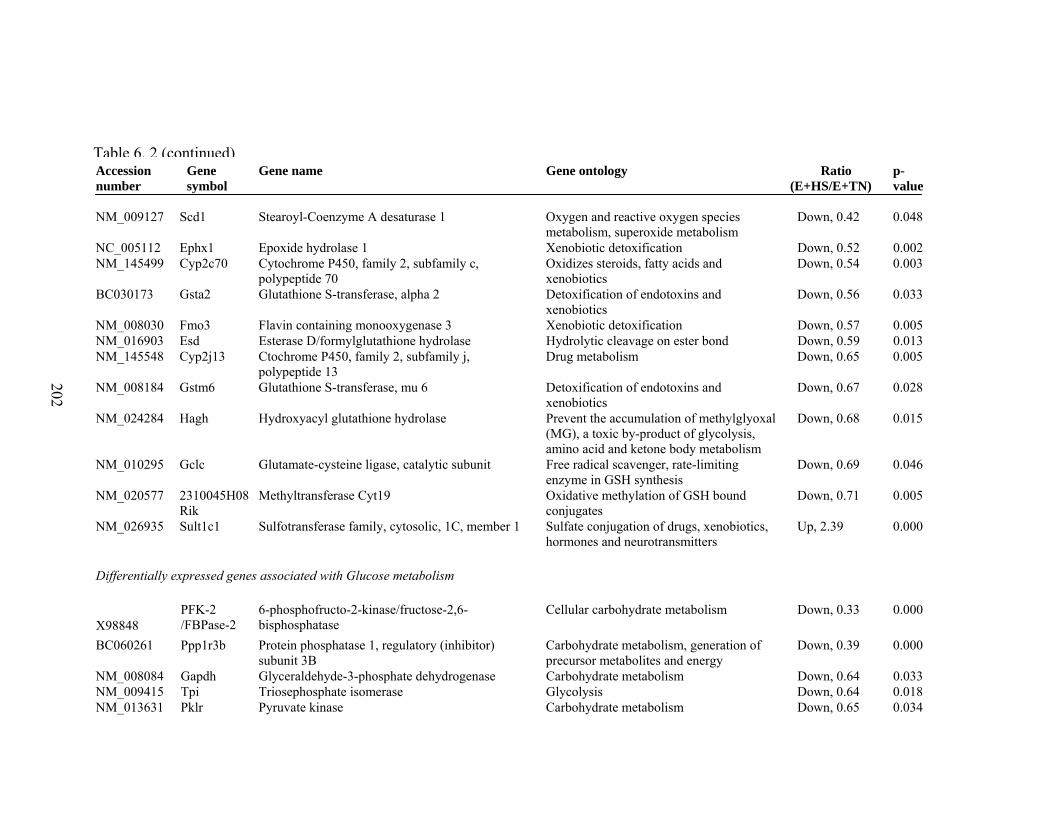
202
Accession number
Gene symbol
Gene name Gene ontology Ratio (E+HS/E+TN)
p- value
NM_009127 Scd1 Stearoyl-Coenzyme A desaturase 1 Oxygen and reactive oxygen species metabolism, superoxide metabolism
Down, 0.42 0.048
NC_005112 Ephx1 Epoxide hydrolase 1 Xenobiotic detoxification Down, 0.52 0.002 NM_145499 Cyp2c70 Cytochrome P450, family 2, subfamily c,
polypeptide 70 Oxidizes steroids, fatty acids and xenobiotics
Down, 0.54 0.003
BC030173 Gsta2 Glutathione S-transferase, alpha 2 Detoxification of endotoxins and xenobiotics
Down, 0.56 0.033
NM_008030 Fmo3 Flavin containing monooxygenase 3 Xenobiotic detoxification Down, 0.57 0.005 NM_016903 Esd Esterase D/formylglutathione hydrolase Hydrolytic cleavage on ester bond Down, 0.59 0.013 NM_145548 Cyp2j13 Ctochrome P450, family 2, subfamily j,
polypeptide 13 Drug metabolism Down, 0.65 0.005
NM_008184 Gstm6 Glutathione S-transferase, mu 6 Detoxification of endotoxins and xenobiotics
Down, 0.67 0.028
NM_024284 Hagh Hydroxyacyl glutathione hydrolase Prevent the accumulation of methylglyoxal (MG), a toxic by-product of glycolysis, amino acid and ketone body metabolism
Down, 0.68 0.015
NM_010295 Gclc Glutamate-cysteine ligase, catalytic subunit Free radical scavenger, rate-limiting enzyme in GSH synthesis
Down, 0.69 0.046
NM_020577 2310045H08Rik
Methyltransferase Cyt19 Oxidative methylation of GSH bound conjugates
Down, 0.71 0.005
NM_026935 Sult1c1 Sulfotransferase family, cytosolic, 1C, member 1 Sulfate conjugation of drugs, xenobiotics, hormones and neurotransmitters
Up, 2.39 0.000
Differentially expressed genes associated with Glucose metabolism
X98848 PFK-2 /FBPase-2
6-phosphofructo-2-kinase/fructose-2,6-bisphosphatase
Cellular carbohydrate metabolism Down, 0.33 0.000
BC060261 Ppp1r3b Protein phosphatase 1, regulatory (inhibitor) subunit 3B
Carbohydrate metabolism, generation of precursor metabolites and energy
Down, 0.39 0.000
NM_008084 Gapdh Glyceraldehyde-3-phosphate dehydrogenase Carbohydrate metabolism Down, 0.64 0.033 NM_009415 Tpi Triosephosphate isomerase Glycolysis Down, 0.64 0.018 NM_013631 Pklr Pyruvate kinase Carbohydrate metabolism Down, 0.65 0.034
Table 6. 2 (continued)
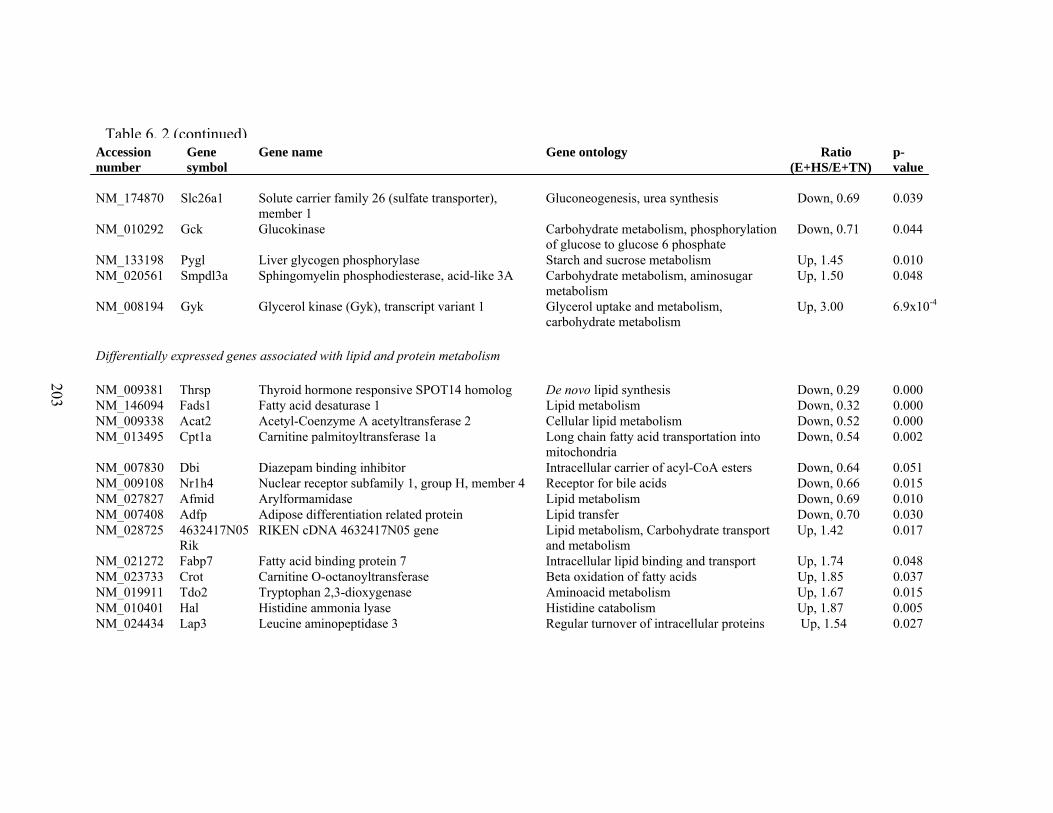
203
Accession number
Gene symbol
Gene name Gene ontology Ratio (E+HS/E+TN)
p- value
NM_174870 Slc26a1 Solute carrier family 26 (sulfate transporter), member 1
Gluconeogenesis, urea synthesis Down, 0.69 0.039
NM_010292 Gck Glucokinase Carbohydrate metabolism, phosphorylation of glucose to glucose 6 phosphate
Down, 0.71 0.044
NM_133198 Pygl Liver glycogen phosphorylase Starch and sucrose metabolism Up, 1.45 0.010 NM_020561 Smpdl3a Sphingomyelin phosphodiesterase, acid-like 3A Carbohydrate metabolism, aminosugar
metabolism Up, 1.50 0.048
NM_008194 Gyk Glycerol kinase (Gyk), transcript variant 1 Glycerol uptake and metabolism, carbohydrate metabolism
Up, 3.00 6.9x10⁻⁴
Differentially expressed genes associated with lipid and protein metabolism NM_009381 Thrsp Thyroid hormone responsive SPOT14 homolog De novo lipid synthesis Down, 0.29 0.000 NM_146094 Fads1 Fatty acid desaturase 1 Lipid metabolism Down, 0.32 0.000 NM_009338 Acat2 Acetyl-Coenzyme A acetyltransferase 2 Cellular lipid metabolism Down, 0.52 0.000 NM_013495 Cpt1a Carnitine palmitoyltransferase 1a Long chain fatty acid transportation into
mitochondria Down, 0.54 0.002
NM_007830 Dbi Diazepam binding inhibitor Intracellular carrier of acyl-CoA esters Down, 0.64 0.051 NM_009108 Nr1h4 Nuclear receptor subfamily 1, group H, member 4 Receptor for bile acids Down, 0.66 0.015 NM_027827 Afmid Arylformamidase Lipid metabolism Down, 0.69 0.010 NM_007408 Adfp Adipose differentiation related protein Lipid transfer Down, 0.70 0.030 NM_028725 4632417N05
Rik RIKEN cDNA 4632417N05 gene Lipid metabolism, Carbohydrate transport
and metabolism Up, 1.42 0.017
NM_021272 Fabp7 Fatty acid binding protein 7 Intracellular lipid binding and transport Up, 1.74 0.048 NM_023733 Crot Carnitine O-octanoyltransferase Beta oxidation of fatty acids Up, 1.85 0.037 NM_019911 Tdo2 Tryptophan 2,3-dioxygenase Aminoacid metabolism Up, 1.67 0.015 NM_010401 Hal Histidine ammonia lyase Histidine catabolism Up, 1.87 0.005 NM_024434 Lap3 Leucine aminopeptidase 3 Regular turnover of intracellular proteins Up, 1.54 0.027
Table 6. 2 (continued)
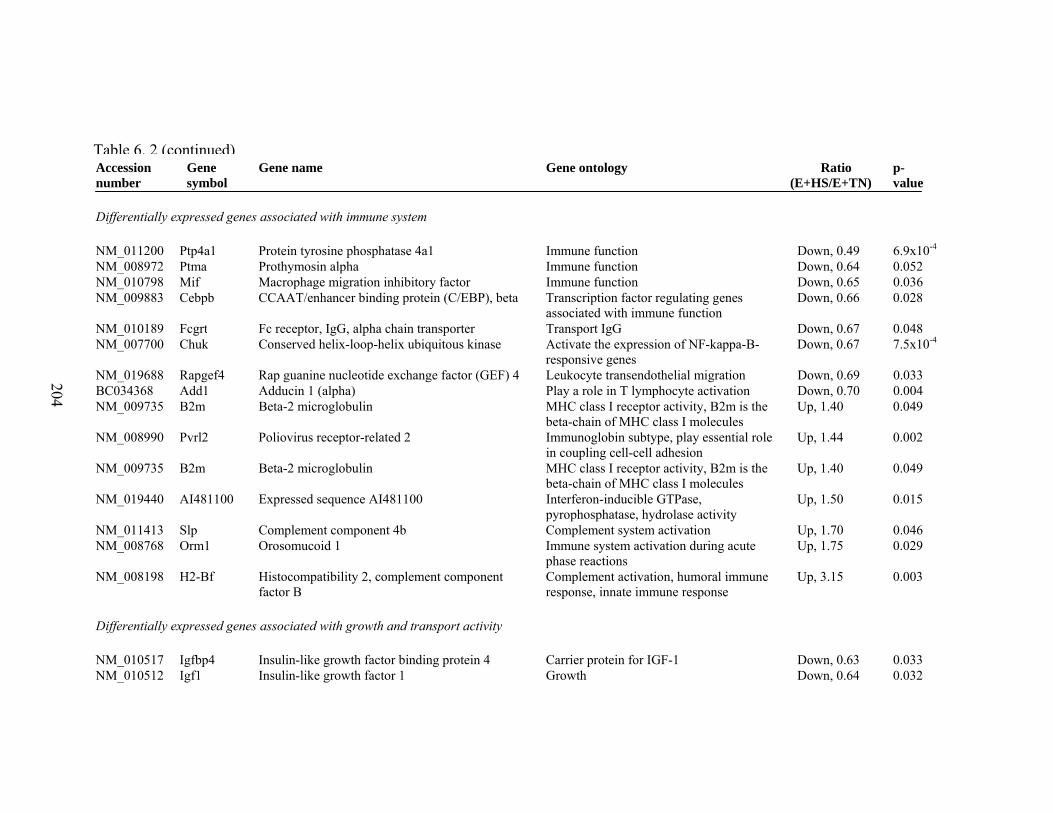
204
Accession number
Gene symbol
Gene name Gene ontology Ratio (E+HS/E+TN)
p- value
Differentially expressed genes associated with immune system NM_011200 Ptp4a1 Protein tyrosine phosphatase 4a1 Immune function Down, 0.49 6.9x10⁻⁴ NM_008972 Ptma Prothymosin alpha Immune function Down, 0.64 0.052 NM_010798 Mif Macrophage migration inhibitory factor Immune function Down, 0.65 0.036 NM_009883 Cebpb CCAAT/enhancer binding protein (C/EBP), beta Transcription factor regulating genes
associated with immune function Down, 0.66 0.028
NM_010189 Fcgrt Fc receptor, IgG, alpha chain transporter Transport IgG Down, 0.67 0.048 NM_007700 Chuk Conserved helix-loop-helix ubiquitous kinase Activate the expression of NF-kappa-B-
responsive genes Down, 0.67 7.5x10⁻⁴
NM_019688 Rapgef4 Rap guanine nucleotide exchange factor (GEF) 4 Leukocyte transendothelial migration Down, 0.69 0.033 BC034368 Add1 Adducin 1 (alpha) Play a role in T lymphocyte activation Down, 0.70 0.004 NM_009735 B2m Beta-2 microglobulin MHC class I receptor activity, B2m is the
beta-chain of MHC class I molecules Up, 1.40 0.049
NM_008990 Pvrl2 Poliovirus receptor-related 2 Immunoglobin subtype, play essential role in coupling cell-cell adhesion
Up, 1.44 0.002
NM_009735 B2m Beta-2 microglobulin MHC class I receptor activity, B2m is the beta-chain of MHC class I molecules
Up, 1.40 0.049
NM_019440 AI481100 Expressed sequence AI481100 Interferon-inducible GTPase, pyrophosphatase, hydrolase activity
Up, 1.50 0.015
NM_011413 Slp Complement component 4b Complement system activation Up, 1.70 0.046 NM_008768 Orm1 Orosomucoid 1 Immune system activation during acute
phase reactions Up, 1.75 0.029
NM_008198 H2-Bf Histocompatibility 2, complement component factor B
Complement activation, humoral immune response, innate immune response
Up, 3.15 0.003
Differentially expressed genes associated with growth and transport activity NM_010517 Igfbp4 Insulin-like growth factor binding protein 4 Carrier protein for IGF-1 Down, 0.63 0.033 NM_010512 Igf1 Insulin-like growth factor 1 Growth Down, 0.64 0.032
Table 6. 2 (continued)
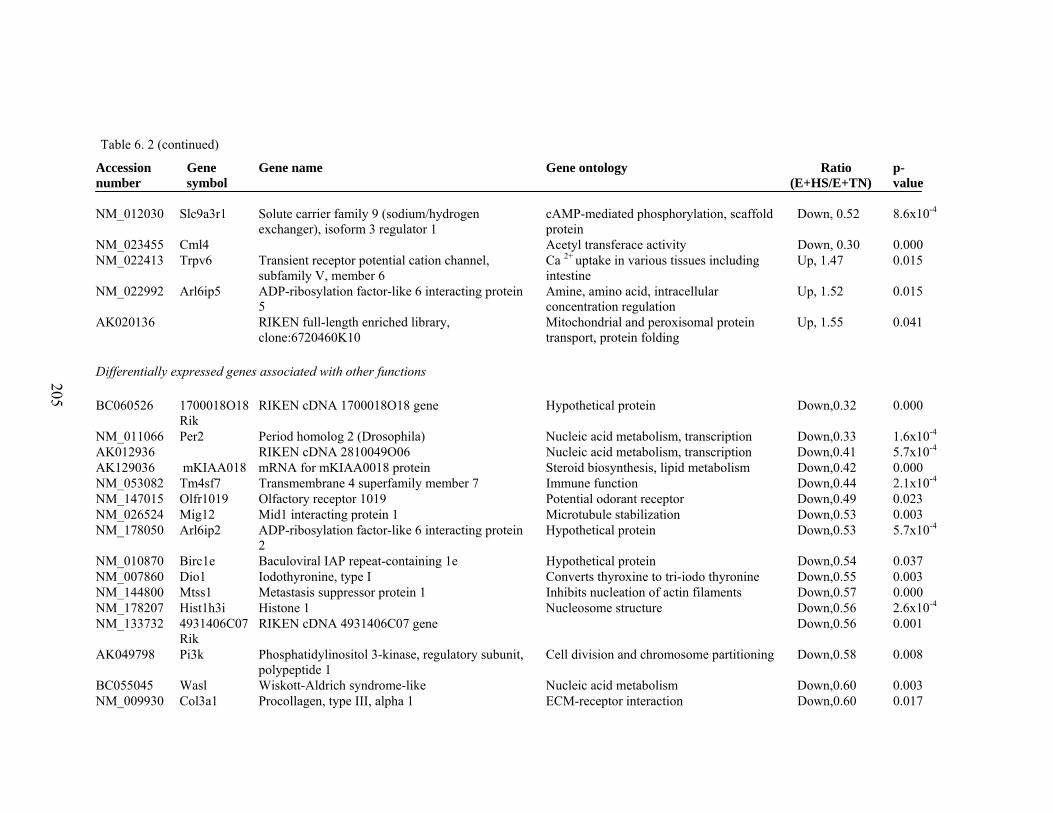
205
Accession number
Gene symbol
Gene name Gene ontology Ratio (E+HS/E+TN)
p- value
NM_012030 Slc9a3r1 Solute carrier family 9 (sodium/hydrogen exchanger), isoform 3 regulator 1
cAMP-mediated phosphorylation, scaffold protein
Down, 0.52 8.6x10⁻⁴
NM_023455 Cml4 Acetyl transferace activity Down, 0.30 0.000 NM_022413 Trpv6 Transient receptor potential cation channel,
subfamily V, member 6 Ca 2+ uptake in various tissues including intestine
Up, 1.47 0.015
NM_022992 Arl6ip5 ADP-ribosylation factor-like 6 interacting protein 5
Amine, amino acid, intracellular concentration regulation
Up, 1.52 0.015
AK020136 RIKEN full-length enriched library, clone:6720460K10
Mitochondrial and peroxisomal protein transport, protein folding
Up, 1.55 0.041
Differentially expressed genes associated with other functions BC060526 1700018O18
Rik RIKEN cDNA 1700018O18 gene Hypothetical protein Down,0.32 0.000
NM_011066 Per2 Period homolog 2 (Drosophila) Nucleic acid metabolism, transcription Down,0.33 1.6x10⁻⁴ AK012936 RIKEN cDNA 2810049O06 Nucleic acid metabolism, transcription Down,0.41 5.7x10⁻⁴ AK129036 mKIAA018 mRNA for mKIAA0018 protein Steroid biosynthesis, lipid metabolism Down,0.42 0.000 NM_053082 Tm4sf7 Transmembrane 4 superfamily member 7 Immune function Down,0.44 2.1x10⁻⁴ NM_147015 Olfr1019 Olfactory receptor 1019 Potential odorant receptor Down,0.49 0.023 NM_026524 Mig12 Mid1 interacting protein 1 Microtubule stabilization Down,0.53 0.003 NM_178050 Arl6ip2 ADP-ribosylation factor-like 6 interacting protein
2 Hypothetical protein Down,0.53 5.7x10⁻⁴
NM_010870 Birc1e Baculoviral IAP repeat-containing 1e Hypothetical protein Down,0.54 0.037 NM_007860 Dio1 Iodothyronine, type I Converts thyroxine to tri-iodo thyronine Down,0.55 0.003 NM_144800 Mtss1 Metastasis suppressor protein 1 Inhibits nucleation of actin filaments Down,0.57 0.000 NM_178207 Hist1h3i Histone 1 Nucleosome structure Down,0.56 2.6x10⁻⁴ NM_133732 4931406C07
Rik RIKEN cDNA 4931406C07 gene Down,0.56 0.001
AK049798 Pi3k Phosphatidylinositol 3-kinase, regulatory subunit, polypeptide 1
Cell division and chromosome partitioning Down,0.58 0.008
BC055045 Wasl Wiskott-Aldrich syndrome-like Nucleic acid metabolism Down,0.60 0.003 NM_009930 Col3a1 Procollagen, type III, alpha 1 ECM-receptor interaction Down,0.60 0.017
Table 6. 2 (continued)
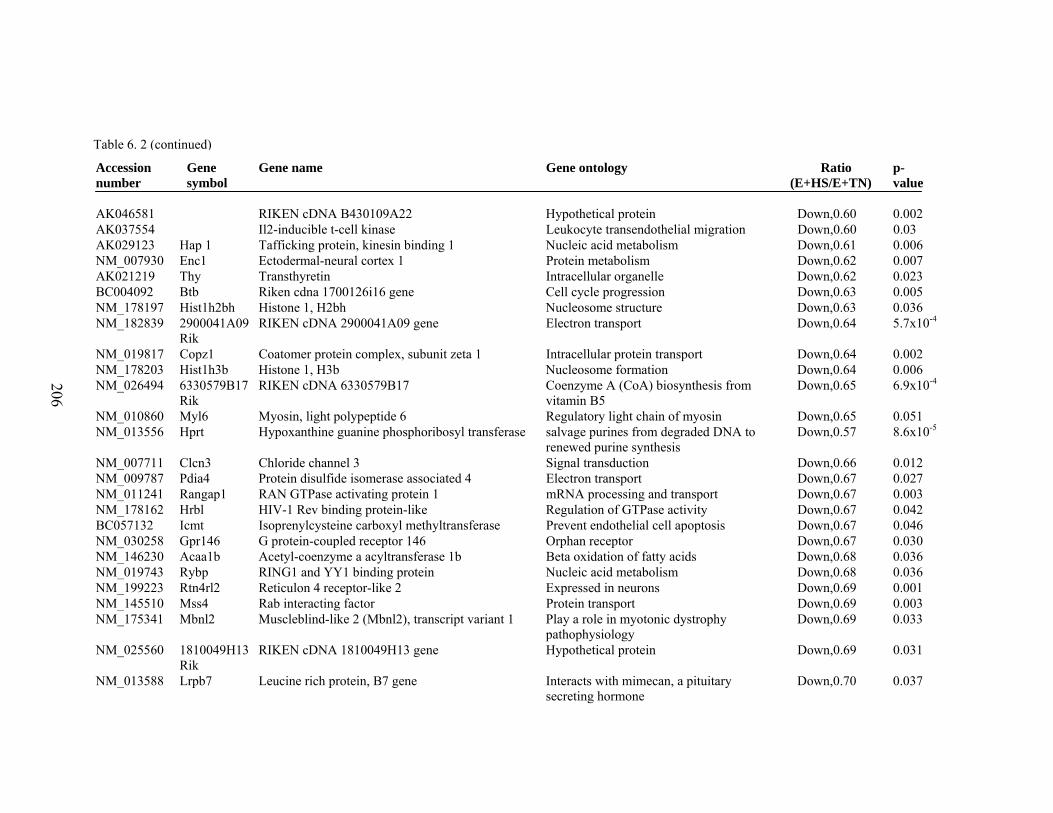
206
Accession number
Gene symbol
Gene name Gene ontology Ratio (E+HS/E+TN)
p- value
AK046581 RIKEN cDNA B430109A22 Hypothetical protein Down,0.60 0.002 AK037554 Il2-inducible t-cell kinase Leukocyte transendothelial migration Down,0.60 0.03 AK029123 Hap 1 Tafficking protein, kinesin binding 1 Nucleic acid metabolism Down,0.61 0.006 NM_007930 Enc1 Ectodermal-neural cortex 1 Protein metabolism Down,0.62 0.007 AK021219 Thy Transthyretin Intracellular organelle Down,0.62 0.023 BC004092 Btb Riken cdna 1700126i16 gene Cell cycle progression Down,0.63 0.005 NM_178197 Hist1h2bh Histone 1, H2bh Nucleosome structure Down,0.63 0.036 NM_182839 2900041A09
Rik RIKEN cDNA 2900041A09 gene Electron transport Down,0.64 5.7x10⁻⁴
NM_019817 Copz1 Coatomer protein complex, subunit zeta 1 Intracellular protein transport Down,0.64 0.002 NM_178203 Hist1h3b Histone 1, H3b Nucleosome formation Down,0.64 0.006 NM_026494 6330579B17
Rik RIKEN cDNA 6330579B17 Coenzyme A (CoA) biosynthesis from
vitamin B5 Down,0.65 6.9x10⁻⁴
NM_010860 Myl6 Myosin, light polypeptide 6 Regulatory light chain of myosin Down,0.65 0.051 NM_013556 Hprt Hypoxanthine guanine phosphoribosyl transferase salvage purines from degraded DNA to
renewed purine synthesis Down,0.57 8.6x10⁻⁵
NM_007711 Clcn3 Chloride channel 3 Signal transduction Down,0.66 0.012 NM_009787 Pdia4 Protein disulfide isomerase associated 4 Electron transport Down,0.67 0.027 NM_011241 Rangap1 RAN GTPase activating protein 1 mRNA processing and transport Down,0.67 0.003 NM_178162 Hrbl HIV-1 Rev binding protein-like Regulation of GTPase activity Down,0.67 0.042 BC057132 Icmt Isoprenylcysteine carboxyl methyltransferase Prevent endothelial cell apoptosis Down,0.67 0.046 NM_030258 Gpr146 G protein-coupled receptor 146 Orphan receptor Down,0.67 0.030 NM_146230 Acaa1b Acetyl-coenzyme a acyltransferase 1b Beta oxidation of fatty acids Down,0.68 0.036 NM_019743 Rybp RING1 and YY1 binding protein Nucleic acid metabolism Down,0.68 0.036 NM_199223 Rtn4rl2 Reticulon 4 receptor-like 2 Expressed in neurons Down,0.69 0.001 NM_145510 Mss4 Rab interacting factor Protein transport Down,0.69 0.003 NM_175341 Mbnl2 Muscleblind-like 2 (Mbnl2), transcript variant 1 Play a role in myotonic dystrophy
pathophysiology Down,0.69 0.033
NM_025560 1810049H13Rik
RIKEN cDNA 1810049H13 gene Hypothetical protein Down,0.69 0.031
NM_013588 Lrpb7 Leucine rich protein, B7 gene Interacts with mimecan, a pituitary secreting hormone
Down,0.70 0.037
Table 6. 2 (continued)
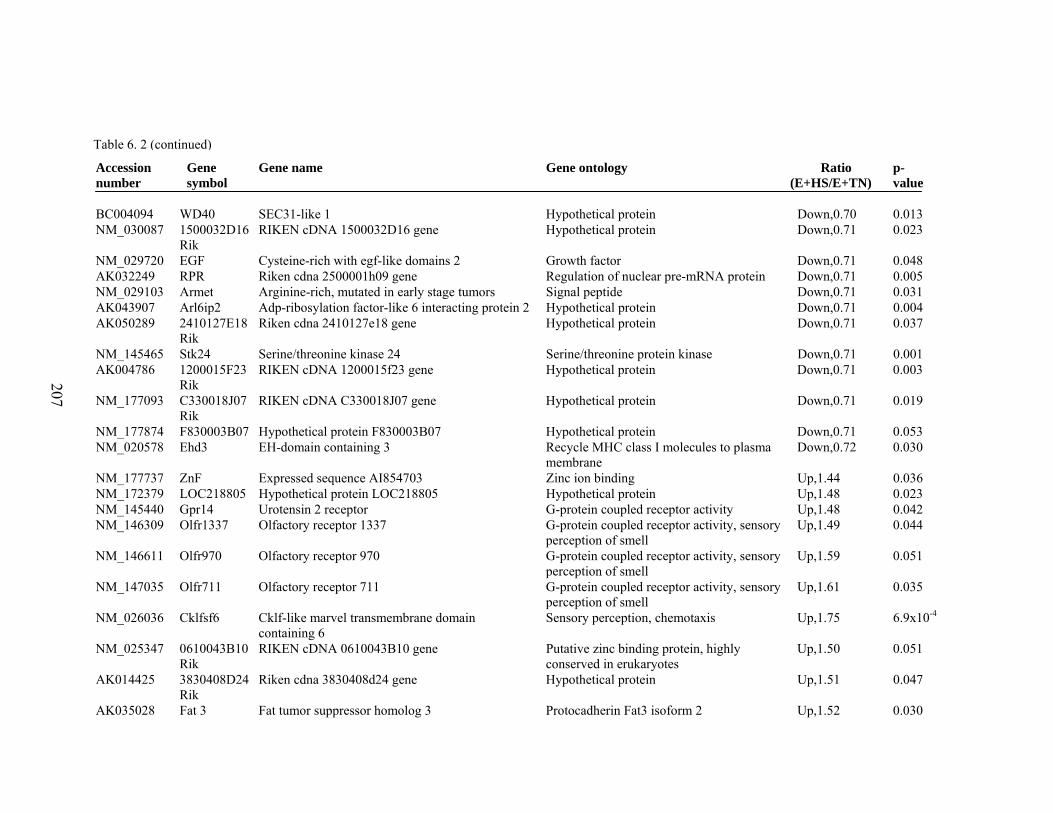
207
Accession number
Gene symbol
Gene name Gene ontology Ratio (E+HS/E+TN)
p- value
BC004094 WD40 SEC31-like 1 Hypothetical protein Down,0.70 0.013 NM_030087 1500032D16
Rik RIKEN cDNA 1500032D16 gene Hypothetical protein Down,0.71 0.023
NM_029720 EGF Cysteine-rich with egf-like domains 2 Growth factor Down,0.71 0.048 AK032249 RPR Riken cdna 2500001h09 gene Regulation of nuclear pre-mRNA protein Down,0.71 0.005 NM_029103 Armet Arginine-rich, mutated in early stage tumors Signal peptide Down,0.71 0.031 AK043907 Arl6ip2 Adp-ribosylation factor-like 6 interacting protein 2 Hypothetical protein Down,0.71 0.004 AK050289 2410127E18
Rik Riken cdna 2410127e18 gene Hypothetical protein Down,0.71 0.037
NM_145465 Stk24 Serine/threonine kinase 24 Serine/threonine protein kinase Down,0.71 0.001 AK004786 1200015F23
Rik RIKEN cDNA 1200015f23 gene Hypothetical protein Down,0.71 0.003
NM_177093 C330018J07Rik
RIKEN cDNA C330018J07 gene Hypothetical protein Down,0.71 0.019
NM_177874 F830003B07 Hypothetical protein F830003B07 Hypothetical protein Down,0.71 0.053 NM_020578 Ehd3 EH-domain containing 3 Recycle MHC class I molecules to plasma
membrane Down,0.72 0.030
NM_177737 ZnF Expressed sequence AI854703 Zinc ion binding Up,1.44 0.036 NM_172379 LOC218805 Hypothetical protein LOC218805 Hypothetical protein Up,1.48 0.023 NM_145440 Gpr14 Urotensin 2 receptor G-protein coupled receptor activity Up,1.48 0.042 NM_146309 Olfr1337 Olfactory receptor 1337 G-protein coupled receptor activity, sensory
perception of smell Up,1.49 0.044
NM_146611 Olfr970 Olfactory receptor 970 G-protein coupled receptor activity, sensory perception of smell
Up,1.59 0.051
NM_147035 Olfr711 Olfactory receptor 711 G-protein coupled receptor activity, sensory perception of smell
Up,1.61 0.035
NM_026036 Cklfsf6 Cklf-like marvel transmembrane domain containing 6
Sensory perception, chemotaxis Up,1.75 6.9x10⁻⁴
NM_025347 0610043B10Rik
RIKEN cDNA 0610043B10 gene Putative zinc binding protein, highly conserved in erukaryotes
Up,1.50 0.051
AK014425 3830408D24Rik
Riken cdna 3830408d24 gene Hypothetical protein Up,1.51 0.047
AK035028 Fat 3 Fat tumor suppressor homolog 3 Protocadherin Fat3 isoform 2 Up,1.52 0.030
Table 6. 2 (continued)
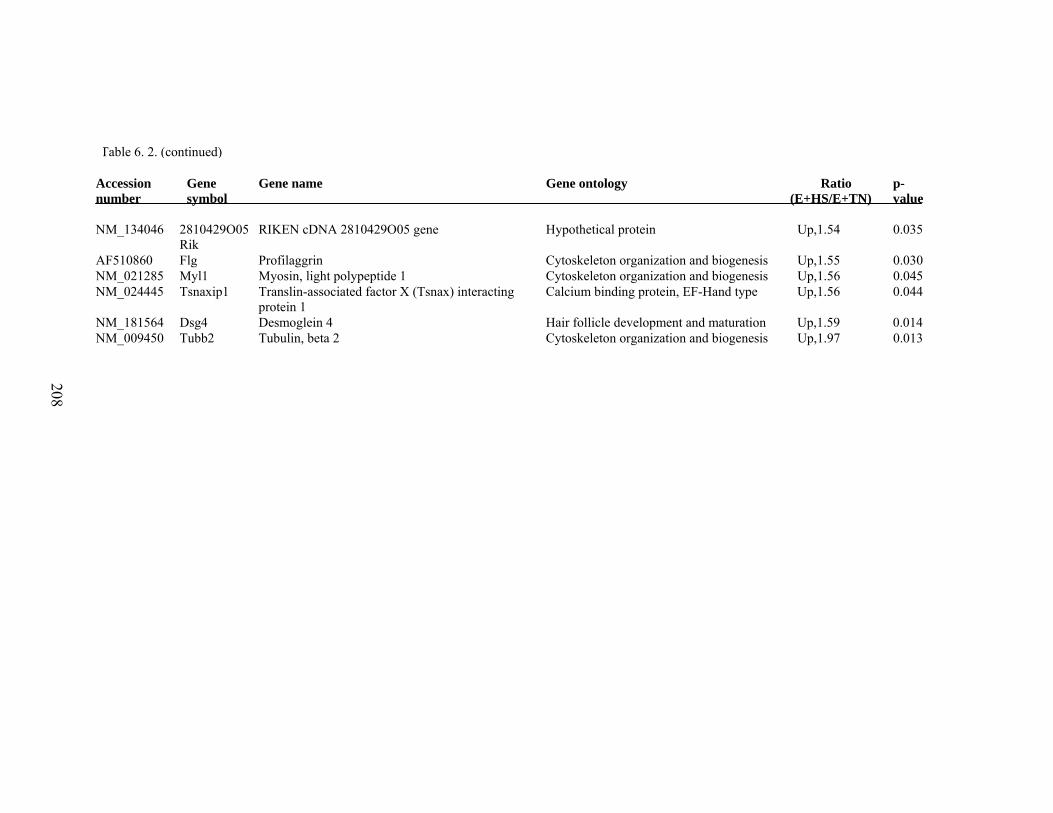
208
Accession number
Gene symbol
Gene name Gene ontology Ratio (E+HS/E+TN)
p- value
NM_134046 2810429O05Rik
RIKEN cDNA 2810429O05 gene Hypothetical protein Up,1.54 0.035
AF510860 Flg Profilaggrin Cytoskeleton organization and biogenesis Up,1.55 0.030 NM_021285 Myl1 Myosin, light polypeptide 1 Cytoskeleton organization and biogenesis Up,1.56 0.045 NM_024445 Tsnaxip1 Translin-associated factor X (Tsnax) interacting
protein 1 Calcium binding protein, EF-Hand type Up,1.56 0.044
NM_181564 Dsg4 Desmoglein 4 Hair follicle development and maturation Up,1.59 0.014 NM_009450 Tubb2 Tubulin, beta 2 Cytoskeleton organization and biogenesis Up,1.97 0.013
Table 6. 2. (continued)
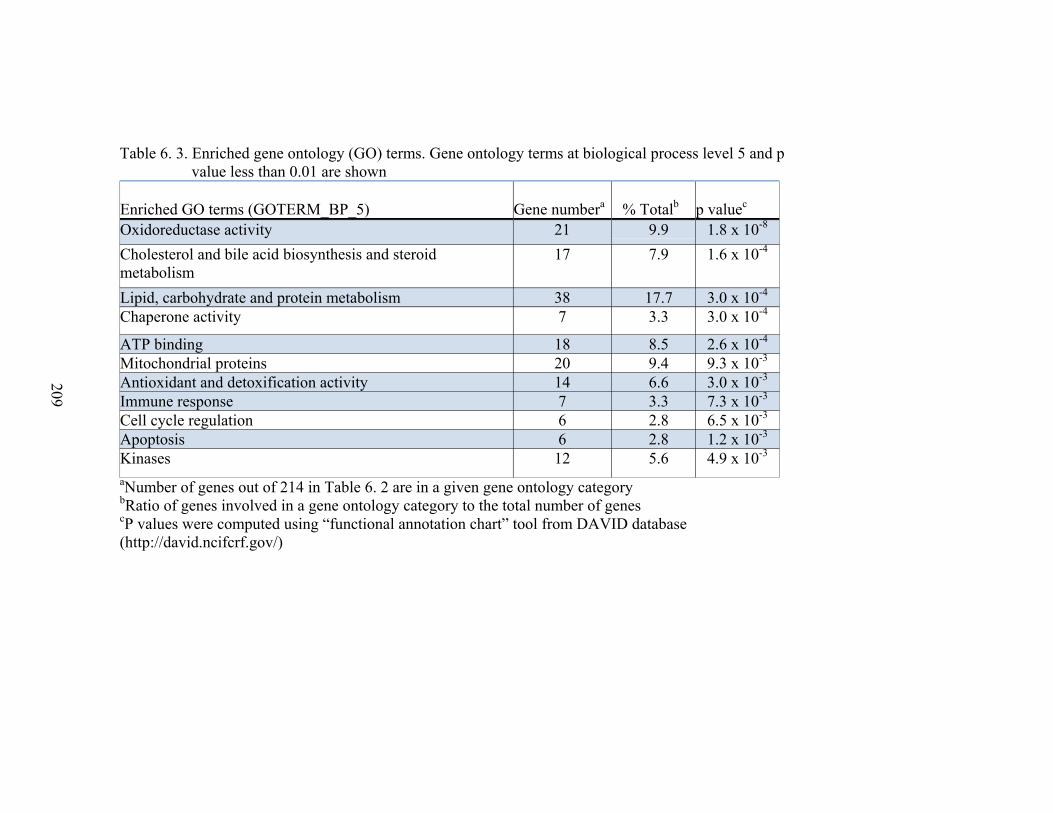
209
Table 6. 3. Enriched gene ontology (GO) terms. Gene ontology terms at biological process level 5 and p value less than 0.01 are shown
Enriched GO terms (GOTERM_BP_5)
Gene numbera
% Totalb
p valuec
Oxidoreductase activity 21 9.9 1.8 x 10⁻⁸ Cholesterol and bile acid biosynthesis and steroid metabolism
17 7.9 1.6 x 10⁻⁴
Lipid, carbohydrate and protein metabolism 38 17.7 3.0 x 10⁻⁴ Chaperone activity 7 3.3 3.0 x 10⁻⁴
ATP binding 18 8.5 2.6 x 10⁻⁴ Mitochondrial proteins 20 9.4 9.3 x 10⁻³ Antioxidant and detoxification activity 14 6.6 3.0 x 10⁻³ Immune response 7 3.3 7.3 x 10⁻³ Cell cycle regulation 6 2.8 6.5 x 10⁻³ Apoptosis 6 2.8 1.2 x 10⁻³ Kinases 12 5.6 4.9 x 10⁻³ aNumber of genes out of 214 in Table 6. 2 are in a given gene ontology category bRatio of genes involved in a gene ontology category to the total number of genes cP values were computed using “functional annotation chart” tool from DAVID database (http://david.ncifcrf.gov/)
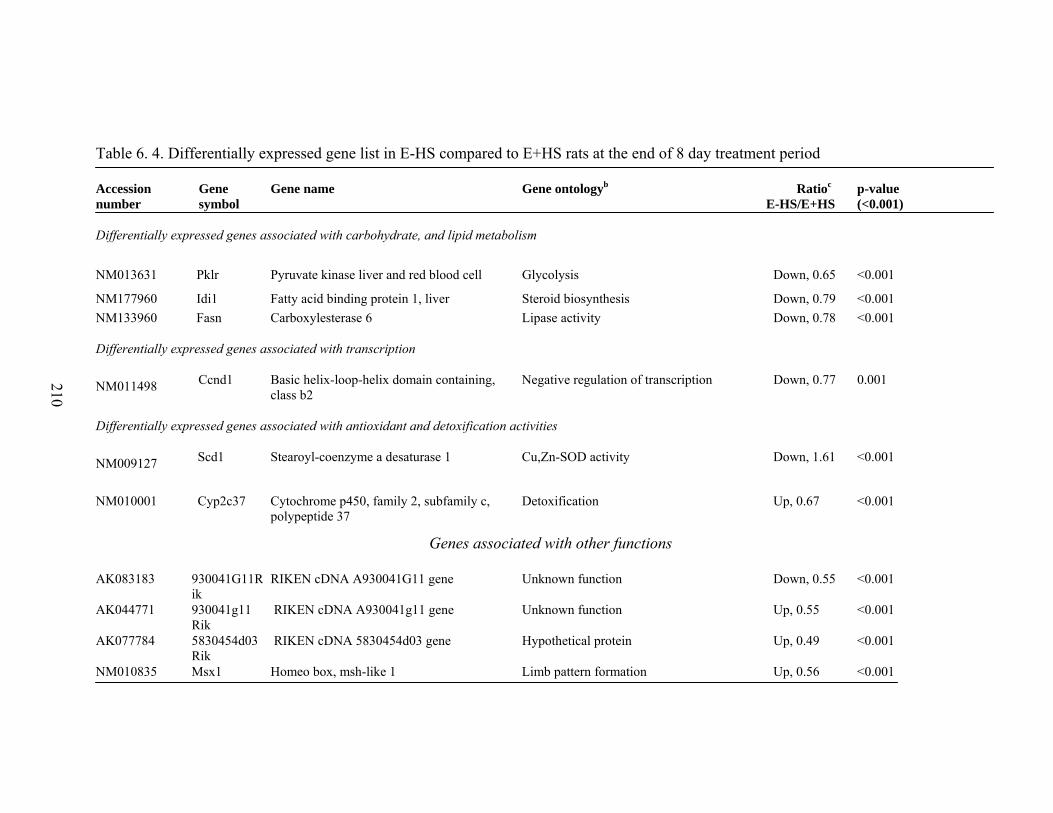
210
Table 6. 4. Differentially expressed gene list in E-HS compared to E+HS rats at the end of 8 day treatment period Accession number
Gene symbol
Gene name Gene ontologyb Ratioc E-HS/E+HS
p-value (<0.001)
Differentially expressed genes associated with carbohydrate, and lipid metabolism
NM013631 Pklr Pyruvate kinase liver and red blood cell Glycolysis Down, 0.65 <0.001
NM177960 Idi1 Fatty acid binding protein 1, liver Steroid biosynthesis Down, 0.79 <0.001 NM133960 Fasn Carboxylesterase 6 Lipase activity Down, 0.78 <0.001 Differentially expressed genes associated with transcription
NM011498 Ccnd1 Basic helix-loop-helix domain containing, class b2
Negative regulation of transcription Down, 0.77 0.001
Differentially expressed genes associated with antioxidant and detoxification activities
NM009127 Scd1 Stearoyl-coenzyme a desaturase 1 Cu,Zn-SOD activity Down, 1.61 <0.001
NM010001 Cyp2c37 Cytochrome p450, family 2, subfamily c, polypeptide 37
Detoxification
Up, 0.67 <0.001
AK083183 930041G11R
ik RIKEN cDNA A930041G11 gene Unknown function Down, 0.55 <0.001
AK044771 930041g11 Rik
RIKEN cDNA A930041g11 gene Unknown function Up, 0.55 <0.001
AK077784 5830454d03Rik
RIKEN cDNA 5830454d03 gene Hypothetical protein Up, 0.49 <0.001
NM010835 Msx1 Homeo box, msh-like 1 Limb pattern formation Up, 0.56 <0.001
Genes associated with other functions
211
CHAPTER VII
CHRONIC EFFECTS OF HEAT STRESS AND/OR ERGOT
ALKALOIDS ON RAT HEPATIC GENE EXPRESSION
1. ABSTRACT
Intake of ergot alkaloids associated with endophyte-infected fescue (E+) has
adverse effects on animal health and productivity, which is collectively, termed fescue
toxicosis. These effects are exacerbated under hot and humid (summer) conditions. A rat
model for this condition was used to evaluate the effect of endophytic toxins on hepatic
gene expression under long-term (three weeks) heat stress (HS). Both E+ and HS induced
alterations in hepatic genes were evaluated using DNA microarrays. Rats (n = 12) were
fed ad libitum an E+ diet and maintained under thermoneutral (TN) conditions (21˚C) for
five days, followed by TN or HS (31˚C) conditions for three weeks. At the end of
treatment period, rats were euthanized and the liver tissue was used for microarray
analysis. Long-term intake of an E+ diet under TN conditions, in the present study, up-
regulated genes coding for immune and electron-transport functions but down-regulated
genes associated with antioxidant, xenobiotic, and chaperonic activities. Down-regulation
of these essential pathways might contribute to the chronic signs associated with fescue
toxicosis under TN conditions. Long-term intake of an E+ diet under HS conditions (E-
212
HS versus E+HS) down-regulated genes coding for immune system, as well as
carbohydrate, lipid, and protein metabolism. Chronic HS (E-TN versus E-HS) in the
present study down-regulated genes associated with cell proliferation, detoxification,
ATP synthesis, and immune function. The E+ diet intake under long-term HS conditions
up-regulated genes coding for apoptosis and detoxification but down-regulated genes
associated with immune and antioxidant functions, as well as carbohydrate, lipid, and
protein metabolism. Taken together the results from the present study suggested that
long-term HS exposure increased the susceptibility of rats to oxidative stress. In addition,
E+ diet intake further affected the animals’ antioxidant and immune systems as well as
chaperone activity, making them potentially more susceptible to oxidative and other
stressors which contribute to fescue toxicosis.
2. INTRODUCTION
Intake of ergot alkaloids produced by the endophytic fungus Neotyphodium
coenophialum results in a toxicological syndrome called fescue toxicosis. These ergot
alkaloids, by virtue of their agonistic stimulation of alpha-1 adrenergic receptors,
vasoconstrict peripheral blood vessels (Oliver, 2005). This impairs heat transfer from
core to peripheral tissues, which produces hyperthermia. In addition, some ergot alkalids
are agonisits for serotonin receptors that reduce vascular lumen size (through mitogenic
activation of vascular smooth muscle cells) and impaire thermoregulatory and satiety
centers in the hypothalamus (Oliver, 2005). This also increases core body temperature
and suppresses appetite during heat stress (HS). Therefore, fescue toxicosis-related
213
problems are exacerbated during heat stress, resulting in hyperthermia and reduced
growth rate (Spiers et al., 2005a).
The liver is the most important organ for xenobiotic metabolism and
detoxification, and this first pass effect of the mysenteric blood flow makes it a target
organ of fescue toxicosis (Oliver, 1997). Long-term intake of an endophyte-infected (E+)
diet by cattle increases liver-specific enzymes (Piper et al., 1991). Likewise, fescue
toxicosis in rats actually reduces liver weight (Settivari et al., 2006). Chestnut et al.
(1992) noted that this reduction in rats fed an E+ diet is similar to rats fed a control diet at
the same caloric level (i.e., pair-fed group). Although it is possible that the clinical signs
associated with fescue toxicosis are due to both direct and indirect (i.e., reduced caloric
intake) effects on hepatic function, the objective of this preliminary study was to
determine the overall impact of fescue toxicosis on hepatic gene expression under long-
term heat stress conditions.
The majority of gene expression studies of HS have concentrated on the response
to challenge with severe heat stress (41 - 42°C) for a short time period (30 to 60 min).
However, in the real world animals are often exposed to chronic heat stress conditions
(one to two months) at a lower ambient temperature between 33 to 35°C (Jordan, 2003;
St-Pierre et al., 2003).
A previous study revealed that various genes associated with ATP synthesis,
chaperone activity, and both antioxidant and immune systems were down-regulated in
rats fed an E+ diet for five days at thermoneutrality (TN) followed by three days at HS
(see chapter VI). It is expected that animals under chronic HS will exhibit different
responses compared to acute HS. Spiers et al. (2005a) observed signs of adaptation in E+
214
rat physiological parameters under long-term TN and HS conditions. It was hypothesized
that rats in the present study would exhibit similar signs of adaptation to fescue toxicosis
under TN or HS conditions or to HS alone at gene level. This research is one of the first
attempts to determine changes in hepatic gene expression in rats that is associated with
fescue toxicosis during long-term HS.
3. MATERIALS AND METHODS
Animals and treatment diets
Male Sprague-Dawley rats (n = 12; 42 days of age at start; Charles River
Laboratories, Willington, MA), were maintained on a 12 h light/dark cycle and at TN
(21°C) as described earlier (Spiers et al., 2005a; Settivari et al., 2006). Feed and water
were provided ad libitum throughout the study. Uninfected control (E-diet, containing
endophyte free fescue seed) and treatment diet compositions were as previously
described, with the treatment diet adjusted to provide a specific amount of ergovaline
(EV; 91.5 μg/kg BW/day) (Spiers et al., 2005a). Ergovaline content in E+ seed was
4,100 ppb on a DM basis, as measured by HPLC (detection limit = 50 ppb and CV = 7%;
Rottinghaus et al., 1993). All diets were stored at 4°C prior to use. Animal procedures
followed guidelines for humane treatment set by the University of Missouri Animal Care
and Use Committee.
Treatment period and sample collection
The experimental schedule consisted initially of an 8 day recovery period after ip
implantation of telemetric temperature transmitters (Model VM-FH; Mini-Mitter
215
Company, Inc., Bend, OR) to record Tc and Ac. This was followed by a 5 day
pretreatment period, during which Tc, FI, and BW were measured to establish a baseline
for statistical analysis (Spiers et al., 2005a). During recovery and pretreatment periods,
rats were fed the E- diet, whereas during the 26 day treatment period, the rats were fed E-
or E+ diets. At the end of 5 days of treatment at TN, rats were divided into two groups,
one maintained under continuous HS (31˚C) and the other continuing at TN for 21
additional days. During treatment, Tc was collected at 10 minute intervals, with daily
measurement of FI and BW at 0800 hour. At the end of the study, rats were anesthetized
by im injection of a xylazine (13 mg/mL)-ketamine (87 mg/mL) cocktail (0.1 mL/100g)
and exsanguinated. The liver was also collected and weighed. A section from the middle
lobe of liver (~5 g) was snap-frozen in liquid nitrogen for microarray and real time-PCR
experiments.
Microarray slide preparation
Microarray slides were prepared by printing 27,000 oligonucleotides (70 mer
probes with an amino modification on the 5’ end) specific to mouse liver (Oligator
MEEBO mouse genome set, Illumina Inc., Hayward, CA) on GAPS II glass slides
(Corning Incorporated, Corning, NY) using a 32-pin robotic microarray printer. Prior to
hybridization, the microarray slides were re-hydrated to increase the spot size and spread
the DNA more uniformly within each spot. Following the re-hydration for 30 seconds at
55°C, the slides were snap-dried on a 100°C hot plate surface for 5 seconds. Then the
slides were UV cross-linked using UV cross-linker (600 mJoules). Microarray slides
were then incubated in 0.2% I-block (Tropix/Serva, Heidelberg, Germany) in 1 × PBS
buffer for at least one hour at 42˚C to decrease background and increase specificity. The
216
slides were then washed with 0.2% SDS once and water twice (three minutes per wash).
This was followed by drying via centrifugation and dark storage.
RNA extraction
Total RNA was extracted from the liver samples using an RNeasy Midi Kit
(Qiagen Inc., Valencia, CA), purified using DNase-1 (Ambion Inc., Austin, TX) and
phenol:chloroform:isoamyl alcohol (25:24:1), and concentrated using Microcon YM30
filters (Millipore Corp., Bedford, MA) as described earlier (Settivari et al., 2006). The
quality and integrity of the purified RNA was checked through agarose gel
electrophoresis and the quantity was measured using an ND-1000 spectrophotometer
(Nanodrop Technologies, Wilmington, DE; Flanagan, 2005). The purified RNA samples
were preserved at -80˚C.
Microarray hybridization
A loop design was used for microarray experiments, with five biological
replicates (five animals/treatment group) and three technical replicates (each RNA
sample repeated on three different arrays). Concentrated and purified total RNA (15 µg)
from each rat liver was reverse-transcribed to cDNA using oligo dT (IDT DNA,
Coralville, IA), random hexamers (IDT DNA), 50 x amino-allyl dUTP (Sigma
Chemicals, St. Louis, MO), and reverse transcription (StrataScript RT, Stratagene, La
Jolla, CA). Resulting cDNA was purified using Microcon-30 filters (Millipore) and
conjugated with either Cy3 or Cy5 mono reaction dyes separately by incubating in the
dark for one hour. Conjugated cDNA was separated from free, unconjugated dye using a
Qia-quick PCR purification kit (Qiagen) following the manufacturer’s instructions. The
two cDNA samples, labeled with Cy3 and Cy5 dyes, were mixed together and dried. The
217
dried cDNA pellet was resuspended with the hybridization mixture, which consisted of
1× 4-(2-hydroxyethyl)-1-piperazineethanesulfonic acid (pH 7.0), poly A (10 µg/µL;
Stratagene), rat Cot-I DNA (3.2 µg/µL), 20 × standard saline citrate (SSC; Stratagene),
and 10% sodium dodecyl sulfate (SDS). The slides were incubated in a water bath (60°C)
for 12 to 16 h. After incubation, the slides were rinsed in wash solution I (20 × SSC, and
10% SDS) and then in wash solution II (20 × SSC).
Microarray slide scanning and analysis
Microarray slides were scanned using a GenePix 4000B Microarray Scanner
(Axon Instruments, Union City, CA) at 5 µm resolution, and the image was analyzed
using GenePix Pro 4.0.1.12 software (Axon Instruments Inc., Union City, CA). The
resulting files and the images were linked together and stored in the local BioArray
Software Environment (BASE) database (Saal et al., 2002). Microarray raw data files
were deposited with the National Center for Biotechnology Information Gene Expression
Omnibus (http://www.ncbi.nlm.nih.gov/projects/geo). The serial entry number for the
microarray data was GSE8754, and the platform number was GPL5357. Each
hybridization in the microarray experiment was given the following serial numbers:
GSM216884, GSM216889, GSM216894, GSM217199, GSM217309, GSM217310,
GSM217311, GSM217312, GSM217313, GSM217314, GSM217315, GSM217316,
GSM217317, GSM217318, GSM217319, GSM217320, GSM217321, GSM217322,
GSM217343, GSM217345, GSM217346, GSM217347, GSM217348, GSM217349,
GSM217350, GSM217351, GSM217352, GSM217353, GSM217354, GSM217355.
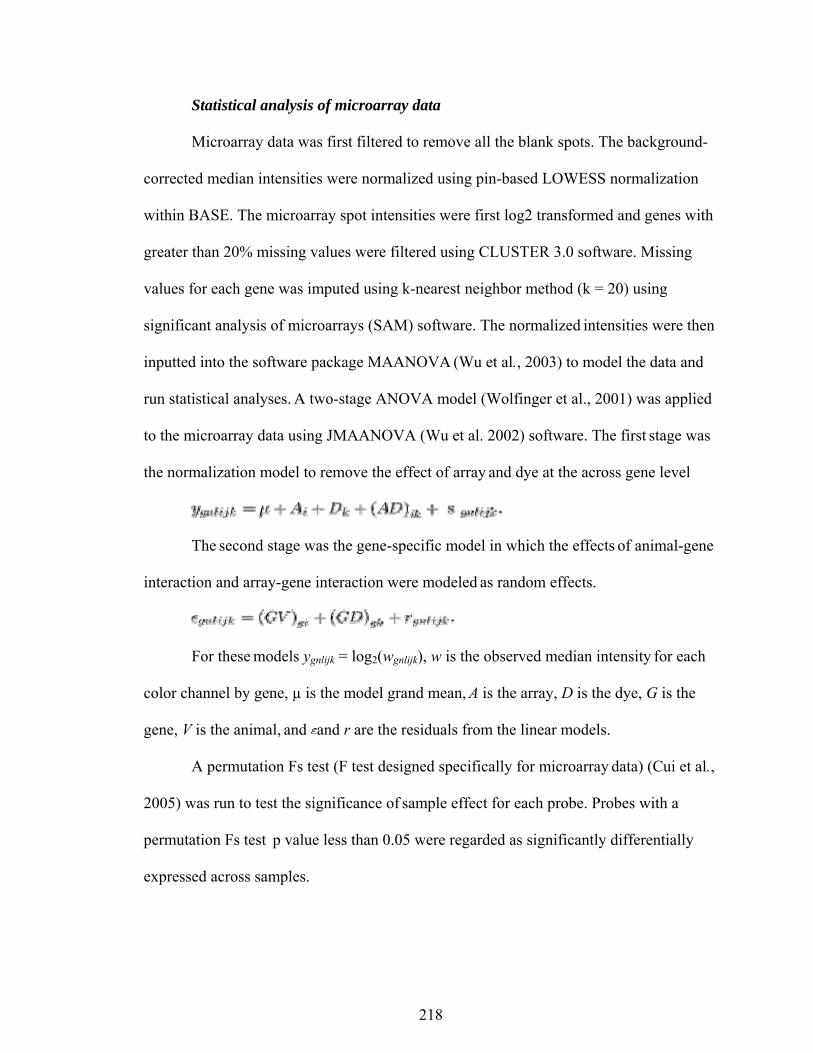
218
Statistical analysis of microarray data
Microarray data was first filtered to remove all the blank spots. The background-
corrected median intensities were normalized using pin-based LOWESS normalization
within BASE. The microarray spot intensities were first log2 transformed and genes with
greater than 20% missing values were filtered using CLUSTER 3.0 software. Missing
values for each gene was imputed using k-nearest neighbor method (k = 20) using
significant analysis of microarrays (SAM) software. The normalized intensities were then
inputted into the software package MAANOVA (Wu et al., 2003) to model the data and
run statistical analyses. A two-stage ANOVA model (Wolfinger et al., 2001) was applied
to the microarray data using JMAANOVA (Wu et al. 2002) software. The first stage was
the normalization model to remove the effect of array and dye at the across gene level
The second stage was the gene-specific model in which the effects of animal-gene
interaction and array-gene interaction were modeled as random effects.
For these models ygnlijk = log2(wgnlijk), w is the observed median intensity for each
color channel by gene, µ is the model grand mean, A is the array, D is the dye, G is the
gene, V is the animal, and and r are the residuals from the linear models.
A permutation Fs test (F test designed specifically for microarray data) (Cui et al.,
2005) was run to test the significance of sample effect for each probe. Probes with a
permutation Fs test p value less than 0.05 were regarded as significantly differentially
expressed across samples.
219
The first stage was the use of the normalization model to remove the effects of
array and dye. The residual from this model was used in the second stage analysis, which
is a gene-specific model, where the effects of sample-gene interaction and array-gene
interaction were modeled with both effects at random. To test the significance of sample
effect for each probe (500 permutations), the Fs test (Cui et al., 2005) was used. Genes,
with an adjusted permutation Fs test (False Discovery Rate; FDR) p values less than 0.05
were regarded as significantly differentially expressed across samples. This differentially
expressed gene list was then filtered to remove genes with a fold change of less than 1.4
(value obtained from mean ± 2 SD of five self-self hybridizations).
A second type of microarray analysis was performed which measures the gene
expression across each individual animal (gene by animal model) using JMAANOVA
program. Values obtained from this analysis were used to cluster similarly expressed
genes using TIGR multi-experiment viewer software (TM4-Mev; Saeed et al., 2003). The
hierarchical cluster tree obtained was confirmed using bootstrap (Kerr and Churchill,
2002) analysis. The DAVID (Dennis et al., 2003) and Entrez-Gene
(http://www.ncbi.nih.gov/entrez/querry.fcgi?db=gene) from the National Center for
Biotechnology Information were used to find the gene annotation and the functions of
differentially expressed genes.
Quantitative real-time PCR
Two-step qRT-PCR was used to confirm expression patterns of differentially
expressed genes in the study. Expression profile of five randomly selected genes was
measured with qRT-PCR. From each rat, 10 µg of total RNA was reverse transcribed
using Stratascript RT (Stratagene, La Jolla, CA) with oligo dT and random hexamer
220
primers. Then, 6.25 ng of cDNA was added to a 25 µL of final PCR reaction mixture to
get a final concentration of 0.25 ng/µL of cDNA in a SYBR green assay (Applied
Biosystems, Warrington, UK). Forward and reverse primer final concentrations were 100
nM in the SYBR green assay. Primers were designed using Primer3 (Rozen and
Skalesky, 2000) with an annealing temperature of 60˚C and amplification size of less
than 250 base pairs. Glyceraldehyde phosphate dehydrogenase (GAPDH) was used as the
endogenous control gene in the qRT-PCR experiments. Thermal cycling was carried out
with an ABI Prism 7500 sequence detection system (Applied Biosystems Warrington,
UK) under factory default conditions ( 50°C, 2 min; 95°C 10 min; and 40 cycles at 95ºC,
15 sec; 60 ºC 1 min). Each gene was measured in triplicates and the formation of single
PCR product was confirmed using dissociation curves. Negative controls, which
consisted of all the components of PCR mix except cDNA, were used for all the primers.
The relative quantification of gene expression changes were recorded after normalizing
for GAPDH gene expression computed by using the 2-ΔΔCT method (user manual #2, ABI
Prism 7700 SDS). In the 2-ΔΔCT analysis, the threshold cycle (CT) from E-TN rats was
used as a calibrator sample. Statistical analyses of the data were performed by comparing
E+TN, E-HS and E+HS CT with E-TN CT for each gene using a two-tailed t-test with
unequal group variance.
4. RESULTS
Physiological responses for this study are explained in detail in Chapter 3. For
better understanding, genomic responses for this study have been divided into five
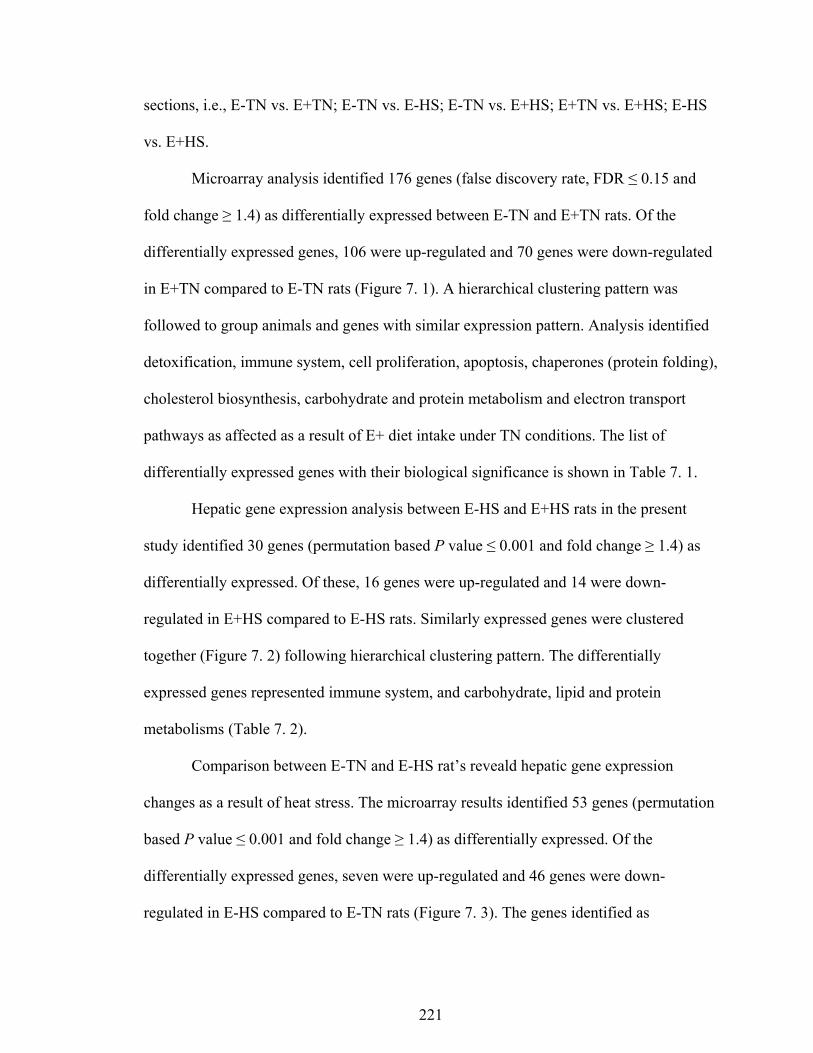
221
sections, i.e., E-TN vs. E+TN; E-TN vs. E-HS; E-TN vs. E+HS; E+TN vs. E+HS; E-HS
vs. E+HS.
Microarray analysis identified 176 genes (false discovery rate, FDR ≤ 0.15 and
fold change ≥ 1.4) as differentially expressed between E-TN and E+TN rats. Of the
differentially expressed genes, 106 were up-regulated and 70 genes were down-regulated
in E+TN compared to E-TN rats (Figure 7. 1). A hierarchical clustering pattern was
followed to group animals and genes with similar expression pattern. Analysis identified
detoxification, immune system, cell proliferation, apoptosis, chaperones (protein folding),
cholesterol biosynthesis, carbohydrate and protein metabolism and electron transport
pathways as affected as a result of E+ diet intake under TN conditions. The list of
differentially expressed genes with their biological significance is shown in Table 7. 1.
Hepatic gene expression analysis between E-HS and E+HS rats in the present
study identified 30 genes (permutation based P value ≤ 0.001 and fold change ≥ 1.4) as
differentially expressed. Of these, 16 genes were up-regulated and 14 were down-
regulated in E+HS compared to E-HS rats. Similarly expressed genes were clustered
together (Figure 7. 2) following hierarchical clustering pattern. The differentially
expressed genes represented immune system, and carbohydrate, lipid and protein
metabolisms (Table 7. 2).
Comparison between E-TN and E-HS rat’s reveald hepatic gene expression
changes as a result of heat stress. The microarray results identified 53 genes (permutation
based P value ≤ 0.001 and fold change ≥ 1.4) as differentially expressed. Of the
differentially expressed genes, seven were up-regulated and 46 genes were down-
regulated in E-HS compared to E-TN rats (Figure 7. 3). The genes identified as
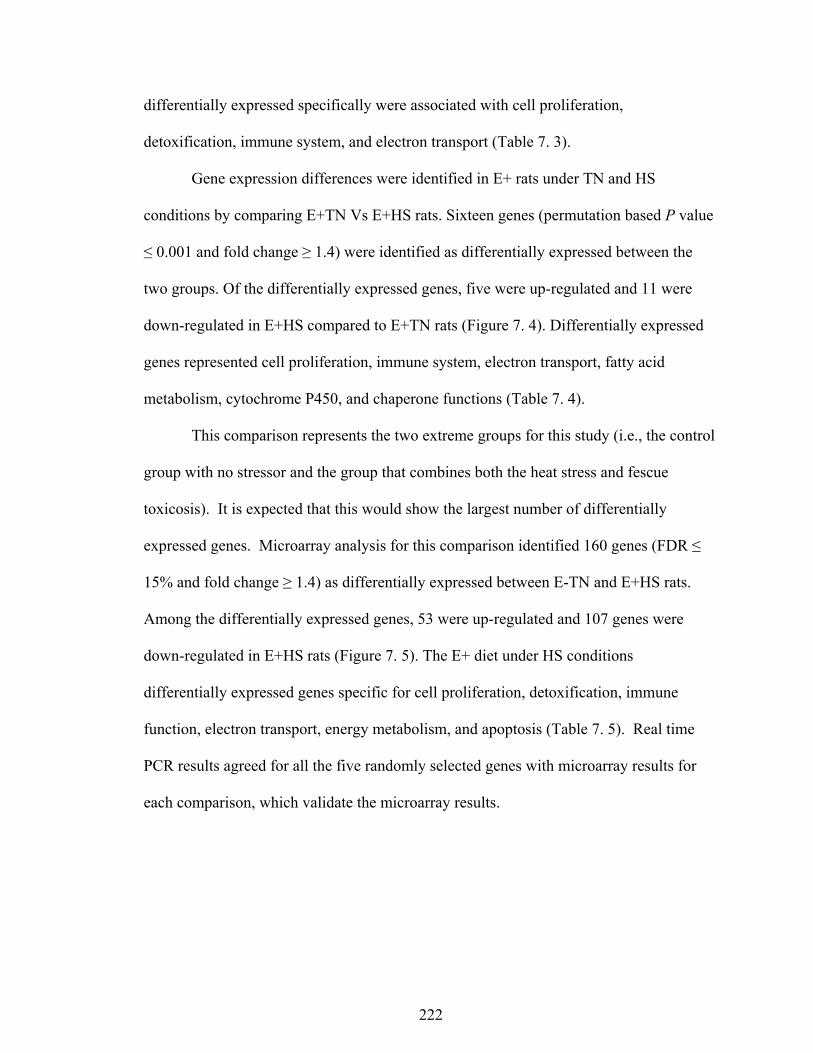
222
differentially expressed specifically were associated with cell proliferation,
detoxification, immune system, and electron transport (Table 7. 3).
Gene expression differences were identified in E+ rats under TN and HS
conditions by comparing E+TN Vs E+HS rats. Sixteen genes (permutation based P value
≤ 0.001 and fold change ≥ 1.4) were identified as differentially expressed between the
two groups. Of the differentially expressed genes, five were up-regulated and 11 were
down-regulated in E+HS compared to E+TN rats (Figure 7. 4). Differentially expressed
genes represented cell proliferation, immune system, electron transport, fatty acid
metabolism, cytochrome P450, and chaperone functions (Table 7. 4).
This comparison represents the two extreme groups for this study (i.e., the control
group with no stressor and the group that combines both the heat stress and fescue
toxicosis). It is expected that this would show the largest number of differentially
expressed genes. Microarray analysis for this comparison identified 160 genes (FDR ≤
15% and fold change ≥ 1.4) as differentially expressed between E-TN and E+HS rats.
Among the differentially expressed genes, 53 were up-regulated and 107 genes were
down-regulated in E+HS rats (Figure 7. 5). The E+ diet under HS conditions
differentially expressed genes specific for cell proliferation, detoxification, immune
function, electron transport, energy metabolism, and apoptosis (Table 7. 5). Real time
PCR results agreed for all the five randomly selected genes with microarray results for
each comparison, which validate the microarray results.
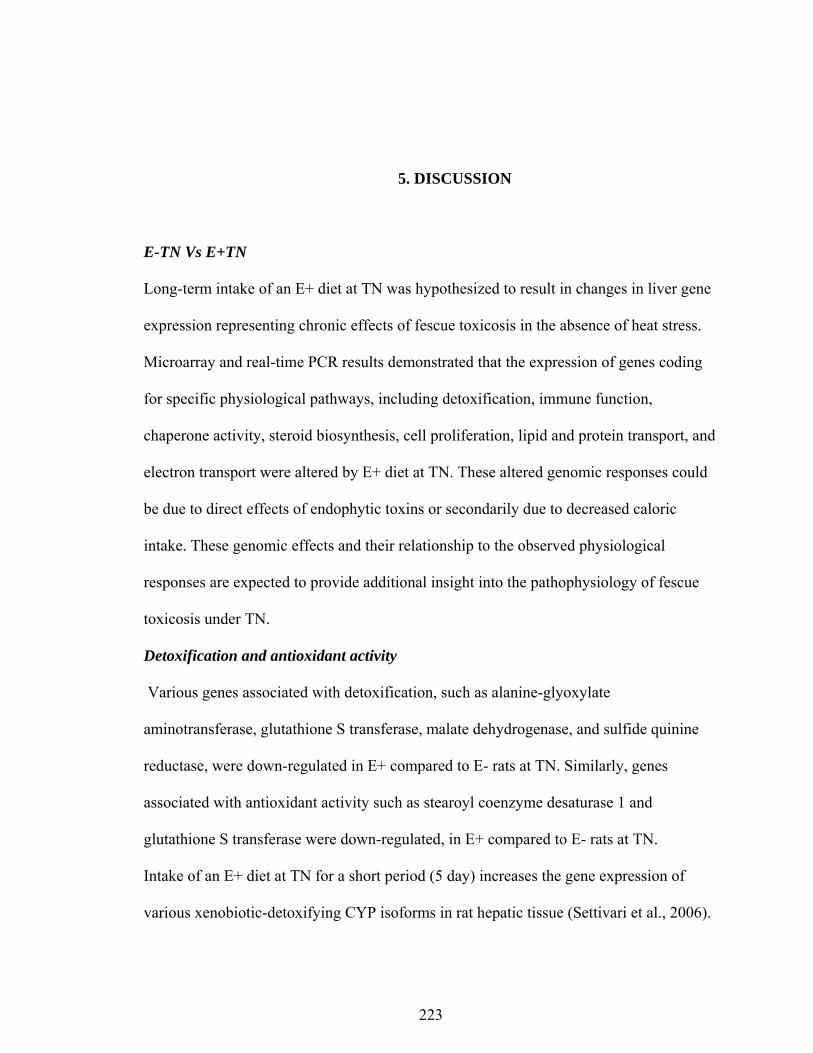
223
5. DISCUSSION
E-TN Vs E+TN
Long-term intake of an E+ diet at TN was hypothesized to result in changes in liver gene
expression representing chronic effects of fescue toxicosis in the absence of heat stress.
Microarray and real-time PCR results demonstrated that the expression of genes coding
for specific physiological pathways, including detoxification, immune function,
chaperone activity, steroid biosynthesis, cell proliferation, lipid and protein transport, and
electron transport were altered by E+ diet at TN. These altered genomic responses could
be due to direct effects of endophytic toxins or secondarily due to decreased caloric
intake. These genomic effects and their relationship to the observed physiological
responses are expected to provide additional insight into the pathophysiology of fescue
toxicosis under TN.
Detoxification and antioxidant activity
Various genes associated with detoxification, such as alanine-glyoxylate
aminotransferase, glutathione S transferase, malate dehydrogenase, and sulfide quinine
reductase, were down-regulated in E+ compared to E- rats at TN. Similarly, genes
associated with antioxidant activity such as stearoyl coenzyme desaturase 1 and
glutathione S transferase were down-regulated, in E+ compared to E- rats at TN.
Intake of an E+ diet at TN for a short period (5 day) increases the gene expression of
various xenobiotic-detoxifying CYP isoforms in rat hepatic tissue (Settivari et al., 2006).
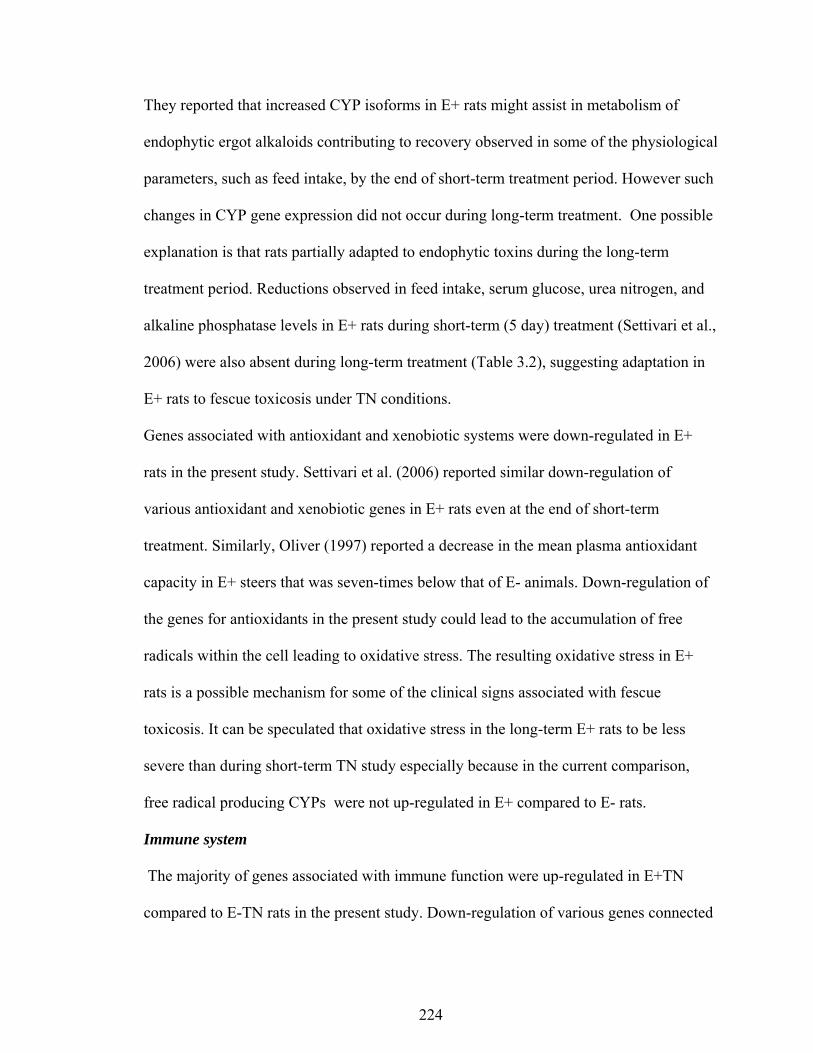
224
They reported that increased CYP isoforms in E+ rats might assist in metabolism of
endophytic ergot alkaloids contributing to recovery observed in some of the physiological
parameters, such as feed intake, by the end of short-term treatment period. However such
changes in CYP gene expression did not occur during long-term treatment. One possible
explanation is that rats partially adapted to endophytic toxins during the long-term
treatment period. Reductions observed in feed intake, serum glucose, urea nitrogen, and
alkaline phosphatase levels in E+ rats during short-term (5 day) treatment (Settivari et al.,
2006) were also absent during long-term treatment (Table 3.2), suggesting adaptation in
E+ rats to fescue toxicosis under TN conditions.
Genes associated with antioxidant and xenobiotic systems were down-regulated in E+
rats in the present study. Settivari et al. (2006) reported similar down-regulation of
various antioxidant and xenobiotic genes in E+ rats even at the end of short-term
treatment. Similarly, Oliver (1997) reported a decrease in the mean plasma antioxidant
capacity in E+ steers that was seven-times below that of E- animals. Down-regulation of
the genes for antioxidants in the present study could lead to the accumulation of free
radicals within the cell leading to oxidative stress. The resulting oxidative stress in E+
rats is a possible mechanism for some of the clinical signs associated with fescue
toxicosis. It can be speculated that oxidative stress in the long-term E+ rats to be less
severe than during short-term TN study especially because in the current comparison,
free radical producing CYPs were not up-regulated in E+ compared to E- rats.
Immune system
The majority of genes associated with immune function were up-regulated in E+TN
compared to E-TN rats in the present study. Down-regulation of various genes connected
225
to pro-inflammatory responses, such as growth differentiation factor 5, interleukin 1
receptor type I; and up-regulation of dual specificity phosphatase 1 (a negative regulator
of inflammation), opioid receptor, sigma 1 (an inhibitor of synthesis of pro-inflammatory
cytokines) suggest reduced inflammatory reactions in E+ rats during chronic TN
conditions. In support to the present findings, Filipov et al. (2000) reported anti-
inflammatory effects of ergotamine in steers. They noted that pretreatment (i.v. injection;
30 min. prior to LPS injection) of steers with 40 µg ergotamine/kg BW attenuated
inflammatory responses associated with LPS (0.2 µg/kg BW). They hypothesized that the
observed inflammatory responses associated with acute administration of ergotamine is,
at least in part, due to an ergotamine-induced cortisol increase. However in a previous
study (1999), they reported that ergotamine (2 mg/kg BW) increased pro-inflammatory
cytokine IL-6 in mice at the end of 10 days of treatment. Similarly, Settivari et al. (2006)
observed various genes associated with pro-inflammatory response were up-regulated in
E+ rats at the end of five days of treatment at TN. Decreased expression of various pro-
inflammatory genes in the present study imply an adaptive mechanism in E+ rat immune
function to fescue toxicosis. Similarly, up-regulation of genes associated with immune
functions such as forkhead box p3, retinoid x receptor beta, immunoglobulin lambda
chain, variable 1, and selectin further suggest improved immune functions in E+ rats
during chronic periods.
Cell proliferation, apoptosis, and DNA repair
The long-term E+ diet intake at TN, in the present study, down-regulated various
genes coding for cell proliferation, such as cyclin-dependent kinase 4, histone 1 h2bc, and
gem associated protein 7. Also, genes associated with apoptosis (synovial apoptosis
226
inhibitor 1, programmed cell death protein 11, caspase recruitment domain family,
member 10, riken cDNA C330008I15, and semaphorin 6A) were up-regulated and DNA
repair mechanisms (excision repair cross-complementing rodent repair deficiency,
complementation group 2, general transcription factor II H, and polypeptide 4) were
down-regulated in E+ rats. Settivari et al. (2006) reported that rats fed a similar diet for 5
days at TN conditions exhibited similar gene expression pattern with down-regulation of
cell proliferation genes and up-regulation of apoptotic genes. These results might at least
in part contribute to reduced liver weights observed in E+ rats (Table 3. 3.).
Carbohydrate, lipid, and protein metabolism
Genes coding for carbohydrate metabolism (UDP-gal:betagal beta 1,3-
galactosyltransferase polypeptide 7, fructose 1,6 biphosphate, galactose-4-epimerase,
UDP), lipid metabolism (Acetyl-Coenzyme A acyltransferase 2, and hepatic lipase) and
protein metabolism (dimethylglycine dehydrogenase precursor, methyl-CpG binding
domain protein 3-like 1, and natriuretic peptide receptor 2) were down-regulated as a
result of E+ diet intake. In support to the present findings, Settivari et al. (2006) reported
down-regulation of genes coding for carbohydrate and lipid metabolism in rats fed an E+
diet for five days at TN conditions. They, however, observed up-regulation of various
genes coding for gluconeogenesis and protein catabolism in E+ rats. In the present study,
those genes were not differentially expressed in E+ rats. These results agree with
improved feed intake in E+ rats at the end of the study (Figure 3. 2a). In the present
study, genes coding for steroid biosynthesis (steroid receptor-interacting SNF2 domain
and ring finger protein 4) were up-regulated in E+ rats. These results are in contrast with
earlier reports (Settivari et al., 2006; Bhusari et al., 2006) which reported down-
227
regulation of various genes associated with steroidogenesis. However, the experimental
period for which animals were exposed to E+ diet was much shorter in the above
mentioned studies compared to the present study, and these results might suggest the
chronic results of fescue toxicosis in rats. This could be one main reason for the recovery
observed in serum cholesterol levels in E+ rats in the present study.
Electron transport functions
Genes for electron transport function, such as succinate dehydrogenase complex
subunit A flavoprotein, ATPase H+ transporting V1 subunit G isoform 1, NADH
dehydrogenase (ubiquinone) Fe-S protein 4, and rac GTPase-activating protein 1, were
up-regulated in E+ rats. In contrast to the present findings, rats fed the E+ diet for 5 days
exhibited down-regulation of various genes coding for electron transport function
(Settivari et al., 2006). Up-regulation of electron transport genes in the present study
might result in more efficient ATP synthesis. These results support the present
physiological finding of improved feed conversion efficiency in the E+ rats following
long-term treatment.
Other functions
Chaperonic genes (heat shock protein 70, peptidylprolyl isomerase F,
endoplasmic reticulum chaperone SIL1, and heat shock protein 68) were down-regulated
in E+ rats. However, these genes were expected to be up-regulated since the rats were
challenged with a toxicological condition. Down-regulation of chaperonic proteins would
result in accumulation of mis-folded proteins within the cell resulting in greater stress.
Settivari et al. (2006) observed similar down-regulation of chaperonic proteins in E+ rats
even at the end of short-term study (5 days), and the findings from the present study
228
indicate E+ rats did not exhibit adaptation for chaperones even during long-term fescue
toxicosis exposure.
Intake of fescue toxicants in the present study increased the gene expression of
serotonin receptor 5B. This could mainly be because of the agonistic interaction of fescue
toxicants with serotonin receptors, and may play a major role in peripheral
vasoconstriction and reduced appetite (Oliver, 2005).
The current study provided information regarding specific hepatic genes that are
differentially expressed in E+ rats during chronic treatment at thermoneutrality. It has
also helped to identify various pathways that are affected by long-term exposure to fescue
toxicosis, as well as the adaptive mechanisms that are activated in rat liver during chronic
treatment. Unlike short-term responses, E+ diet intake did not alter gene expression for
cytochrome P450 isoforms and gluconeogenesis. Furthermore, gene expression for
immune and electron transport functions of E+ rats was up-regulated compared to E- rats
during the present study, and these results are in contrast to short-term E+ diet intake,
suggesting adaptation to fescue toxicosis. In contrast, the gene expression for antioxidant,
xenobiotic and chaperonic activities of E+ fed rats was lower compared to E- rats during
both short- and long-term studies, contributing to the clinical signs associated with fescue
toxicosis at thermoneutrality that are time independent.
E-HS vs. E+HS
Immune system
Genes associated with immune system (hepcidin antimicrobial peptide,
myeloblastosis oncogene-like 1, complement component 3, and complement component
factor h-like 1) were down-regulated in E+HS compared to E-HS rats. Steers that grazed
229
on endophyte infected fescue pastures during summer months exhibited similar decrease
in immune functions (Saker et al., 1998; Allen et al., 2001). Similarly, rats fed an E+ diet
(43 day) had a lowered leukocyte count (Dew et al., 1990).
Carbohydrate, fat and protein metabolism
Intake of the E+ diet under HS conditions down-regulated genes associated with
carbohydrate metabolism (glucose 6 phosphate dehydrogenase and malate
dehydrogenase), lipid metabolism (acyl-coenzyme A oxidase 3), and protein metabolism
(methylenetetrahydrofolate dehydrogenase and serine (or cysteine) peptidase inhibitor
clade a member 3k). Furthermore, down-regulation of ATP synthase (ATP synthase, H+
transporting, mitochondrial F0 complex, subunit b, isoform 1) gene in E+HS compared
to E-HS rats in the present study could impair the ability for efficient energy utilization.
Down-regulation of these genes in the present study supports the physiological findings
(i.e., significant decrease in serum glucose (Table 3. 4) and growth rate (Table 3.1) of E+
rats in the present study. In agreement with current findings, Spiers et al. (2005a) noted a
decreased growth rate in E+ rats under similar heat stress conditions.
Results from the present comparison identify various genes that are affected as a
result of E+ diet intake under HS conditions. The E+HS rats in the present study
exhibited down-regulation of genes coding for immune system, as well as carbohydrate,
lipid, and protein metabolisms even at the end of chronic exposure. Physiological
parameters of E+HS (i.e., significant decrease in FI, BW and growth rate) compared to E-
HS rats in the present study support the genomic findings in concluding that E+ rats did
230
not completely adapt to fescue toxicosis under HS conditions, even after 21 days of
exposure.
E-TN vs. E-HS
Cell proliferation
Exposure to chronic HS down-regulated various genes associated with cell cycle
(cyclin l1, Sry-box containing gene 5, zinc fingers and homeoboxes protein 2, eukaryotic
translation initiation factor 4e, and tata box binding protein) in E-HS compared to E-TN
rats. Earlier reports suggest that heat stress affects various cell cycle processes depending
on the cell type, the phase of cell proliferation, and the severity of the stress (Rice et al.,
1986; Kuhl et al., 2000). They observed cell cycle arrest at G1 or G2/M stages in rat
glioma cells when exposed to 42˚C for 2 to 48 hours. Similarly, Rowley et al. (1993)
noted that heat stress blocked cell cycle and cyclin G1 expression in Saccharomyces
cervisiae. The above mentioned references suggests that short-term HS decrease cell
proliferation and the observed reductions in the current study, suggests that E+ rats did
not adapt to HS even under long-term exposures. Reduced cell proliferation could
contribute to the observed reduction in liver weights in E-HS compared to E-TN rats in
the present study. This reduction in liver weight occurred in spite of complete recovery in
FI and FCE in E-HS rats.
Detoxification function
Cytochrome P450 2B10 gene, which plays a major role in Phase I detoxification
was up-regulated as a result of HS exposure in the present study. Cytochrome P450 2B10
gene plays a major role in detoxification and bilirubin metabolism (Wagner et al., 2005).
231
Up-regulation of this gene would enhance detoxification capacity in E-HS rats. However,
genes associated with Phase II detoxification (glutathione S transferase 3,
sulfotransferase family 4a, member 1) and antiporter system (ATP-binding cassette sub-
family b) was down-regulated in E-HS vs. E-TN rats. Earlier reports suggest decreased
antioxidant status in heat stressed (40ºC; four hours per day for 10 days) birds (Ramnath
et al., 2007). Glutathione is found in almost all living cells and is considered to be a
major antioxidant of the body (Ramnath et al., 2007). Glutathione in the body is chiefly
associated with reducing oxidized vitamin C and E back to their reduced state,
detoxifying many xenobiotics, maintaining cellular redox potential, and maintaining
erythrocyte membrane integrity (Sen, 1997). Earlier reports suggest that even short-term
exposure to various oxidative stressors such as ultraviolet light, viral infection, heat
stress, heavy metals, surgery, inflammation, burns, and septic shock result in reduced
body glutathione levels (Kosower and Kosower, 1978; Kidd, 1997; Sen, 1997).
Electron transport and ATP synthesis
Long-term heat stress down-regulated a number of genes associated with electron
transport and ATP synthesis (NADH-ubiquinone oxidoreductase chain 3, NADH-
ubiquinone oxidoreductase chain 4, NADH-ubiquinone oxidoreductase chain 6, NADH
dehydrogenase subunit 1, NADH dehydrogenase subunit 2 kinase 2, NADH
dehydrogenase subunit 5, NADH dehydrogenase subunit 4l, cytochrome c oxidase
subunit i, ATPase subunit 8, cytochrome b, cytochrome c oxidase polypeptide 2, ATP
synthase f0 subunit 6, and cytochrome oxidase subunit 3) in rats. Down-regulation of
these genes in E-HS rats might impair their ability to utilize feed for energy. Decreased
growth rates in E-HS rats in the present study, compared to E-TN rats, could be at least in
232
part due to the down-regulation of the above mentioned electron-transport genes.
However, this could also explain the known reduction in metabolism as often seen in heat
adapted mammals to reduce excess heat load. Earlier studies suggested that heat stress
(37 - 40ºC) exposure is known to decrease oxidative phosphorylation efficiency, and ATP
production in rats (Qian et al., 2004).
Immune function
The E-HS rats in the present comparison exhibited down-regulated genes coding
for immune function (cd3 antigen, zeta polypeptide, toll-like receptor 12, T-cell receptor
beta, variable 13, Riken cDNA a230106m20 gene, and immunoglobulin C2 type)
compared to E-TN rats. Franci et al. (1996) compared the immune status of rabbits
maintained at 33.5˚C or 18.0˚C for 24 days. They observed that HS decreased peripheral
blood mononuclear cell proliferation and inhibited B lymphocyte differentiation. It is
well known that HS, or any other major stress, stimulates adrenocortical secretion
resulting in increased concentrations of serum glucocorticoids, which inhibit immune cell
function (Piccolella et al., 1985; Khansari et al., 1990). Although the levels of
corticosteroids were not measured in the present study, their role in immune suppression
cannot be ignored. Similarly, Elvinger et al. (1992) observed a reduction in leukocyte
migration to the mammary gland after chemotactic challenge in heat stressed cows during
summer months.
Findings from the present comparison identified that chronic HS down-regulated
genes associated with cell proliferation, detoxification, ATP synthesis, and immune
function that might make these animals susceptible to oxidative stress and other stressors,
while reducing energy utilization efficiency.
233
E+TN vs. E+HS
Combination of E+ diet and HS in the present study resulted in down-regulation
of genes coding for cell proliferation (Cyclin D1, Riken cDNA 1700007i06 gene, rd rna-
binding protein), oxidoreductase activity (lysyl oxidase-like 3), and fatty acid metabolism
(acyl-coenzyme a oxidase 3, and pristanoyl). However, the E+HS rats exhibited up-
regulation of genes coding for immune system (Ring finger protein 125), cytochrome
P450 (CYP2B10) and chaperone (Zinc finger, cchc domain containing 3) systems
compared to E+TN rats. It can be speculated from the above results that E+ diet intake at
HS improved immune, chaperone, and detoxification systems than at TN. However, it is
to be noted that all the pathways in the present comparison contain very few genes and
therefore the information from this comparison cannot be used to draw conclusions
regarding the affected pathways.
E-TN vs. E+HS
The present comparison would test the effects of E+ diet under HS conditions to
unstressed rats maintained under TN conditions. One would hypothesize that this
comparison would represent the two extreme conditions.
Immune functions
Intake of the E+ diet intake under HS conditions down-regulated various genes
associated with immune function (immunoglobulin lambda chain, variable 1,
haptoglobin, prostaglandin e synthase, regenerating islet-derived family, member 4, and
catenin delta 1). Furthermore, intake of the E+ diet up-regulated various pro-
234
inflammatory genes (cd14 antigen, interleukin 2 receptor beta chain) in E+HS rats
compared to E-TNrats. It is interesting to note that immune function was up-regulated in
E+ compared to E- rats under TN conditions (see E-TN vs. E+TN), but was down-
regulated under HS conditions (see E-HS vs. E+HS). Taken together, these results
suggest that HS contributed to the suppressed immune response and increased
inflammation in E+HS rats. Altered immune responses and inflammatory changes are
commonly observed in fescue toxicosis (Filipov et al., 1999). Rodents fed E+ toxins
exhibited a lowered red and white blood cell counts, reduced response to mitogens, and
increased T suppressor cell numbers in the spleen compared to E- rats (Dew et al., 1999).
Oliver (2005) reported that many of the clinical signs associated with fescue toxicosis,
such as hyperalgesia, lameness, and coagulation defects (due to blood stasis in peripheral
vessels) are due to a decrease in immune activity and an increase in inflammation
functions. Results of the present experiment support Oliver’s (2005) reports at the gene
level.
Antioxidant and detoxification systems
Various genes associated with antioxidant system, such as stearoyl-coenzyme a
desaturase 1, microsomal glutathione s-transferase 3, catalytic subunit of glutamate-
cysteine ligase, protein-tyrosine sulfotransferase 2, selenoprotein p1, haptoglobin,
peroxiredoxin 6, sulfide quinine reductase, and amiloride binding protein 1, were down-
regulated in E+HS rats compared to E-TN rats. Down-regulation of these genes would
impair the animal’s ability to neutralize free radicals produced as a result of heat stress
and E+ toxicants resulting in oxidative stress. Similarly, various genes associated with
detoxification functions (glutaminase 2, glutathione s-transferase mu 3, glutathione s-
235
transferase kappa 1, glutathione s-transferase, theta 2, alanine-glyoxylate
aminotransferase polypeptide 1, and cytochrome p450 2g1) were down-regulated in
E+HS compared to E-TN rats. However, various isoforms of UDP-glucuronosyl
transferase, (UDP-glucuronosyltransferase 1a9, UDP- glycosyltransferase 1 a10, UDP-
glucuronosyltransferase 1a6a, UDP glucuronosyltransferase 1a12, and UDP
glucuronosyltransferase 1a5) were up-regulated in E+HS compared to E-TN rats. Up-
regulation of UDP detoxification system along with cytochrome P450 2d6 and
sulfotransferase 4a1 genes in E+HS compared to E-TN rats could be an adaptive
mechanism under long-term exposures to alleviate clinical signs associated with fescue
toxicosis. Settivari et al. (2006) observed decreased antioxidant gene expression in E+
rats even at TN. Lakritz et al. (2002) observed decreased blood levels of glutathione in
E+ cattle under HS conditions. Similarly, Oliver (1997) noted decreased mean plasma
antioxidant capacity in E+ steers that was seven times below that of E- animals. In
contrast, up-regulation of UDP glucuronosyl transferase enzymes in the present study
could be an adaptation mechanism in E+ rats to fescue toxicosis under HS conditions.
Apoptosis and cell proliferation
Genes associated with cell proliferation (cyclin D1, cyclin A2, basic leucine
zipper and w2 domains 2, tumor protein p53 inducible nuclear protein 2, tax1 binding
protein 1, cyclin-dependent kinase 4, and netrin g1) were down-regulated in E+HS
compared to E-TN rats. Various genes coding for programmed cell death such as
ubiquitin c, perp tp53 apoptosis effector, and cd164 antigen were down-regulated in
E+HS vs. E-TN rats. Similarly, genes coding for negative regulation of apoptosis
(neuronal apoptosis inhibitory protein related sequence 4, synovial apoptosis inhibitor 1),
236
chaperone activity (interleukin 2 receptor beta chain), and DNA repair and cell survival
(menage a trois 1, rev3-like, catalytic subunit of DNA polymerase zeta rad54 like,
general transcription factor ii h polypeptide 4, nucleoside diphosphate linked moiety x-
type motif 12) were up-regulated in E+HS compared to E-TN rats. The E+ diet intake
under TN conditions reduced cell proliferation and increased apoptosis, and therefore the
effect on cell proliferation and apoptosis during HS was expected to be greater than at
TN. However in the present comparison, decreased apoptotic rates were observed in
E+HS rats possibly due to up-regulation of DNA repair mechanisms and chaperone
activity during the present chronic exposures.
Carbohydrate, lipid and protein metabolism
The E+HS rats in the present study exhibited down-regulation of several genes
associated with carbohydrate metabolism (transmembrane protein 123, 6-phosphofructo-
2-kinase/fructose-2,6-biphosphatase 2, solute carrier family 37 member 4, and afamin
precursor), ATP synthesis (ATP synthase and NADH dehydrogenase subunit 2kinase 2)
and growth (insulin-like growth factor binding protein 4 and latent transforming growth
factor beta binding protein 1) compared to E-TN rats. Similarly, genes coding for lipid
metabolism (thyroid hormone responsive spot14 homolog, fatty acid binding protein 1,
fatty acid synthase, acetyl-coenzyme a acyltransferase 2, acyl-coenzyme a oxidase 3,
pristanoylprotein 1, fatty acid desaturase 1, prostaglandin e synthase, lipase, oxysterol
binding protein-like 11, carnitine palmitoyltransferase 1a, sulfotransferase family 4a,
member 1) and cholesterol biosynthesis (sterol regulatory element binding factor 1,
cytochrome p450, family 51) were down-regulated in E+HS compared to E-TN rats.
Similarly, various genes coding for protein metabolism (serine/cysteine peptidase
237
inhibitor A3k, bacterial acetolactate synthase-like, alanyl-trna synthetase, cathepsin g,
fumarylacetoacetate hydrolase, tolloid-like 2, casein kinase ii, beta subunit, zinc finger,
dhhc domain containing 3, axin 1, sry-box containing gene 5, eukaryotic translation
elongation factor 2, and heterogeneous nuclear ribonucleoprotein d) were down-regulated
in E+HS compared to E-TN rats. Reduced growth and production efficiencies,
characteristic of fescue toxicosis could be at least in part due to the decreased expression
of carbohydrate, lipid and protein metabolism, as well as ATP synthesizing genes in
E+HS rats. Down-regulation of genes associated with cholesterol biosynthesis is in
agreement with reduced serum cholesterol levels in E+HS compared to E-TN rats in the
present study.
Taken together, these results suggest that E+ rats under HS conditions, exhibited
signs of adaptation to apoptosis and detoxification. However, immune and antioxidant
systems were still down-regulated in this group, making the animals susceptible to
oxidative stress and other stressors. Similarly, depressed carbohydrate, lipid and protein
metabolisms make the rats inefficient to utilize their feed energy contributing to reduced
production efficiency.
6. CONCLUSIONS
The present study identified genomic pathways that are affected due to heat stress
and/or fescue toxicosis and possible adaptation mechanisms to these stressors in rat
hepatic tissue. Chronic HS in the present study down-regulated various genes coding for
cell proliferation, detoxification, immune function, electron transport and ATP synthesis.
238
The E+ diet intake during the present chronic study, down-regulated genes associated
with antioxidants, cell proliferation, carbohydrate, lipid, and protein metabolisms under
both TN and HS conditions. Under TN conditions, E+ diet intake down-regulated genes
associated with detoxification, DNA repair mechanism, and chaperones however under
HS conditions, these pathways were up-regulated. Possible role of decreased caloric
intake in the present findings could not be separated and therefore future studies are
recommended using pair-fed groups.
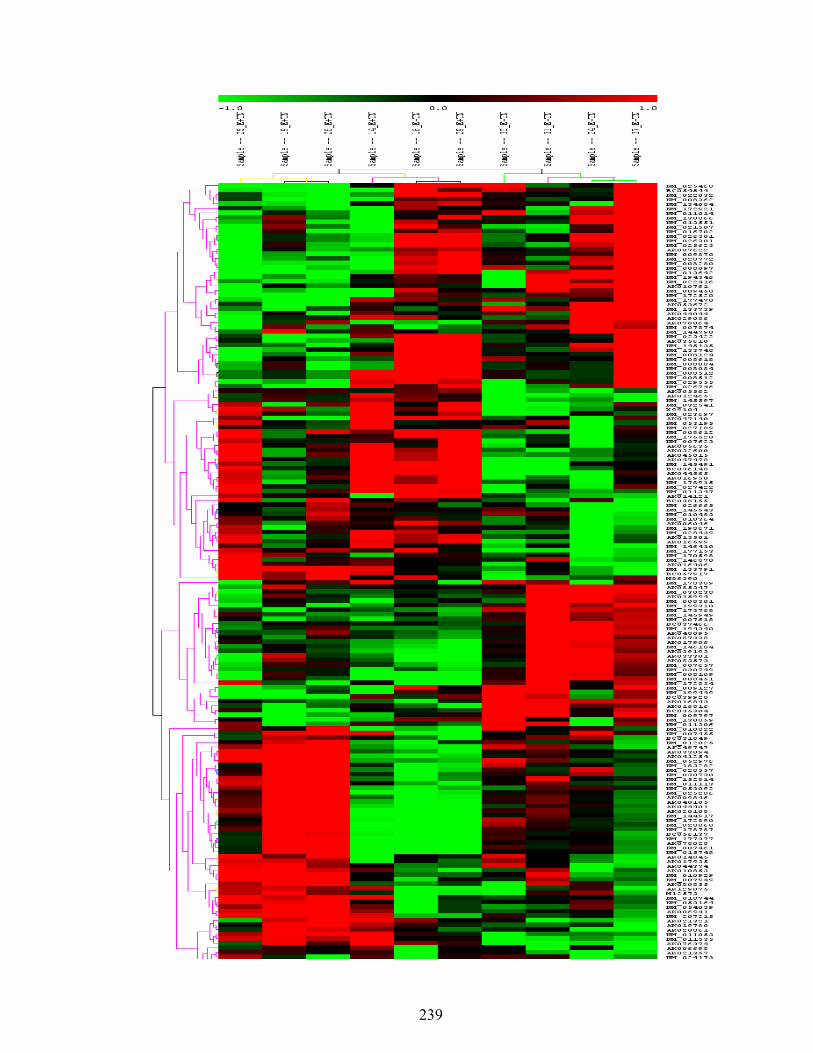
239
240
Figure 7. 1. Differentially expressed genes between E-TN and E+TN rats (FDR ≤ 15% and fold change greater than 1.4%) clustered using TIGR multi-experiment viewer. Boot strap analysis was done with 1000 iterations to assess the significance of hierarchical tree. The clustering pattern divided the rats into two groups with 100% support based on their treatment (top cluster). Of the differentially expressed genes, 106 were up-regulated while 70 were down-regulated by chronic heat stress. Green blocks represent the down-regulated genes and the red blocks represent up-regulated genes and the black boxes represent genes whose expression did not change due to chronic heat stress exposure. Symbol E- indicate rats fed non endophyte infected fescue diet and E+ indicate rats fed an endophyte infected fescue diet under thermoneutral (TN) conditions.
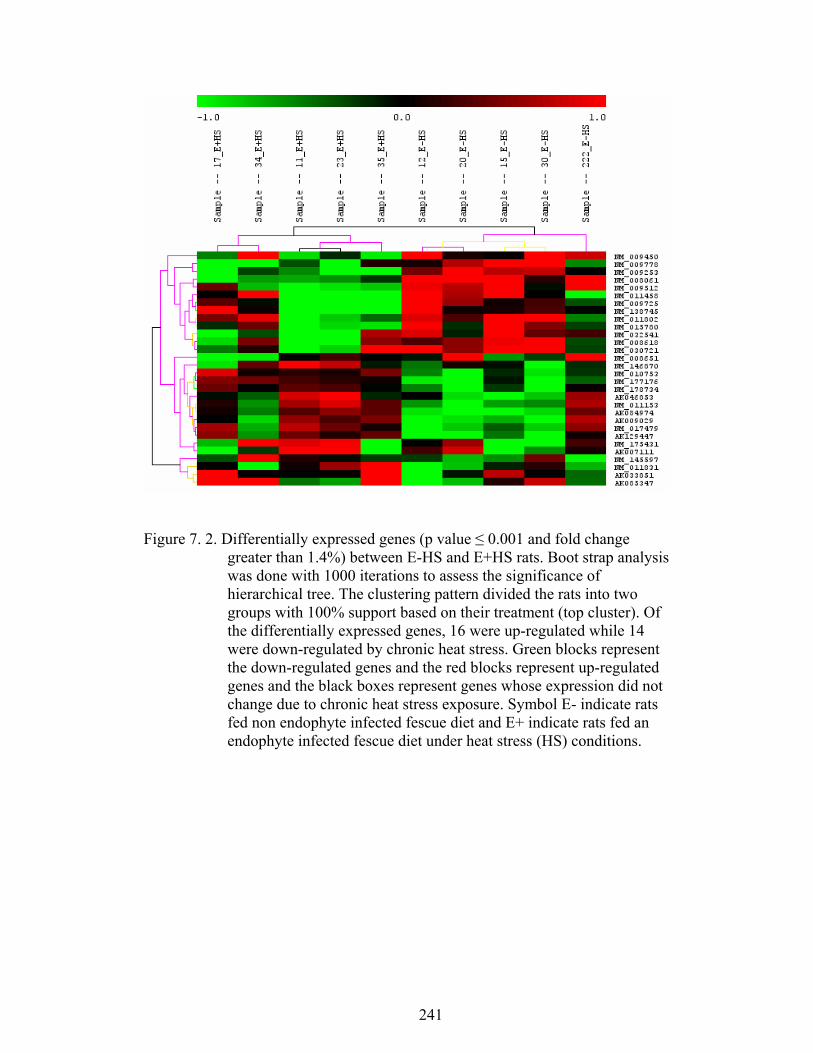
241
Figure 7. 2. Differentially expressed genes (p value ≤ 0.001 and fold change
greater than 1.4%) between E-HS and E+HS rats. Boot strap analysis was done with 1000 iterations to assess the significance of hierarchical tree. The clustering pattern divided the rats into two groups with 100% support based on their treatment (top cluster). Of the differentially expressed genes, 16 were up-regulated while 14 were down-regulated by chronic heat stress. Green blocks represent the down-regulated genes and the red blocks represent up-regulated genes and the black boxes represent genes whose expression did not change due to chronic heat stress exposure. Symbol E- indicate rats fed non endophyte infected fescue diet and E+ indicate rats fed an endophyte infected fescue diet under heat stress (HS) conditions.
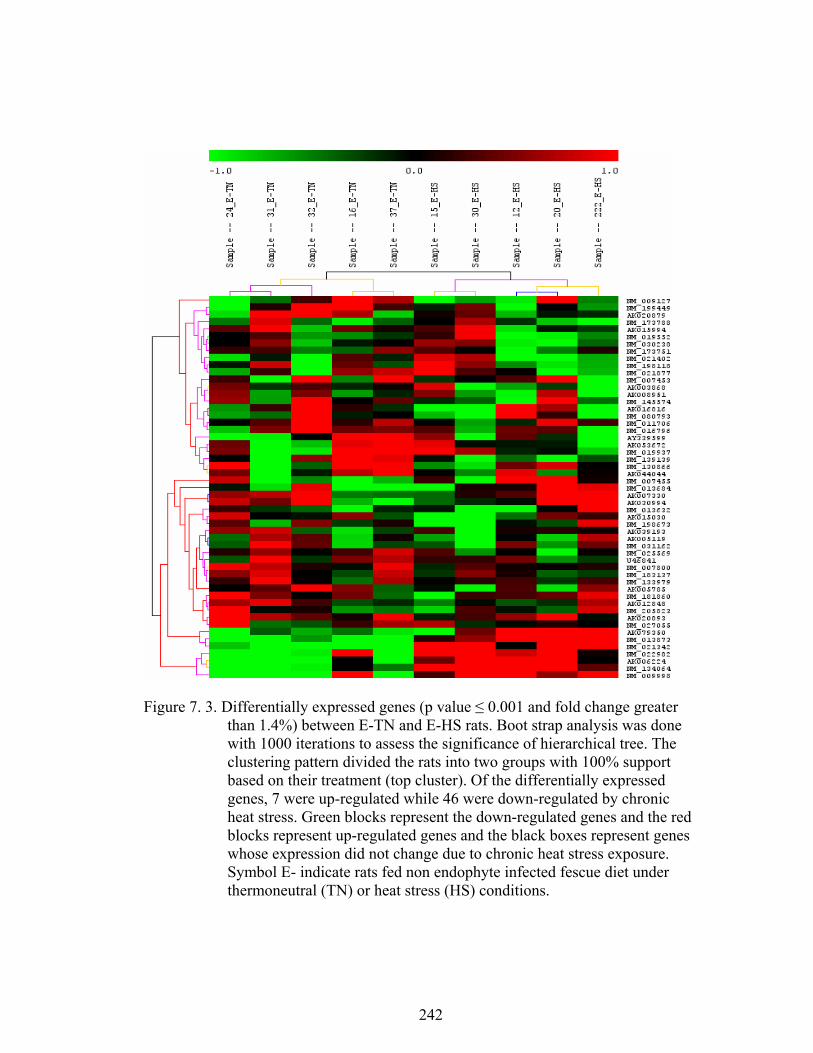
242
Figure 7. 3. Differentially expressed genes (p value ≤ 0.001 and fold change greater
than 1.4%) between E-TN and E-HS rats. Boot strap analysis was done with 1000 iterations to assess the significance of hierarchical tree. The clustering pattern divided the rats into two groups with 100% support based on their treatment (top cluster). Of the differentially expressed genes, 7 were up-regulated while 46 were down-regulated by chronic heat stress. Green blocks represent the down-regulated genes and the red blocks represent up-regulated genes and the black boxes represent genes whose expression did not change due to chronic heat stress exposure. Symbol E- indicate rats fed non endophyte infected fescue diet under thermoneutral (TN) or heat stress (HS) conditions.
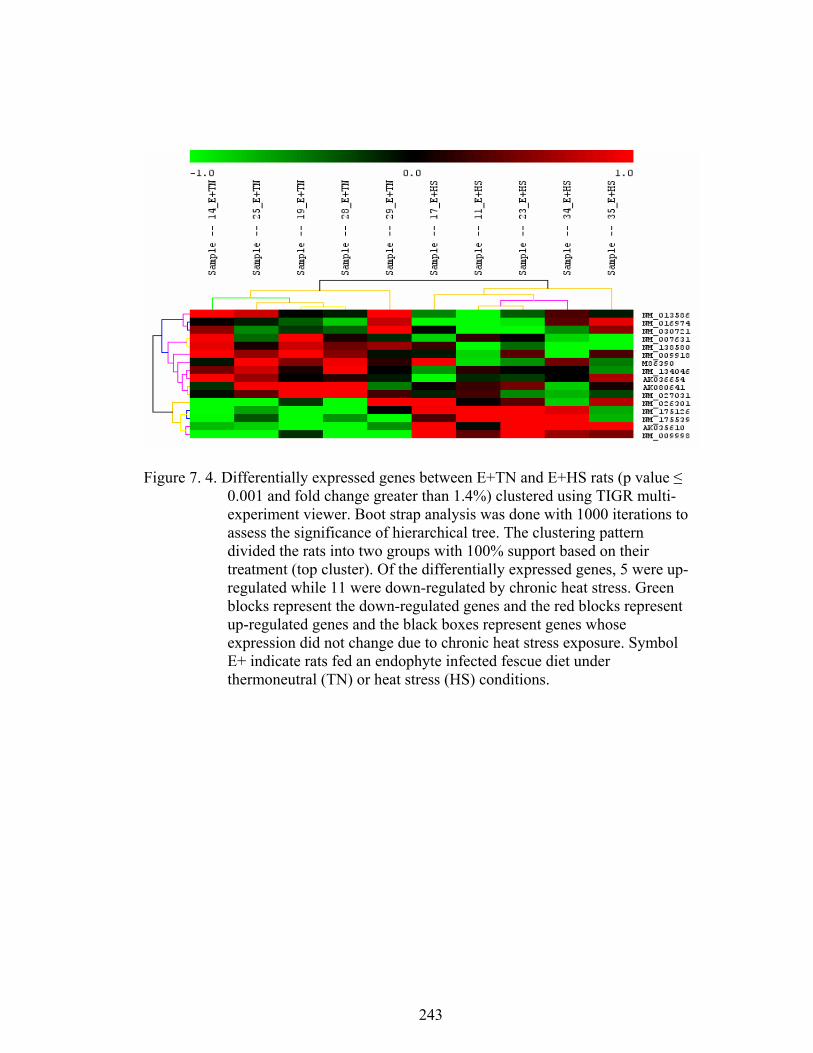
243
Figure 7. 4. Differentially expressed genes between E+TN and E+HS rats (p value ≤
0.001 and fold change greater than 1.4%) clustered using TIGR multi-experiment viewer. Boot strap analysis was done with 1000 iterations to assess the significance of hierarchical tree. The clustering pattern divided the rats into two groups with 100% support based on their treatment (top cluster). Of the differentially expressed genes, 5 were up-regulated while 11 were down-regulated by chronic heat stress. Green blocks represent the down-regulated genes and the red blocks represent up-regulated genes and the black boxes represent genes whose expression did not change due to chronic heat stress exposure. Symbol E+ indicate rats fed an endophyte infected fescue diet under thermoneutral (TN) or heat stress (HS) conditions.
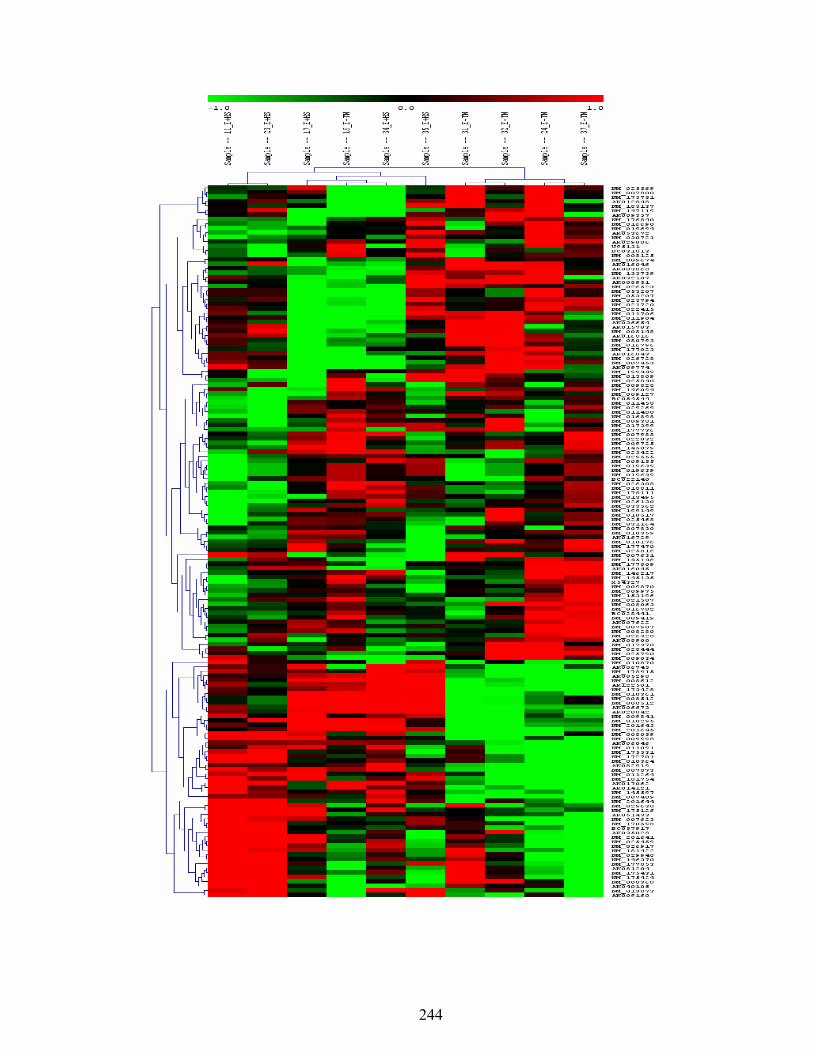
244
245
Figure 7. 5. Differentially expressed genes (FDR < 15% and fold change greater than 1.4%) between E-TN and E+HS rats clustered using TIGR multi-experiment viewer. Boot strap analysis was done with 1000 iterations to assess the significance of hierarchical tree. The clustering pattern divided the rats into two groups with 100% support based on their treatment (top cluster). Of the differentially expressed genes, 53 were up-regulated while 107 were down-regulated by chronic heat stress. Green blocks represent the down-regulated genes and the red blocks represent up-regulated genes and the black boxes represent genes whose expression did not change due to chronic heat stress exposure. Symbol E- indicate rats fed non endophyte infected fescue diet and E+ indicate rats fed an endophyte infected fescue diet under thermoneutral (TN) or heat stress (HS) conditions.
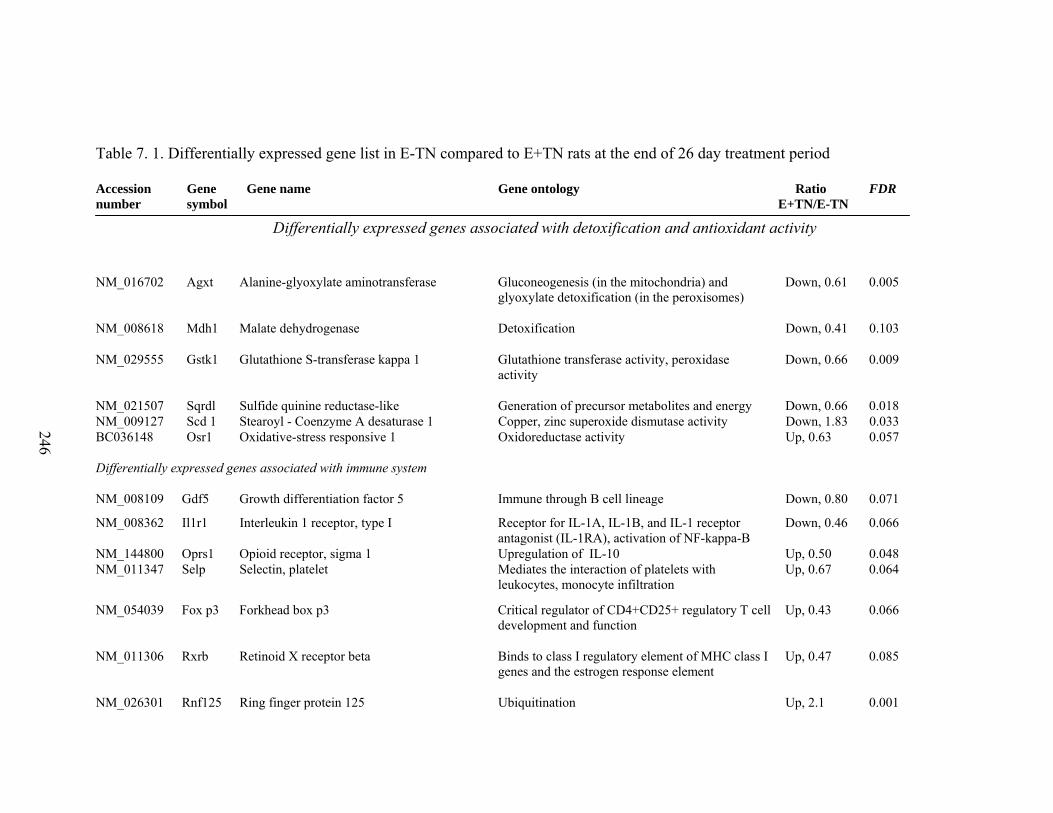
246
Table 7. 1. Differentially expressed gene list in E-TN compared to E+TN rats at the end of 26 day treatment period Accession number
Gene symbol
Gene name Gene ontology Ratio E+TN/E-TN
FDR
NM_016702 Agxt Alanine-glyoxylate aminotransferase Gluconeogenesis (in the mitochondria) and
glyoxylate detoxification (in the peroxisomes)
Down, 0.61 0.005
NM_008618 Mdh1 Malate dehydrogenase Detoxification Down, 0.41 0.103 NM_029555 Gstk1 Glutathione S-transferase kappa 1 Glutathione transferase activity, peroxidase
activity
Down, 0.66 0.009
NM_021507 Sqrdl Sulfide quinine reductase-like Generation of precursor metabolites and energy Down, 0.66 0.018 NM_009127 Scd 1 Stearoyl - Coenzyme A desaturase 1 Copper, zinc superoxide dismutase activity Down, 1.83 0.033 BC036148 Osr1 Oxidative-stress responsive 1 Oxidoreductase activity Up, 0.63 0.057 Differentially expressed genes associated with immune system NM_008109 Gdf5 Growth differentiation factor 5 Immune through B cell lineage Down, 0.80 0.071
NM_008362 Il1r1 Interleukin 1 receptor, type I Receptor for IL-1A, IL-1B, and IL-1 receptor antagonist (IL-1RA), activation of NF-kappa-B
Down, 0.46 0.066
NM_144800 Oprs1 Opioid receptor, sigma 1 Upregulation of IL-10 Up, 0.50 0.048 NM_011347 Selp Selectin, platelet Mediates the interaction of platelets with
leukocytes, monocyte infiltration Up, 0.67 0.064
NM_054039 Fox p3 Forkhead box p3 Critical regulator of CD4+CD25+ regulatory T cell development and function
Up, 0.43 0.066
NM_011306 Rxrb Retinoid X receptor beta Binds to class I regulatory element of MHC class I genes and the estrogen response element
Up, 0.47 0.085
NM_026301 Rnf125 Ring finger protein 125 Ubiquitination Up, 2.1 0.001
Differentially expressed genes associated with detoxification and antioxidant activity
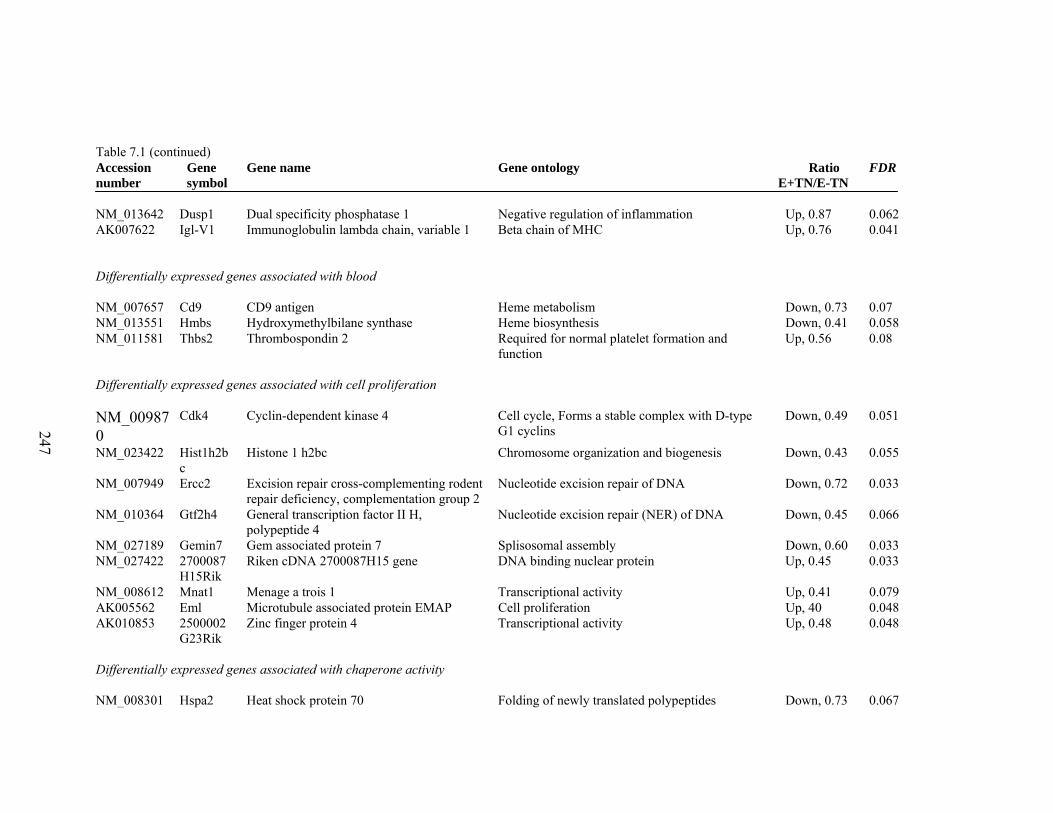
247
Table 7.1 (continued) Accession number
Gene symbol
Gene name Gene ontology Ratio E+TN/E-TN
FDR
NM_013642 Dusp1 Dual specificity phosphatase 1 Negative regulation of inflammation Up, 0.87 0.062 AK007622 Igl-V1 Immunoglobulin lambda chain, variable 1 Beta chain of MHC Up, 0.76 0.041 Differentially expressed genes associated with blood NM_007657 Cd9 CD9 antigen Heme metabolism Down, 0.73 0.07 NM_013551 Hmbs Hydroxymethylbilane synthase Heme biosynthesis Down, 0.41 0.058 NM_011581 Thbs2 Thrombospondin 2 Required for normal platelet formation and
function Up, 0.56 0.08
Differentially expressed genes associated with cell proliferation NM_009870
Cdk4 Cyclin-dependent kinase 4 Cell cycle, Forms a stable complex with D-type G1 cyclins
Down, 0.49 0.051
NM_023422 Hist1h2bc
Histone 1 h2bc Chromosome organization and biogenesis Down, 0.43 0.055
NM_007949 Ercc2 Excision repair cross-complementing rodent repair deficiency, complementation group 2
Nucleotide excision repair of DNA
Down, 0.72 0.033
NM_010364 Gtf2h4 General transcription factor II H, polypeptide 4
Nucleotide excision repair (NER) of DNA Down, 0.45 0.066
NM_027189 Gemin7 Gem associated protein 7 Splisosomal assembly Down, 0.60 0.033 NM_027422 2700087
H15Rik Riken cDNA 2700087H15 gene DNA binding nuclear protein
Up, 0.45 0.033
NM_008612 Mnat1 Menage a trois 1 Transcriptional activity Up, 0.41 0.079 AK005562 Eml Microtubule associated protein EMAP Cell proliferation Up, 40 0.048 AK010853 2500002
G23Rik Zinc finger protein 4 Transcriptional activity Up, 0.48 0.048
Differentially expressed genes associated with chaperone activity NM_008301 Hspa2 Heat shock protein 70 Folding of newly translated polypeptides Down, 0.73 0.067
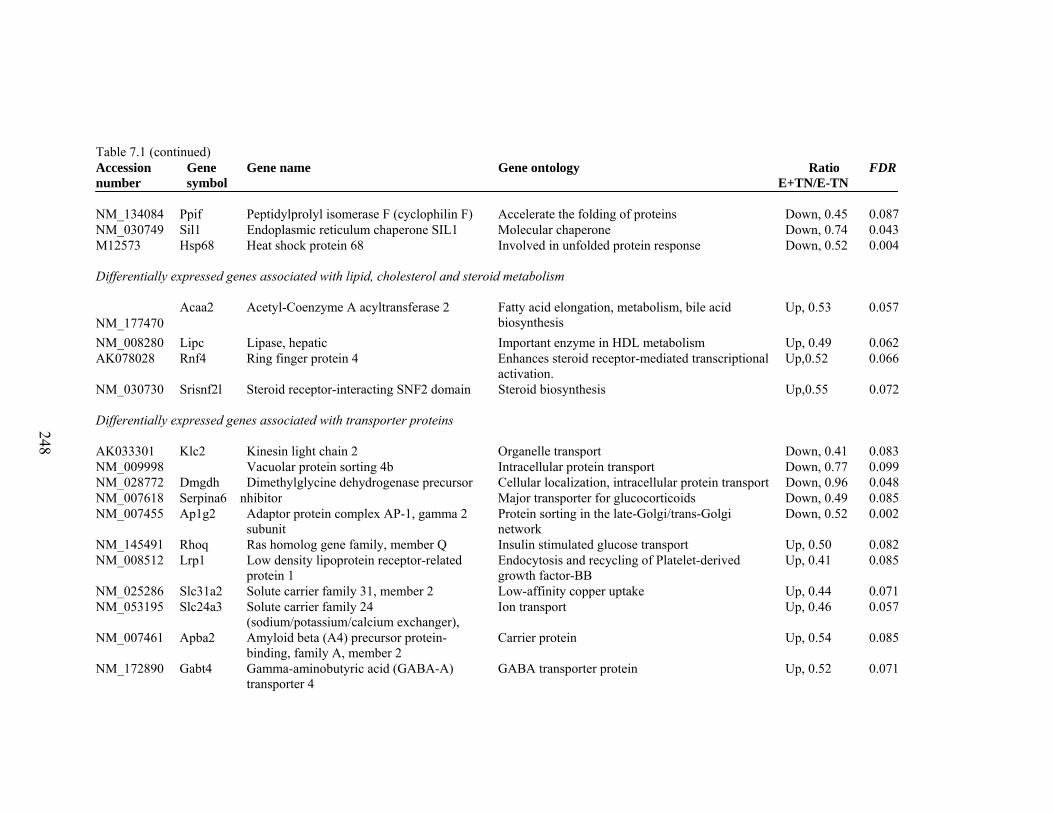
248
Table 7.1 (continued) Accession number
Gene symbol
Gene name Gene ontology Ratio E+TN/E-TN
FDR
NM_134084 Ppif Peptidylprolyl isomerase F (cyclophilin F) Accelerate the folding of proteins Down, 0.45 0.087 NM_030749 Sil1 Endoplasmic reticulum chaperone SIL1 Molecular chaperone Down, 0.74 0.043 M12573 Hsp68 Heat shock protein 68 Involved in unfolded protein response Down, 0.52 0.004 Differentially expressed genes associated with lipid, cholesterol and steroid metabolism
NM_177470 Acaa2 Acetyl-Coenzyme A acyltransferase 2 Fatty acid elongation, metabolism, bile acid
biosynthesis Up, 0.53 0.057
NM_008280 Lipc Lipase, hepatic Important enzyme in HDL metabolism Up, 0.49 0.062 AK078028 Rnf4 Ring finger protein 4 Enhances steroid receptor-mediated transcriptional
activation. Up,0.52 0.066
NM_030730 Srisnf2l Steroid receptor-interacting SNF2 domain Steroid biosynthesis Up,0.55 0.072 Differentially expressed genes associated with transporter proteins AK033301 Klc2 Kinesin light chain 2 Organelle transport Down, 0.41 0.083 NM_009998 Vacuolar protein sorting 4b Intracellular protein transport Down, 0.77 0.099 NM_028772 Dmgdh Dimethylglycine dehydrogenase precursor Cellular localization, intracellular protein transport Down, 0.96 0.048 NM_007618 Serpina6 inhibitor Major transporter for glucocorticoids Down, 0.49 0.085 NM_007455 Ap1g2 Adaptor protein complex AP-1, gamma 2
subunit Protein sorting in the late-Golgi/trans-Golgi network
Down, 0.52 0.002
NM_145491 Rhoq Ras homolog gene family, member Q Insulin stimulated glucose transport Up, 0.50 0.082 NM_008512 Lrp1 Low density lipoprotein receptor-related
protein 1 Endocytosis and recycling of Platelet-derived growth factor-BB
Up, 0.41 0.085
NM_025286 Slc31a2 Solute carrier family 31, member 2 Low-affinity copper uptake Up, 0.44 0.071 NM_053195 Slc24a3 Solute carrier family 24
(sodium/potassium/calcium exchanger), Ion transport Up, 0.46 0.057
NM_007461 Apba2 Amyloid beta (A4) precursor protein-binding, family A, member 2
Carrier protein Up, 0.54 0.085
NM_172890 Gabt4 Gamma-aminobutyric acid (GABA-A) transporter 4
GABA transporter protein Up, 0.52 0.071
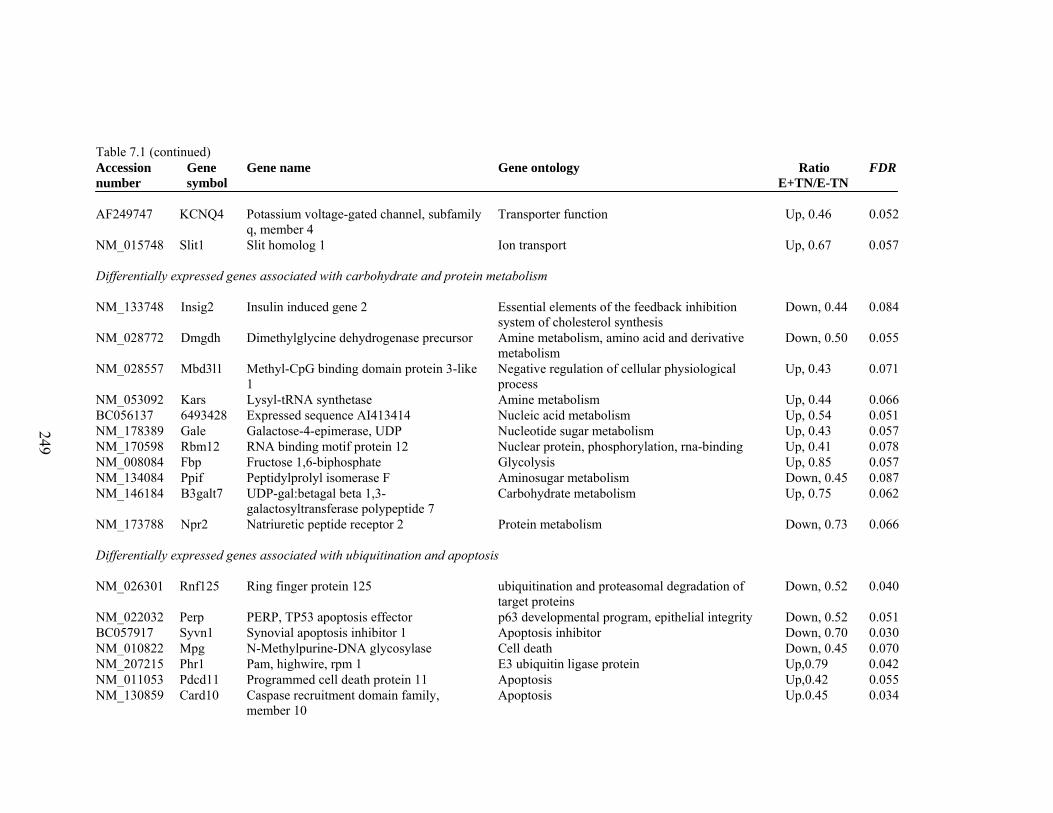
249
Table 7.1 (continued) Accession number
Gene symbol
Gene name Gene ontology Ratio E+TN/E-TN
FDR
AF249747 KCNQ4 Potassium voltage-gated channel, subfamily
q, member 4 Transporter function Up, 0.46 0.052
NM_015748 Slit1 Slit homolog 1 Ion transport Up, 0.67 0.057 Differentially expressed genes associated with carbohydrate and protein metabolism NM_133748 Insig2 Insulin induced gene 2 Essential elements of the feedback inhibition
system of cholesterol synthesis Down, 0.44 0.084
NM_028772 Dmgdh Dimethylglycine dehydrogenase precursor Amine metabolism, amino acid and derivative metabolism
Down, 0.50 0.055
NM_028557 Mbd3l1 Methyl-CpG binding domain protein 3-like 1
Negative regulation of cellular physiological process
Up, 0.43 0.071
NM_053092 Kars Lysyl-tRNA synthetase Amine metabolism Up, 0.44 0.066 BC056137 6493428 Expressed sequence AI413414 Nucleic acid metabolism Up, 0.54 0.051 NM_178389 Gale Galactose-4-epimerase, UDP Nucleotide sugar metabolism Up, 0.43 0.057 NM_170598 Rbm12 RNA binding motif protein 12 Nuclear protein, phosphorylation, rna-binding Up, 0.41 0.078 NM_008084 Fbp Fructose 1,6-biphosphate Glycolysis Up, 0.85 0.057 NM_134084 Ppif Peptidylprolyl isomerase F Aminosugar metabolism Down, 0.45 0.087 NM_146184 B3galt7 UDP-gal:betagal beta 1,3-
galactosyltransferase polypeptide 7 Carbohydrate metabolism Up, 0.75 0.062
NM_173788 Npr2 Natriuretic peptide receptor 2 Protein metabolism Down, 0.73 0.066 Differentially expressed genes associated with ubiquitination and apoptosis NM_026301 Rnf125 Ring finger protein 125 ubiquitination and proteasomal degradation of
target proteins Down, 0.52 0.040
NM_022032 Perp PERP, TP53 apoptosis effector p63 developmental program, epithelial integrity Down, 0.52 0.051 BC057917 Syvn1 Synovial apoptosis inhibitor 1 Apoptosis inhibitor Down, 0.70 0.030 NM_010822 Mpg N-Methylpurine-DNA glycosylase Cell death Down, 0.45 0.070 NM_207215 Phr1 Pam, highwire, rpm 1 E3 ubiquitin ligase protein Up,0.79 0.042 NM_011053 Pdcd11 Programmed cell death protein 11 Apoptosis Up,0.42 0.055 NM_130859 Card10 Caspase recruitment domain family,
member 10 Apoptosis Up.0.45 0.034
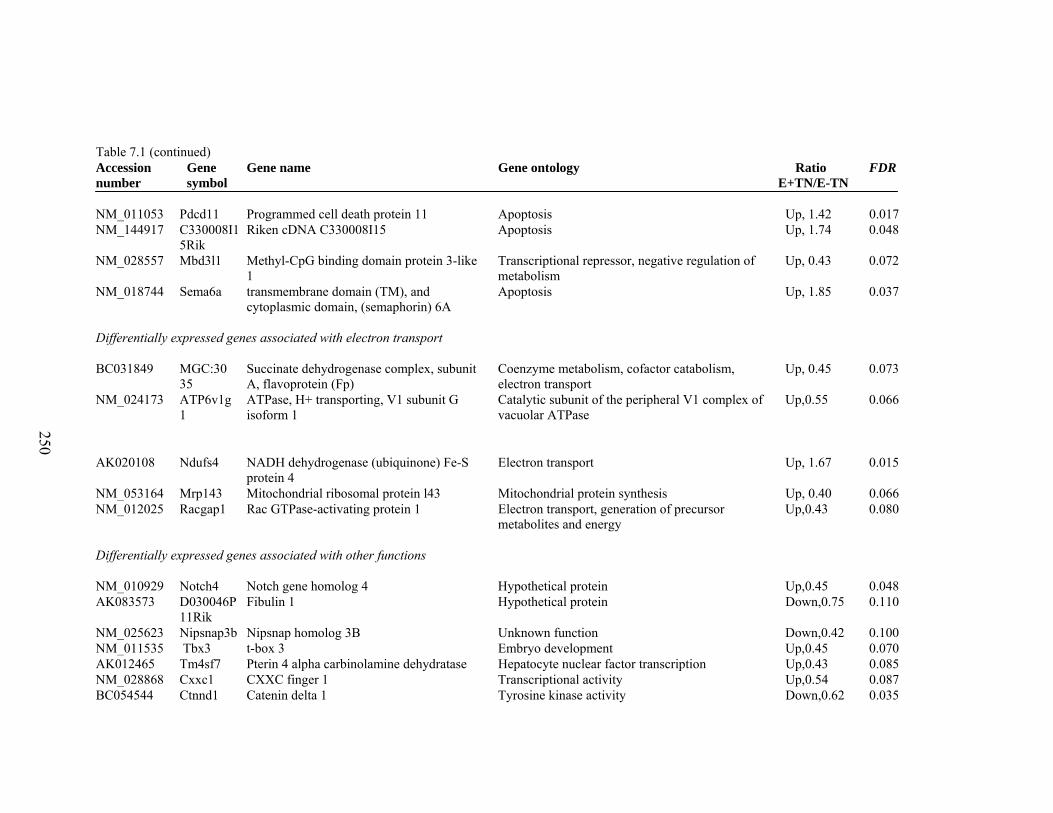
250
Table 7.1 (continued) Accession number
Gene symbol
Gene name Gene ontology Ratio E+TN/E-TN
FDR
NM_011053 Pdcd11 Programmed cell death protein 11 Apoptosis Up, 1.42 0.017 NM_144917 C330008I1
5Rik Riken cDNA C330008I15 Apoptosis Up, 1.74 0.048
NM_028557 Mbd3l1 Methyl-CpG binding domain protein 3-like 1
Transcriptional repressor, negative regulation of metabolism
Up, 0.43 0.072
NM_018744 Sema6a transmembrane domain (TM), and cytoplasmic domain, (semaphorin) 6A
Apoptosis Up, 1.85 0.037
Differentially expressed genes associated with electron transport BC031849 MGC:30
35 Succinate dehydrogenase complex, subunit A, flavoprotein (Fp)
Coenzyme metabolism, cofactor catabolism, electron transport
Up, 0.45 0.073
NM_024173 ATP6v1g1
ATPase, H+ transporting, V1 subunit G isoform 1
Catalytic subunit of the peripheral V1 complex of vacuolar ATPase
Up,0.55 0.066
AK020108 Ndufs4 NADH dehydrogenase (ubiquinone) Fe-S protein 4
Electron transport Up, 1.67 0.015
NM_053164 Mrp143 Mitochondrial ribosomal protein l43 Mitochondrial protein synthesis Up, 0.40 0.066 NM_012025 Racgap1 Rac GTPase-activating protein 1 Electron transport, generation of precursor
metabolites and energy Up,0.43 0.080
Differentially expressed genes associated with other functions NM_010929 Notch4 Notch gene homolog 4 Hypothetical protein Up,0.45 0.048 AK083573 D030046P
11Rik Fibulin 1 Hypothetical protein Down,0.75 0.110
NM_025623 Nipsnap3b Nipsnap homolog 3B Unknown function Down,0.42 0.100 NM_011535 Tbx3 t-box 3 Embryo development Up,0.45 0.070 AK012465 Tm4sf7 Pterin 4 alpha carbinolamine dehydratase Hepatocyte nuclear factor transcription Up,0.43 0.085 NM_028868 Cxxc1 CXXC finger 1 Transcriptional activity Up,0.54 0.087 BC054544 Ctnnd1 Catenin delta 1 Tyrosine kinase activity Down,0.62 0.035
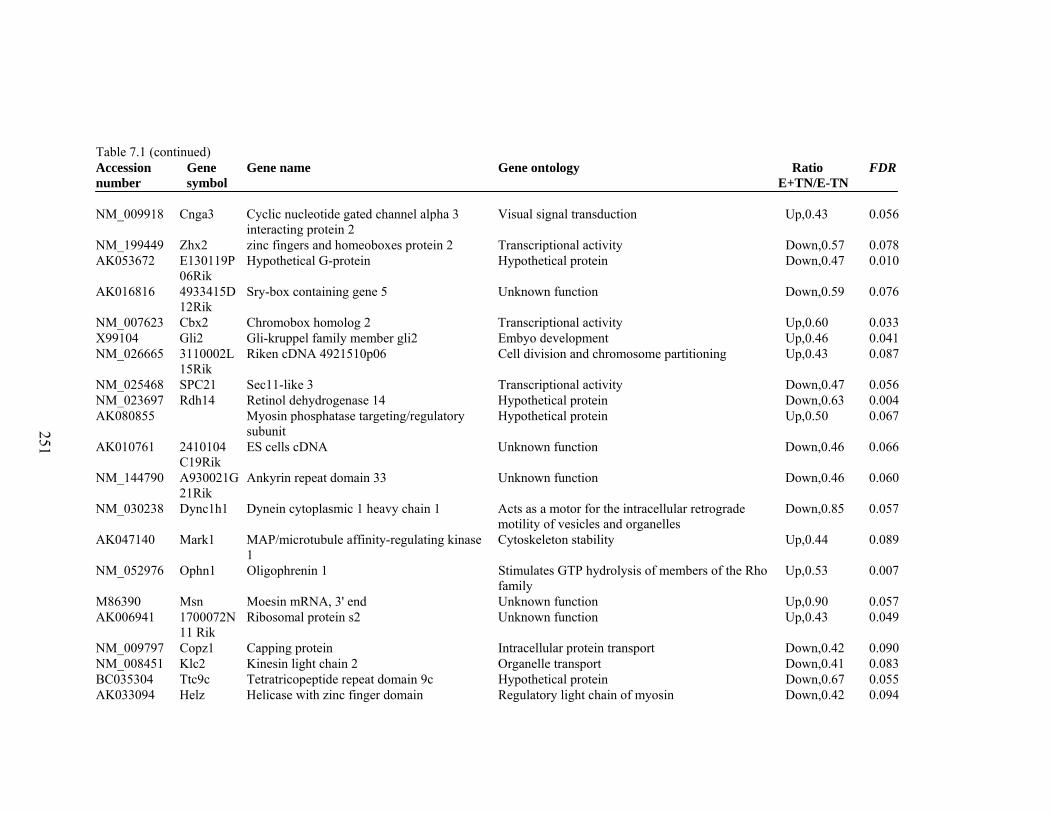
251
Table 7.1 (continued) Accession number
Gene symbol
Gene name Gene ontology Ratio E+TN/E-TN
FDR
NM_009918 Cnga3 Cyclic nucleotide gated channel alpha 3
interacting protein 2 Visual signal transduction Up,0.43 0.056
NM_199449 Zhx2 zinc fingers and homeoboxes protein 2 Transcriptional activity Down,0.57 0.078 AK053672 E130119P
06Rik Hypothetical G-protein Hypothetical protein Down,0.47 0.010
AK016816 4933415D12Rik
Sry-box containing gene 5 Unknown function Down,0.59 0.076
NM_007623 Cbx2 Chromobox homolog 2 Transcriptional activity Up,0.60 0.033 X99104 Gli2 Gli-kruppel family member gli2 Embyo development Up,0.46 0.041 NM_026665 3110002L
15Rik Riken cDNA 4921510p06 Cell division and chromosome partitioning Up,0.43 0.087
NM_025468 SPC21 Sec11-like 3 Transcriptional activity Down,0.47 0.056 NM_023697 Rdh14 Retinol dehydrogenase 14 Hypothetical protein Down,0.63 0.004 AK080855 Myosin phosphatase targeting/regulatory
subunit Hypothetical protein Up,0.50 0.067
AK010761 2410104C19Rik
ES cells cDNA Unknown function Down,0.46 0.066
NM_144790 A930021G21Rik
Ankyrin repeat domain 33 Unknown function Down,0.46 0.060
NM_030238 Dync1h1 Dynein cytoplasmic 1 heavy chain 1 Acts as a motor for the intracellular retrograde motility of vesicles and organelles
Down,0.85 0.057
AK047140 Mark1 MAP/microtubule affinity-regulating kinase 1
Cytoskeleton stability Up,0.44 0.089
NM_052976 Ophn1 Oligophrenin 1 Stimulates GTP hydrolysis of members of the Rho family
Up,0.53 0.007
M86390 Msn Moesin mRNA, 3' end Unknown function Up,0.90 0.057 AK006941 1700072N
11 Rik Ribosomal protein s2 Unknown function Up,0.43 0.049
NM_009797 Copz1 Capping protein Intracellular protein transport Down,0.42 0.090 NM_008451 Klc2 Kinesin light chain 2 Organelle transport Down,0.41 0.083 BC035304 Ttc9c Tetratricopeptide repeat domain 9c Hypothetical protein Down,0.67 0.055 AK033094 Helz Helicase with zinc finger domain Regulatory light chain of myosin Down,0.42 0.094
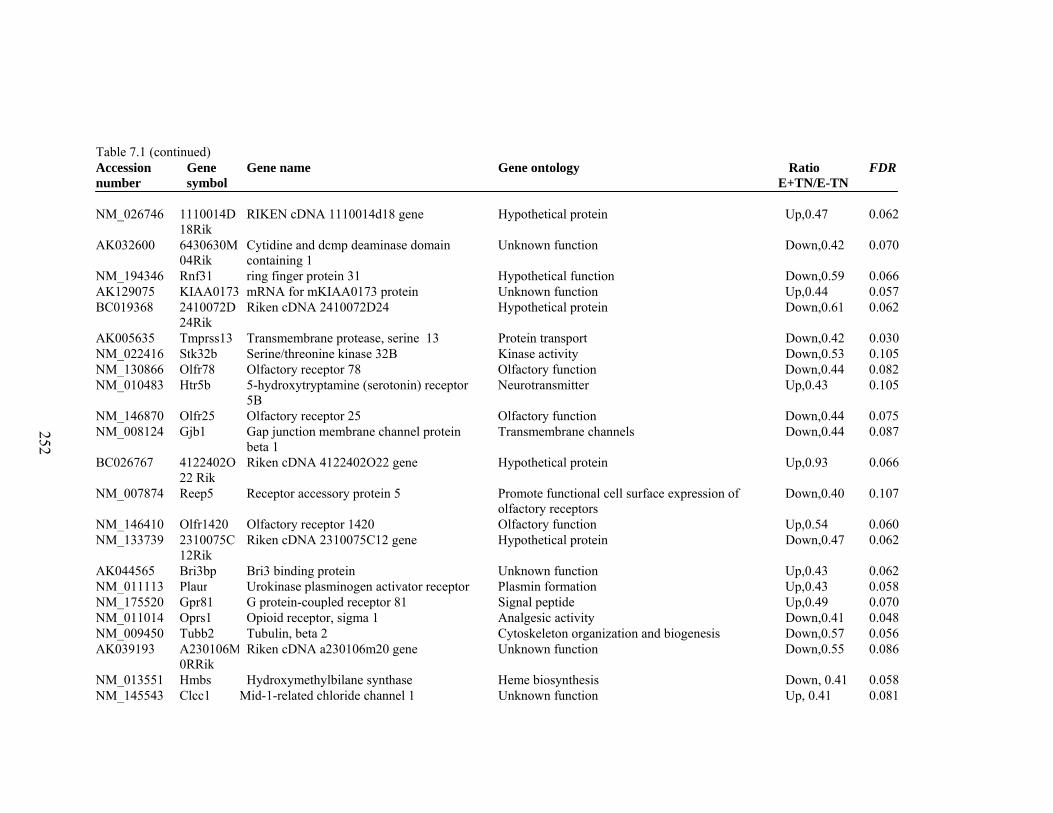
252
Table 7.1 (continued) Accession number
Gene symbol
Gene name Gene ontology Ratio E+TN/E-TN
FDR
NM_026746 1110014D
18Rik RIKEN cDNA 1110014d18 gene Hypothetical protein Up,0.47 0.062
AK032600 6430630M04Rik
Cytidine and dcmp deaminase domain containing 1
Unknown function Down,0.42 0.070
NM_194346 Rnf31 ring finger protein 31 Hypothetical function Down,0.59 0.066 AK129075 KIAA0173 mRNA for mKIAA0173 protein Unknown function Up,0.44 0.057 BC019368 2410072D
24Rik Riken cDNA 2410072D24 Hypothetical protein Down,0.61 0.062
AK005635 Tmprss13 Transmembrane protease, serine 13 Protein transport Down,0.42 0.030 NM_022416 Stk32b Serine/threonine kinase 32B Kinase activity Down,0.53 0.105 NM_130866 Olfr78 Olfactory receptor 78 Olfactory function Down,0.44 0.082 NM_010483 Htr5b 5-hydroxytryptamine (serotonin) receptor
5B Neurotransmitter Up,0.43 0.105
NM_146870 Olfr25 Olfactory receptor 25 Olfactory function Down,0.44 0.075 NM_008124 Gjb1 Gap junction membrane channel protein
beta 1 Transmembrane channels Down,0.44 0.087
BC026767 4122402O22 Rik
Riken cDNA 4122402O22 gene Hypothetical protein Up,0.93 0.066
NM_007874 Reep5 Receptor accessory protein 5 Promote functional cell surface expression of olfactory receptors
Down,0.40 0.107
NM_146410 Olfr1420 Olfactory receptor 1420 Olfactory function Up,0.54 0.060 NM_133739 2310075C
12Rik Riken cDNA 2310075C12 gene Hypothetical protein Down,0.47 0.062
AK044565 Bri3bp Bri3 binding protein Unknown function Up,0.43 0.062 NM_011113 Plaur Urokinase plasminogen activator receptor Plasmin formation Up,0.43 0.058 NM_175520 Gpr81 G protein-coupled receptor 81 Signal peptide Up,0.49 0.070 NM_011014 Oprs1 Opioid receptor, sigma 1 Analgesic activity Down,0.41 0.048 NM_009450 Tubb2 Tubulin, beta 2 Cytoskeleton organization and biogenesis Down,0.57 0.056 AK039193 A230106M
0RRik Riken cDNA a230106m20 gene Unknown function Down,0.55 0.086
NM_013551 Hmbs Hydroxymethylbilane synthase Heme biosynthesis Down, 0.41 0.058 NM_145543 Clcc1 Mid-1-related chloride channel 1 Unknown function Up, 0.41 0.081
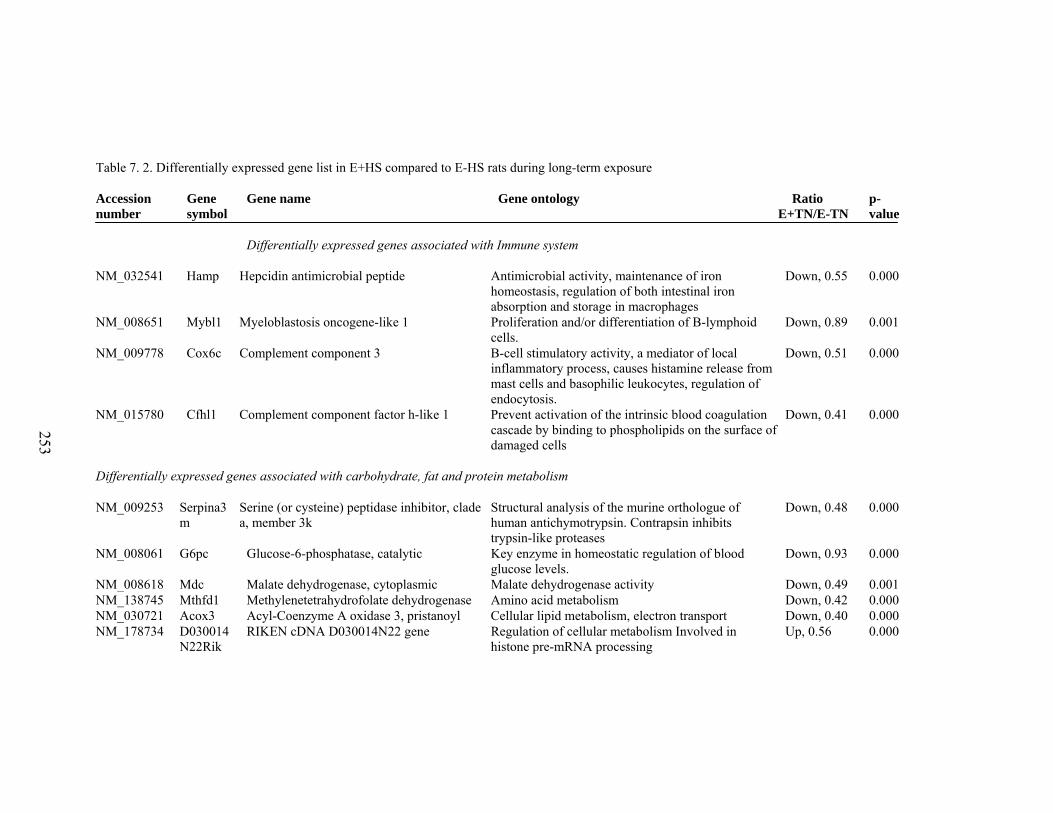
253
Table 7. 2. Differentially expressed gene list in E+HS compared to E-HS rats during long-term exposure Accession number
Gene symbol
Gene name Gene ontology Ratio E+TN/E-TN
p-value
Differentially expressed genes associated with Immune system
NM_032541 Hamp Hepcidin antimicrobial peptide Antimicrobial activity, maintenance of iron homeostasis, regulation of both intestinal iron absorption and storage in macrophages
Down, 0.55 0.000
NM_008651 Mybl1 Myeloblastosis oncogene-like 1 Proliferation and/or differentiation of B-lymphoid cells.
Down, 0.89 0.001
NM_009778 Cox6c Complement component 3 B-cell stimulatory activity, a mediator of local inflammatory process, causes histamine release from mast cells and basophilic leukocytes, regulation of endocytosis.
Down, 0.51 0.000
NM_015780 Cfhl1 Complement component factor h-like 1 Prevent activation of the intrinsic blood coagulation cascade by binding to phospholipids on the surface of damaged cells
Down, 0.41 0.000
Differentially expressed genes associated with carbohydrate, fat and protein metabolism NM_009253 Serpina3
m Serine (or cysteine) peptidase inhibitor, clade a, member 3k
Structural analysis of the murine orthologue of human antichymotrypsin. Contrapsin inhibits trypsin-like proteases
Down, 0.48 0.000
NM_008061 G6pc Glucose-6-phosphatase, catalytic Key enzyme in homeostatic regulation of blood glucose levels.
Down, 0.93 0.000
NM_008618 Mdc Malate dehydrogenase, cytoplasmic Malate dehydrogenase activity Down, 0.49 0.001 NM_138745 Mthfd1 Methylenetetrahydrofolate dehydrogenase Amino acid metabolism Down, 0.42 0.000 NM_030721 Acox3 Acyl-Coenzyme A oxidase 3, pristanoyl Cellular lipid metabolism, electron transport Down, 0.40 0.000 NM_178734 D030014
N22Rik RIKEN cDNA D030014N22 gene Regulation of cellular metabolism Involved in
histone pre-mRNA processing Up, 0.56 0.000
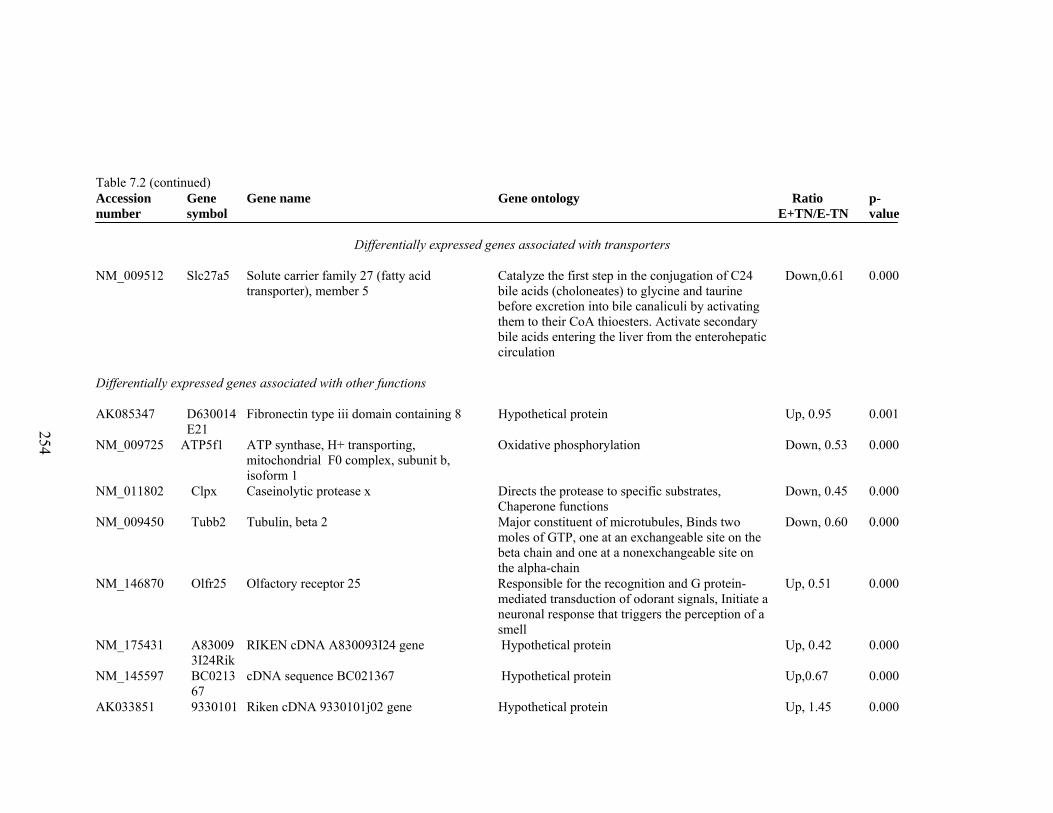
254
Table 7.2 (continued) Accession number
Gene symbol
Gene name Gene ontology Ratio E+TN/E-TN
p-value
Differentially expressed genes associated with transporters
NM_009512 Slc27a5 Solute carrier family 27 (fatty acid transporter), member 5
Catalyze the first step in the conjugation of C24 bile acids (choloneates) to glycine and taurine before excretion into bile canaliculi by activating them to their CoA thioesters. Activate secondary bile acids entering the liver from the enterohepatic circulation
Down,0.61 0.000
Differentially expressed genes associated with other functions AK085347 D630014
E21 Fibronectin type iii domain containing 8 Hypothetical protein Up, 0.95 0.001
NM_009725 ATP5f1 ATP synthase, H+ transporting, mitochondrial F0 complex, subunit b, isoform 1
Oxidative phosphorylation Down, 0.53 0.000
NM_011802 Clpx Caseinolytic protease x Directs the protease to specific substrates, Chaperone functions
Down, 0.45 0.000
NM_009450 Tubb2 Tubulin, beta 2 Major constituent of microtubules, Binds two moles of GTP, one at an exchangeable site on the beta chain and one at a nonexchangeable site on the alpha-chain
Down, 0.60 0.000
NM_146870 Olfr25 Olfactory receptor 25 Responsible for the recognition and G protein-mediated transduction of odorant signals, Initiate a neuronal response that triggers the perception of a smell
Up, 0.51 0.000
NM_175431 A830093I24Rik
RIKEN cDNA A830093I24 gene Hypothetical protein Up, 0.42 0.000
NM_145597 BC021367
cDNA sequence BC021367 Hypothetical protein Up,0.67 0.000
AK033851 9330101 Riken cDNA 9330101j02 gene Hypothetical protein Up, 1.45 0.000
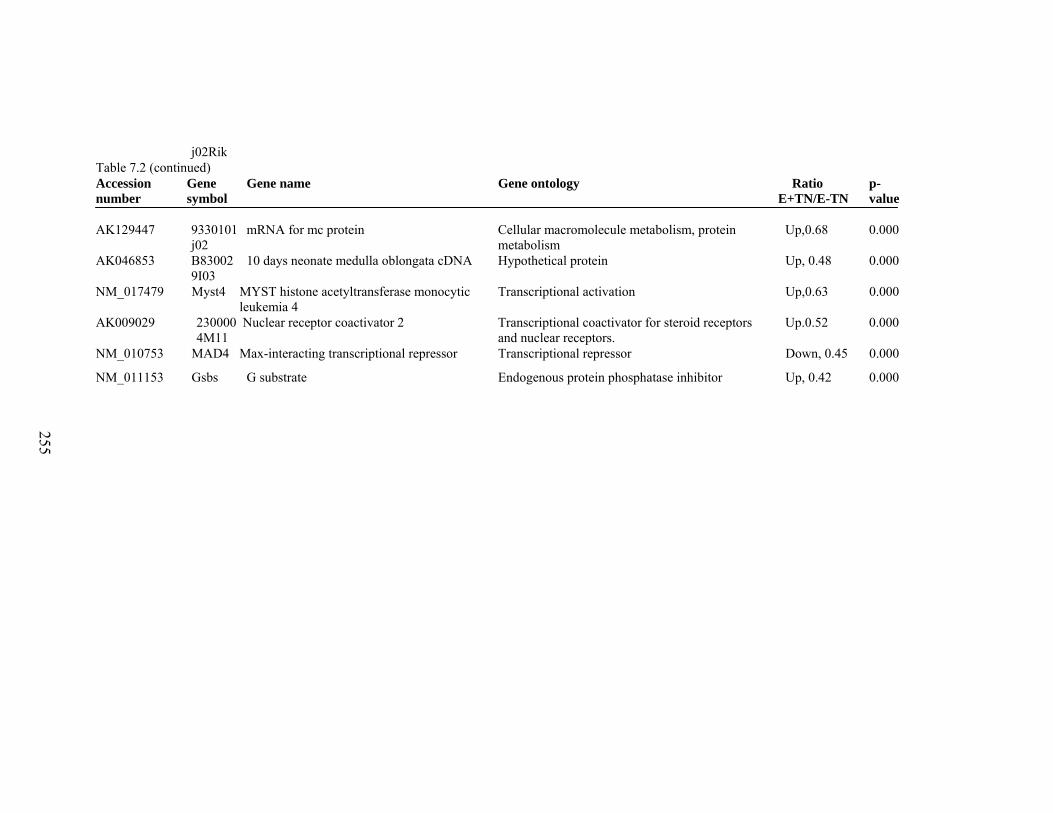
255
j02Rik Table 7.2 (continued) Accession number
Gene symbol
Gene name Gene ontology Ratio E+TN/E-TN
p-value
AK129447 9330101
j02 mRNA for mc protein Cellular macromolecule metabolism, protein
metabolism Up,0.68 0.000
AK046853 B830029I03
10 days neonate medulla oblongata cDNA Hypothetical protein Up, 0.48 0.000
NM_017479 Myst4 MYST histone acetyltransferase monocytic leukemia 4
Transcriptional activation Up,0.63 0.000
AK009029 2300004M11
Nuclear receptor coactivator 2 Transcriptional coactivator for steroid receptors and nuclear receptors.
Up.0.52 0.000
NM_010753 MAD4 Max-interacting transcriptional repressor Transcriptional repressor Down, 0.45 0.000
NM_011153 Gsbs G substrate Endogenous protein phosphatase inhibitor Up, 0.42 0.000
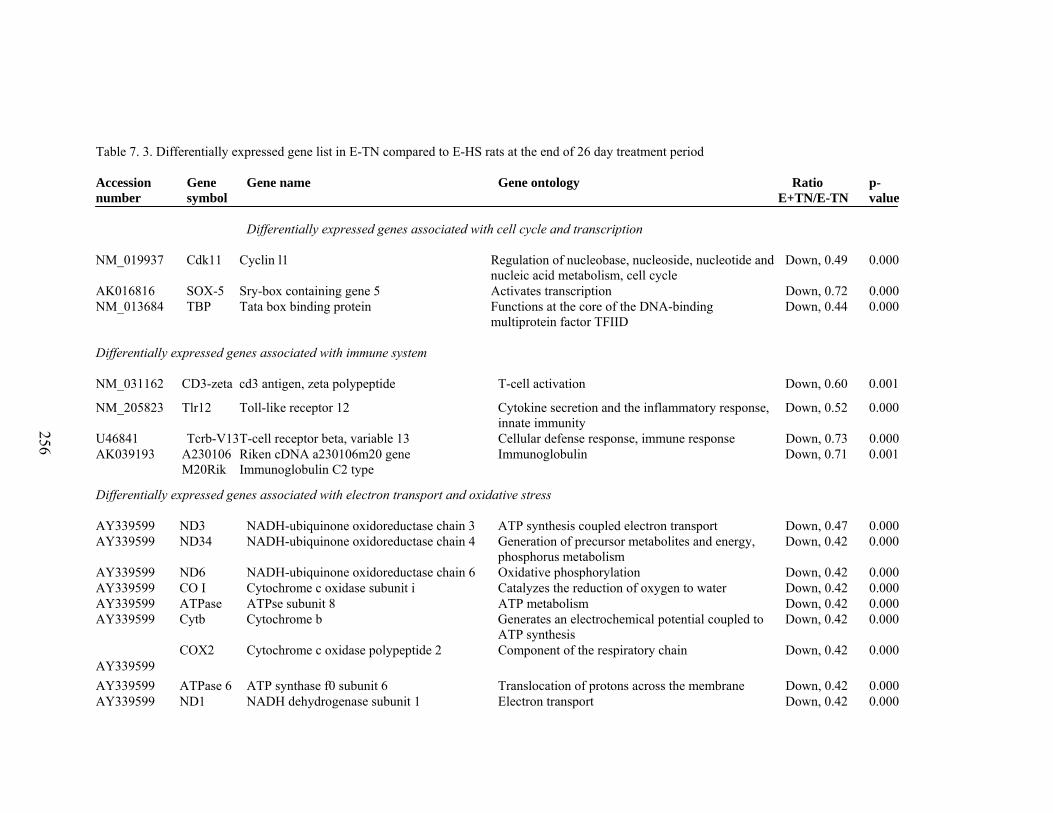
256
Table 7. 3. Differentially expressed gene list in E-TN compared to E-HS rats at the end of 26 day treatment period Accession number
Gene symbol
Gene name Gene ontology Ratio E+TN/E-TN
p-value
Differentially expressed genes associated with cell cycle and transcription
NM_019937 Cdk11 Cyclin l1 Regulation of nucleobase, nucleoside, nucleotide and nucleic acid metabolism, cell cycle
Down, 0.49 0.000
AK016816 SOX-5 Sry-box containing gene 5 Activates transcription Down, 0.72 0.000 NM_013684 TBP Tata box binding protein Functions at the core of the DNA-binding
multiprotein factor TFIID Down, 0.44 0.000
Differentially expressed genes associated with immune system NM_031162 CD3-zeta cd3 antigen, zeta polypeptide T-cell activation Down, 0.60 0.001
NM_205823 Tlr12 Toll-like receptor 12 Cytokine secretion and the inflammatory response, innate immunity
Down, 0.52 0.000
U46841 Tcrb-V13T-cell receptor beta, variable 13 Cellular defense response, immune response Down, 0.73 0.000 AK039193 A230106
M20Rik Riken cDNA a230106m20 gene Immunoglobulin C2 type
Immunoglobulin Down, 0.71 0.001
Differentially expressed genes associated with electron transport and oxidative stress AY339599 ND3 NADH-ubiquinone oxidoreductase chain 3 ATP synthesis coupled electron transport Down, 0.47 0.000 AY339599 ND34 NADH-ubiquinone oxidoreductase chain 4 Generation of precursor metabolites and energy,
phosphorus metabolism Down, 0.42 0.000
AY339599 ND6 NADH-ubiquinone oxidoreductase chain 6 Oxidative phosphorylation Down, 0.42 0.000 AY339599 CO I Cytochrome c oxidase subunit i Catalyzes the reduction of oxygen to water Down, 0.42 0.000 AY339599 ATPase ATPse subunit 8 ATP metabolism Down, 0.42 0.000 AY339599 Cytb Cytochrome b Generates an electrochemical potential coupled to
ATP synthesis Down, 0.42 0.000
AY339599 COX2 Cytochrome c oxidase polypeptide 2 Component of the respiratory chain Down, 0.42 0.000
AY339599 ATPase 6 ATP synthase f0 subunit 6 Translocation of protons across the membrane Down, 0.42 0.000 AY339599 ND1 NADH dehydrogenase subunit 1 Electron transport Down, 0.42 0.000
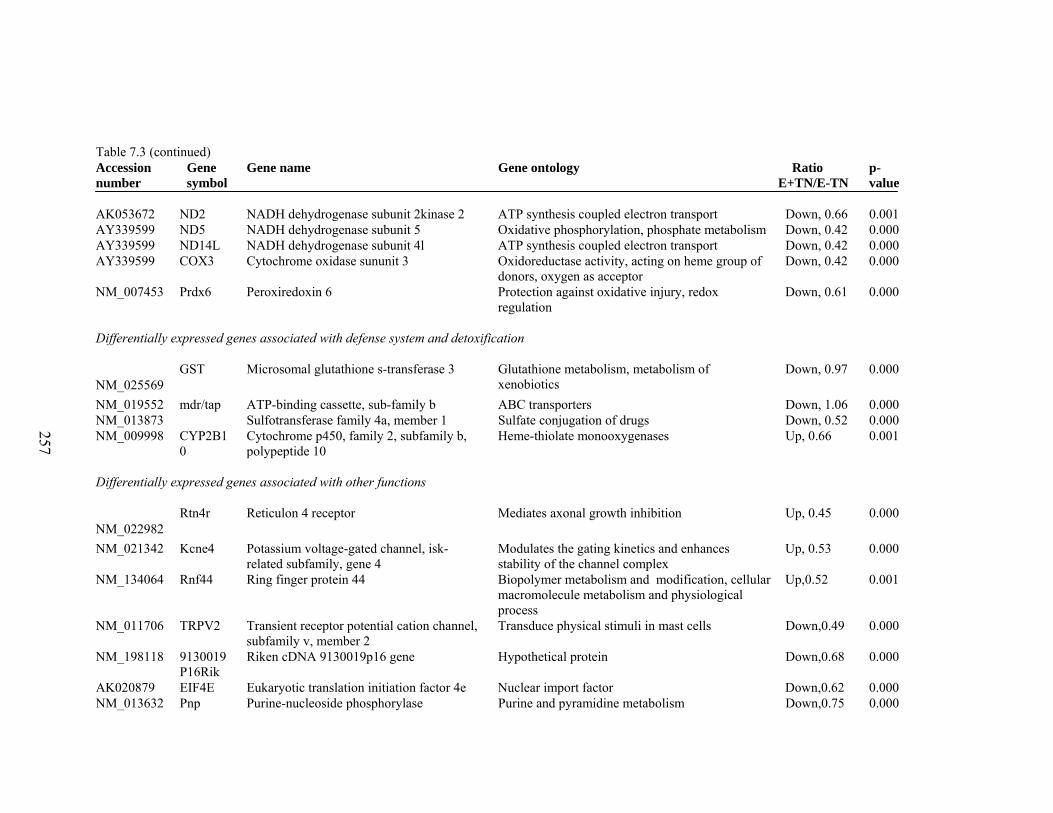
257
Table 7.3 (continued) Accession number
Gene symbol
Gene name Gene ontology Ratio E+TN/E-TN
p-value
AK053672 ND2 NADH dehydrogenase subunit 2kinase 2 ATP synthesis coupled electron transport Down, 0.66 0.001 AY339599 ND5 NADH dehydrogenase subunit 5 Oxidative phosphorylation, phosphate metabolism Down, 0.42 0.000 AY339599 ND14L NADH dehydrogenase subunit 4l ATP synthesis coupled electron transport Down, 0.42 0.000 AY339599 COX3 Cytochrome oxidase sununit 3 Oxidoreductase activity, acting on heme group of
donors, oxygen as acceptor Down, 0.42 0.000
NM_007453 Prdx6 Peroxiredoxin 6 Protection against oxidative injury, redox regulation
Down, 0.61 0.000
Differentially expressed genes associated with defense system and detoxification
NM_025569 GST Microsomal glutathione s-transferase 3 Glutathione metabolism, metabolism of
xenobiotics Down, 0.97 0.000
NM_019552 mdr/tap ATP-binding cassette, sub-family b ABC transporters Down, 1.06 0.000 NM_013873 Sulfotransferase family 4a, member 1 Sulfate conjugation of drugs Down, 0.52 0.000 NM_009998 CYP2B1
0 Cytochrome p450, family 2, subfamily b, polypeptide 10
Heme-thiolate monooxygenases Up, 0.66 0.001
Differentially expressed genes associated with other functions
NM_022982 Rtn4r Reticulon 4 receptor Mediates axonal growth inhibition Up, 0.45 0.000
NM_021342 Kcne4 Potassium voltage-gated channel, isk-related subfamily, gene 4
Modulates the gating kinetics and enhances stability of the channel complex
Up, 0.53 0.000
NM_134064 Rnf44 Ring finger protein 44 Biopolymer metabolism and modification, cellular macromolecule metabolism and physiological process
Up,0.52 0.001
NM_011706 TRPV2 Transient receptor potential cation channel, subfamily v, member 2
Transduce physical stimuli in mast cells Down,0.49 0.000
NM_198118 9130019P16Rik
Riken cDNA 9130019p16 gene Hypothetical protein Down,0.68 0.000
AK020879 EIF4E Eukaryotic translation initiation factor 4e Nuclear import factor Down,0.62 0.000 NM_013632 Pnp Purine-nucleoside phosphorylase Purine and pyramidine metabolism Down,0.75 0.000
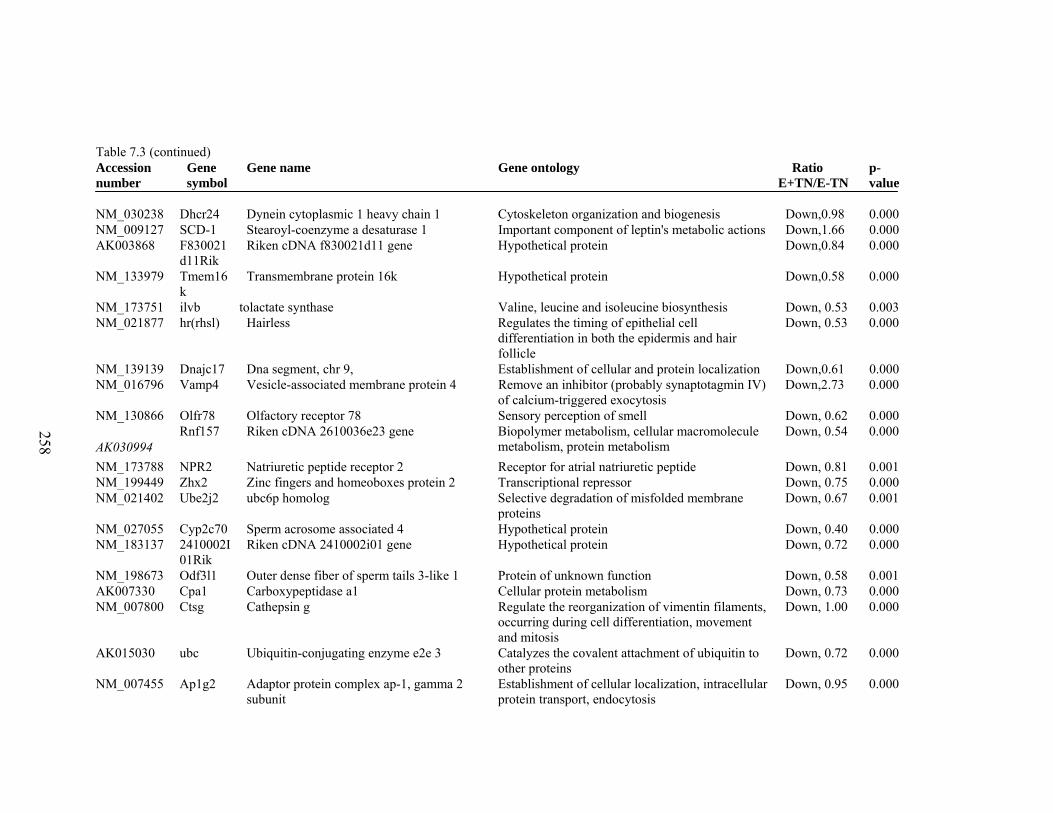
258
Table 7.3 (continued) Accession number
Gene symbol
Gene name Gene ontology Ratio E+TN/E-TN
p-value
NM_030238 Dhcr24 Dynein cytoplasmic 1 heavy chain 1 Cytoskeleton organization and biogenesis Down,0.98 0.000 NM_009127 SCD-1 Stearoyl-coenzyme a desaturase 1 Important component of leptin's metabolic actions Down,1.66 0.000 AK003868 F830021
d11Rik Riken cDNA f830021d11 gene Hypothetical protein Down,0.84 0.000
NM_133979 Tmem16k
Transmembrane protein 16k Hypothetical protein Down,0.58 0.000
NM_173751 ilvb tolactate synthase Valine, leucine and isoleucine biosynthesis Down, 0.53 0.003 NM_021877 hr(rhsl) Hairless Regulates the timing of epithelial cell
differentiation in both the epidermis and hair follicle
Down, 0.53 0.000
NM_139139 Dnajc17 Dna segment, chr 9, Establishment of cellular and protein localization Down,0.61 0.000 NM_016796 Vamp4 Vesicle-associated membrane protein 4 Remove an inhibitor (probably synaptotagmin IV)
of calcium-triggered exocytosis Down,2.73 0.000
NM_130866 Olfr78 Olfactory receptor 78 Sensory perception of smell Down, 0.62 0.000
AK030994 Rnf157 Riken cDNA 2610036e23 gene Biopolymer metabolism, cellular macromolecule
metabolism, protein metabolism Down, 0.54 0.000
NM_173788 NPR2 Natriuretic peptide receptor 2 Receptor for atrial natriuretic peptide Down, 0.81 0.001 NM_199449 Zhx2 Zinc fingers and homeoboxes protein 2 Transcriptional repressor Down, 0.75 0.000 NM_021402 Ube2j2 ubc6p homolog Selective degradation of misfolded membrane
proteins Down, 0.67 0.001
NM_027055 Cyp2c70 Sperm acrosome associated 4 Hypothetical protein Down, 0.40 0.000 NM_183137 2410002I
01Rik Riken cDNA 2410002i01 gene Hypothetical protein Down, 0.72 0.000
NM_198673 Odf3l1 Outer dense fiber of sperm tails 3-like 1 Protein of unknown function Down, 0.58 0.001 AK007330 Cpa1 Carboxypeptidase a1 Cellular protein metabolism Down, 0.73 0.000 NM_007800 Ctsg Cathepsin g Regulate the reorganization of vimentin filaments,
occurring during cell differentiation, movement and mitosis
Down, 1.00 0.000
AK015030 ubc Ubiquitin-conjugating enzyme e2e 3 Catalyzes the covalent attachment of ubiquitin to other proteins
Down, 0.72 0.000
NM_007455 Ap1g2 Adaptor protein complex ap-1, gamma 2 subunit
Establishment of cellular localization, intracellular protein transport, endocytosis
Down, 0.95 0.000
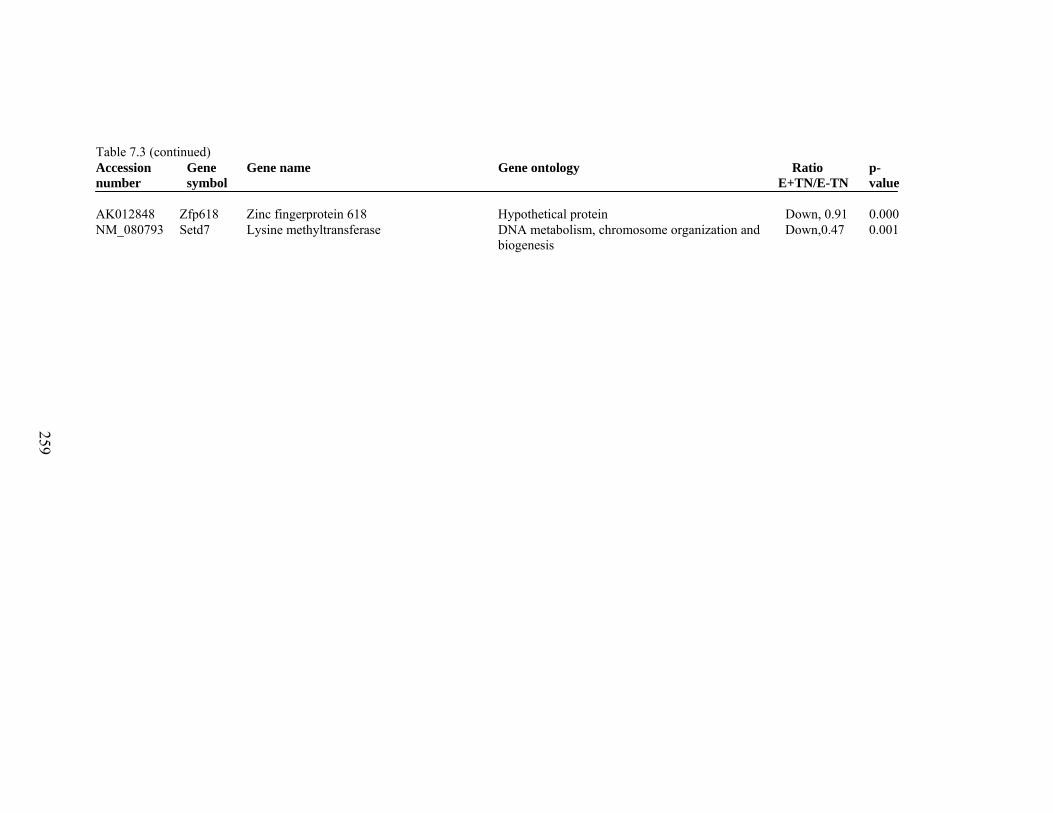
259
Table 7.3 (continued) Accession number
Gene symbol
Gene name Gene ontology Ratio E+TN/E-TN
p-value
AK012848 Zfp618 Zinc fingerprotein 618 Hypothetical protein Down, 0.91 0.000 NM_080793 Setd7 Lysine methyltransferase DNA metabolism, chromosome organization and
biogenesis Down,0.47 0.001
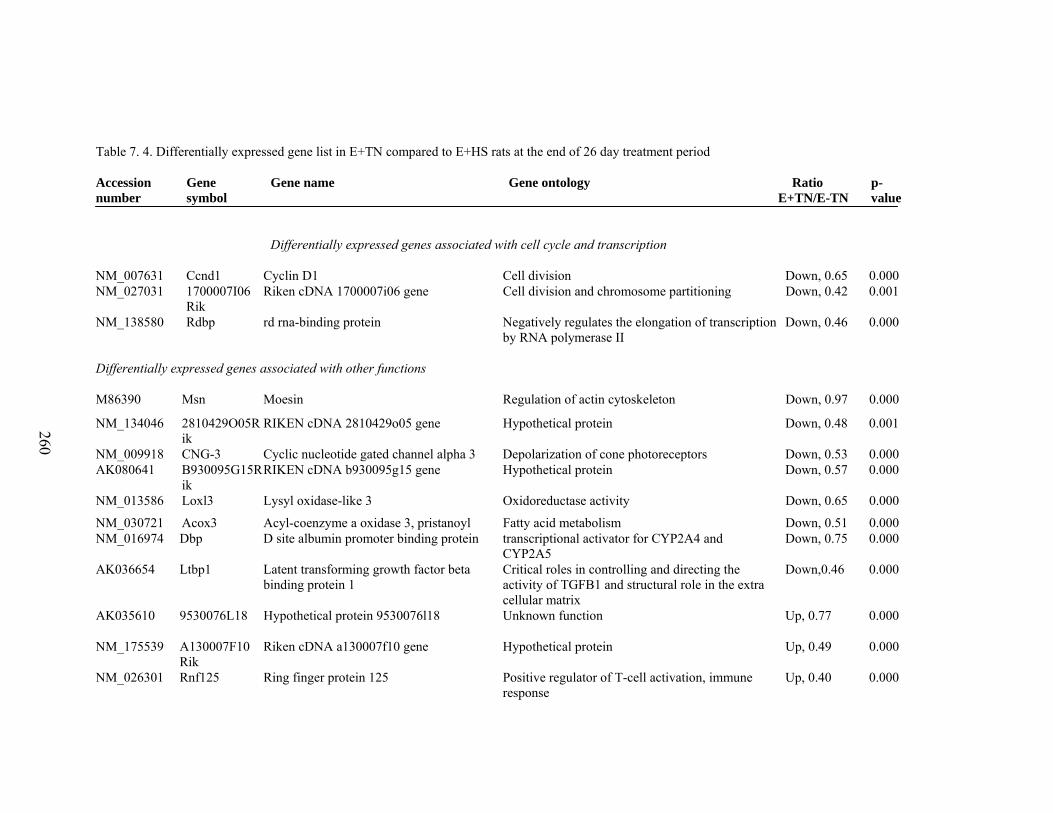
260
Table 7. 4. Differentially expressed gene list in E+TN compared to E+HS rats at the end of 26 day treatment period Accession number
Gene symbol
Gene name Gene ontology Ratio E+TN/E-TN
p-value
Differentially expressed genes associated with cell cycle and transcription
NM_007631 Ccnd1 Cyclin D1 Cell division Down, 0.65 0.000 NM_027031 1700007I06
Rik Riken cDNA 1700007i06 gene Cell division and chromosome partitioning Down, 0.42
0.001
NM_138580 Rdbp rd rna-binding protein Negatively regulates the elongation of transcription by RNA polymerase II
Down, 0.46 0.000
Differentially expressed genes associated with other functions M86390 Msn Moesin Regulation of actin cytoskeleton Down, 0.97 0.000
NM_134046 2810429O05Rik
RIKEN cDNA 2810429o05 gene Hypothetical protein Down, 0.48 0.001
NM_009918 CNG-3 Cyclic nucleotide gated channel alpha 3 Depolarization of cone photoreceptors Down, 0.53 0.000 AK080641 B930095G15R
ik RIKEN cDNA b930095g15 gene Hypothetical protein Down, 0.57 0.000
NM_013586 Loxl3 Lysyl oxidase-like 3 Oxidoreductase activity Down, 0.65 0.000
NM_030721 Acox3 Acyl-coenzyme a oxidase 3, pristanoyl Fatty acid metabolism Down, 0.51 0.000 NM_016974 Dbp D site albumin promoter binding protein transcriptional activator for CYP2A4 and
CYP2A5 Down, 0.75 0.000
AK036654 Ltbp1 Latent transforming growth factor beta binding protein 1
Critical roles in controlling and directing the activity of TGFB1 and structural role in the extra cellular matrix
Down,0.46 0.000
AK035610 9530076L18 Hypothetical protein 9530076l18 Unknown function Up, 0.77 0.000
NM_175539 A130007F10Rik
Riken cDNA a130007f10 gene Hypothetical protein Up, 0.49 0.000
NM_026301 Rnf125 Ring finger protein 125 Positive regulator of T-cell activation, immune response
Up, 0.40 0.000
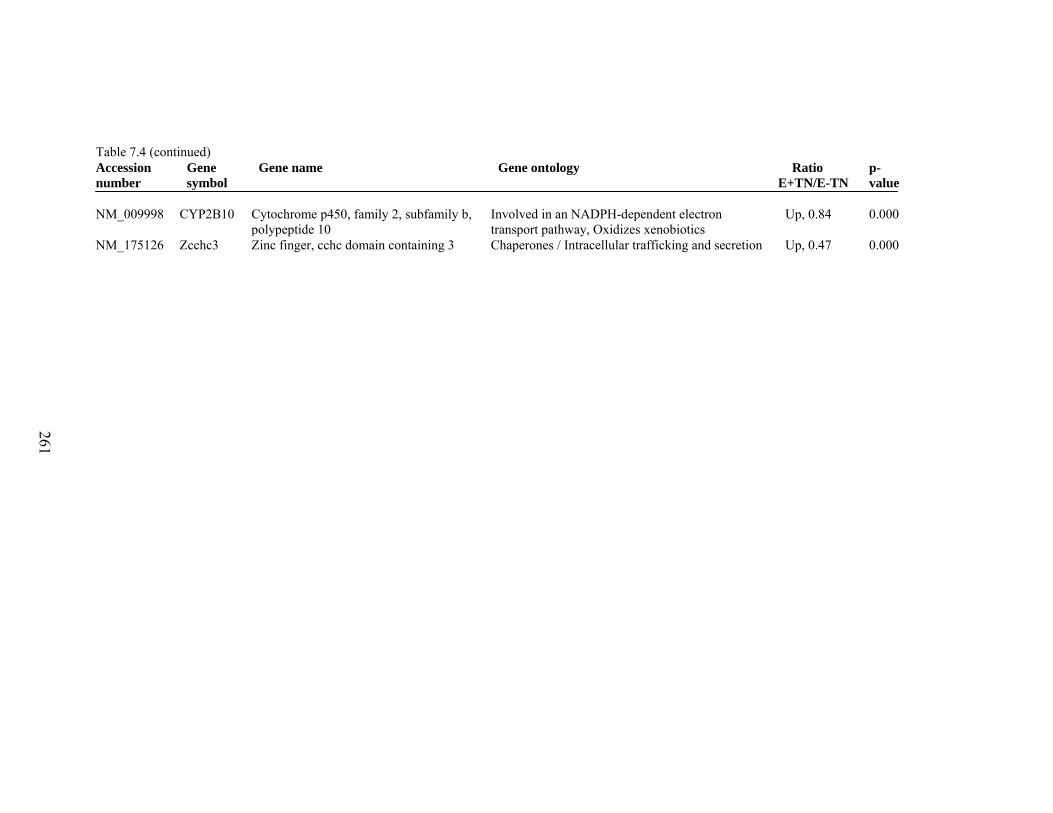
261
Table 7.4 (continued) Accession number
Gene symbol
Gene name Gene ontology Ratio E+TN/E-TN
p-value
NM_009998 CYP2B10 Cytochrome p450, family 2, subfamily b,
polypeptide 10 Involved in an NADPH-dependent electron transport pathway, Oxidizes xenobiotics
Up, 0.84 0.000
NM_175126 Zcchc3 Zinc finger, cchc domain containing 3 Chaperones / Intracellular trafficking and secretion
Up, 0.47 0.000
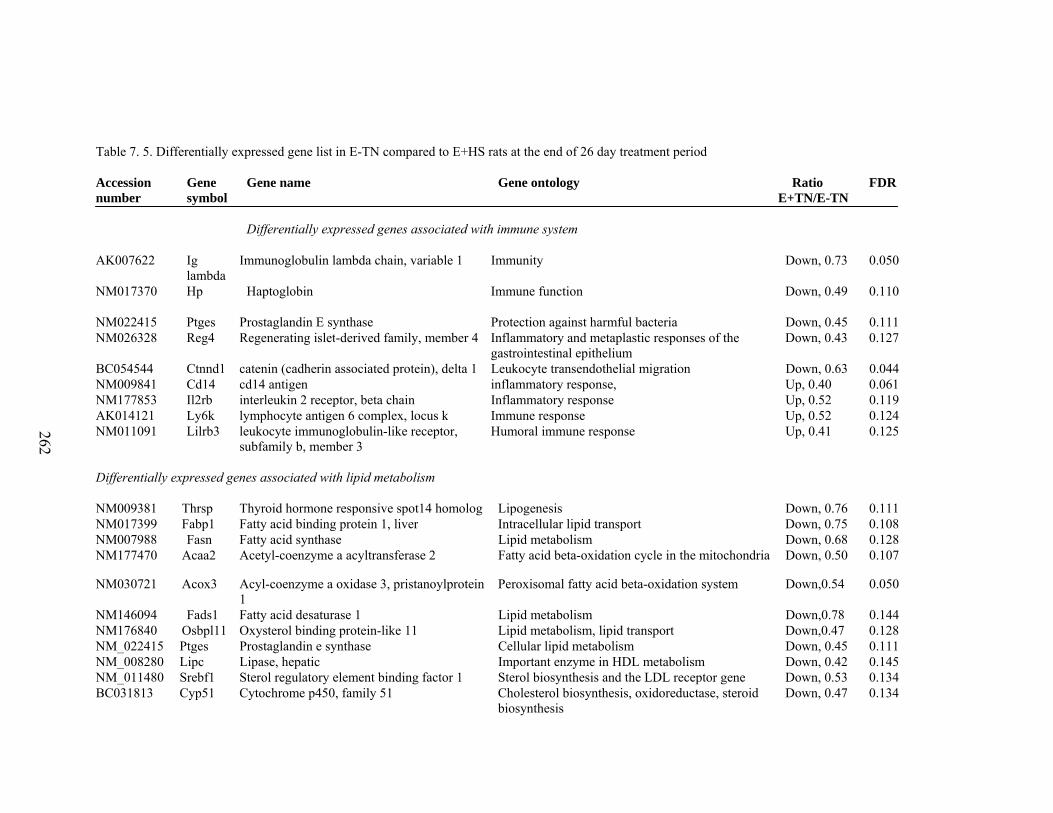
262
Table 7. 5. Differentially expressed gene list in E-TN compared to E+HS rats at the end of 26 day treatment period Accession number
Gene symbol
Gene name Gene ontology Ratio E+TN/E-TN
FDR
Differentially expressed genes associated with immune system AK007622 Ig
lambda Immunoglobulin lambda chain, variable 1 Immunity Down, 0.73 0.050
NM017370 Hp Haptoglobin Immune function Down, 0.49 0.110
NM022415 Ptges Prostaglandin E synthase Protection against harmful bacteria Down, 0.45 0.111 NM026328 Reg4 Regenerating islet-derived family, member 4 Inflammatory and metaplastic responses of the
gastrointestinal epithelium Down, 0.43 0.127
BC054544 Ctnnd1 catenin (cadherin associated protein), delta 1 Leukocyte transendothelial migration Down, 0.63 0.044 NM009841 Cd14 cd14 antigen inflammatory response, Up, 0.40 0.061 NM177853 Il2rb interleukin 2 receptor, beta chain Inflammatory response Up, 0.52 0.119 AK014121 Ly6k lymphocyte antigen 6 complex, locus k Immune response Up, 0.52 0.124 NM011091 Lilrb3 leukocyte immunoglobulin-like receptor,
subfamily b, member 3 Humoral immune response Up, 0.41 0.125
Differentially expressed genes associated with lipid metabolism NM009381 Thrsp Thyroid hormone responsive spot14 homolog Lipogenesis Down, 0.76 0.111 NM017399 Fabp1 Fatty acid binding protein 1, liver Intracellular lipid transport Down, 0.75 0.108 NM007988 Fasn Fatty acid synthase Lipid metabolism Down, 0.68 0.128 NM177470 Acaa2 Acetyl-coenzyme a acyltransferase 2 Fatty acid beta-oxidation cycle in the mitochondria Down, 0.50 0.107
NM030721 Acox3 Acyl-coenzyme a oxidase 3, pristanoylprotein 1
Peroxisomal fatty acid beta-oxidation system Down,0.54 0.050
NM146094 Fads1 Fatty acid desaturase 1 Lipid metabolism Down,0.78 0.144 NM176840 Osbpl11 Oxysterol binding protein-like 11 Lipid metabolism, lipid transport Down,0.47 0.128 NM_022415 Ptges Prostaglandin e synthase Cellular lipid metabolism Down, 0.45 0.111 NM_008280 Lipc Lipase, hepatic Important enzyme in HDL metabolism Down, 0.42 0.145 NM_011480 Srebf1 Sterol regulatory element binding factor 1 Sterol biosynthesis and the LDL receptor gene Down, 0.53 0.134 BC031813 Cyp51 Cytochrome p450, family 51 Cholesterol biosynthesis, oxidoreductase, steroid
biosynthesis Down, 0.47 0.134
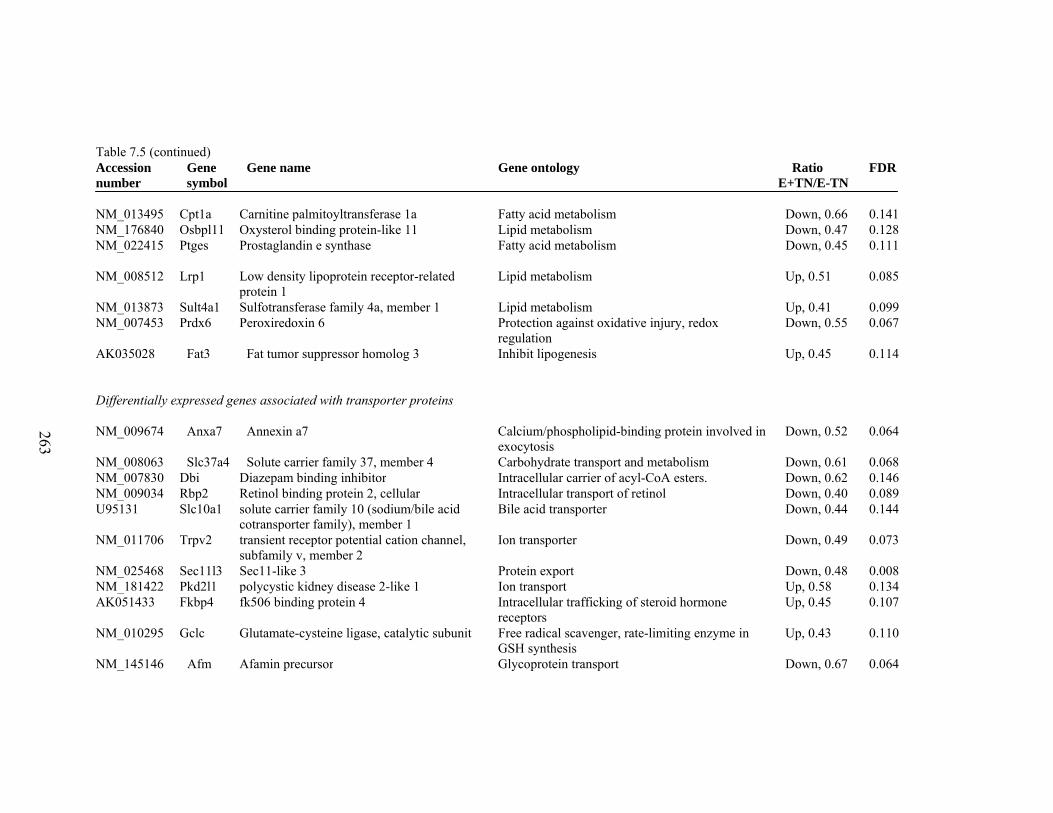
263
Table 7.5 (continued) Accession number
Gene symbol
Gene name Gene ontology Ratio E+TN/E-TN
FDR
NM_013495 Cpt1a Carnitine palmitoyltransferase 1a Fatty acid metabolism Down, 0.66 0.141 NM_176840 Osbpl11 Oxysterol binding protein-like 11 Lipid metabolism Down, 0.47 0.128 NM_022415 Ptges Prostaglandin e synthase Fatty acid metabolism Down, 0.45 0.111
NM_008512 Lrp1 Low density lipoprotein receptor-related protein 1
Lipid metabolism Up, 0.51 0.085
NM_013873 Sult4a1 Sulfotransferase family 4a, member 1 Lipid metabolism Up, 0.41 0.099 NM_007453 Prdx6 Peroxiredoxin 6 Protection against oxidative injury, redox
regulation Down, 0.55 0.067
AK035028 Fat3 Fat tumor suppressor homolog 3 Inhibit lipogenesis Up, 0.45 0.114 Differentially expressed genes associated with transporter proteins NM_009674 Anxa7 Annexin a7 Calcium/phospholipid-binding protein involved in
exocytosis Down, 0.52 0.064
NM_008063 Slc37a4 Solute carrier family 37, member 4 Carbohydrate transport and metabolism Down, 0.61 0.068 NM_007830 Dbi Diazepam binding inhibitor Intracellular carrier of acyl-CoA esters. Down, 0.62 0.146 NM_009034 Rbp2 Retinol binding protein 2, cellular Intracellular transport of retinol Down, 0.40 0.089 U95131 Slc10a1 solute carrier family 10 (sodium/bile acid
cotransporter family), member 1 Bile acid transporter Down, 0.44 0.144
NM_011706 Trpv2 transient receptor potential cation channel, subfamily v, member 2
Ion transporter Down, 0.49 0.073
NM_025468 Sec11l3 Sec11-like 3 Protein export Down, 0.48 0.008 NM_181422 Pkd2l1 polycystic kidney disease 2-like 1 Ion transport Up, 0.58 0.134 AK051433 Fkbp4 fk506 binding protein 4 Intracellular trafficking of steroid hormone
receptors Up, 0.45 0.107
NM_010295 Gclc Glutamate-cysteine ligase, catalytic subunit Free radical scavenger, rate-limiting enzyme in GSH synthesis
Up, 0.43 0.110
NM_145146 Afm Afamin precursor Glycoprotein transport Down, 0.67 0.064
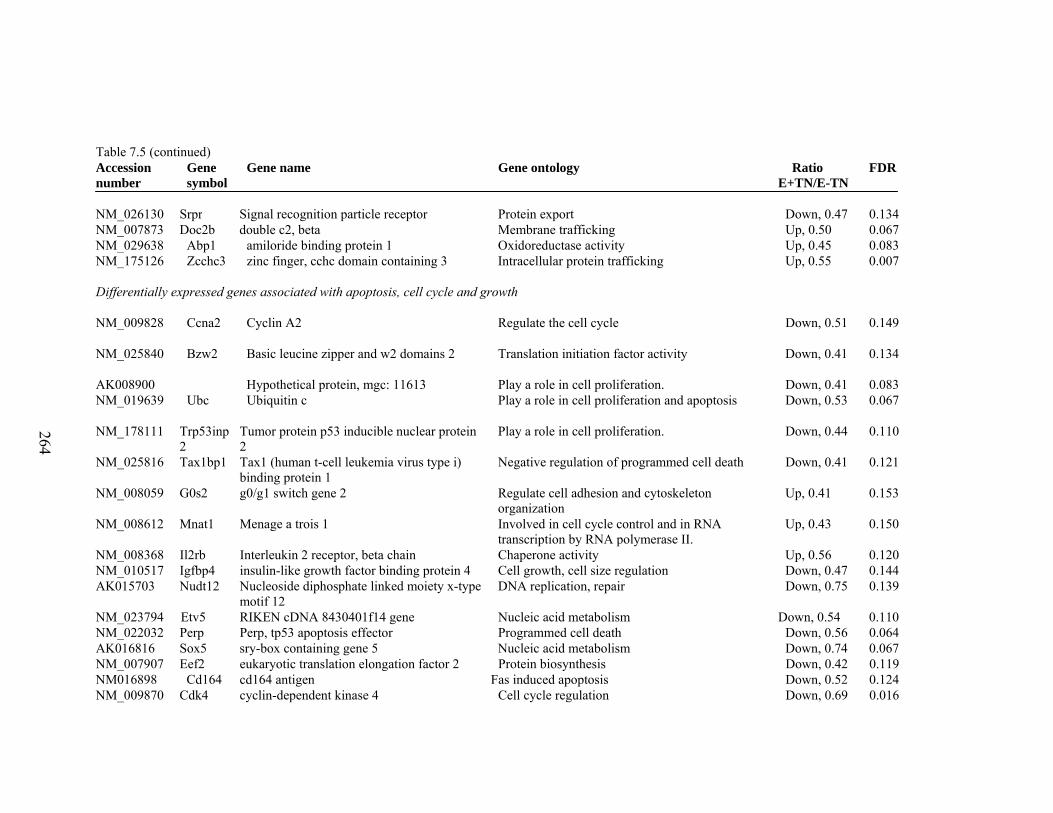
264
Table 7.5 (continued) Accession number
Gene symbol
Gene name Gene ontology Ratio E+TN/E-TN
FDR
NM_026130 Srpr Signal recognition particle receptor Protein export Down, 0.47 0.134 NM_007873 Doc2b double c2, beta Membrane trafficking Up, 0.50 0.067 NM_029638 Abp1 amiloride binding protein 1 Oxidoreductase activity Up, 0.45 0.083 NM_175126 Zcchc3 zinc finger, cchc domain containing 3 Intracellular protein trafficking Up, 0.55 0.007 Differentially expressed genes associated with apoptosis, cell cycle and growth NM_009828 Ccna2 Cyclin A2 Regulate the cell cycle Down, 0.51 0.149
NM_025840 Bzw2 Basic leucine zipper and w2 domains 2 Translation initiation factor activity
Down, 0.41 0.134
AK008900 Hypothetical protein, mgc: 11613 Play a role in cell proliferation. Down, 0.41 0.083 NM_019639 Ubc Ubiquitin c
Play a role in cell proliferation and apoptosis Down, 0.53 0.067
NM_178111 Trp53inp2
Tumor protein p53 inducible nuclear protein 2
Play a role in cell proliferation. Down, 0.44 0.110
NM_025816 Tax1bp1 Tax1 (human t-cell leukemia virus type i) binding protein 1
Negative regulation of programmed cell death Down, 0.41 0.121
NM_008059 G0s2 g0/g1 switch gene 2
Regulate cell adhesion and cytoskeleton organization
Up, 0.41 0.153
NM_008612 Mnat1 Menage a trois 1 Involved in cell cycle control and in RNA transcription by RNA polymerase II.
Up, 0.43 0.150
NM_008368 Il2rb Interleukin 2 receptor, beta chain Chaperone activity Up, 0.56 0.120 NM_010517 Igfbp4 insulin-like growth factor binding protein 4 Cell growth, cell size regulation Down, 0.47 0.144 AK015703 Nudt12 Nucleoside diphosphate linked moiety x-type
motif 12 DNA replication, repair Down, 0.75 0.139
NM_023794 Etv5 RIKEN cDNA 8430401f14 gene Nucleic acid metabolism Down, 0.54 0.110 NM_022032 Perp Perp, tp53 apoptosis effector Programmed cell death Down, 0.56 0.064 AK016816 Sox5 sry-box containing gene 5 Nucleic acid metabolism Down, 0.74 0.067 NM_007907 Eef2 eukaryotic translation elongation factor 2 Protein biosynthesis Down, 0.42 0.119 NM016898 Cd164 cd164 antigen Fas induced apoptosis Down, 0.52 0.124 NM_009870 Cdk4 cyclin-dependent kinase 4 Cell cycle regulation Down, 0.69 0.016
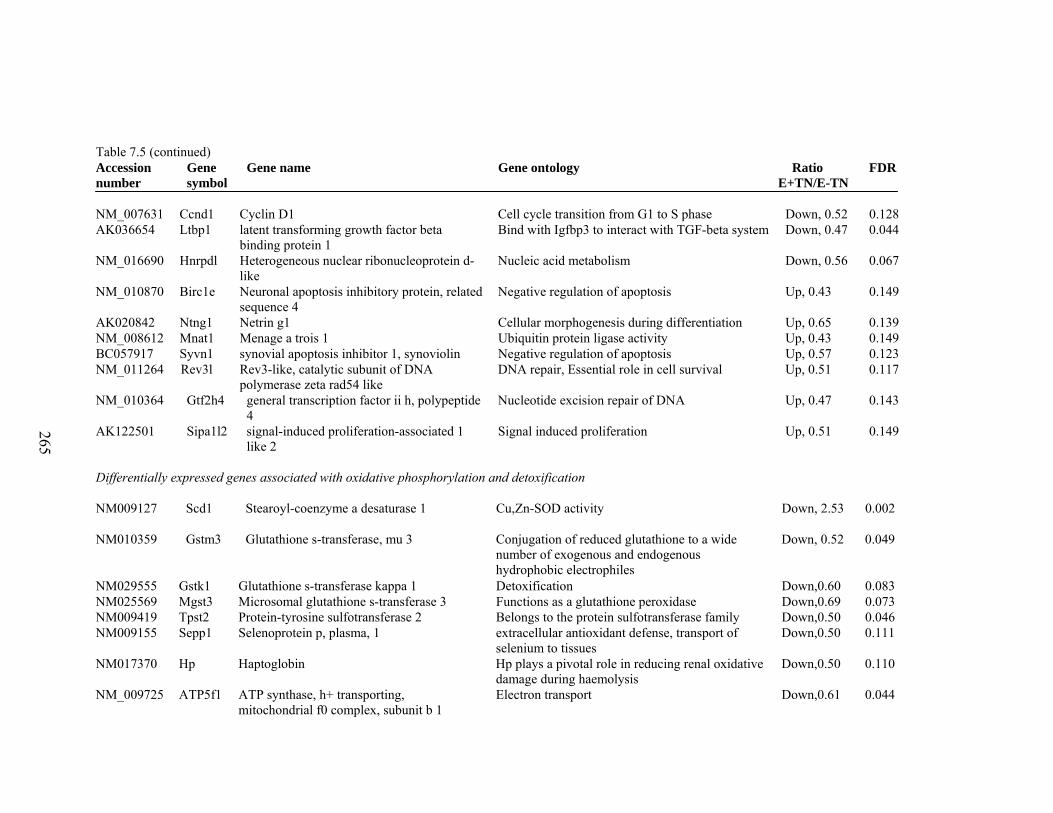
265
Table 7.5 (continued) Accession number
Gene symbol
Gene name Gene ontology Ratio E+TN/E-TN
FDR
NM_007631 Ccnd1 Cyclin D1 Cell cycle transition from G1 to S phase Down, 0.52 0.128 AK036654 Ltbp1 latent transforming growth factor beta
binding protein 1 Bind with Igfbp3 to interact with TGF-beta system Down, 0.47 0.044
NM_016690 Hnrpdl Heterogeneous nuclear ribonucleoprotein d-like
Nucleic acid metabolism Down, 0.56 0.067
NM_010870 Birc1e Neuronal apoptosis inhibitory protein, related sequence 4
Negative regulation of apoptosis Up, 0.43 0.149
AK020842 Ntng1 Netrin g1 Cellular morphogenesis during differentiation Up, 0.65 0.139 NM_008612 Mnat1 Menage a trois 1 Ubiquitin protein ligase activity Up, 0.43 0.149 BC057917 Syvn1 synovial apoptosis inhibitor 1, synoviolin Negative regulation of apoptosis Up, 0.57 0.123 NM_011264 Rev3l Rev3-like, catalytic subunit of DNA
polymerase zeta rad54 like DNA repair, Essential role in cell survival Up, 0.51 0.117
NM_010364 Gtf2h4 general transcription factor ii h, polypeptide 4
Nucleotide excision repair of DNA Up, 0.47 0.143
AK122501 Sipa1l2 signal-induced proliferation-associated 1 like 2
Signal induced proliferation Up, 0.51 0.149
Differentially expressed genes associated with oxidative phosphorylation and detoxification NM009127 Scd1 Stearoyl-coenzyme a desaturase 1 Cu,Zn-SOD activity Down, 2.53 0.002
NM010359 Gstm3 Glutathione s-transferase, mu 3 Conjugation of reduced glutathione to a wide number of exogenous and endogenous hydrophobic electrophiles
Down, 0.52 0.049
NM029555 Gstk1 Glutathione s-transferase kappa 1 Detoxification Down,0.60 0.083 NM025569 Mgst3 Microsomal glutathione s-transferase 3 Functions as a glutathione peroxidase Down,0.69 0.073 NM009419 Tpst2 Protein-tyrosine sulfotransferase 2 Belongs to the protein sulfotransferase family Down,0.50 0.046 NM009155 Sepp1 Selenoprotein p, plasma, 1 extracellular antioxidant defense, transport of
selenium to tissues Down,0.50 0.111
NM017370 Hp Haptoglobin Hp plays a pivotal role in reducing renal oxidative damage during haemolysis
Down,0.50 0.110
NM_009725 ATP5f1 ATP synthase, h+ transporting, mitochondrial f0 complex, subunit b 1
Electron transport Down,0.61 0.044
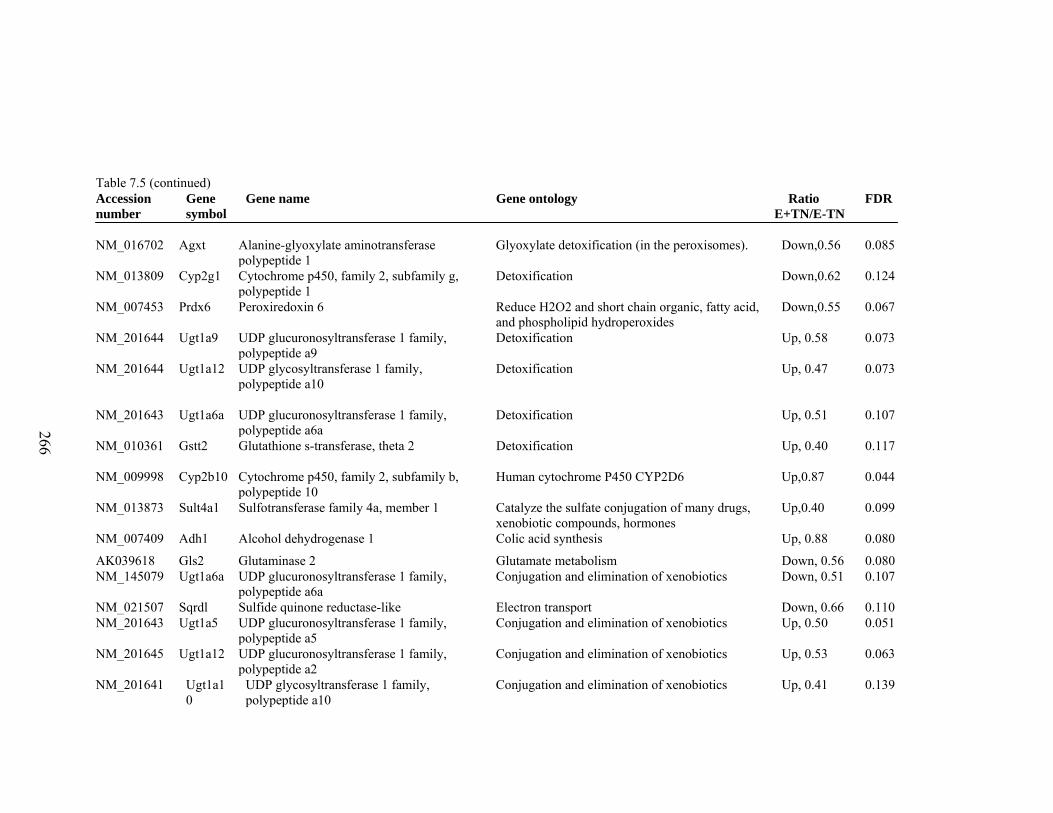
266
Table 7.5 (continued)
Accession number
Gene symbol
Gene name Gene ontology Ratio E+TN/E-TN
FDR
NM_016702 Agxt Alanine-glyoxylate aminotransferase
polypeptide 1 Glyoxylate detoxification (in the peroxisomes).
Down,0.56 0.085
NM_013809 Cyp2g1 Cytochrome p450, family 2, subfamily g, polypeptide 1
Detoxification Down,0.62 0.124
NM_007453 Prdx6 Peroxiredoxin 6 Reduce H2O2 and short chain organic, fatty acid, and phospholipid hydroperoxides
Down,0.55 0.067
NM_201644 Ugt1a9 UDP glucuronosyltransferase 1 family, polypeptide a9
Detoxification Up, 0.58 0.073
NM_201644 Ugt1a12 UDP glycosyltransferase 1 family, polypeptide a10
Detoxification Up, 0.47 0.073
NM_201643 Ugt1a6a UDP glucuronosyltransferase 1 family, polypeptide a6a
Detoxification Up, 0.51 0.107
NM_010361 Gstt2 Glutathione s-transferase, theta 2 Detoxification Up, 0.40 0.117
NM_009998 Cyp2b10 Cytochrome p450, family 2, subfamily b, polypeptide 10
Human cytochrome P450 CYP2D6
Up,0.87 0.044
NM_013873 Sult4a1 Sulfotransferase family 4a, member 1 Catalyze the sulfate conjugation of many drugs, xenobiotic compounds, hormones
Up,0.40 0.099
NM_007409 Adh1 Alcohol dehydrogenase 1 Colic acid synthesis Up, 0.88 0.080
AK039618 Gls2 Glutaminase 2 Glutamate metabolism Down, 0.56 0.080 NM_145079 Ugt1a6a UDP glucuronosyltransferase 1 family,
polypeptide a6a Conjugation and elimination of xenobiotics Down, 0.51 0.107
NM_021507 Sqrdl Sulfide quinone reductase-like Electron transport Down, 0.66 0.110 NM_201643 Ugt1a5 UDP glucuronosyltransferase 1 family,
polypeptide a5 Conjugation and elimination of xenobiotics Up, 0.50 0.051
NM_201645 Ugt1a12 UDP glucuronosyltransferase 1 family, polypeptide a2
Conjugation and elimination of xenobiotics Up, 0.53 0.063
NM_201641 Ugt1a10
UDP glycosyltransferase 1 family, polypeptide a10
Conjugation and elimination of xenobiotics Up, 0.41 0.139
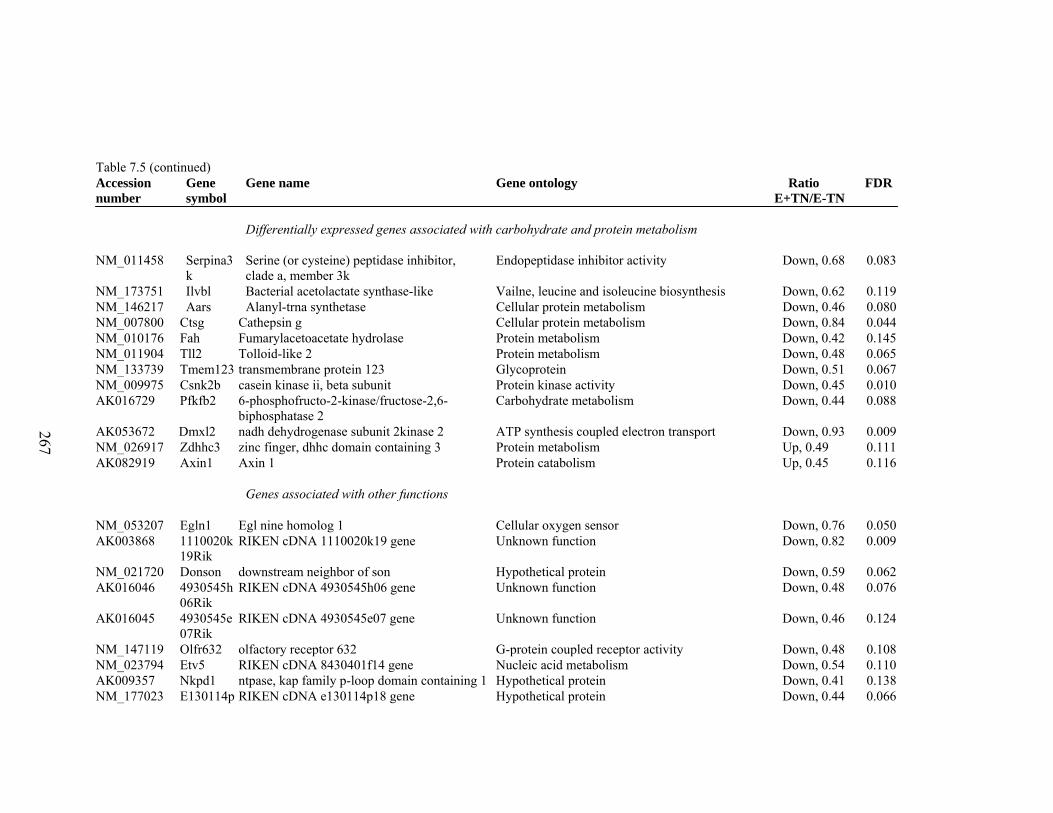
267
Table 7.5 (continued)
Accession number
Gene symbol
Gene name Gene ontology Ratio E+TN/E-TN
FDR
Differentially expressed genes associated with carbohydrate and protein metabolism
NM_011458 Serpina3k
Serine (or cysteine) peptidase inhibitor, clade a, member 3k
Endopeptidase inhibitor activity Down, 0.68 0.083
NM_173751 Ilvbl Bacterial acetolactate synthase-like Vailne, leucine and isoleucine biosynthesis Down, 0.62 0.119 NM_146217 Aars Alanyl-trna synthetase Cellular protein metabolism Down, 0.46 0.080 NM_007800 Ctsg Cathepsin g Cellular protein metabolism Down, 0.84 0.044 NM_010176 Fah Fumarylacetoacetate hydrolase Protein metabolism Down, 0.42 0.145 NM_011904 Tll2 Tolloid-like 2 Protein metabolism Down, 0.48 0.065 NM_133739 Tmem123 transmembrane protein 123 Glycoprotein Down, 0.51 0.067 NM_009975 Csnk2b casein kinase ii, beta subunit Protein kinase activity Down, 0.45 0.010 AK016729 Pfkfb2 6-phosphofructo-2-kinase/fructose-2,6-
biphosphatase 2 Carbohydrate metabolism Down, 0.44 0.088
AK053672 Dmxl2 nadh dehydrogenase subunit 2kinase 2 ATP synthesis coupled electron transport Down, 0.93 0.009 NM_026917 Zdhhc3 zinc finger, dhhc domain containing 3 Protein metabolism Up, 0.49 0.111 AK082919 Axin1 Axin 1 Protein catabolism Up, 0.45 0.116 Genes associated with other functions NM_053207 Egln1 Egl nine homolog 1 Cellular oxygen sensor Down, 0.76 0.050 AK003868 1110020k
19Rik RIKEN cDNA 1110020k19 gene Unknown function Down, 0.82 0.009
NM_021720 Donson downstream neighbor of son Hypothetical protein Down, 0.59 0.062 AK016046 4930545h
06Rik RIKEN cDNA 4930545h06 gene Unknown function Down, 0.48 0.076
AK016045 4930545e07Rik
RIKEN cDNA 4930545e07 gene Unknown function Down, 0.46 0.124
NM_147119 Olfr632 olfactory receptor 632 G-protein coupled receptor activity Down, 0.48 0.108 NM_023794 Etv5 RIKEN cDNA 8430401f14 gene Nucleic acid metabolism Down, 0.54 0.110 AK009357 Nkpd1 ntpase, kap family p-loop domain containing 1 Hypothetical protein Down, 0.41 0.138 NM_177023 E130114p RIKEN cDNA e130114p18 gene Hypothetical protein Down, 0.44 0.066
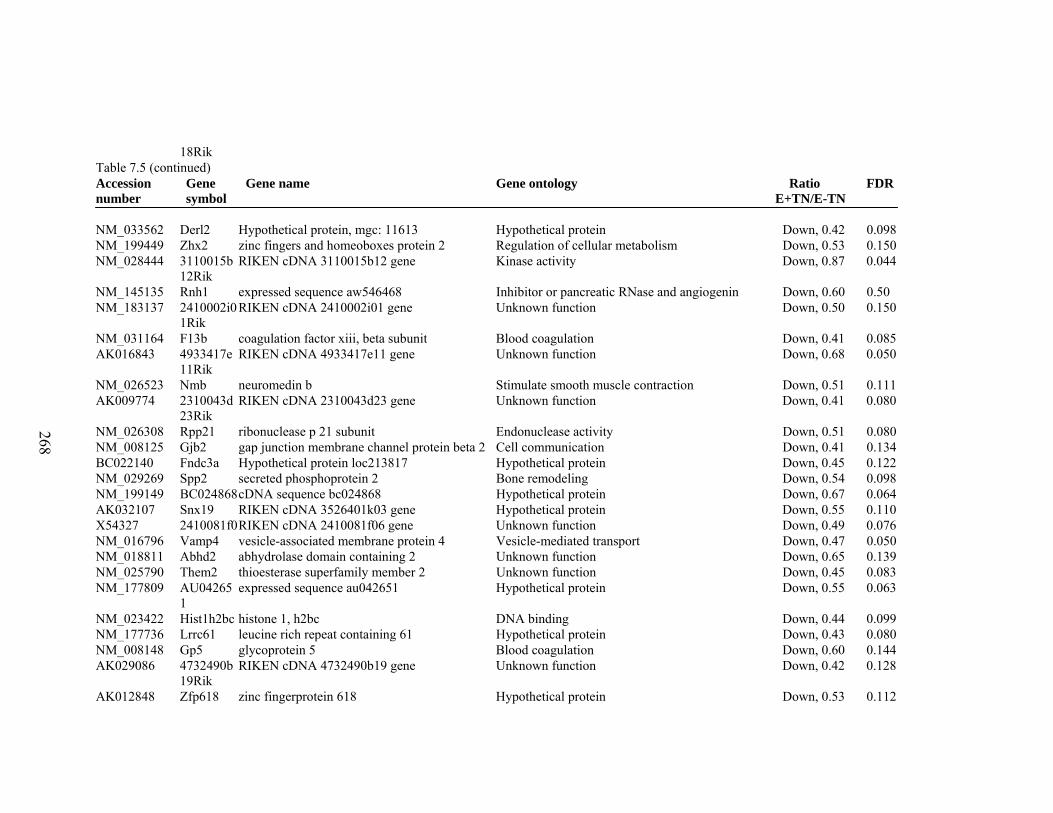
268
18Rik Table 7.5 (continued) Accession number
Gene symbol
Gene name Gene ontology Ratio E+TN/E-TN
FDR
NM_033562 Derl2 Hypothetical protein, mgc: 11613 Hypothetical protein Down, 0.42 0.098 NM_199449 Zhx2 zinc fingers and homeoboxes protein 2 Regulation of cellular metabolism Down, 0.53 0.150 NM_028444 3110015b
12Rik RIKEN cDNA 3110015b12 gene Kinase activity Down, 0.87 0.044
NM_145135 Rnh1 expressed sequence aw546468 Inhibitor or pancreatic RNase and angiogenin Down, 0.60 0.50 NM_183137 2410002i0
1Rik RIKEN cDNA 2410002i01 gene Unknown function Down, 0.50 0.150
NM_031164 F13b coagulation factor xiii, beta subunit Blood coagulation Down, 0.41 0.085 AK016843 4933417e
11Rik RIKEN cDNA 4933417e11 gene Unknown function Down, 0.68 0.050
NM_026523 Nmb neuromedin b Stimulate smooth muscle contraction Down, 0.51 0.111 AK009774 2310043d
23Rik RIKEN cDNA 2310043d23 gene Unknown function Down, 0.41 0.080
NM_026308 Rpp21 ribonuclease p 21 subunit Endonuclease activity Down, 0.51 0.080 NM_008125 Gjb2 gap junction membrane channel protein beta 2 Cell communication Down, 0.41 0.134 BC022140 Fndc3a Hypothetical protein loc213817 Hypothetical protein Down, 0.45 0.122 NM_029269 Spp2 secreted phosphoprotein 2 Bone remodeling Down, 0.54 0.098 NM_199149 BC024868 cDNA sequence bc024868 Hypothetical protein Down, 0.67 0.064 AK032107 Snx19 RIKEN cDNA 3526401k03 gene Hypothetical protein Down, 0.55 0.110 X54327 2410081f0 RIKEN cDNA 2410081f06 gene Unknown function Down, 0.49 0.076 NM_016796 Vamp4 vesicle-associated membrane protein 4 Vesicle-mediated transport Down, 0.47 0.050 NM_018811 Abhd2 abhydrolase domain containing 2 Unknown function Down, 0.65 0.139 NM_025790 Them2 thioesterase superfamily member 2 Unknown function Down, 0.45 0.083 NM_177809 AU04265
1 expressed sequence au042651 Hypothetical protein Down, 0.55 0.063
NM_023422 Hist1h2bc histone 1, h2bc DNA binding Down, 0.44 0.099 NM_177736 Lrrc61 leucine rich repeat containing 61 Hypothetical protein Down, 0.43 0.080 NM_008148 Gp5 glycoprotein 5 Blood coagulation Down, 0.60 0.144 AK029086 4732490b
19Rik RIKEN cDNA 4732490b19 gene Unknown function Down, 0.42 0.128
AK012848 Zfp618 zinc fingerprotein 618 Hypothetical protein Down, 0.53 0.112
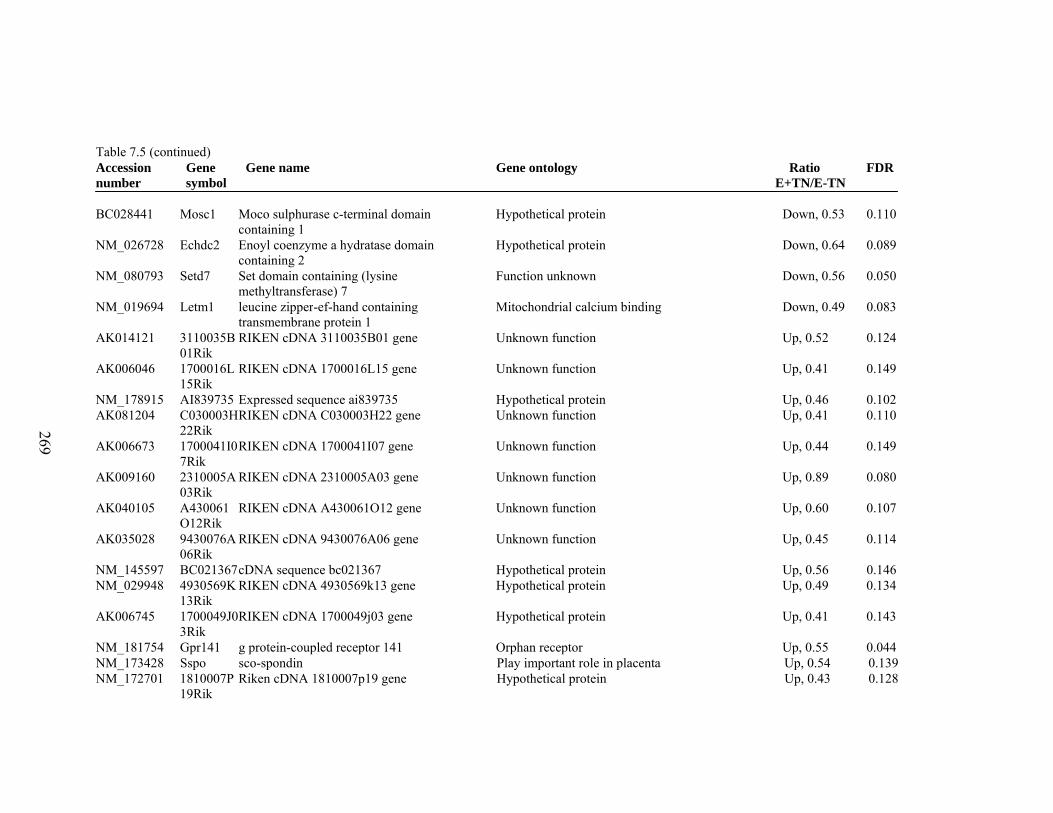
269
Table 7.5 (continued) Accession number
Gene symbol
Gene name Gene ontology Ratio E+TN/E-TN
FDR
BC028441 Mosc1 Moco sulphurase c-terminal domain
containing 1 Hypothetical protein Down, 0.53 0.110
NM_026728 Echdc2 Enoyl coenzyme a hydratase domain containing 2
Hypothetical protein Down, 0.64 0.089
NM_080793 Setd7 Set domain containing (lysine methyltransferase) 7
Function unknown Down, 0.56 0.050
NM_019694 Letm1 leucine zipper-ef-hand containing transmembrane protein 1
Mitochondrial calcium binding Down, 0.49 0.083
AK014121 3110035B01Rik
RIKEN cDNA 3110035B01 gene Unknown function Up, 0.52 0.124
AK006046 1700016L15Rik
RIKEN cDNA 1700016L15 gene Unknown function Up, 0.41 0.149
NM_178915 AI839735 Expressed sequence ai839735 Hypothetical protein Up, 0.46 0.102 AK081204 C030003H
22Rik RIKEN cDNA C030003H22 gene Unknown function Up, 0.41 0.110
AK006673 1700041I07Rik
RIKEN cDNA 1700041I07 gene Unknown function Up, 0.44 0.149
AK009160 2310005A03Rik
RIKEN cDNA 2310005A03 gene Unknown function Up, 0.89 0.080
AK040105 A430061O12Rik
RIKEN cDNA A430061O12 gene Unknown function Up, 0.60 0.107
AK035028 9430076A06Rik
RIKEN cDNA 9430076A06 gene Unknown function Up, 0.45 0.114
NM_145597 BC021367 cDNA sequence bc021367 Hypothetical protein Up, 0.56 0.146 NM_029948 4930569K
13Rik RIKEN cDNA 4930569k13 gene Hypothetical protein Up, 0.49 0.134
AK006745 1700049J03Rik
RIKEN cDNA 1700049j03 gene Hypothetical protein Up, 0.41 0.143
NM_181754 Gpr141 g protein-coupled receptor 141 Orphan receptor Up, 0.55 0.044 NM_173428 Sspo sco-spondin Play important role in placenta Up, 0.54 0.139 NM_172701 1810007P
19Rik Riken cDNA 1810007p19 gene Hypothetical protein Up, 0.43 0.128
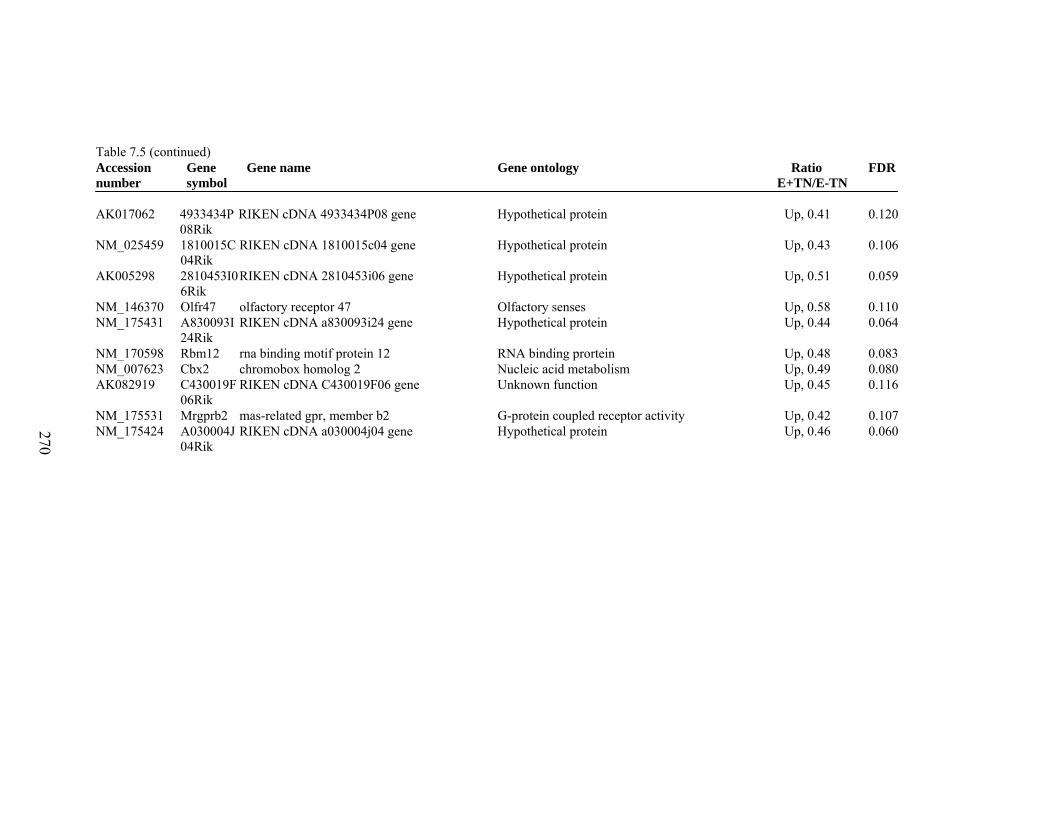
270
Table 7.5 (continued) Accession number
Gene symbol
Gene name Gene ontology Ratio E+TN/E-TN
FDR
AK017062 4933434P
08Rik RIKEN cDNA 4933434P08 gene Hypothetical protein Up, 0.41 0.120
NM_025459 1810015C04Rik
RIKEN cDNA 1810015c04 gene Hypothetical protein Up, 0.43 0.106
AK005298 2810453I06Rik
RIKEN cDNA 2810453i06 gene Hypothetical protein Up, 0.51 0.059
NM_146370 Olfr47 olfactory receptor 47 Olfactory senses Up, 0.58 0.110 NM_175431 A830093I
24Rik RIKEN cDNA a830093i24 gene Hypothetical protein Up, 0.44 0.064
NM_170598 Rbm12 rna binding motif protein 12 RNA binding prortein Up, 0.48 0.083 NM_007623 Cbx2 chromobox homolog 2 Nucleic acid metabolism Up, 0.49 0.080 AK082919 C430019F
06Rik RIKEN cDNA C430019F06 gene Unknown function Up, 0.45 0.116
NM_175531 Mrgprb2 mas-related gpr, member b2 G-protein coupled receptor activity Up, 0.42 0.107 NM_175424 A030004J
04Rik RIKEN cDNA a030004j04 gene Hypothetical protein Up, 0.46 0.060
271
CHAPTER VIII
SUMMARY
The objective of the present studies was to determine the temporal effects of E+
diet, HS or their combination on physiological and genomic parameters. It is well known
that HS alters the gene expression of animals, with the level of response depending on
severity of HS and duration of exposure. It was hypothesized that E+ diet would alter the
hepatic gene expression and its response would be more severe under HS compared to
TN conditions. Furthermore, it was speculated that the genomic responses to E+ diet
would be different between short- and long-term exposures, with greater adaptation
occurring under long-term TN than under HS conditions.
The collection of studies reported in this thesis were designed to determine the
effects of a diet containing ground endophyte-infected seed on hepatic gene expression in
different thermal environments, that included thermoneutral and both short- and long-
term heat stress conditions. The temporal nature of these reponses was of great interest, in
terms of adaptation to heat stress and fescue toxicosis. Measurements concentrated on
shifts in thermoregulatory ability, blood parameters known to be affected by fescue
toxicosis, hepatic gene expression, hepatic cytochrome P450 isoforms, and antioxidants.
Initially, the temporal effects of E+ diet on rat physiological parameters were
evaluated under TN conditions during short (five days)- and long (26 days)-term
exposures. Core temperature and general activity did not change significantly due to E+
272
diet during both exposures. In contrast, feed intake and FCE of E+ rats decreased within
the first 24 hours of E+ diet intake, during short- and long-term exposures but the values
returned to pre-treatment level by Days 9 and 5, respectively. Similarly, BW was
decreased on Day 1 of treatment but exhibited partial recovery by the end of the long-
term study, when the values were above pre-treatment level. Glucose, urea nitrogen,
cholesterol, and ALP in the serum, and wet liver weight corrected to body weight were
decreased in E+ rats during short-term treatment, but by the end of the long-term study
the values returned to E- level to suggest adaptation.
The temporal effects of HS were evaluated in E- and E+ rats during short (3
days)- and long-term (21 days) exposures. Hyperthermia resulted from heat exposure,
but was returned to pre-heat level in both E- and E+ rats by Days 8 and 13 respectively,
suggesting adaptation of both groups to HS. Heat stress decreased activity count, as well
as FCE, in both groups but E- and E+ rats exhibited complete recovery by Days 7 and 8
respectively. Feed intake was decreased within the first 24 hours of HS exposure;
although partial recovery of feed intake occurred in both groups, the values never reached
pre-heat level. Also, feed intake of E+ rats was always lower than for E- rats. Similarly,
both E- and E+ rats exhibited partial recovery in body weight; however, the growth rate
was similar between E- and E+ rats at the end of long-term heat exposure suggesting
adaptation of E+ rats to HS. Serum glucose levels were decreased in E+ rats during short-
term treatment, but recovered completely during long-term heat exposure suggesting
adaptation of E+ rats to long-term HS. However, serum cholesterol and ALP did not
change during short-term HS but decreased during long-term HS suggesting deleterious
effects of long-term HS. Though HS increased serum prolactin levels in both groups, the
273
values were always decreased in E+ compared to E- rats. These results suggest that rats
exposed to one stressor (E+ or heat) exhibited greater adaptation than those
simultaneously exposed to both stressors, suggesting a greater shift from normalcy with
multiple stressors.
Genomic effects of E+ diet was evaluated in rat liver at the end of two time
points, i.e., short- (5 days) and long-term (26 days) TN conditions. The E+ diet intake
increased the gene expression of various CYPs during short-, but not long-term exposure
possibly because the rats during the long-term exposure were adapted to the toxicants.
However, gene expression of antioxidant enzymes was down-regulated during both
periods, making the rats susceptible to oxidative stress. Genes associated with immune
response were down-regulated during short-term E+ diet intake but long-term E+ intake
increased the gene expression of immune response and decreased the expression of pro-
inflammatory cytokines, which once again could be an adaptive mechanism seen in E+
rats during long-term TN exposures. Similarly, cholesterol biosynthesizing genes were
down-regulated during short-term but increased during long-term E+ intake. These
results agree with serum cholesterol levels of E+ rats during short- and long-term E+
intake under TN conditions. Apoptotic gene expression was up-regulated and heat shock
protein, cell proliferation genes and DNA repair gene expressions were down-regulated
in E+ rats during both short and long-term E+ intake. Down-regulation of these genes
would decrease the E+ rat’s ability to repair DNA damage, resulting in cell apoptosis.
Similarly, genes associated with ATP synthesis, carbohydrate and protein metabolism
were down-regulated in both exposures, because of which, E+ rats may not efficiently
utilize the nutrient energy, and is reflected by reduced growth rate. Short-term E+ intake
274
up-regulated genes coding for gluconeogenesis and protein catabolism, which help the
rats to maintain appropriate glucose levels for vital functions and this could be an
adaptive response to decreased caloric intake during this period. However, long-term E+
intake did not result in such gene expression reflecting the complete recovery observed in
feed intake by the end of the long-term study. It is likely that the reduced antioxidant
activity predisposed E+ rats to hepatic oxidative stress, and suppressed immune and
chaperone activities of these animals make them further susceptible to other stressors
even at TN.
Gene expression of CYP isoform was up-regulated during short-term HS but not
during long-term. This result is similar to the observations made at TN. Expression of
antioxidant genes were decreased in E+ rats during short-term treatment but recovered
completely during long-term heat exposure suggesting partial adaptation of E+ rats to
heat stress. However, antioxidant levels of these rats remained decreased compared to E-
rats under TN conditions suggesting oxidative stress in E+ rats at HS and these findings
are similar to the observed results in E+ cattle at HS.
Immune responsive genes were not affected during short-term HS but were down-
regulated in E+ rats under long-term HS suggesting the deleterious effects of long-term
heat exposure and these results are in agreement with the observations reported in E+
cattle at HS.
The E+ diet intake under short- and long-term HS decreased genes associated
with cell proliferation, antioxidants, fatty acid and cholesterol metabolism compared to
E+ rats under TN conditions. Short-term E+ intake during HS decreased genes coding for
immune responsive, CYPs and heat shock proteins, but during long-term HS exposures
275
these genes were up-regulated compared to E+ rats under TN conditions. Furthermore,
E+ intake under short-term HS up-regulated apoptosis genes and down-regulated ATP
synthesis genes compared to E+ rat under TN conditions; however such changes in gene
expression were absent during long-term HS exposures suggesting adaptation of E+ rats
to long-term HS. Previous results suggested that intake of an E+ diet at TN conditions
up-regulated genes associated with CYPs but decreased genes coding for chaperones,
antioxidants, and immune responsiveness. The present comparison revealed that added
effects of short-term HS on E+ intake further impaired the animal’s defense mechanism
beyond the effect at TN, thereby making the animal more susceptible to various stressors.
However long-term E+ intake improved animal’s immune, CYP and chaperone functions
suggesting signs of adaptation to HS and E+ diet.
Finally, the combination of long-term E+ and HS down-regulated immune
responsive genes compared to E- rats under TN conditions. This result suggests that HS
contributed to the decreased immune response here because E+ diet under long-term TN
conditions up-regulated immune responsive genes compared to the same E- rats at TN.
Genes coding for antioxidants were down-regulated as a result of E+ intake, with an even
greater reduction with HS, resulting in gretear oxidative stress at HS. Detoxification
genes were up-regulated in E+ rats as a result of long-term E+ intake and this could be an
adaptive mechanism to metabolize E+ toxicants. Apoptotic gene expression was down-
regulated in E+ rats at HS and these results are in contrast to what was observed under
TN conditions. The possible reason for this unexpected result could be up-regulation of
genes coding for chaperones, DNA repair and cell survival mechanisms along with
detoxification in long-term E+ rats under HS conditions. Down-regulation of genes
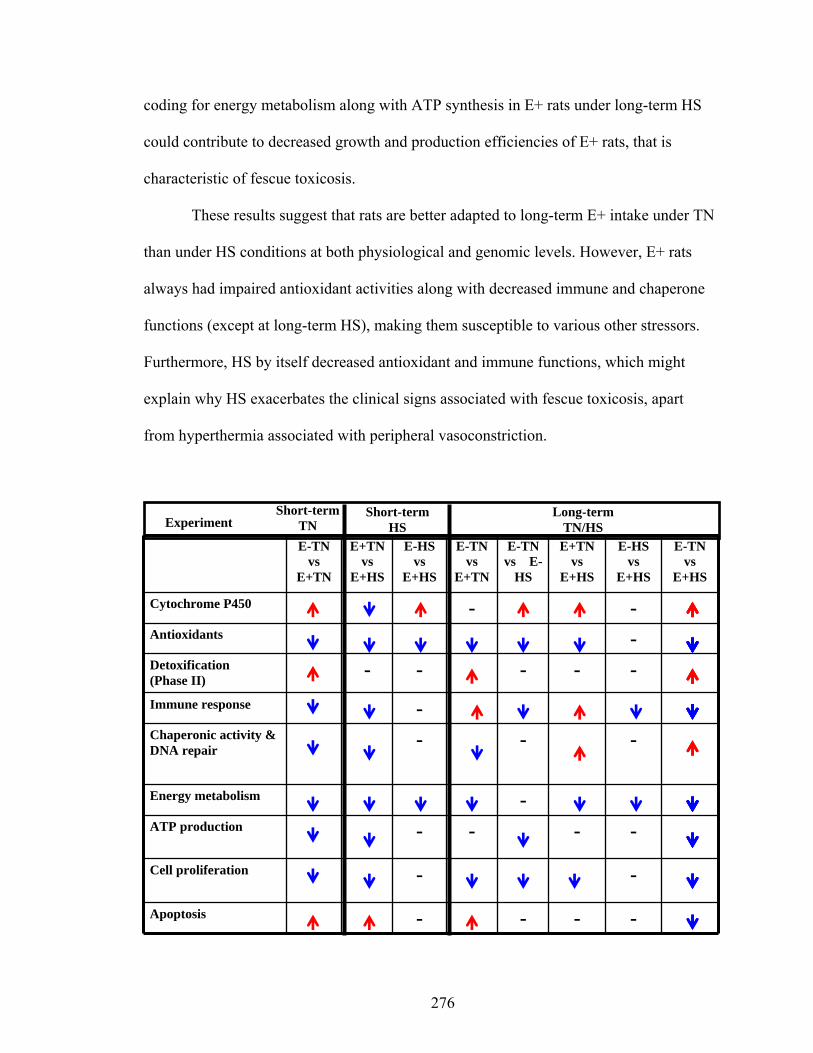
276
coding for energy metabolism along with ATP synthesis in E+ rats under long-term HS
could contribute to decreased growth and production efficiencies of E+ rats, that is
characteristic of fescue toxicosis.
These results suggest that rats are better adapted to long-term E+ intake under TN
than under HS conditions at both physiological and genomic levels. However, E+ rats
always had impaired antioxidant activities along with decreased immune and chaperone
functions (except at long-term HS), making them susceptible to various other stressors.
Furthermore, HS by itself decreased antioxidant and immune functions, which might
explain why HS exacerbates the clinical signs associated with fescue toxicosis, apart
from hyperthermia associated with peripheral vasoconstriction.
E-TN vs
E+TN
E+TN vs
E+HS
E-HS vs
E+HS
E-TN vs
E+TN
E-TN vs E-
HS
E+TN vs
E+HS
E-HS vs
E+HS
E-TN vs
E+HS
Cytochrome P450 - -
Antioxidants -
Detoxification (Phase II)
- - - - -
Immune response -
Chaperonic activity & DNA repair
- - -
Energy metabolism -
ATP production - - - -
Cell proliferation
- -
Apoptosis - - - -
Short-term TN
Short-term HS
Long-term TN/HS Experiment
277
LITERATURE CITED
Abeni, F., L. Calamari, and L. Stefanini. 2007. Metabolic conditions of lactating Friesian cows during the hot season in the Po valley. 1. Blood indicators of heat stress. Int. J. Biometeorol. (Epub ahead of print)
Afshari, C. A., E. F. Nuwaysir, and J. C. Barrett. 1999. Application of complementary
DNA microarray technology to carcinogen identification, toxicology and drug safety evaluation. Cancer Res. 59:4759-4760.
Aiken, G. E., M. L. Looper, S. F. Tabler, D. K. Brauer, J. R. Strickland, and F. N.
Schrick. 2006. Influence of stocking rate and steroidal implants on growth rate of steers grazing toxic tall fescue and subsequent physiological responses. J. Anim. Sci. 84: 1626-1632.
Aldrich, C.G., J. A. Paterson, J. L. Tate, and M. S. Kerley. 1993. The effects of
endophyte infected tall fescue consumption on diet utilization and thermal regulation in cattle. J. Anim. Sci.71: 164-170.
Aldrich-Markham, S., G. Pirelli, and A. M. Craig. 2003. Endophyte toxins in grass seed
fields and straw; effects on livestock. Publication EM 8598. Report of Oregon State Univ. Ext. Serv., Corvallis, OR.
Al-Haidary, A., D. E. Spiers, G. E. Rottinghaus, G. B. Garner, and M. R. Ellersieck.
2001. Thermoregulatory ability of beef heifers following intake of endophyte-infected tall fescue during controlled heat challenge. J. Anim. Sci. 79: 1780-1788.
Allen, V. G., K. R. Pond, K. E. Sakers, J. P. Fontenot, C. P. Bagley, R. L. Ivy, R. R.
Evans, C. P. Brown, M. F. Miller, J. L. Montgomery, T. M. Dettle, and D. B. Wester. 2001. Tasco-forage: III. Influence of a seaweed extract on performance, monocyte immune cell response, and carcass characteristics in feedlot-finished steers. J. Anim. Sci. 79: 1032-1040.
Al-Tamimi, H. J., P. A. Eichen, G. E. Rottinghaus, and D. E. Spiers. 2007. Nitric oxide
supplementation alleviates hyperthermia induced by intake of ergopeptine alkaloids during chronic heat stress. J. Thermal Biology 32: 179-187.
Althus, M., A. Retzow, J. V. Castell, M. J. Gomex-Lechon, Z. Amalou, T. Rose, and K.
Appel. 2000. In vitro identification of the cytcrhome P450 isoform responsible for the metabolism of alpha-dihydroergocryptine. Xenobiotica 30: 1033-1045.
278
Andrew, A. S., A. J. Warren, A. Barchowsky, K. A. Temple, L. Klei, and N. V. Soucy. 2003. Genomic and proteomic profiling of responses to toxic metals in human lung cells. Environ. Health Perspect. 111: 825-835.
Alvarez, M. B. and H. D. Johnson. 1973. Environmental heat exposure on cattle plasma
catecholamine and glucocorticoids. J. Dairy Sci. 56: 189-198. Aravind, L., and E. V. Koonin. 2001. The DNA-repair protein AlkB, EGL-9, and
leprecan define new families of 2-oxoglutarate- and iron-dependent dioxygenases. Genome Biol. 2: 60-71.
Arechiga, C. F., S. Vazquez-Flores, O. Ortiz, J. Hemandez-Ceron, A. Porras, L. R.
McDowell, and P. J. Hansen. 1998. Effect of injection of beta-carotene or vitamin E and selenium on fertility of lactating dairy cows. Theriogenology 50: 65-76.
Areli, A. and A. Chinnet. 1986. Thyroid status and noradrenaline-induced regulatory
thermogenesis in heat acclimated rats. Horm. Metab. Res. 18: 103-106. Arner, E. S., M. Bjornstedt, and A. Holmgren. 1995. 1-Chloro-2,4-dinitrobenzene is an
irreversible inhibitor of human thioredoxin reductase. Loss of thioredoxin disulfide reductase activity is accompanied by a large increase in NADPH oxidase activity. J. Biol. Chem. 270: 3479-3482.
Ashenburg, R. J. and D. A. Phillips. 1989. Ergotism as a consequence of thromboembolic
prophylaxis. Radiology 170: 375-376. Baccari, F., H. D. Johnson, and G. L. Hahn. 1983. Environmental heat effects on growth,
plasma T3 and postheat compensatory effects on Holstein calves. Proc. Soc. Exp. Biol. Med. 173: 312-318.
Baldi, P. and A. Long. 2001. A Bayesian framework for the analysis of microarray
expression data:regularized t-test and statistical inferences of gene changes. Bioinformatics 17: 509-519.
Ball, S. E., G. Maurer, M. Zollinger, M. Ladona, and A. E. M. Vickers. 1992.
Characterization of the cytochrome P450 gene family responsible for the N-dealkylation of the ergot alkaloid CQA 206-291 in humans. Drug Metab. Dispos. 20: 56-63.
Barrett, J. C. and E. S. Kawasaki. 2003. Microarrays: the use of oligonucleotides and
cDNA for the analysis of gene expression. Drug Discovery Today 8: 134-141.
279
Bauer, M., A. C. Hamm, M. Bonaus, A. Jacob, J. Jaekel, H. Schorle, M. J. Pankratz, and J. D. Katzenberger. 2004. Starvation response in mouse liver shows strong correlation with life-span-prolonging processes. Physiol. Genomics 17: 230-244.
Bednar I, G. Forsberg, A. Linden, G. A. Qureshi, and K. Sodersten. 1991. Involvement of
dopamine in inhibition of food intake by cholecystokinin octapeptide in male rats. J. Neuroendocrinol. 3: 491-496.
Bernabucci, U., B. Ronchi, N. Lacetera, and A. Nardone. 2002. Markers of oxidative
status in plasma and erythrocytes of transition dairy cows during hot season. J. Dairy Sci. 85: 2173-2179.
Bertilsson, G., J. Heidrich, K. Svensson, M. Asman, L. Jendeberg, M. Sydow-Backman,
R. Ohlsson, H. Postlind, P. Blomquist, and A. Berkenstam. 1998. Identification of a human nuclear receptor defines a new signaling pathway for CYP3A induction. Proc. Natl. Acad. Sci. 95: 12208-12213.
Bern, H. A. 1975. Prolactin and osmoregulation. Am. Zool. 15: 937-948. Bertilsson, L., J. A. Carrillo, M. L. Dahl, A. Llerena, C. Alm, U. Bondesson, L.
Lindstrom, I. Rodriguez de la Rubia, S. Ramos, and J. Benitez. 1994. Clozapine disposition covaries with CYP1A2 activity determined by a caffeine test. Br. J. Clin. Pharmacol. 38: 471-473.
Bhaskarannair, K., H. Kumar, and R. Kuttan. 2006. Inhibition of drug metabolizing
enzymes (Cytochrome P450) in vitro as well as in vivo by Phyllanthus amarus Schum & Thonn. Biol. Pharm. Bull. 29: 1310-1313.
Bhusari, S., L. B. Hearne, D. E. Spiers, W. R. Lamberson, and E. Antoniou. 2006.
Effects of fescue toxicosis on hepatic gene expression in mice. J. Anim. Sci. 84: 1600-1612.
Bhusari, S., Z. Liu, L. B. Hearne, D. E. Spiers, W. R. Lamberson, and E. Antoniou. 2007.
Expression profiling of heat stress effects on mice fed ergot alkaloids. Toxicol. Sci., 95: 89-97.
Bowles, D.K., C. L. Heaps, J. R. Turk, K. K. Maddali, and E. M. Price. 2004.
Hypercholesterolemia inhibits L-type calcium current in coronary macro-, not microcirculation. J. Appl. Phys. 96: 2240-2248.
Brazma, A., H. S. Parkinson, U. Sarkans, M. Shojatalab, J. Vilo, and N.
Abeygunawardena, 2003. ArrayExpress—a public repository for microarray gene exspression data at the EBI. Nucleic Acids Res. 31: 68-71.
280
Brosh, A., Y. Aharoni, A. A. Degen, D. Wright, and B. A. Young. 1998. Effects of solar radiation, dietary energy, and time of feeding on thermoregulatory responses and energy balance in cattle in a hot environment. J. Anim. Sci. 76: 2671-2677.
Brouard, S. 2000. Carbon monoxide generated by heme oxygenase 1 suppresses
endothelial cell apoptosis. J. Exp. Med. 192: 1015-1026. Brown, R. H., R. E. Blaster, and J. P. Fontenot. 1963. Digestibility of fall grown
Kentucky 31 fescue. Agron. J. 55: 321-324. Bughrata, S. S., D. A. Sleper, and G. F. Krause. 1991. Genetic variation in tall fescue
digestibility estimated using a prepared cellulose solution. Crop Sci. 19: 93-96. Burke, J. M., R. W. Rorie, E. L. Piper, and W. G. Jackson. 2001. Reproductive responses
to grazing endophyte-infected tall fescue by postpartum beef cows. Theriogenology 56: 357-369.
Burns, J. C., and D. S. Chamblee. 1979. Adatation. In: R. C. Buckner and L. P. Bush
(Eds.), Tall fescue, Am. Soc. Agron. Monogr. 20. Madison, WI. p. 9-30. Bush, L. P., J. Boling and S. Yates. 1979. Animal disorders. In: R. C. Buckner and L. P.
Bush (Eds.), Tall fescue, Am. Soc. Agron. Monogr. 20. Madison, WI. p. 247-292. Bush, J. A., D. E. Freeman, K. H. Kline, N. R. Merchen, and G. C. Fahey Jr. 2001.
Dietary fat supplementation effects on in vitro nutrient disappearance and in vivo nutrient intake and total tract digestibility by horses. J. Anim. Sci. 79: 232-239.
Burrows, G. E., and R. J. Tyrl. 2001. Toxic plants of North America. Iowa State Univ.
Press, Ames. Burstyn, P. G. R. 1978. Sodium and water metabolism under the influence of prolactin,
aldosterone and antidiuretic hormone. J. Physiol. 275: 29-50. Chaudhuri, J. D. 2005. Genes arrayed for you: the amazing world of microarrays. Med.
Sci. Monit. 11: RA 52-62. Chen, J. J., R. R. Delongchamp, C. A. Tsai, H. M. Hsuch, F. Sistare, K. I. Thompson, V.
G. Desai, and J. C. Fuscoe. 2004. Analysis of variance components in gene expression data. Bioinformatics 20: 1436-1446.
Chen, W., K. Suruga, N. Nishimura, T. Gouda, V. N. Lam, and H. Yokogoshi. 2005.
Comparative regulation of major enzymes in the bile acid biosynthesis pathway by cholesterol, cholate and taurine in mice and rats. Life Sci. 77: 746-757.
281
Chestnut, A.B., P. D. Anderson, M. A. Cochran, A. Fribourgt, and K. D. Gwinn. 1992. Effects of hydrated sodium calcium aluminosilicate on fescue toxicosis and mineral absorption. J. Anim. Sci. 70: 2838-2846.
Cho, E.S., N. Sahyoun, and L. D. Stegink. 1981. Tissue glutathione as a cysteine
reservoir during fasting and refeeding of rats. J. Nutr. 111: 914-922. Chuaqui, R. F., R. F. Bonner, C. J. Best, J. W. Gillespie, M. J. Flaig, S. M. Hewitt, J. L.
Philips, D. B. Krizman, M. A. Tangrea, and M. Ahram. 2002. Post-analysis follow-up and validation of microarray experiments. Nature Genetics 32 Suppl.: 509-514.
Churchill, G. A. 2002. Fundamentals of experimental design for cDNA microarrays.
Nature Genetics 32 Suppl.: 490-495. Cincotta, A. H., and A. H. Meier. 1989. Prolactin influences the circadian rhythm of
lipogenesis in primary culture hepatocytes. Horm. Metab. Res. 21: 64-68. Cole, S. W., Z. Galic, and J. A. Zack. 2003. Controlling false negative errors in
microarray differential expression analysis: a PRIM approach. Bioinformatics 19: 1808-1816.
Collier, R. J., G. E. Dahl, and M. J. VanBaale. 2006. Major advances associated with
environmental effects on dairy cattle. J. Dairy Sci. 89: 1244-1253. Collinson, L. P., and I. W. Dawes. 1992. Inducibility of the response of yeast cells to
peroxide stress. J. Gen. Microbiol. 138: 329-335. Conover, M. R. 1998. Impact of consuming tall fescue leaves with the endophytic fungus,
Acremonium coenophialum, on Meadow Voles. J. Mammal. 79: 457-463. Cooper, M. A. and K. W. Washburn. 1998. The relationships of body temperature to
weight gain, feed consumption, and feed utilization in broilers under heat stress. Poultry Sci.77: 237-242.
Cowan, J. R.1956. Tall fescue. Adv. Agron. 8: 283-320. Cross, D. L., L. M. Redmond, and J. R. Strickland. 1995. Equine Fescue Toxicosis: Signs
and Solutions. J. Anim. Sci. 73: 899- 908. Cui, X. and G. A. Churchill. 2003. Statistical tests for differential expression in cDNA
microarray experiments. Genome Biology 4: 210-215. Dale, H. E., C. K. Goberdhan, and S. Brody. 1954. A comparison of the effects of
starvation and thermal stress on the acid-base balance of dairy cattle. Am. J. Vet. Res. 15: 197-201.
282
Daly, A. K. 2006. Significance of the minor cytochrome P450 3A isoforms. Clin.
Pharmacokinet. 45: 13-31. Davidson, J. F., B. Whyte, P. H. Bissinger, and R. H. Schiestl. 1996. Oxidative stress is
involved in heat-induced cell death in Saccharomyces cerevisiae. Proc. Natl. Sci. 93: 5116-5121.
Davis T. P., J. D. Johnson, and C. W. Gehrke. 1984. Effect of temperature stress on
circulating biogenic amines in bovine. Comp. Biochem. Physiol. 79: 369-375. Dennis, S. B., V. G. Allen, K. E. Saker, J. P. Fontenot, J. Y. Ayad, and C. P. Brown.
1998. Influence of Neotyphodium coenophialum on copper concentration in tall fescue. J. Anim. Sci. 76: 2687-2693.
Dennis, G., B. D. Sherman, J. Hosack, W. Yang, H. C. Gao, C. Lane, and R. Lempicki.
2003. DAVID: Database for Annotation, Visualization, and Integrated Discovery. Genome Biol. 4: P3.
Dew, R. K., G. A. Boissonneault, N. Gay, J. A. Boling, R. J. Cross, and D. A. Cohen.
1990. The effect of the endophyte and associated toxin(s) of tall fescue on serum titer response to immunization and spleen cell flow cytometry analysis and response to mitogens. Vet. Immunol. Immunopathol. 26: 285-295.
Donaldson, R. S., M. A. McCann, H. E. Amos, and C. S. Hoveland. 1991. Protein and
fiber digestion by steers grazing winter annuals and supplemented with ruminal escape proteins. J. Anim. Sci. 69: 3067- 3071.
Dresser, G. K., J. D. Spence, and D. G. Bailey. 2000. Pharmacokinetic pharmacodynamic
consequences and clinical relevance of cytorhcome P450 3A4 inhibition, Clinical Pharmacokinetics 38: 41-57.
Dudoit, S., Y. H. Yang, M. J. Callow, and T. P. Speed. 2002. Statistical methods for
identifying differentially expressed genes in replicated cDNA microarray experiments. Statistica Sinica 12: 111-139.
Duggan D. J., M. Bittner, Y. Chen, P. Meltzer, and J. M. Trent. 1999. Expression
profiling using cDNA microarrays. Nature Genetics 21 Suppl.: 10-14. Duhau, L., J. Grassi, D. Grouselle, A. Enjalbert, and J. M. Grognet. 1991. An enzyme
immunoassay for rat prolactin: application to the determination of plasma levels. J. Immunoassay 12. 233-250.
DuTeaux, S. B., J. W. Newman, C. Morisseau, E. A. Fairbairn, K. Jelks, B. D. Hammock,
and M. G. Miller. 2004. Epoxide hydrolases in the rat epididymis: Possible roles in xenobiotic and endogenous fatty acid metabolism. Toxicol. Sci. 78: 187-195.
283
Dyer, D. C. 1993. Evidence that ergovaline acts on serotonin receptors. Life Sci. 53: 223-
228. Edgar, R., M. Domrachev, and A. E. Lash. 2002. Gene expression omnibus: NCBI gene
expression and hybridization array data repository. Nucleic Acids Res. 30: 207-210.
Eichen, P. A., D. E. Spiers, G. E. Rottinghaus, and D. P. Colling. 2001. Utilization of a
small animal model of fescue toxicosis to evaluate the potential benefit of Ascophyllum nodosum. J. Anim. Sci. 79, Suppl. 1: 16.
Eisen, M. B., P. T. Spellman, P. O. Brown and D. Botstein. 1998. Cluster analysis and
display of genome-wide expression patterns. Proc. Nat. Acad. Sci. 95: 14863-14868.
El-Nouty, F. D., A. A. Al-Haidary, and M. S. Salah. 1990. Seasonal effects on body
temperature, thyroid function, blood glucose and milk production in lactating and dry Holstein cows in semi-arid environment. Arab Gulf J. Sci. Res. 8: 89-103.
Elsasser, T. H. and D. J. Bolt. 1987. Dopaminergic-like activity in toxic fescue alters
prolactin but not growth hormone or thyroid stimulating hormone in ewes. Dom. Anim. Endocrin. 4: 259-269.
Elvinger, F., R. P. Natzke, and P. J. Hansen. 1991. Interactions of heat stress and bovine
somatotropin affecting physiology and immunology of lactating cows. J. Dairy Sci. 75: 449-462.
Endo, F. 1999. Inborn errors of tyrosine metabolism: abnormalities in catabolic pathway
of phenylalanine and tyrosine. Seikagaku. 71: 1327-1331. Estan, L., I. Martinex-Mir, E. Rubio, and F. J. Morales-Olivas. 1995. No evidence for
dopamine-induced relaxation in isolated human menenteric arterial strips from elderly patients. Gen. Pharmacol. 26: 1687-1694.
Filipov, N. M., F. N. Thompson, N. S. Hill, D. L. Dawe, J. A. Stuedemann, J. C. Price,
and C. K. Smith. 1998. Vaccination against ergot alkaloids and the effect of endophyte-infected fescue seed-based diets on rabbits. J. Anim. Sci. 76: 2456-2463.
Filipov, N. M., F. N. Thompson, J. A. Stuedemann, T. H. Elsasser, S. Kahl, R. R.
Sharma, C. R. Young, L. H. Stanker, and C. K. Smith. 1999a. Increased responsiveness to intravenous lipopolysaccharide challenge in steers grazing endophyte-infected tall fescue compared with steers grazing endophyte-free tall fescue. J. Endocrin. 163: 213-220.
284
Filipov, N. M., F. N. Thompson, R. P. Sharma, and R. R. Dugyala. 1999b. Increased proinflammatory cytokines production by ergotamine in male BALB/c mice. J. Toxicol. Environ. Health 58: 145-155.
Filipov, N. M., F. N. Thompson, J. A. Stuedemann, T. H. Elsasser, S. Kahl, L. H.
Stanker, C. R. Young, D. L. Dawe, and C. K. Smith. 2000. Anti-inflammatory effects of ergotamine in steers. Proc. Soc. Exp. Biol. Med. 225: 136-142.
Flanagan, N. 2005. Advances in microgenomics: Less is more. Genetic Eng. News 25: 1-
3. Forsyth, J. S., P. E. Ross, and I. A. Bouchier. 1983. Bile salts in breast milk. Eur. J.
Pediatr. 140: 126-127. Francesconi, R. and M. Mager. 1980. 5-Thio-D-Glucoses: Hypothermic responses in
mice. Am. J. Physiol. 239: R214-218. Franci, O., A. Amici, R. Margarit, N. Merendino, and E. Piccolella. 1996. Influence of
thermal and dietary stress on immune response of rabbits. J. Anim. Sci. 74: 1523-1529.
Forsum, E., P. E. Hillman, and M. C. Nesheim. 1981. Effect of energy restriction on total
heat production, basal metabolic rate and specific dynamic action of food in rats. J. Nutr. 111: 1691-1697.
Forster, T., D. Roy and P. Ghazal. 2003. Experiments using microarray technology:
limitations and standard operating procedures. J. Endocrin. 178: 195-204. Fujita, H., 1997. Molecular mechanisms of heme biosynthesis. Tohoku J. Exp. Med. 183:
83-99. Fuquay, J. W., L. T. Chapin, and W. H. Brown. 1980. Short term post-partum heat stress
in dairy cows. Int. J. Biomet. 24: 1432-1254. Gadberry, M. S., T. M. Denard, D. E. Spiers, and E. L. Piper. 2003. Effects of feeding
ergovaline on lamb performance in a heat stress environment. J. Anim. Sci. 81: 1538-1545.
Gallicchio, L., S. I. Berndt, M. A. McSorley, C. J. Newschaffer, L. W. Thuita, P. Argani,
S. C. Hoffman, and K. J. Helzlsouer. 2006. Polymorphisms in estrogen-metabolizing and estrogen receptor genes and the risk of developing breast cancer among a cohort of women with benign breast disease. BMC Cancer 6: 173-184.
Garner, G. B. and C. N. Cornell. 1975. Fescue foot in cattle. In: Mycotoxicosis in cattle.
p. 45-62.
285
Garner, G. B., G. E. Rottinghaus, C. N. Cornell, and J. Testereci. 1993. Chemistry of compounds associated with endophyte/grass interaction. Ergovaline- and ergopeptine-related alkaloids. Agric. Ecosys. Environ. 44: 65-80.
Garriga, C., R. R. Hunter, C. Amat, J. M. Planas, M. A. Mitchell, and M. Moreto. 2005.
Heat stress increases apical glucose transport in the chicken jejunum. Am. J. Physiol. Reg. Integr. Comp. Physiol. 290: R195-R201.
Gaughan, J. B., T. L. Mader S. M. Holt, M. J. Josey, and K. J. Rowan. 1999. Heat
tolerance of Boran and Tuli crossbred steers. J. Anim. Sci. 77: 2398-2405. Gaughan, J. B., W. M. Kreikemeier, and T. L. Mader. 2005. Hormonal growth-promotant
effects on grain-fed cattle maintained under different environments. Int. J. Biometeorol. 49: 396-402.
Gerardo-Gettens, T., B. J. Moore, J. S. Stern, and B. A. Horwitz. 1989. Prolactin
stimulates food intake in a dose-dependent manner. Am. J. Physiol Regul. Integr. Comp. Physiol. 256: R276-R280.
Gnerre, C., G. U. Schuster, A. Roth, C. Handschin, L. Johansson, R. Looser, P. Parini,
M. Podvinec, K. Robertsson, J. Gustafsson, and U. A. Meyer. 2005. LXR deficiency and cholesterol feeding affect the expression and Phenobarbital-mediated induction of cytochrome P450 in mouse liver. J. Lipid Research 46: 1633-1642.
Godeas, C., G. Sandri, and E. Panfili. 1994. Distribution of phospholipid hydroperoxide
glutathione peroxidase (PHGPx) in rat testis mitochondria. Biochem. Biophys. Acta. 1191: 147-150.
Gordon, J. G.1993. Thermoregulatory effector responses. In: Temperature Regulation in
Laboratory Rodents, p. 73-109. Cambridge Univ. Press, Oakleigh, Australia. Gordon, C., G. Lagnier, J. Lee, J. M. Buhler, S. Kieffer, M. Perrot, H. Boucherie, M. B.
Toledano, and J. Labarre. 1998. The H2O2 stimulation in Saccharomyces cerevisiae. J. Biol. Chem. 273: 22480-22489.
Gorini, A., R. Arnaboldi, L. Vercesi, and M. Dossena. 1988. Influence of some ergot
alkaloids on the cerebral reduced glutathione. Farmaco. 43: 887-890. Gonzalez, B. and R. Manso. 2004. Induction, modification and accumulation of HSP70s
in the rat liver after acute exercise: early and late responses. J. Physiol. 556: 369-385.
Grant, C. M., F. H. MacIver, and I. W. Dawes. 1997. Glutathione synthetase is
dispensable for growth under both normal and oxidative stress conditions in the
286
yeast Saccharomyces cerevisiae due to an accumulation of the dipeptide gamma-glutamylcysteine. Mol. Biol. Cell 8: 1699-1707.
Gursoy, E., A. Cardounel, Y. Hu, and M. Kalimi. 2001. Biological effects of long-term
caloric restriction: adaptation with simultaneous administration of caloric stress plus repeated immobilization stress in rats. Exp. Biol. Med. 226: 97-102.
Haas, S., C. Pierl, V. Harth, B. Pesch, S. Rabstein, T. Bruning, Y. Ko, U. Hamann, C.
Justenhoven, H. Brauch, and H. Fischer. 2006. Expression of xenobiotic and steroid hormone metabolizing enzymes in human breast carcinomas. Int. J. Cancer (http://www3.interscience.wiley.com/cgi-bin/abstract).
Hahn, G. L. and T. L. Mader. 1997. Heat waves in relation to thermoregulation, feeding
behaviour and mortatlity of feedlot cattle. Proceedings of the 5th International Lvstk Environmental Symposium. American Society of Agricultural Engineers, St. Joseph, Mich.
Hamadeh, H. K., P. R. Bushel, S. Jayadev, K. Martin, O. Disorbo, and S. Sieber. 2002.
Gene expression analysis reveals chemical-specific profiles. Toxicol. Sci. 67: 219-231.
Hannah, S. M., J. A. Paterson, J. W. Williams, M. S. Kerley, and J. L. Miner. 1990.
Effects of increasing dietary levels of endophyte-infected tall fescue seed on diet digestibility and ruminal kinetics in sheep. J. Anim. Sci. 68: 1693-1701.
Hanson, A. A., 1979. The future of tall fescue. In: R. C. Buckner and L. P. Bush (Eds.), Tall fescue, Am. Soc. Agron. Monogr. 20. Madison, WI. p. 341-344. Hao, Y., L. Lai, J. Mao, G. Im, A. Bonk, and R. S. Prather. 2003. Apoptosis and in vitro
development of preimplantation porcine embryos derived in vitro or by nuclear transfer. Biol. Reprod. 69: 501-507.
Harada, T., I. Koyama, T. Kasahara, D. H. Alpers, and T. Komoda. 2003. Heat shock
induces intestinal-type alkaline phosphatase in rat IEC-18 cells. Am. J. Physiol. Gastrointest. Liver Physiol. 284: G255-G262.
Harmon, D. L., D. Mc Master, D. C. Shields, A. S. Whiteheat, and I. M. Rea. MTHFR
thermolabile genotype frequencies and longevity in Northern Ireland. Atherosclerosis 131: 137-138.
Hemken, R.W., L. S. Bull, J. A. Boling, E. Kane, L. P. Bush, and R. C. Buckner. 1979.
Summer fescue toxicosis in lactating dairy cows and sheep fed experimental strains of ryegrass-tall fescue hybrids. J. Anim. Sci. 49: 641–646.
287
Hemken, R.W., J. A. Boling, L. S. Bull, R. H. Hatton, R. C. Buckner, and L. P. Bush. 1981. Interaction of environmental temperature and anti-quality factors on the severity of summer fescue toxicosis. J. Anim. Sci. 52: 710–714.
Hill, N. S., D. P. Belesky, and W. C. Stringer. 1991. Competitiveness of tall fescue as
influenced by Acremonium coenophialum. Crop Sci. 31: 185-190. Hill, N. S., F. N. Thomson, J. A. Stuedemann, G. W. Rottinghaus, H. J. Ju, D. L. Dawe,
and E. E. Hiatt, 2001. Ergot alkaloid transport across ruminant gastric tissues. J. Anim. Sci. 79: 542-549.
Hill, N. S. 2005. Absorption of ergot alkaloids in the ruminant. Pages 271-290 in
Neotyphodium in cool season grasses. C. A. Roberts, C. P. West and D. Spiers, ed. Blackwell Publishing, Ames, IA.
Hirono, T., T. Manabe, K. Ando, and T. Tobe. 1992. Acute cytotoxic effect of
cyclosporin A on pancreatic acinar cells in rats. Protective effect of the synthetic protease inhibitor E3123. Scandinav. J. Gastroenterol. 27: 103-107.
Holt, P. R., and D. P. Kotler.1987. Adaptive changes of intestinal enzymes to nutritional
intake in the aging rat. Gastroenterol. 93, 295-300. Hooley, R. D., J. K. Findlay, and R. G. Stephenson. 1979. Effects of heat stress on
plasma concentrations of prolactin and luteinizing hormone in ewes. Aust. J. Biol. Sci. 32: 231-235.
Horowitz, M., D. Argov, and R. Mizrahi. 1983. Interrelationships between heat
acclimation and salivary cooling mechanism in conscious rats. Comp. Biochem. Physiol. 74: 945–949.
Horowitz, M.and U. Meiri. 1993. Central and peripheral contributions to control of heart
rate during heat acclimation. European J. Physiol. 422: 386-392. Horowitz, M. 1998. Do cellular heat acclimation responses modulate central
thermoregulatory activity? News Physiol. Sci. 13: 218-225. Horowitz, M., L. Eli-Berchoer, I. Wapinski, N. Friedman, and E. Kodesh. 2004. Stress-
related genomic responses during the course of heat acclimation and its association with ischemic-repurfusion cross-tolerance. J. Appl. Physiol. 97: 1496-1507.
Horrobin, D. F., I. J. Lloyd, A. Lipton, P. G. Brustyn, N. Durkin, and K. L. Muiruri.
1971. Actions of prolactin on human renal function. J. Comp. Physiol. Psychol. 67: 273-283.
288
Hoveland, C. S. 1993. Importance and economic significance of the Acremonium endophytes to performance of animals and grass plants. Ecosyst. Environ. 44: 3-12.
Hubbard, R. W., W. T. Matthew, and R. Francesconi. 1982. Heat-stressed rat: Effects of
atropine, desalivation, or restraint. J. Appl. Physiol. 53: 1171-1174. Ihaka, R. and R. Gentleman. 1996. R: a language for data analysis and graphics. J. Comp.
and Graphical Stat. 5: 299-314. Ikeo, K., J. Ishi-i, T. Tamura, T. Gojobori, and Y. Tateno. 2003. CIBEX: Center for
information biology gene expression database. CR Biol. 326: 1079-1082. Johke, T. 1970. Factors affecting plasma prolactin level of the cow and the goat as
determined by radioimmunoassay. Endocrinol. Japan 17: 393–398. Johnson H. D. and V. J. Vanjonack. 1976. Symposium: Stress and health of the dairy
cow. J. Dairy Sci. 59: 1603-1617. Johnson A. L. 1981. Comparison of three serial blood sampling techniques on plasma
hormone concentrations in laying hens. Poultry Sci. 60: 2322–2327. Johnson, K. G. and M. Cabanac. 1982. Homeostatic competition in rats fed at varying
distances from a thermoneutral refuge. Physiol. Behav. 29: 7715-7720. Johnson, K. G. and R. Stack. 1989. Adaptive behavior of laboratory rats feeding in hot
conditions. Comp. Biochem. Physiol. 94: 69-72. Jones, K. L., S. S. King, and M. J. Iqbal. 2004. Endophyte-infected tall fescue diet alters
gene expression in heifer luteal tissue as revealed by interspecies microarray analysis. Mol. Repro. Dev. 67: 154-161.
Jordan, E. R. 2003. Effects of heat stress on reproduction. J. Dairy Sci. 86: E104-114. Joseph, I. M., N. Suthanthirarajan, and A. Namasivayam. 1991. Effect of acute heat stress
on certain immunological parameters in albino rats. Indian J. Physiol. Pharmacol. 35: 269-271.
Kalitsky-Szirtes, J., A. Shayeganpour, D. R. Brocks, and M. Piquette-Miller. 2004.
Suppression of drug-metabolizing enzymes and efflux transporters in the intestine of endotoxin-treated rats. Drug Metab. Dispos. 32: 20-27.
Kaufman, S., B. J. Mackay, and J. Z. Scott. 1981. Dairly water and electrolyte balance in
chronically hyperprolactinaemic rats. J. Physiol. 321: 11-19.
289
Kaur, M., J. Kaur, S. Ojha, and A. Mahmood. 1996. Dietary fat effects on brush border membrane composition and enzyme activities in rat intestine. Ann. Nutr. Metab. 40: 269-276.
Kelley, D. W., C. A. Osborne, J. F. Evermann, S. M. Parish, and C. T. Gaskins. 1982.
Effects of chronic heat and cold stressors on plasma immunoglobulin and mitogen-induced blastogenesis in calves. J. Dairy. Sci. 65: 1514-1528.
Kent, W. J. 2002. BLAT-The BLAST like alignment tool. Genome Res. 12: 656-664. Kerr, L. A. and W. J. Kelch. 1999. Current veterinary therapy. P. 263-264. In J. L.
Howard and R. A. Smith (ed.) Food Animal Practice. Saunders, Philadelphia, PA. Kerr, M. K., and G. A. Churchill. 2001. Statistical design and the analysis of gene
expression microarray data. Genetics Res. 77: 123-128. Kerr, K. M. and G. A. Churchill. 2002. Bootstrapping cluster analysis: Assessing the
reliability of conclusions from microarray experiments. Proc. Natl. Acad. Sci. 98: 8961–8965.
Kim, J. H., D. M. Shin, and Y. S. Lee. 2002. Effect of local background intensities in the
normalization of cDNA microarray data with a skewed expression profiles. Exp. Mol. Med. 34: 224-232.
Kimbrough, L., D. Lang, H. W. Essig, R. I vy, and F. T. Withers. Jr. 1993. Management
of endophyte-infected and endophyte-free tall fescue in Mississippi. Cooperative Extension Service, Mississippi State University.
Klatt, P. and S. Lamas. 2000. Regulation of protein function by S-glutathiolation in
response to oxidative and nitrosative stress. Eur. J. Biochem. 267: 4928-4944. Kliewer, A. S., B. Goodwin, and T. M.Willson. 2002. The nuclear Pregnane X receptor:
A key regulator of xenobiotic metabolism. Endocrine Reviews 23: 687-702. Kliewer, A. S. 2003. The nuclear Pregnane X receptor regulates xenobiotic
detoxification. J. Nutr. 133: 2444S-2447S. Klotz, J. L., L. P. Bush, D. L. Smith, W. D. Shafer, L. L. Smith, A. C. Vevoda, A. M.
Craig, B. C. Arrington, and J. R. Strickland. 2006. Assessment of vasoconstrictive protential of D-lysergic acid using an isolated bovine lateral saphenous vein bioassay. J. Anim. Sci. 84: 3167-3175.
Konobasova, N. V., K. Pashinin, V. Iu., and O. Mel’nikova. 1985. Effect of ouabain on
the Na+, K+-ATPase function and multiplication of transformed cells in culture. Tsitologiia 27: 1414-1419.
290
Kregel, K. 2002. Heat shock proteins: Modifying factors in physiological stress responses and acquired thermotolarance. J. App. Physiol. 92: 2177-2186.
Lakritz, J., M. J. Leonard, P. A. Eichen, G. E. Rottinghaus, G. C. Johnson, and D. E.
Spiers. 2002. Whole-blood concentrations of glutathione in cattle exposed to heat stress or a combination of heat stress and endophyte-infected tall fescue toxins in controlled environmental conditions. Am. J. Vet. Res. 63: 799-803.
Lamba, V., K. Yasuda, J. K. Lamba, M. Assem, J. Davila, S. Storm, and G. Schuetz.
2004. PXR (NR112): splice variants in human tissues, including brain and identification of neurosteroids and nicotine as PXR activators. Tox. Appl. Pharm. 199: 251-265.
Lamberts, S. W. and R. M. Macleod. 1990. Regulation of prolactin secretion at the level
of the lactotroph. Physiol. Rev. 70: 279-318. Larson B. T, J. A. Paterson, M. S. Kerley, and S. C. Bell. 1992. Endophyte-infected tall
fescue ingestion in the rat model. J. Anim. Sci. 70: 86. Larson, B. T. 1993. D2 dopamine receptors in fescue toxicosis. Ph.D. Dissertation. Univ.
of Missouri, Columbia. Larson, B. T., D. L. Harmon, E. L. Piper, L. M. Griffis, and L. P. Bush. 1999. Alkaloid
binding and activation of D2 dopamine receptors in cell culture. J. Anim. Sci. 77: 942-947.
Lee, I. Y., C. C. Lee, C. K. Chang, C. H. Chien, and M. T. Lin. 2005. Sehng mai san, a
Chinese herbal medicine, protects against renal ischeamic injury during heat stroke in the rat. Clin. Exp.Pharm. Physiol. 32: 742-748.
Lettieri, T. 2005. Recent applications of DNA microarray technology to toxicology and
ecotoxicology. Environ. Health Persp. 114:4-9. Li, P. L., Y. M. Chao, S. H. Chan, and J. Y. Chan. 2001. Potentiation of baroreceptor
reflex response by heat shock protein 70 in nucleus tractus solitari confers cardiovascular protection during heatstroke. Circ. 24: 2114-2119.
Li, Y., T. Yokoi, M. Katsuki, J. S. Wang, J. D. Groopman, and T. Kamataki. 1997. In
vivo activation of aflatoxin B1 in C57BL/6N mice carrying a human fetus-specific CYP3A7 gene. Cancer Res. 15: 641-645.
Lipham, L. B., F. N. Thompson, J. A. Steudemann, and J. L. Sartin. 1989. Effects of
metoclopramide on steers grazing endophyte-infected fescue. J. Anim. Sci. 67: 1090-1097.
291
Lipschutz, R. J., S. P. A. Fodor, T. R. Gingeras, and D. J. Lockhart. 1999. High density synthetic oligonucleotides arrays. Nature Gen. 21: 20-24.
Liska, D. J. 1998. The detoxification enzyme system. Altern. Med. Rev. 3: 187-198. Littell, R. C., P. R. Henry, and C. B. Ammerman. 1998. Statistical analysis of repeated
measures data using SAS procedures. J. Anim. Sci. 76: 1216–1231. Lopez-Hellin, J., R. Gonzalo, M. Tejeda, M. Carrascal, M. R. Vila, J. Abian, and F.
Garcia-Arumi. 2005. Transcriptomic and proteomic analysis of liver and muscle alterations caused by surgical stress in rats. Clin. Sci. (Lond). 108: 167-178.
Mader, T. L., M. S. Davis, and S. M. Holt. 2000. Management of feedlot cattle exposed
to heat is important. Feedstuffs 2000: 11-13. Maines, M. D. 2000. The heme oxygenase system and its functions in the brain. Cell.
Mol. Biol. 46: 573-585. Malago, J. J., J. F. J. G. Koninkx, and J. E. V. Dijk. 2002. The heat shock response and
cytoprotection of the intestinal epithelium. Cell Stress Chap. 7: 191-199. Malberg, J. E. and L. Seiden. 1998. Small changes in ambient temperature causes large
changes in 3,4-methylenedioxymethamphetamine (MDMA)-induced serotonin neurotoxicity and core body temperature in the rat. J. Neurosci. 18: 5086-5094.
Malinowski, D. P., D. P. Belesky, and G. C. Lewis. 2005. Abiotic stresses in endophytic
grasses. In: Neotyphodium in Cool-Season Grasses, edited by Roberts, C.A., West, C.P., Spiers, D.E., p. 187-199. Blackwell Publishing, Ames, IA.
Mannering, G. J. 1985. Drug metabolism in the newborn. Fed. Proc. 44: 2302-2308. Marczuk-Krynicka, D., T. Hryniewiecki, J. Piatek, and J. Paluszak. 2003. The effect of
brief food withdrawal on the elvel of free radicals and other parameters oxidative status in the liver. Med. Sci. Monit. 9: 131-135.
Marshall, H. C., R. A. Ferguson, and M. A. Nimmo. 2006. Human resting extracellular
heat shock protein 72 concentration decreases during the initial adaptation to exercise in a hot, humid environment. Cell Stress Chap. 11: 129-134.
Mason, J. L., Y. K. Suzuki, A. J. D’Ercole, and G. K. Matsushima. 2000. Insulin like
growth factor-1 inhibits mature oligodendrocyte apoptosis during primary demyelination. Neurosci. 20: 5703-5708.
Matthew, C. B. 1997. Telemetry augments the validity of the rat as a model for heat
acclimation. Annals New York Acad. Sci. 813: 233-238.
292
McCollough, S. F., E. L. Piper, A. S. Moubarak, Z. B. Johnson, and M. Flieger. 1994. Effects of fescue alkaloids on peripheral blood flow and prolactin secretion in calves. Proc. Tall Fescue Toxicosis Workshop, SERAIEG – 8, Atlanta, GA. 25-26, p. 7.
Mizinga, K. M., F. N. Thompson, J. A. Stuedemann, and G. L. Edwards. 1993. Neural
dopamine D2 receptors in rats fed endophyte-infected fescue seed. Drug Chem. Toxicol. 16: 307-319.
Mitra, R., G. I. Christan, and H. D. Johnson. 1972. Effect of prolonged thermal exposure
on growth hormone secretion in cattle. J. Anim. Sci. 34: 776-779. Moubarak, A. S. and C. F. Rosenkrans Jr. 2000. Hepatic metabolism of ergot alkaoids in
beef cattle by cytochrome P450. Biochem. Biophys. Res. Commun. 274: 746-769.
Moubarak, A. S., Z. B. Johnson, and C. F. Rosenkrans Jr. 2003a. Antagonistic effects of
simulataneous exposure of ergot alkaloids on kidney adenosine triphosphatase system. In Vitro Cell. Dev. Biol. 39: 395-398.
Moubarak, A. S., C. F. Rosenkrans, Z. B., Johnson, 2003b. Modulation of cytochrome
P450 metabolism by ergonovine and dihydroergotamine. Vet. Hum. Toxicol. 45: 6-9.
Murray, B. P. and M. A. Correia. 2001. Ubiquitin-dependent 26S proteasomal pathway: a
role in the degradation of native human liver CYP3A4 expressed in Saccharomyces cerevisiae. Arch. Biochem. Biophys. 393: 106-116.
Murthy, M. R., T. J. Reid, A. Sicignano, N. Tanaka, and M. G. Rossmann. 1981. The
transcription machinery in mammalian mitochondria. J. Mol. Biol. 152: 465-499. Neal, W. D. and S. P. Schmidt. 1985. Effects of feeding Kentucky 31 tall fescue seed
infected with Acremonium Coenophialum to laboratory rats. J. Anim. Sci. 61: 603-611.
Neill, J. D. 1970. Effect of stress on serum prolactin and luteinizing hormone levels
during the oestrous cycle in the rat. Endocrin. 87: 1192–1197. Nieto, N., S. L. Friedman, and A. I. Cederbaum. 2002. Cytochrome P450 2E1-derived
reactive oxygen species mediate paracrine stimulation of collagen I protein synthesis by hepatic stellate cells. J. Biol. Chem. 22: 9853-9864.
Nihsen, M. E., E. L. Piper, C. P. West, R. J. Crawford, Jr. T. M. Denard, Z. B. Johnson,
C. A. Roberts, D. E. Spiers, and C. F. Rosenkrans Jr. 2004. Growth rate and physiology of steers grazing tall fescue inoculated with novel endophytes. J. Anim. Sci. 82: 878-883.
293
Niklowitz, P. and K. Hoffmann. 1988. Pineal and pituitary involvement in the
photoperiodic regulation of body weight, coat color and testicular size of the Djungarian hamster. Phodopus sungorus. 39: 489-498.
Niles, M. A., R. J. Collier, and W. J. Croom. 1980. Effects of heat stress on rumen and
plasma metabolite and plasma hormone concentrations of Holstein cows. J. Anim. Sci. 51(Suppl. 1): 152.
Nishizawa, H., S. Imanishi, and N. Manabe. 2005. Effects of exposure In Utero to
Bisphenol A on the expression of aryl hydrocarbon receptor, related factors and xenobiotic metabolizing enzymes in murine embryos. J. Reprod. Dev. 51: 593-605.
Niu, K. C., M. T. Lin, and C. P. Chang. 2007. Hyperbaric oxygen improves survival in
heatstroke rats by reducing multiorgan dysfunction and brain oxidative stress. Eur. J. Pharmacol. (Epub ahead of print).
NRC, 1996. Nutrient requirement of beef cattle, 7th edn. National Academy Press,
Washington D.C. Nutting, D. F., E. A. Tolley, L. A. Toth, S. D. Ballard, and M. A. Brown. 1992. Serum
amylase activity and calcium and magnesium concentrations in young cattle grazing fescue and Bermuda grass pastures. Am. J. Vet. Res. 53: 834-839.
Oguri, K. and H. Yamada. 1994. Regiochemistry of cytochrome P450 isozymes. Ann.
Rev. Pharmacol. Toxicol. 34: 251–279. Osborn, T. G., S. P. Schmidt, D. N. Marple, C. H. Rahe, and J. R. Steenstra. 1992. Effect
of consuming fungus-infected and fungus-free tall fescue and ergotamine tartrate on selected physiological variables of cattle in environmentally controlled conditions. J. Anim. Sci. 70: 2501-2509.
Oliver, J. W., L. K. Abney, J. R. Strickland, and R. D. Linnabary. 1993. Vasoconstriction
in bovine vasculature induced by the tall fescue alkaloid lysergamide. J. Anim. Sci. 71: 2708-2713.
Oliver, J.W. 1997. Physiological manifestations of endophyte toxicosis in ruminant and
laboratory species. pg. 297- 319. In C. W. Bacon, and N. S.Hill (ed.) Neotyphodium/Grass Interactions, Plenum Press, New York.
Oliver, J. W. and A. E. Schultze. 1997. Histologic lesions in cattle fed toxic tall fescue
grass. The Toxicologist 36: 46-48.
294
Oliver, J. W., J. R. Strickland, J. C. Waller, H. A. Fribourg, R. D. Linnabary, and L. K. Abney. 1998. Endophytic fungal toxin effects on adrenergic receptors in bovine lateral saphenous veins of cattle grazing tall fescue. J. Anim. Sci. 76: 2853-2856.
Oliver, J. W., A. E. Schultze, B. W. Rohrbach, H. A. Fribourg, T. Ingle, and J. C. Waller.
2000. Alterations in hemograms and serum biochemical analytes of steers after prolonged consumption of endophyte-infected tall fescue. J. Anim. Sci. 78: 1029-1035.
Oliver, J. W. 2005. Pathophysiologic response to endophyte toxins. In Neotyphodium in
Cool-Season Grasses. (C. A. Roberts, C. P. West, and D. E. Spiers, Eds.) pp. 291–304 Blackwell Publ., Ames, IA.
Panaccione, D. G., R. D. Johnson, J. Wang, C. A. Young, P. Damrongkool, B. Scott, and
C. L. Schardl. 2001. Elimination of ergovaline from a grass-Neotyphodium endophyte symbiosis by genetic modification of the endophyte. Proc. Natl. Acad. Sci. USA. 98: 12820-12825.
Pascussi, J. M., L. Drocourt, J. M. Fabre, P. Maurel, and M. J. Vilarem. 2000.
Dexamethasone induces pregnane X receptor and retinoid X receptor-α expression in human hepatocytes: synergistic increase of CYP3A4 induction by pregnane X receptor activators. Mol. Pharmacol. 58: 361-372.
Paterson, J. C., B. Forcherio, M. Larson, M. Samford, and M. Kerley. 1995. The effects
of fescue toxicosison beef cattle productivity. J. Anim. Sci. 73: 889-898. Pennie, W., S. D. Pettit, and P. G. Lord. 2004. Toxicogenomics in risk assessment: an
overview of an HESI collaborative research program. Environ. Health Perspect 112: 417-419.
Percival, M., 1997. Phytonutrients and detoxification. Clinical Nutrition Insights 5: 1-4. Pereira, A. M., F. Baccari, E. A., Titto, and J. A. Almeida. 2007. Effect of thermal stress
on physiological parameters, feed intake and plasma thyroid hormones concentration in Alentejana, Mertolenga, Frisian and Limousine cattle breeds. Int. J. Biometeorol. 20 (Epub ahead of print).
Petalidis, L., S. Bhattacharyya, G. A. Morris, V. P. Collins, T. C. Freeman, and P. A.
Lyons. 2003. Global amplification of mRNA by template-switching PCR: linearity and application to microarray analysis. Nucleic Acid Res. 31: 142-143.
Perez, J. X., A. Manzano, A. Tauler, and R. Bartrons. 1998. Effect of starvation on gene
expression of regulatory enzymes of glycolysis/gluconeogenesis in genetically obese (fa/fa) Zucker rats. Int. J. Obes. Relat. Metab. Disord. 22: 667-672.
295
Peyronneau, M. A., M. Delaforge, and R. Riviere. 1994. High affinity of ergopeptide for cytochromes P450 3A. Importance of their peptide moiety for P450 recognition and hydrozylation of bromocriptine. Eur. J. Biochem. 223: 947-956.
Pietrogrande, F., A. Caenazzo, D. Fransesco, G. Polato, and A. Girolami. 1995. A role for
platelet-derived growth factor in drug-induced chronic ergotism?, a case sensitive report. Angiology 46: 633-636.
Piper, E. L., D. A. Hays, D. S. Hubbell, and S. M. Mashburn. 1991. Effect of long term
grazing of endophyte-infected fescue on liver enzymes. Proc. Tall Fescue Toxicosis Workshop, SRIEG-37, Atlanta, Georgia. pg. 26.
Pollock, J. D. and N. Rowland. 1981. Peripherally administered serotonin decreases food
intake in rats. Pharmacol. Biochem. Behav. 15: 179-183. Porter, J. K. and F. N. Thompson. 1992. Effects of fescue toxicosis on reproduction in
livestock. J. Anim. Sci. 70: 1594-1603. Prasad, M., G. Uma Devi, and S. Govindappa. 1989. Effect of hypo and
hyperprolactinemia on the testicular maturation of Wistar rats during pubertal transition. Arch. Int. Physiol. Biochem. 97: 347-353.
Preston, R. L., D. D. Schnakenberg, and W. H. Pfander. 1965. Protein utilization in
ruminants. Blood urea nitrogen as affected by protein intake. J. Nutr. 86: 281-288. Qian, L., X. Song, H. Ren, J. Gong, and S. Cheng. 2004. Mitochondrial mechanisms of
heat stress-induced injury in rat cardiomyocyte. Cell Stress Chaperones 9: 281-293.
Ramnath, V., P. S. Rekha, and K. S. Sujatha. 2007. Amelioration of heat stress induced
disturbances of antioxidant defense systems in chicken by brahma rasayana. eCAM. 1-8. (http://ecam.oxfordjournals.org/cgi/reprint/nel116v1)
Reber, P. M. 1993. Prolactin and immunomodulation. Am. J. Med. 95: 637-644. Regisford, E. G. and L. S. Katz. 1993. Effects of bromocriptine-induced
hypoprolactinemia on gonadotropin secretion and testicular function in rams during two seasons. J. Reprod. Fertil. 99: 529-537.
Reid, J. M., M. J. Kuffel, S. L. Ruben, J. J. Morales, K. L. Rinehart, D. P. Squillace, and
M. M. Ames. 2002. Detoxification pathways involving glutathione and epoxide hydrolase in the invitro metabolism of chloroprene. Clin. Cancer Res. 8: 2952-2962.
296
Rhodes, M. T., J. A. Paterson, M. S. Kerley, H. E. Garner, and M. H. Laughlin. 1991. Reduced blood flow to peripheral and core body tissues in sheep and cattle induced by endophyte-infected tall fescue. J. Anim. Sci. 69: 2033-2043.
Rice, R. L., D. J. Blodgett, G. G. Schurig, W. S. Swecker, J. P. Fontenot, V. G. Allen,
and R. M. Akers. 1997. Evaluation of humoral immune responses in cattle grazing endophyte-infected or endophyte-free fescue. Vet. Immunol. Immunopathol. 59: 285-291.
Roberts, C. A., D. E. Spiers, A. L. Karr, H. R. Benedict, D. A. Sleper, P. A. Eichen, C. P.
West, E. L. Piper, and G. E. Rottinghaus. 2002. Use of a rat model to evaluate tall fescue seed infected with introduced strains of Neotyphodium Coenophialum. J. Agric. Food Chem. 50: 5742-5745.
Rossi-Fanelli, F. and C. Cangiano. 1991. Increased availability of tryptophan in brain as
common pathogenic mechanis for anorexia associated with different diseases. Nutrition 7: 364-367.
Rottinghaus, G. E., L. M. Schultz, P. F. Ross, and N. S. Hill. 1993. An HPLC method for
the detection of ergot in ground and pelleted feeds. J. Vet. Diagn. Invest. 5: 242-247.
Rowley, A., G. C. Johnston, B. Butler, M. Werner-Washburne, and R. A. Singer. 1993.
Heat shock-mediated cell cycle blockage and GI cyclin expression in the yeast Saccharomyces cerevisiae. Mol. Cell. Biol. 1: 1034-1041.
Rozen, S. and H. Skaletsky. 2000. Primer3 on the WWW for general users and for
biologist programmers. In: Methods in Molecular Biology, S. Krawetz, and S. Misener, (Eds) p. 365-386. Humana Press, Totowa, NJ.
Saal, L., C. Troein, J. Vallon-Christersson, S. Gruvberger, A. Borg, and C. Peterson.
2002. BioArray Software Environment (BASE): a platform for comprehensive management and analysis of microarray data. Genome Biology 3: software0003.
Saeed, A. I., V. Sharov, J. White, W. Li, N. Liang, J. Bhagabati, M. Braisted, T. Klapa,
M. Currier, A. Thiagarajan, M. Strun, A. Snuffin, D. Rezantsev, A. Popov, E. Ryltsov, I. Kostukovich, Z. Borisovsky, A. Liu, V. Vinsavich, and J. Quackenbush. 2003. TM4: A free, open-source system for microarray data management and analysis. Biotechniques 34: 374-378.
Saker, K. E., V. G. Allen, J. Kalnitsky, C. D. Thatcher, W. S. Swecker, Jr., and J. P.
Fontenot. 1998. Monocyte immune cell response and copper status in beef steers that grazed endophyte-infected tall fescue. J. Anim. Sci. 76: 2694-2700.
297
Salah, M. S., M. A. Alsaik, M, Y. Al-Saiadi, and H. H. Mogawer. 1995. Effect of prolactin inhibition on thermoregulation, water and food intake in heat-stressed fat-tailed male lamb. J. Anim. Sci. 60: 87-92.
Salo, D. C., C. M. Donovan, and K. J. Davies. 1991. HSP70 and other possible heat
shock or oxidative stress proteins are induced in skeletal muscle, heart, and liver during exercise. Free Radic. Biol. Med. 11: 239-246.
Sanchez, W. K., M. A. McGuire, and D. K. Beede. 1994. Macromineral nutrition by heat
stress interactions in dairy cattle: review and original research. J. Dairy Sci. 77: 2051-2079.
Santoro, M. G. 2000. Heat shock factors and the control of the stress response. Biochem.
Pharmacol. 59: 55-63. Satirapoj, B., P. S. Yingwatanadej, S. Chaichayanon, and J. Patumanond. 2007. Effect of
angiotensin II receptor blockers on insulin resistance in maintenance haemodialysis patients. Nephrol. 12: 342-347.
Savas, Ü., K. J. Griffin, and E. F. Johnson. 1999. Molecular mechanisms of cytochrome
P-450 induction by xenobiotics: an expanded role for nuclear hormone receptors. Mol. Pharmacol. 56: 851-857.
Scanlan, N. 2001. Compromised hepatic detoxification in companion animals and its
correction via nutritional supplementation and modified fasting. Altern. Med. Rev. 6: 24-37.
Scandalios, G. J. 1997. Oxidative stress and the molecular biology of antioxidant
defenses. Cold Spring Harbor Laboratory Press Pp 1-17 and 842-843. Schardl, L. and A. Panaccione. 2005. Biosynthesis of ergot and loline alkaloids.
Neotyphodium in cool season grasses. Blackwell Publishing Ltd. 75-92. Schena, M., D. Schalon, R. W. Davis, and P. O. Brown. 1995. Quantitative monitoring of
gene expression patterns with a complementary DNA microarray. Science 270: 467-470.
Schillo, K. K., L. S. Leshin, J. A. Boling, and N. Gay. 1988. Effects of endophyte-
infected fescue on concentrations of prolactin in blood sera and the anterior pituitary and concentrations of dopamine and dopamine metabolites in brains of steers. J. Anim. Sci. 66: 713-718.
Schimmer, H., L. Eli-Berchoer, and M. Horowitz. 2006. Acclimatory-phase specificity of
gene expression during the course of heat acclimation and superimposed hypohydration in the rat hypothalamus. J. Appl. Physiol. 100: 1992-2003.
298
Schmidt, S. P., C. S. Hoveland, E. M. Clark N. D. Davis, L. A. Smith, H. W. Grimes, and J. L. Holliman. 1982. Association of an endophytic fungus with fescue toxicity in steers fed Kentucky 31 tall fescue seed or hay. J. Anim. Sci. 50: 1259-1269.
Schmidek, W. R., E. E. Zachariassen, and H. T. Hammel. 1983. Total calorimetric
measurements in the rat: Influence of the sleep-wakefulness cycle and of the environmental temperature. Brain Res. 288: 261-271.
Schoning, C., M. Flieger, and H. H. Pertz. 2001. Complex interaction of ergovaline with
5-HT2A, 5-HT1B/1D, and alpha 1 receptors in isolated arteries of rat and guinea pig. J. Anim. Sci. 79: 2202-2209.
Schuetz, E. G., A. H. Schinkel, M. V. Relling, and J. D. Schuetz. 1996. P-Glycoprotein: a
major determinant of rifampicin-inducible expression of cytochrome P4503A in mice and humans. Proc. Natl. Acad. Sci. USA. 93: 4001-4005.
Schwimmer, H., L. Eli-Berchoer, and M. Horowitz. 2006. Acclimatory-phase specificity
of gene expression during the course of heat acclimatin and superimposed hypohydration in the rat hypothalamus. J. Appl. Physiol. 100: 1992-2003.
Schattenberg, J. M., Y. Wang, R. M. Rigoli, D. R. Koop, and M. J. Czaja. 2004. CYP2E1
overexpression alters hepatocyte death from menadione and fatty acids by activation of ERK1/2 signaling. Hepatology 39: 444-55.
Schmidt, S. P., C. S. Hoveland, E. M. Clark, N. D. Davis, L. A. Smith, H. W. Grimes,
and J. L. Holliman. 1982. Association of an endophytic fungus with fescue toxicity in steers fed Kentucky 31 tall fescue seed or hay. J. Anim. Sci. 50: 1259-1269.
Schultze, A. E., B. W. Rohrback, H. A. Fribourg, J. C. Waller, J.C., and J. W. Oliver.
1999. Alterations in bovine serum biochemistry profiles associated with prolonged consumption of endophyte-infected tall fescue. Vet. Hum. Toxicol. 41: 133-139.
Schultze, A. E. and J. W. Oliver. 1999. Cytotoxicity of ergine to bovine endothelial cells
in culture. The Toxicologist 48: 298-300. Seglen, P. O. 1976. Preparation of isolated rat liver cells. Methods Cell Biol. 13: 29-83. Sergent, D., P. Berbigier,and J. P. Ravault. 1988. Effect of prolactin inhibition in
thermophysiological parameters water and feed intake of sun-exposed male Creole goats in Gaudeloupe. J. Thermal. Biol. 13: 53-56.
Settivari, R. S., S. Bhusari, T. Evans, P. A. Eichen, L. B. Hearne, E. Antoniou, and D. E.
Spiers. 2006. Genomic analysis of the impact of fescue toxicosis on hepatic function. J. Anim. Sci. 84: 1279-1294.
299
Shido, O., Y. Yoneda, and T. Nagasaka. 1989. Changes in body temperature of rats
acclimated to heat with different acclimation schedule. J. Appl. Physiol. 67: 2154-2157.
Shin, E. S., S. Y. Cho, E. Lee, S. J. Lee, I. S. Chang, and T. R. Lee. 2006. Positive
regulation of hepatic carnitine palmitoyl transferase 1A (CPT1A) activities by soy isoflavones and L-carnitine. Eur. J. Nutr. 45: 159-164.
Siegel, R. A., S. Feldman, N. Conforti, M. Ben-David, and I. Chowers. 1979. PRL and
ACTH secretion following acute heat exposure, in intact and in hypothalamic deafferentated male rats. Brain Res. 14: 459-466.
Sleper, D. A. and R. C. Buckner. 1995. The fescues. In: Forages, vol. I: An introduction
to grassland agriculture. R. F. Barnes, D. A. Miller and C. J. Nelson (Eds). Iowa State University Press, Ames, Iowa.
Smith, R. D., R. Hilf, and A. E. Senior. 1977. Prolactin binding to 7, 12-
dimethylbenz(a)anthracene-induced mammary tumors and liver in diabetic rats. Cancer Res. 37: 4070-4074.
Smith, V. G., R. R. Hacker, and G. Brown. 1997. Effect of alterations in ambient
temperature on serum prolactin concentration in steers. J. Anim. Sci. 44: 645-654. Smith, G. W., D. S. Rotstein, and C. F. Brownie. 2004. Abdominal fat necrosis in a
pygmy goat associated with fescue toxicosis. J. Vet. Diagn. Invest. 16: 356-359. Smyth G. K. and T. Speed. 2003. Normalization of cDNA microarray data. Methods
Molecular Biology 31: 265-273. Smyth G. K., Y. H. Yang, and T. Speed. 2003. Statistical issues in cDNA microarray data
analysis. Methods Mol. Biol. 224: 111-136. Solomons, R. N., J. W. Oliver, and R. D. Linnabary. 1989. Reactivity of dorsal pedal vein
of cattle to selected alkaloids associated with Acremonium coenophialum-infected fescue grass. Am. J. Vet. Res. 50: 235-238.
Sonna, L. A., J. Fujita, S. L. Gaffin, and C. M. Lilly. 2002. Effects of heat and cold stress
on mammalian gene expression. J. Appl. Physiol. 92: 212-220. Spiers, D. E., Q. Zhang, P. A. Eichen, G. E. Rottinghaus, G. B. Garner, and M. R.
Ellersieck. 1995. Temperature-dependent responses of rats to ergovaline derived from endophyte-infected tall fescue. J. Anim. Sci. 73: 1954-1961.
300
Spiers, D. E., P. A. Eichen, and G. E. Rottinghaus. 2001. Refinement of a rat model to study fescue toxicosis I. Temporal differences. Southern Extension and Research Activity Information Exchange Group – 8 (SERAIEG – 8), Nashville, TN, p. 32.
Spiers, D. E., P. A. Eichen, and G. E. Rottinghaus. 2005a. A model of fescue toxicosis:
Responses of rats to intake of endophyte-infected tall fescue. J. Anim. Sci. 83: 1423-1434.
Spiers, D. E., T. J. Evans, and G. E. Rottinghaus. 2005b. Interactions between thermal
stress and fescue toxicosis: animal models and new perspectives. In: eotyphodium in Cool-Season Grasses. (C. A. Roberts, C. P. West, and D. E. Spiers, Eds.) pp. 243–270 Blackwell Publ., Ames, IA.
Stuedemann, J. A., T. S. Rumsey, J. Bond, S. R. Wilkinson, L. P. Bush, D. J. Williams,
and A. B. Caudle. 1985. Association of blood cholesterol with occurrence of fat necrosis in cows and tall fescue summer toxicosis in steers. Am. J. Vet. Res. 46: 1990-1995.
Srikandakumar, A. and E. H. Johnson. 2004. Effect of heat stress on milk production,
rectal temperature, respiratory rate and blood chemistry in Holstein, Jersey and Australian milking Zebu cows. Trop. Anim. Health Prod. 36: 685-692.
Steele, R. G. and J. H. Torrie. 1980. Principles and procedures for statistics: A Biometric
Approach. McGraw Hill, New York, p. 633. Storey, J. D. and R. Tibshirani. 2003. Statistical significance for genome-wide studies.
Proc. Nat. Acad. Sci. 100:9440-9445. St-Pierre, N. R., B. Cobanov, and G. Schnitkey. 2003. Economic losses from heat stress
by US livestock industries. J. Dairy Sci. 86: E52-77. Strickland, J. R., J. W. Oliver, and D. L. Cross. 1993. Fescue toxicosis and its impact on
animal agriculture. Vet. Human Tox. 35:454-464. Strickland, J. R., J. W. Oliver, and L. K. Abney. 1996. Assessment of the mitogenic
potential of the alkaloids produced by endophyte (Acremonium coenophialum) – infected tall fescue (Festuca arundinacea) on bovine vascular smooth muscle in vitro. J. Anim. Sci. 74: 1664-1671.
Stuedemann, J. A. and D. H. Seman. 2005. Integrating genetics, environment and
management to minimize animal toxicosis. In: Neotyphodium in Cool-Season Grasses, edited by C.A. Roberts, C.P. West, D.E. Spiers, p. 305-327. Blackwell Publishing, Ames, IA.
Suk, Y. O. and K. W. Washburn, 1995. Effects of environment on growth, efficiency of
feed utilization, carcass fatness, and their association. Poultry Sci. 74: 285–296.
301
Tennant, R. W. 2002. The national center for toxicogenomics: using new technologies to
inform mechanistic toxicology. Environ. Health Perspect. 110: A8-A10. Terrel, E. E. 1979. Taxonomy, morphology, and phylogeny. In: R. C. Buckner and L. P.
Bush (Eds.), Tall fescue, Am. Soc. Agron. Monogr. 20. Madison, WI. p. 31-39. Thompson, W. S., W. W. McClure, and M. Landowne. 1950. Prolonged vasoconstriction
due to ergotamine titrate. Archi. Intern. Med. 85: 691-698. Thompson, F. N. and J. A. Stuedemann. 1993. Pathophysiology of fescue toxicosis. p.
263-272. In: R. Joost and S. Quissenberry (eds.). Acremonium/Grass interaction. Elseview, The Netherlands.
Thompson, F. N., F. A. Stuedemann, and N. S. Hill. 2001. Anti-quality factors associated
with alkaloids in eastern temperature pasture. J. Range Mang. 54: 474-489. Tiedge, M., S. Lortz, R. Munday, and S. Lenzen. 1998. Complementary action of
antioxidant enzymes in the protection of bioengineered insulin-producing RINm5F cells against the toxicity of reactive oxygen species. Diabetes 47: 1578-1585.
Turkington, R. W. 1972. Human prolactin. An ancient molecule provides new insights
for clinical medicine. Am. J. Med. 53: 389-394. Tusher, V. G., R. Tibshirani, and G. Chu. 2001. Significance analysis of microarrays
applied to the ionizing radiation response. Proc. Nat. Acad. Sci. 98:5116-5121. Valentine, B. A., J. T. Blue, S. M. Shelley, and B. J. Cooper. 1990. Increased serum
alanine aminotransferase activity associated with muscle necrosis in the dog. J. Vet. Intern. Med. 4: 140-143.
van Gelder, R. N., M. E. von Zastrow, A. Yool, W. C. Dement, J. D. Barchas, and J. H.
Eberwine. 1990. Amplified RNA synthesized from limited quantities of heterogeneous Cdna. Proc. Nat. Acad. Sci. 87: 1663-1667.
Varney, D. R., L. A. Varney, P. M. Zavos R. W. Hemken RW, M. D. Wiglesworth, and
M. R. Siegel. 1991. Tall fescue endophyte: effect on congenital development and pup growth in mice. J. Dairy Sci. 74: 460-465.
Vazquez, N., E. Diaz, C. Fernandez, V. Jimenez, A. Esquifino and B. Diaz. 2006.
Seasonal variations of gonadotropins and prolactin in the laboratory rat. Role of maternal pineal gland. Physiol. Res. Feb 23 (Epub ahead of print).
302
Verhagen, A. M., B. S. Coulson, L. E. Otterbein, J. Anrather, E. Tobiasch, F. H. Bach, A, M. Choi, and M. P. Soares. 2001. Inhibitor of apoptosis proteins and their relatives. Genome Biol. 2:3001-3010.
Wagner, M., E. Halibasic, H. U. Marschall, G. Zollner, P. Fickert, C. Langner, K.
Zatluoukal, H. Denk, and M. Trauner. 2005. CAR and PXR agonists stimulate hepatic bile acid and bilirubin detoxification and elimination pathways in mice. Hepatol. 42: 266-269.
Wallace, L. L., D. W. Vogt, R. J. Lipsey, G. B. Garner, and C. N. Cornell. 1996. Effects
of environmental heat and intake of tall fescue seed infested with Acremonium coenophialum on the acid-base status of young bulls. J. Vet. Diagn. Invest. 8: 233-237.
Warren, W.P., F.A. Martz, K.H. Asay, E.S. Hilderbrand, C.G. Payne, and J.R. Vogt.
1974. Digestibility and rate of passage by steers fed tall fescue, alfalfa and orchardgrass hay in 18 and 32 C ambient temperatures. J. Anim. Sci. 39: 93-38.
Washburn, K.W., R. Peavey, and G. M. Renwick, 1980. Relationship of strain variation
and feed restriction to variation in blood pressure response to heat stress. Poultry Sci. 59: 2586–2588.
Waters, M., G. Boorman, P. Bushel, M. Cunningham, R. Irwin, and A. Merrick. 2003.
Systems toxicology and the chemical effects in biological systems (CEBS) knowledge base. Environ. Health Perspect. 1111: 811-824.
Waxman, D.J. 1999. P450 gene induction by structurally diverse xenochemicals: central
role of nuclear receptors CAR, PXR, and PPAR. Arch. Biochem. Biophys. 369: 11-23.
Wein, M. 1995. Comparison of human eosiniophil and neutrophil ligands for P-selectin:
ligands for P-selectin differ from those for E- selectin. Am. J. Respir. Cell Mol. Biol. 12: 315-319.
Wellman, P. J., B. T. Davies, and A. Morien. 1993. Modulation of feeding by
hypothalamic paraventrucular nucleus alpha 1- and alpha 2 adrenergic receptors. Life Sci. 53: 669-679.
West, J. W. 2003. Effects of heat-stress on production in dairy cattle. J. Dairy Sci. 86:
2131-2144. Wettemann, R. P. and H. A. Tucker. 1976. The influence of low and elevated ambient
temperature on prolactin concentration in serum of Holstein and Brahman X Hereford heifers. J. Anim. Sci. 55: 391-398.
303
Wheeler, M. D., M. Nakagami, B.U. Bradford, T. Uesugi, R.P. Mason, H.D. Connor, A. Dikalova, M. Kadiiska,and R.G. Thurman. 2001. Overexpression of manganese superoxide dismutase prevents alcohol-induced liver injury in the rat. J. Biol. Chem. 39: 36664-36672.
White, C. A. and L. A. Salamonsen. 2005. A guide to issues in microarray analysis:
application to endometrial biology. Reprod. 130: 1-13. Wolfinger, R. D., G. Gibson, E. D. Wolfinger, L. Bennett, H. Hamadeh, P. Bushel, C.
Afshari, and R. S. Paules. 2001. Assessing gene significance from cDNA microarray expression data via mixed models. J. Comp. Biol. 8: 625-637.
Wu, C. 1995. Heat shock transcription factors: structure and regulation. Annul. Rev. Cell
Dev. Boil. 11: 441-469. Wu, H., K. Kerr, and G. Churchill. 2003. Maanova: A software package for the analysis
of spotted cDNA microarray experiments. In the analysis of gene expression data: An overview of methods and software. P 313-431. Springer, New York.
Xu. C., C. Y. Li, A. and N. Kong. 2006. Induction of phase I, II and III drug
metabolism/transport by xenobiotics. Arch. Pharm. Res. 28: 249-268. Yamashita, N., S. Hoshida, N. Taniguchi T. Kuzuya, and M. Hori. 1998. Whole-body
hyperthermia provides biphasic cardioprotection against ischemia/reperfusion injury in the rat. Circ. 98: 1414-1421.
Yamazaki, H., A. Okayama, N. Imai, N., F. P. Guengerich, and M. Shimizu. (2006).
Inter-individual variation of cytochrome P4502J2 expression and catalytic activities in liver microsomes from Japanese and Caucasian populations. Xenobiotica. 36: 1201-1209.
Yang, Y. H. and T. Speed. 2002. Design issues for cDNA microarray experiments.
Nature Reviews Genetics 3: 579-588. Yang, Y. H., S. Dudoit, P. Luu, D. M. Lin, V. Peng, J. Ngai, and T. P. Speed. 2002.
Normalization for cDNA microarray data: a robust composite method addressing single and multiple slide systematic variation. Nucleic Acid Res. 30:15-20.
Yates, S. G., R. D. Plattner, and G. B. Garner. 1985. Detection of ergopeptine alkaloids in
endophyte-infected, toxic KY-31 tall fescue by mass spectroscopy/mass spectroscopy. J. Agric. Food Chem. 33: 719-722.
Yoshida, M., E. Muneyuki, and T. Hisabori. 2001. ATP synthase - a marvelous rotary
engine of the cell. Nat. Rev. Mol. Cell Biol. 2: 669-677.
304
Zanzalari, K. P., R. N. Heitmann, J. B. McLaren, and H. A. Fribourg. 1989. Effects of endophyte-infected fescue and cimetidine on respiration rates, rectal temperature and hepatic mixed function oxidase activity as measured by hepatic antipyrine metabolism in sheep. J. Anim. Sci. 67: 3370-3378.
Zavos, P.M., A. H. Cantor, R. W. Hemken, R. J. Grove, D. R. Varney, and M. R. Siegel.
1993. Reproductive performance of Japanese quail fed tall fescue seed infected with Acremonium coenophialum. Theriogenol. 39: 1257-1266.
Zhang, Q., D. E. Spiers, G. E. Rottinghaus, and G. B. Garner. 1994. Thermoregulatory
effects of ergovaline isolated from endophyte-infected tall fescue seed on rats. J. Agric. Food Chem. 42: 954–958.
Zhang, Y., M. A. Mian, K. Chekhovskiy, S. So, D. Kupfer, H. Lai, and B. A. Roe. 2005.
Differential gene expression in Festuca under heat stress conditions. J. Exp. Bot. 56: 897-907.
Ziegler, D. M. 2002. An overview of the mechanism, substrate specificities, and
structures of FMOs. Drug Metab. Rev. 34: 503-511. Zuber, R., Eva Anzenbacherova, and P. Anzenbacher. 2002. Cytochrome P450 and
experimental models of drug metabolism. J. Cell. Mol. Med. 6: 189-198. Zulkifli, I., M. T. Che Norma, D. A. Israf, and A. R. Omar. 2000. The effect of early age
feed restriction on subsequent response to high environmental temperatures in female broiler chickens. Poultry Sci. 79: 1401-1407.

305
APPENDICES
306
APPENDIX 1
IMPLANTING MINI MITTERS IN RATS
Male Sprague Dawley male rats were anesthetized using a mixture of ketamine (87
mg/ml) and xylazine (13 mg/ml) administered intramuscularly at 0.1 mg/100 g BW.
Then, the abdominal area was shaved with a fine hair clipper and scrubbed with iodine
solution (betadione) and with alcohol. A midline incision (2 to 3 cm) was made to the
outer skin layer using a scalpel. Using the blunt edge of a haemostat, the peritoneal cavity
was carefully penetrated and the opening was widened enough just to allo insertion of the
coater transmitter into the peritoneal cavity. After assuring the absence of any internal
bleeding by the cut, the incision was sutured using a sterile, synthetic, absorbable suture
[coated VICRYL/Braided (polyglactin 910) /2.0; 3.0 metric] using a cutter suturing
needle. Two to three interrupted sutures were first used to close the inner layer and
another 2 to 3 sutures were used to close the outer skin. The site was then scrubbed with
iodine and alcohol, and the rats were monitered closely until recovered from anesthesia
on a warming pad.
307
APPENDIX 2
RNA EXTRACTION Take 4 ml of Buffer RLT in a 15 ml tube; add 40 µl of beta mercapto ethanol to it.
Take tissue from – 80 freezer (Max wt of tissue shouldn’t exceed 250 mg).
Add tissue sample to buffer RLT and homogenize the tissue.
Centrifuge the tissue lysate for 10 min at 4000 g.
Carefully transfer the supernatant to a new 15 ml tube by pipeting.
Add equal volume of 70% ethanol to the homogenized lysate and mix immediately by
shaking vigorously.
Apply the sample to an RNeasy midi column placed in 15 ml centrifuge tube. Make sure
the maximum loading volume does not exceed 4.0 ml.
Centrifuge for 5 min at 4000 g. Discard the flow through.
Add 4.0 ml of buffer RW1 to the RNeasy column. Centrifuge for 5 min at 4000g. Discard
the flow through.
Add 2.5 ml of buffer RPE to the RNeasy column. Centrifuge for 2 min at 4000g. Discard
the flow through.
Add 2.5 ml of buffer RPE to the RNeasy column. Centrifuge for 5 min at 4000g. Discard
the flow through.
Transfer the RNeasy column to a new 15 ml collection tube. Pipet the appropriate volume
of RNase free water (200 micro lit) directly onto the RNeasy silica-gel membrane.
Let it stand for 1 min. and then centrifuge for 3 min at 4000 g.
Repeat the above step again.
Go to nanodrop to check the RNA concentration.
308
APPENDIX 3
DNase TREATMENT FOR RNA SAMPLE Add 0.1 volume of DNase 1 buffer to the RNA sample.
Add 2 ul of DNase 1 to it (if volume ≤ 200 ul. If volume ≥ 200 ul, add 4 ul).
Mix gently.
Incubate at 37 C for 30 min.
DNase Inactivation Heat the DNase treated sample tube at 70 C for 5 min.
Take two new phase lock tubes (per sample) and spin for 1-2 min at max speed (room
temp).
Transfer the DNase treated sample into first phase lock tube.
Add equal volume of phenol:chloroform:isoamyl alcohol (25: 24: 1) to the RNA sample
in phase lock tube.
Immediately after adding both invert it for 4-5 times. then keep in ice and then go for
second sample.
Then incubate on ice for 10 min.
Centrifuge at 14000 rpm for 5 min (at room temp).
Transfer the top layer onto the new phase lock gel tube.
To this add equal volume of chloroform. Mix well.
Incubate on ice for 10 min.
Centrifuge for 5 min at 14000 rpm (room temp).
Transfer the supernatant into new tube and go ahead with the microcon purification.
Microcon Purification
309
Insert microcon reservoir into the vial.
Pipette RNA soln. into sample reservoir.
Centrifuge at 10000 g for 15 min at 4 C.
Transfer the flow through into a new vial.
Add equal volume of nano water to filter and spin at 10000 rpm for 10 min at 4 C.
Transfer the filter to a new vial in upright position and spin at 1000 rpm for 3-4 min.
Go to nanodrop. Desired concentration is 1 ug/ul.
310
APPENDIX 4
1 - 2% AGAROSE GEL ELECTROPHORESIS Weigh 0.5 to 1 gm of agar -- add it in conical flask.
Take 5 ml of 5% TBE and add 45 ml of nanowater. Mix the solution gently by inversion.
Add this to the agar in conical flask.
Microwave the agar solution for 1 to 2 minutes.
After little cooling add 3 ul of ethydium bromide to agar and mix well.
In the mean time, clean the gel boat and comb with distilled water and prepare 1X TBE
(500 ml).
Add the gel onto the boat and let it solidify.
After solidification, add 1% TBE to the gel boat.
Take 2 ul of RNA, 8 ul of water and 3 ul of loading buffer in 0.5 ml tube and load this
mixture to the well.
Add 3 ul of 100 bp DNA ladder to the left extreme well.
Connect positive (red) and negative (black) to the corresponding terminals and switch to
75 – 100 V for 30-45 min.
Visualize the gel under UV light.
311
APPENDIX 5
MICROARRAY SLIDE QUALITY CONTROL CHECK WITH RANDOM
OLIGONUCLEOTIDES
Dilute the random 9-mers oligo 1/10 in hybridization buffer
Apply the mix to a slide prehybridized with I-block
Hybridize for 5 to 6 hours at room temperature
Wash in solution 1 by moving the rack up and down 20 times then by shaking slowly for
2 minutes
Transfer slide to another rack and wash in solution 2
Wash for one minute in ultra pure water
Centrifuge for five minutes in centrivap without using the vacuum
Scan with laser power at 100% and PMT set at 500
Reagents:
Hybridization solution: 5x SSC, 0.1% SDS, 1Mm dtt
9 mers oligonucleotides: catalog # P-21681 from Molecular Probes (Product name:
Panomer 9 random oligodeoxynucleotide, Alexa fluor 546
conjugate)
MW is 4386.6, resuspended in 1X TE at 100 ng/µl
Washing solution 1: 1X SSC and 0.05% SDS
Washing solution 2: 1X SSC
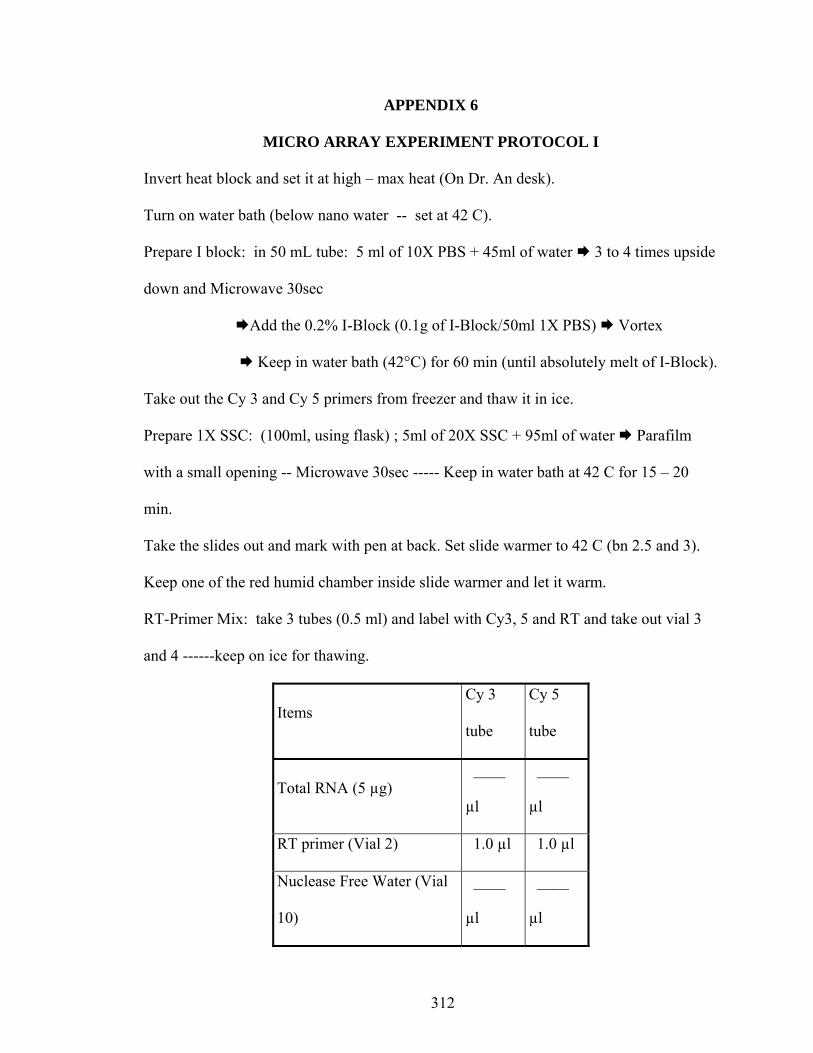
312
APPENDIX 6
MICRO ARRAY EXPERIMENT PROTOCOL I Invert heat block and set it at high – max heat (On Dr. An desk).
Turn on water bath (below nano water -- set at 42 C).
Prepare I block: in 50 mL tube: 5 ml of 10X PBS + 45ml of water 3 to 4 times upside
down and Microwave 30sec
Add the 0.2% I-Block (0.1g of I-Block/50ml 1X PBS) Vortex
Keep in water bath (42°C) for 60 min (until absolutely melt of I-Block).
Take out the Cy 3 and Cy 5 primers from freezer and thaw it in ice.
Prepare 1X SSC: (100ml, using flask) ; 5ml of 20X SSC + 95ml of water Parafilm
with a small opening -- Microwave 30sec ----- Keep in water bath at 42 C for 15 – 20
min.
Take the slides out and mark with pen at back. Set slide warmer to 42 C (bn 2.5 and 3).
Keep one of the red humid chamber inside slide warmer and let it warm.
RT-Primer Mix: take 3 tubes (0.5 ml) and label with Cy3, 5 and RT and take out vial 3
and 4 ------keep on ice for thawing.
Items Cy 3
tube
Cy 5
tube
Total RNA (5 µg) ____
µl
____
µl
RT primer (Vial 2) 1.0 µl 1.0 µl
Nuclease Free Water (Vial
10)
____
µl
____
µl
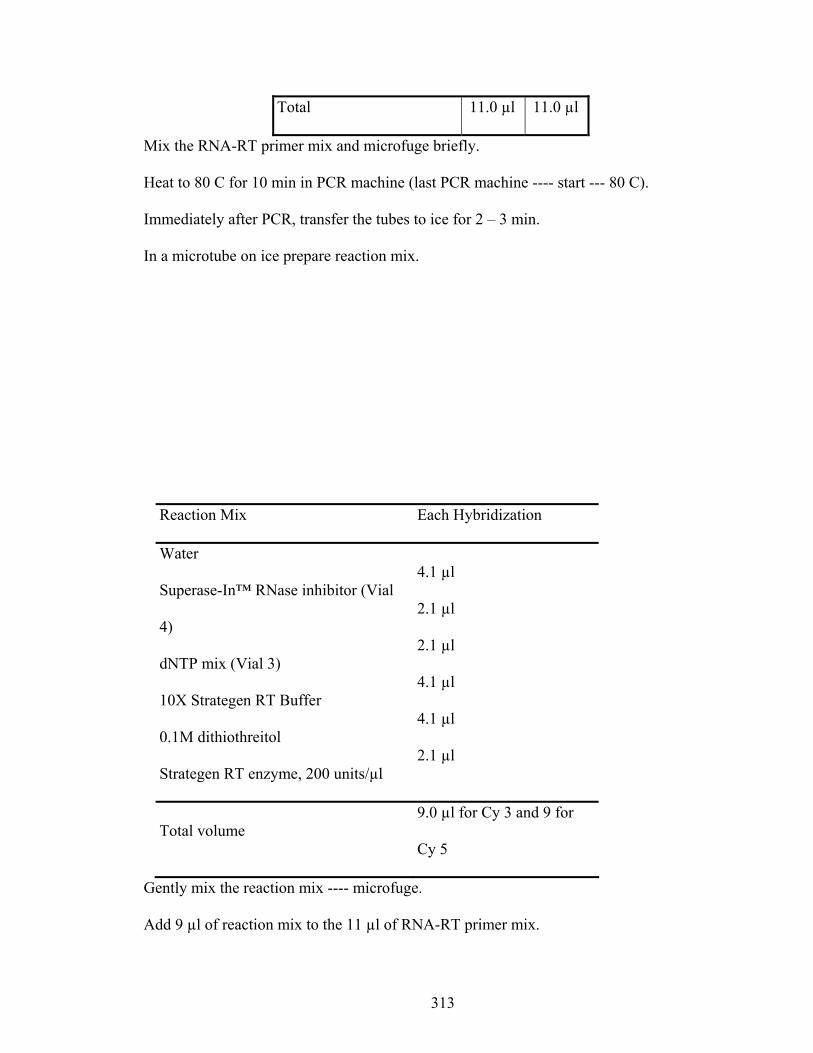
313
Total 11.0 µl 11.0 µl
Mix the RNA-RT primer mix and microfuge briefly.
Heat to 80 C for 10 min in PCR machine (last PCR machine ---- start --- 80 C).
Immediately after PCR, transfer the tubes to ice for 2 – 3 min.
In a microtube on ice prepare reaction mix.
Reaction Mix Each Hybridization
Water
Superase-In™ RNase inhibitor (Vial
4)
dNTP mix (Vial 3)
10X Strategen RT Buffer
0.1M dithiothreitol
Strategen RT enzyme, 200 units/µl
4.1 µl
2.1 µl
2.1 µl
4.1 µl
4.1 µl
2.1 µl
Total volume 9.0 µl for Cy 3 and 9 for
Cy 5
Gently mix the reaction mix ---- microfuge.
Add 9 µl of reaction mix to the 11 µl of RNA-RT primer mix.
314
Incubate at 42 C for 2 hours at PCR machine (start --- 42 C).
Take SSC from water bath, pour in the red humidification chamber present in slide
heater.
Take one slide, keep in humid chamber with array facing down, count 5, take 2nd slide
and count from 5 to 10, 3rd slide and count from 10 to 15. continue counting until 30.
then take the first slide and keep on the inverted hot block --- count 5. take out and keep
on the second red humid chamber. Repeat it for all the slides. (Note: slides on SSC for
30 s and on heat block for 5 s).
Take the humid chamber with slides to UV light (all slides at once) ---- ON ----Start.
Take the plastic slide case --- put slides in it after UV ----get the I block from water bath -
---Vortex --- fill it to top------parafilm ---- keep in hybridization oven for 1 hour.
Prepare 0.2% SDS (500ml, using flask): 10ml of 10% SDS + 490ml of water. (Room
Tm.)
Washes: after one hour ---
Wash slides in 0.2% SDS (Room Temp.) by plunging the rack up and down 20 times then
shaking gently for 2 minutes.
Wash slides in ddH2O by plunging the rack up and down 20 times then shaking gently
for 2 minutes.(1st wash)
Wash slides in ddH2O by plunging the rack up and down 20 times then shaking gently
for 2 minutes.(2nd wash)
Centrifuge for 5 minutes. The array side of slides must put an opposite direction from
spin way.
Store away from light. Keep in slide box.
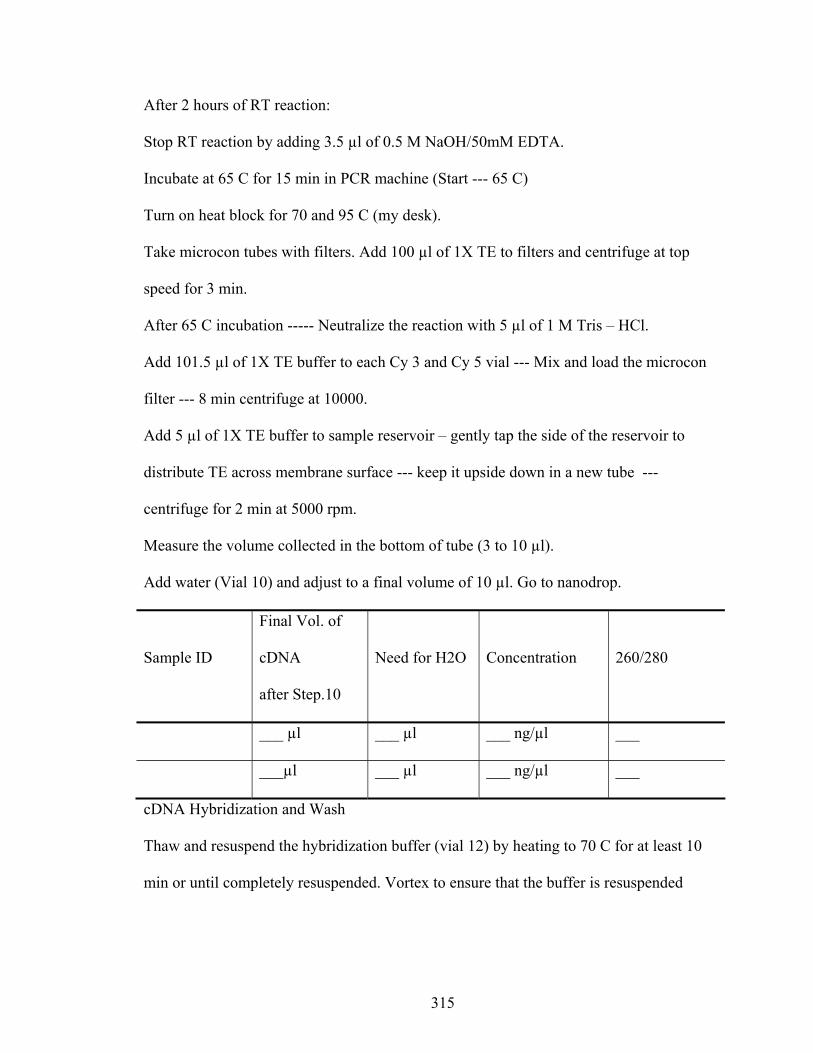
315
After 2 hours of RT reaction:
Stop RT reaction by adding 3.5 µl of 0.5 M NaOH/50mM EDTA.
Incubate at 65 C for 15 min in PCR machine (Start --- 65 C)
Turn on heat block for 70 and 95 C (my desk).
Take microcon tubes with filters. Add 100 µl of 1X TE to filters and centrifuge at top
speed for 3 min.
After 65 C incubation ----- Neutralize the reaction with 5 µl of 1 M Tris – HCl.
Add 101.5 µl of 1X TE buffer to each Cy 3 and Cy 5 vial --- Mix and load the microcon
filter --- 8 min centrifuge at 10000.
Add 5 µl of 1X TE buffer to sample reservoir – gently tap the side of the reservoir to
distribute TE across membrane surface --- keep it upside down in a new tube ---
centrifuge for 2 min at 5000 rpm.
Measure the volume collected in the bottom of tube (3 to 10 µl).
Add water (Vial 10) and adjust to a final volume of 10 µl. Go to nanodrop.
Sample ID
Final Vol. of
cDNA
after Step.10
Need for H2O Concentration 260/280
___ µl ___ µl ___ ng/µl ___
___µl ___ µl ___ ng/µl ___
cDNA Hybridization and Wash
Thaw and resuspend the hybridization buffer (vial 12) by heating to 70 C for at least 10
min or until completely resuspended. Vortex to ensure that the buffer is resuspended
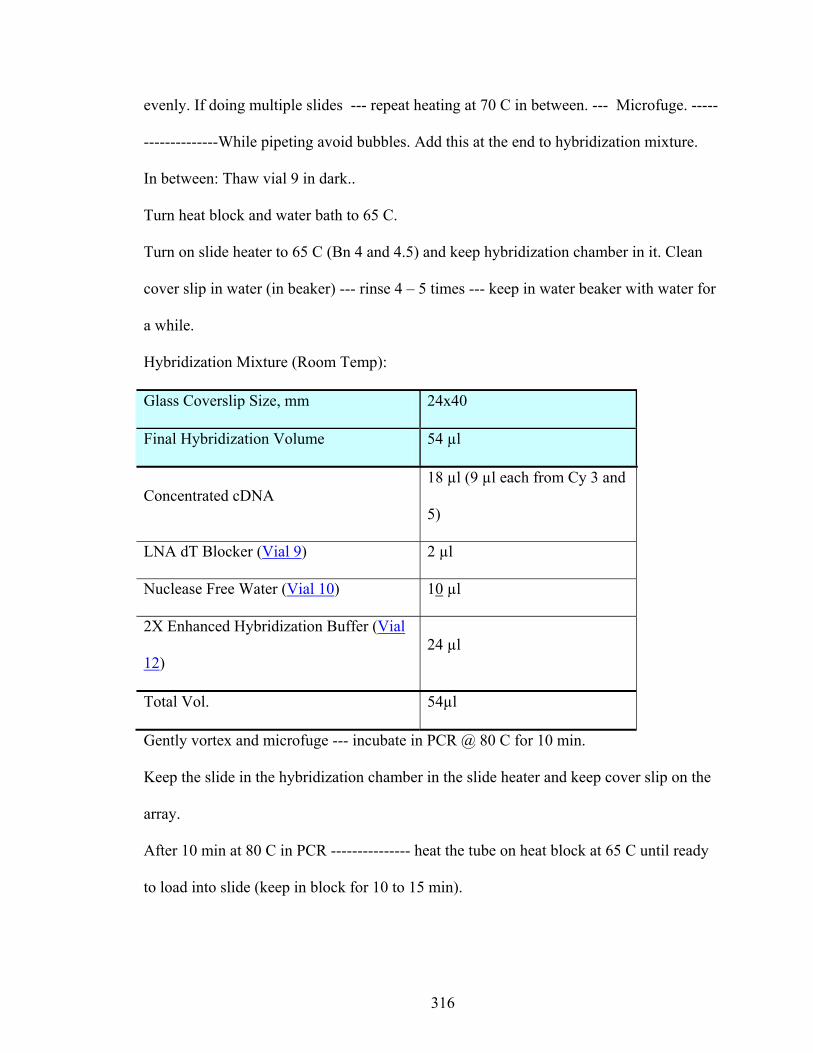
316
evenly. If doing multiple slides --- repeat heating at 70 C in between. --- Microfuge. -----
--------------While pipeting avoid bubbles. Add this at the end to hybridization mixture.
In between: Thaw vial 9 in dark..
Turn heat block and water bath to 65 C.
Turn on slide heater to 65 C (Bn 4 and 4.5) and keep hybridization chamber in it. Clean
cover slip in water (in beaker) --- rinse 4 – 5 times --- keep in water beaker with water for
a while.
Hybridization Mixture (Room Temp):
Glass Coverslip Size, mm 24x40
Final Hybridization Volume 54 µl
Concentrated cDNA 18 µl (9 µl each from Cy 3 and
5)
LNA dT Blocker (Vial 9) 2 µl
Nuclease Free Water (Vial 10) 10 µl
2X Enhanced Hybridization Buffer (Vial
12) 24 µl
Total Vol. 54µl
Gently vortex and microfuge --- incubate in PCR @ 80 C for 10 min.
Keep the slide in the hybridization chamber in the slide heater and keep cover slip on the
array.
After 10 min at 80 C in PCR --------------- heat the tube on heat block at 65 C until ready
to load into slide (keep in block for 10 to 15 min).
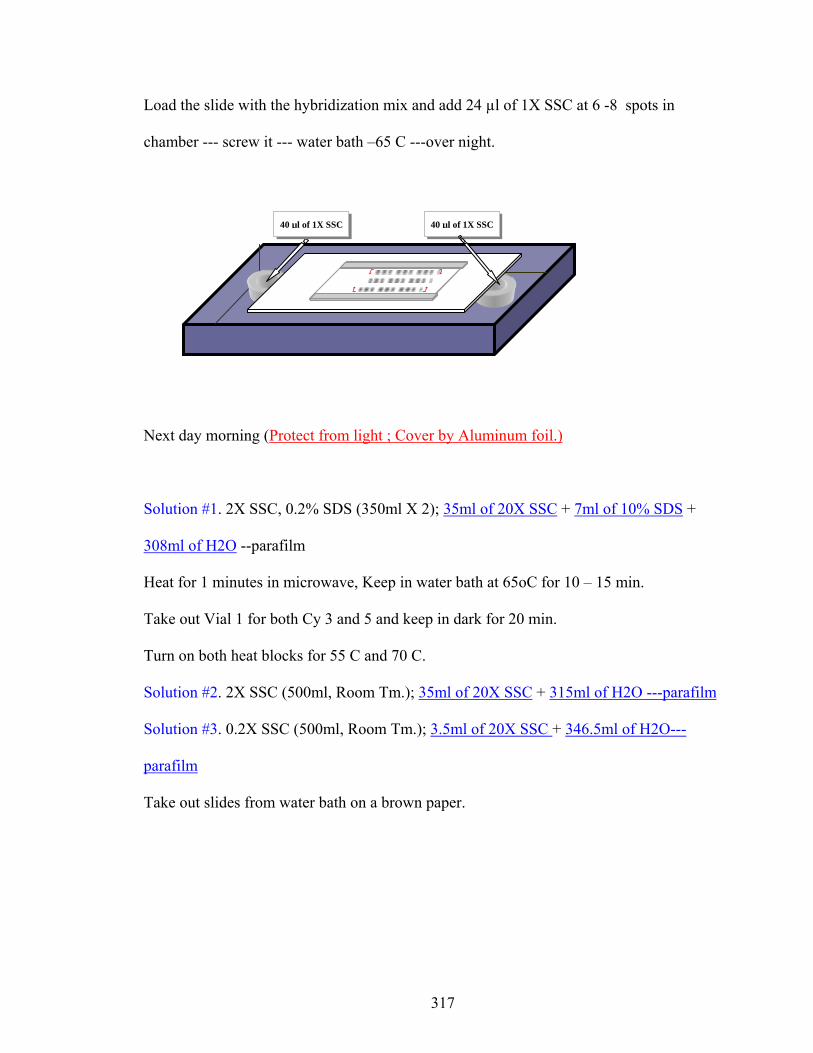
317
Load the slide with the hybridization mix and add 24 µl of 1X SSC at 6 -8 spots in
chamber --- screw it --- water bath –65 C ---over night.
Next day morning (Protect from light ; Cover by Aluminum foil.)
Solution #1. 2X SSC, 0.2% SDS (350ml X 2); 35ml of 20X SSC + 7ml of 10% SDS +
308ml of H2O --parafilm
Heat for 1 minutes in microwave, Keep in water bath at 65oC for 10 – 15 min.
Take out Vial 1 for both Cy 3 and 5 and keep in dark for 20 min.
Turn on both heat blocks for 55 C and 70 C.
Solution #2. 2X SSC (500ml, Room Tm.); 35ml of 20X SSC + 315ml of H2O ---parafilm
Solution #3. 0.2X SSC (500ml, Room Tm.); 3.5ml of 20X SSC + 346.5ml of H2O---
parafilm
Take out slides from water bath on a brown paper.
40 µl of 1X SSC40 µl of 1X SSC
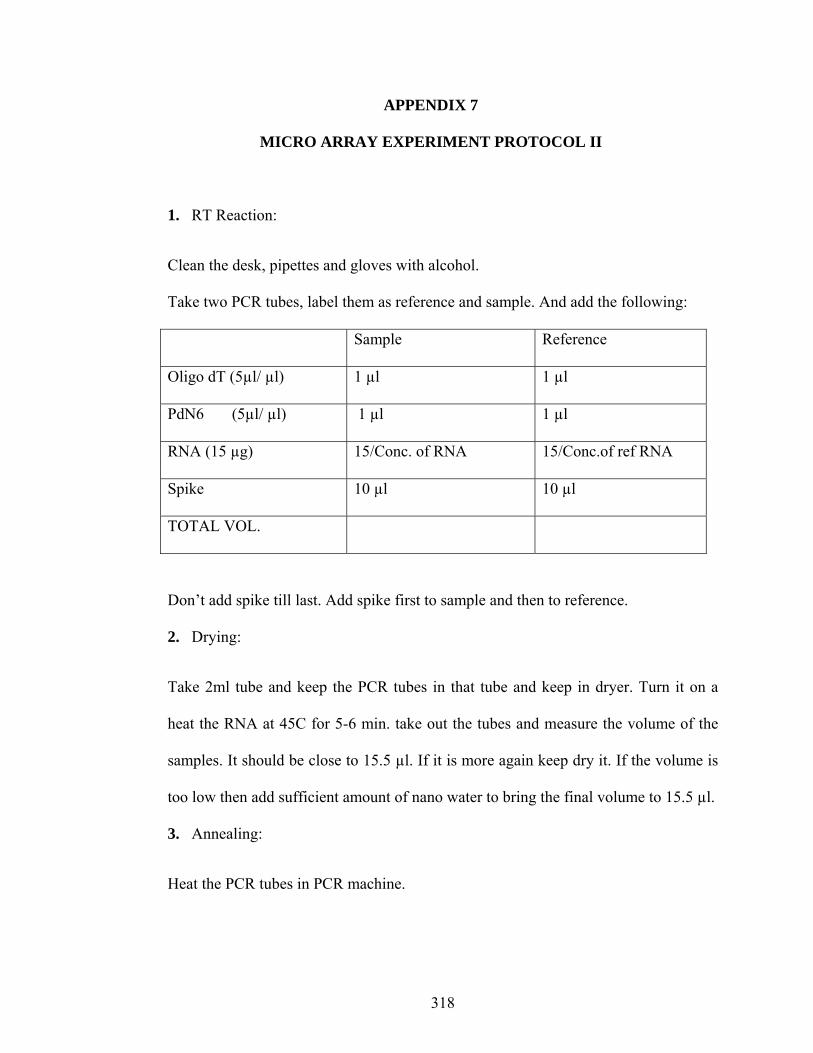
318
APPENDIX 7
MICRO ARRAY EXPERIMENT PROTOCOL II
1. RT Reaction:
Clean the desk, pipettes and gloves with alcohol.
Take two PCR tubes, label them as reference and sample. And add the following:
Sample Reference
Oligo dT (5µl/ µl) 1 µl 1 µl
PdN6 (5µl/ µl) 1 µl 1 µl
RNA (15 µg) 15/Conc. of RNA 15/Conc.of ref RNA
Spike 10 µl 10 µl
TOTAL VOL.
Don’t add spike till last. Add spike first to sample and then to reference.
2. Drying:
Take 2ml tube and keep the PCR tubes in that tube and keep in dryer. Turn it on a
heat the RNA at 45C for 5-6 min. take out the tubes and measure the volume of the
samples. It should be close to 15.5 µl. If it is more again keep dry it. If the volume is
too low then add sufficient amount of nano water to bring the final volume to 15.5 µl.
3. Annealing:
Heat the PCR tubes in PCR machine.
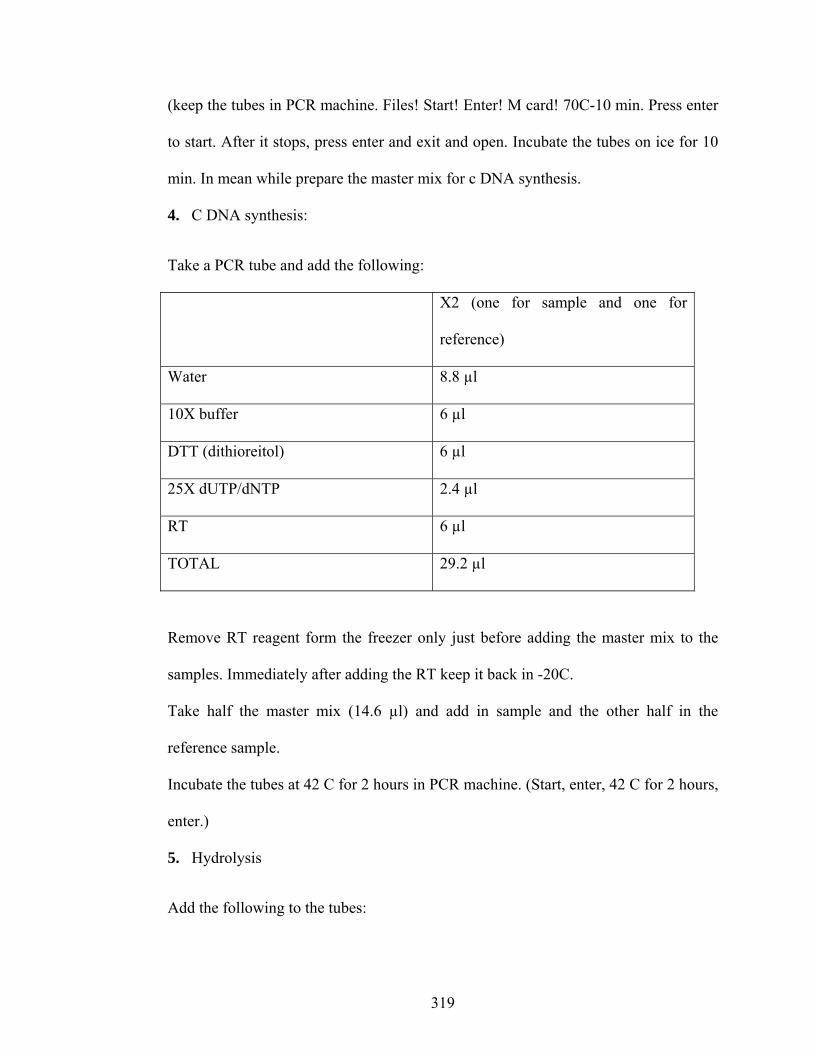
319
(keep the tubes in PCR machine. Files! Start! Enter! M card! 70C-10 min. Press enter
to start. After it stops, press enter and exit and open. Incubate the tubes on ice for 10
min. In mean while prepare the master mix for c DNA synthesis.
4. C DNA synthesis:
Take a PCR tube and add the following:
X2 (one for sample and one for
reference)
Water 8.8 µl
10X buffer 6 µl
DTT (dithioreitol) 6 µl
25X dUTP/dNTP 2.4 µl
RT 6 µl
TOTAL 29.2 µl
Remove RT reagent form the freezer only just before adding the master mix to the
samples. Immediately after adding the RT keep it back in -20C.
Take half the master mix (14.6 µl) and add in sample and the other half in the
reference sample.
Incubate the tubes at 42 C for 2 hours in PCR machine. (Start, enter, 42 C for 2 hours,
enter.)
5. Hydrolysis
Add the following to the tubes:
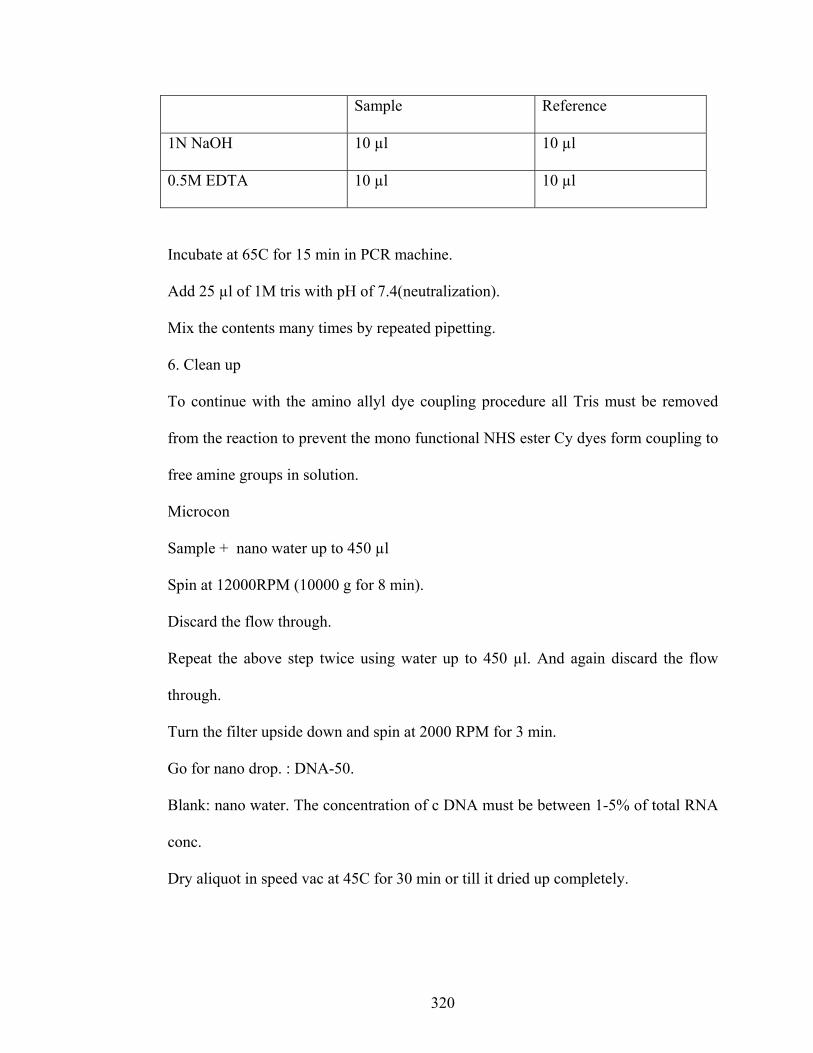
320
Sample Reference
1N NaOH 10 µl 10 µl
0.5M EDTA 10 µl 10 µl
Incubate at 65C for 15 min in PCR machine.
Add 25 µl of 1M tris with pH of 7.4(neutralization).
Mix the contents many times by repeated pipetting.
6. Clean up
To continue with the amino allyl dye coupling procedure all Tris must be removed
from the reaction to prevent the mono functional NHS ester Cy dyes form coupling to
free amine groups in solution.
Microcon
Sample + nano water up to 450 µl
Spin at 12000RPM (10000 g for 8 min).
Discard the flow through.
Repeat the above step twice using water up to 450 µl. And again discard the flow
through.
Turn the filter upside down and spin at 2000 RPM for 3 min.
Go for nano drop. : DNA-50.
Blank: nano water. The concentration of c DNA must be between 1-5% of total RNA
conc.
Dry aliquot in speed vac at 45C for 30 min or till it dried up completely.
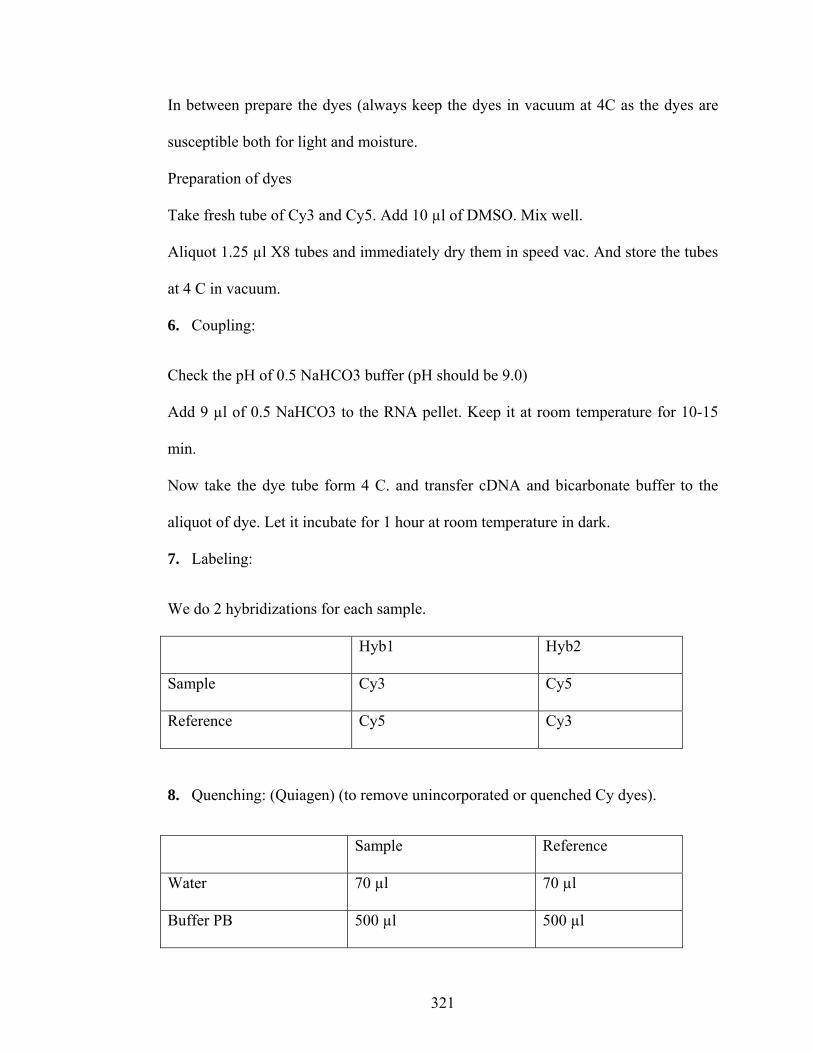
321
In between prepare the dyes (always keep the dyes in vacuum at 4C as the dyes are
susceptible both for light and moisture.
Preparation of dyes
Take fresh tube of Cy3 and Cy5. Add 10 µl of DMSO. Mix well.
Aliquot 1.25 µl X8 tubes and immediately dry them in speed vac. And store the tubes
at 4 C in vacuum.
6. Coupling:
Check the pH of 0.5 NaHCO3 buffer (pH should be 9.0)
Add 9 µl of 0.5 NaHCO3 to the RNA pellet. Keep it at room temperature for 10-15
min.
Now take the dye tube form 4 C. and transfer cDNA and bicarbonate buffer to the
aliquot of dye. Let it incubate for 1 hour at room temperature in dark.
7. Labeling:
We do 2 hybridizations for each sample.
Hyb1 Hyb2
Sample Cy3 Cy5
Reference Cy5 Cy3
8. Quenching: (Quiagen) (to remove unincorporated or quenched Cy dyes).
Sample Reference
Water 70 µl 70 µl
Buffer PB 500 µl 500 µl
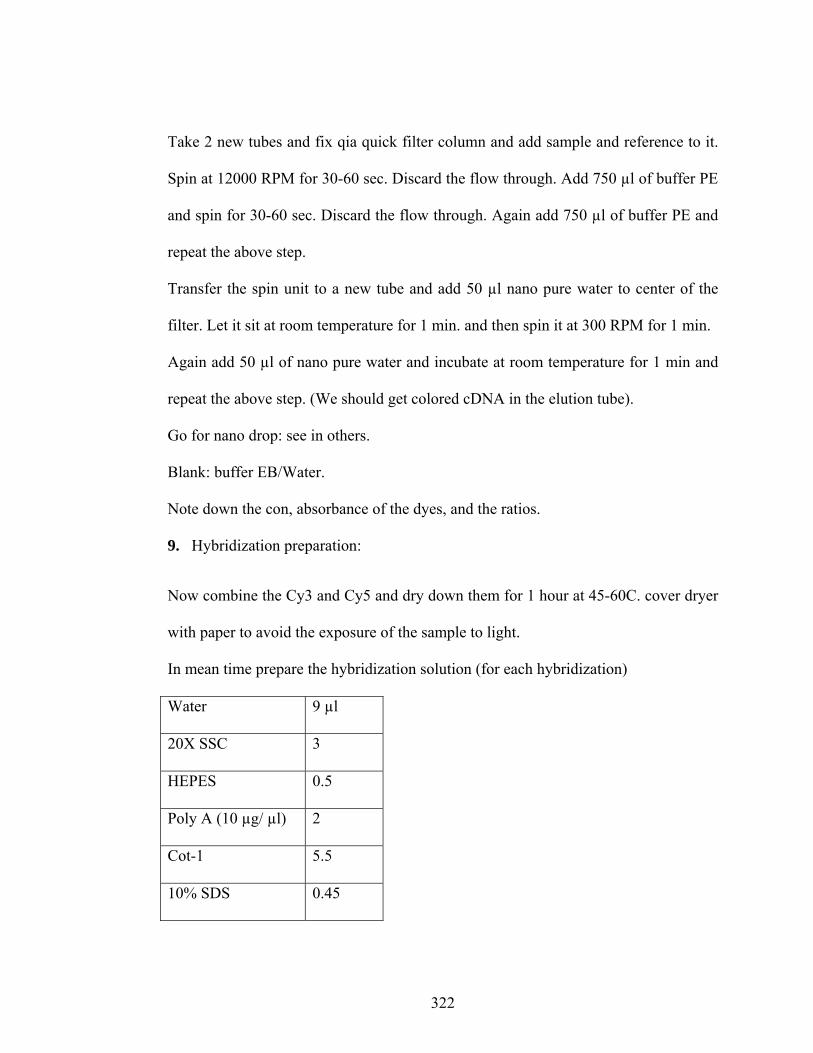
322
Take 2 new tubes and fix qia quick filter column and add sample and reference to it.
Spin at 12000 RPM for 30-60 sec. Discard the flow through. Add 750 µl of buffer PE
and spin for 30-60 sec. Discard the flow through. Again add 750 µl of buffer PE and
repeat the above step.
Transfer the spin unit to a new tube and add 50 µl nano pure water to center of the
filter. Let it sit at room temperature for 1 min. and then spin it at 300 RPM for 1 min.
Again add 50 µl of nano pure water and incubate at room temperature for 1 min and
repeat the above step. (We should get colored cDNA in the elution tube).
Go for nano drop: see in others.
Blank: buffer EB/Water.
Note down the con, absorbance of the dyes, and the ratios.
9. Hybridization preparation:
Now combine the Cy3 and Cy5 and dry down them for 1 hour at 45-60C. cover dryer
with paper to avoid the exposure of the sample to light.
In mean time prepare the hybridization solution (for each hybridization)
Water 9 µl
20X SSC 3
HEPES 0.5
Poly A (10 µg/ µl) 2
Cot-1 5.5
10% SDS 0.45
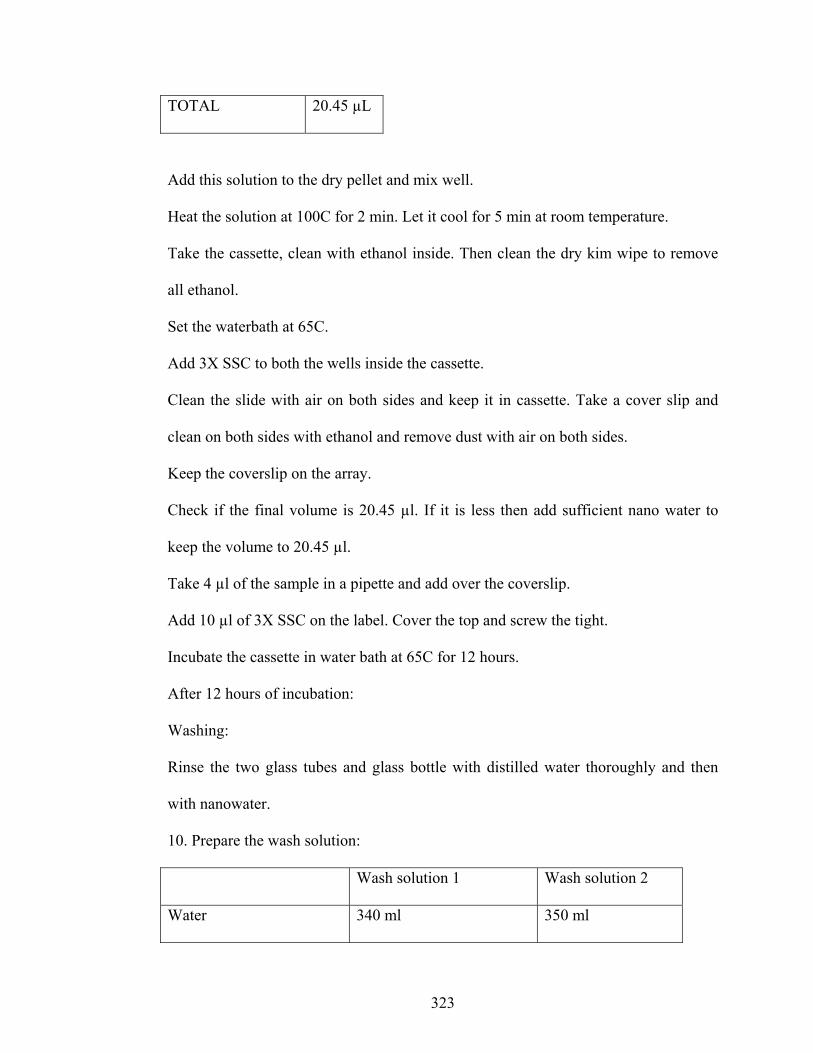
323
TOTAL 20.45 µL
Add this solution to the dry pellet and mix well.
Heat the solution at 100C for 2 min. Let it cool for 5 min at room temperature.
Take the cassette, clean with ethanol inside. Then clean the dry kim wipe to remove
all ethanol.
Set the waterbath at 65C.
Add 3X SSC to both the wells inside the cassette.
Clean the slide with air on both sides and keep it in cassette. Take a cover slip and
clean on both sides with ethanol and remove dust with air on both sides.
Keep the coverslip on the array.
Check if the final volume is 20.45 µl. If it is less then add sufficient nano water to
keep the volume to 20.45 µl.
Take 4 µl of the sample in a pipette and add over the coverslip.
Add 10 µl of 3X SSC on the label. Cover the top and screw the tight.
Incubate the cassette in water bath at 65C for 12 hours.
After 12 hours of incubation:
Washing:
Rinse the two glass tubes and glass bottle with distilled water thoroughly and then
with nanowater.
10. Prepare the wash solution:
Wash solution 1 Wash solution 2
Water 340 ml 350 ml
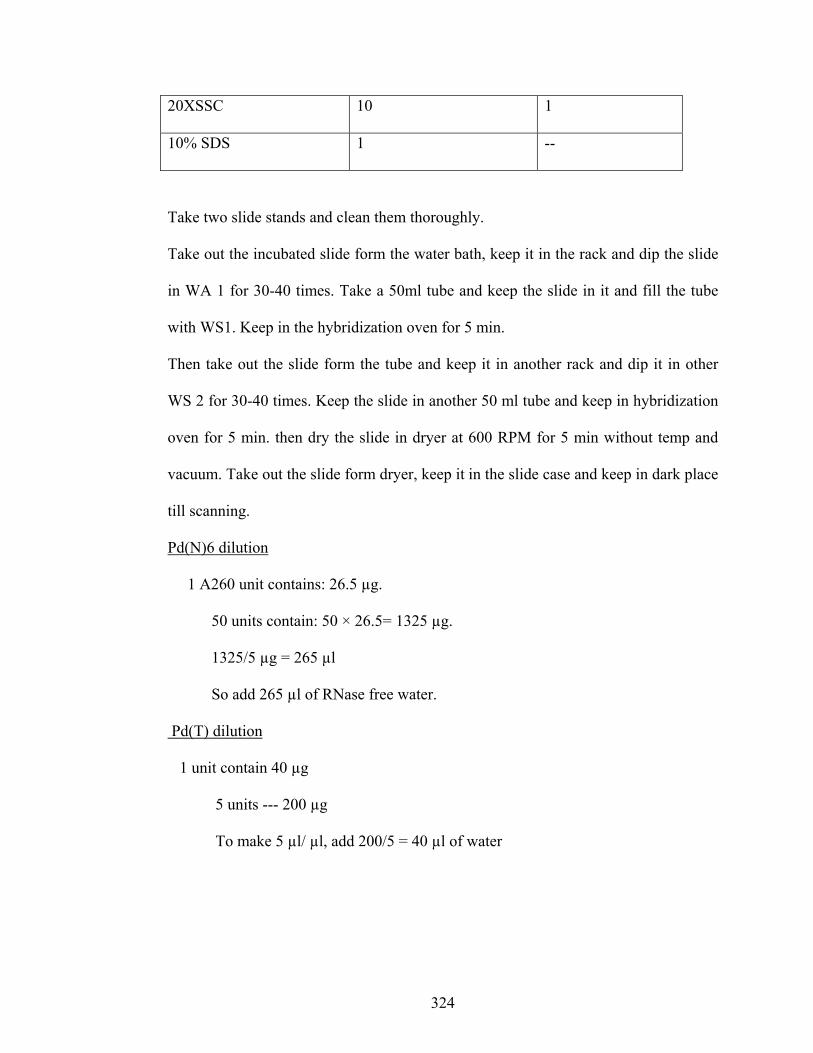
324
20XSSC 10 1
10% SDS 1 --
Take two slide stands and clean them thoroughly.
Take out the incubated slide form the water bath, keep it in the rack and dip the slide
in WA 1 for 30-40 times. Take a 50ml tube and keep the slide in it and fill the tube
with WS1. Keep in the hybridization oven for 5 min.
Then take out the slide form the tube and keep it in another rack and dip it in other
WS 2 for 30-40 times. Keep the slide in another 50 ml tube and keep in hybridization
oven for 5 min. then dry the slide in dryer at 600 RPM for 5 min without temp and
vacuum. Take out the slide form dryer, keep it in the slide case and keep in dark place
till scanning.
Pd(N)6 dilution
1 A260 unit contains: 26.5 µg.
50 units contain: 50 × 26.5= 1325 µg.
1325/5 µg = 265 µl
So add 265 µl of RNase free water.
Pd(T) dilution
1 unit contain 40 µg
5 units --- 200 µg
To make 5 µl/ µl, add 200/5 = 40 µl of water
325
APPENDIX 8
CELL CYCLE ANALYSIS BY PROPIDIUM IODIDE STAINING
(FLOW CYTOMETRY)
Hepatic cells trypsinized, suspended in medium + 10% FCS
Centrifuge (1000 rmp, 5 min)
Pellet suspended in 1ml PBS
After two washings in PBS, pipte cell suspension into 2.5 ml 70% Ethanol. The better
way would be to add ethanol while the cell suspension is on a slow moving vortex just to
avoid clustering of cells during fixation.
Incubate the cell suspension on ice for 15 min
Centrifuge the cell suspension at 1500 rpm for 5 min and discard the supernatant ethanol
Suspend the pellet in 500 micro lit propidium iodide (PI) solution in PBS {50
microgram/ml PI from 50X stock solution (2.5 mg/ml) + 0.1 mg/ml RNase A + 0.05%
Triton X-100}
Incubate for 40 min at 37 C
Add 3 ml of PBS, pellet the cells (1500 rpm, 5 min) and take off the supernatant.
Suspend the pellet in 500 microlit PBS and take for flow analysis.
326
VITA
Raja Sekhar Settivari was born on July 10, 1977, in Somala, Andhra Pradesh,
India. He completed his high school at Kendriya Vidhyalaya, Tirupathi, India. He
finished his Intermediate education at SVK educational institution at Tirupathi, India. He
completed his Bachelor of Veterinary Science & Animal Husbandry degree in October,
2002 from Acharya N. G. Ranga Agricultural University, Tirupathi, India. He then
moved to University of Missouri, Columbia for his Doctor of Philosophy degree in the
Division of Animal Sciences and he graduated with PhD degree in December, 2007. He
has taken up a research fellow position in Pediatrics at Harvard Medical School, Boston.
He is married to Lakshmi Praveena Yarru and has a son, Ashrith Settivari.
Recommended


