Embed Size (px)
Citation preview
Feasibility Study and Business Plan for the Implementation of a Composting
Project and Related Emission Reduction Options
Author:
Produced for the Initiative for coffee & climate
July 2013, Hamburg, Germany
www.coffeeandclimate.org
Author/ Organization: Andre Eitner / Soil & More Intl.
Contact details: Soil & More Intl.
Germany: c/o Projektquartier, Buttstrasse 3, 22767 Hamburg
The Netherlands: Hoofdstraat 24, 3972 LA Driebergen
Email: [email protected]
Telephone: +491795224174
Main contact:
Mika Adler, International Project Manager
Initiative for coffee & climate
c/o E.D.E. Consulting (affiliate of Hanns R. Neumann
Stiftung)
Am Sandtorpark 4 • Coffee Plaza
20457 Hamburg • Germany

Table of Contents
1. Abstract ....................................................................................................................... 5
2. How do Carbon Projects Work? .................................................................................... 9
3. Feasibility Assessment ............................................................................................... 10 a. Centralised Option ................................................................................................................. 10
1. Data Processing and Technical Approach ................................................................................. 13 2. Production and Business Planning ........................................................................................... 13 3. Requirements for a Feasible Centralized Composting Site ........................................................ 17
b. De-Centralized Option ............................................................................................................ 17 1. Baseline Scenario – Current Projects ........................................................................................ 18 2. Status Quo – Current Projects .................................................................................................. 19 3. Further Reduction Scenario – Current Projects ........................................................................ 20 4. Baseline Scenario – IDB Project ................................................................................................ 22 5. Reduction Scenario – IDB Project ............................................................................................. 24
4. Sustainability Flower Quick Assessment ..................................................................... 26 a. Executive Summary ................................................................................................................ 26
1. Preface .................................................................................................................................... 26 2. Results of the Quick Assessment .............................................................................................. 27
b. Benchmarking against Gold Standard Requirements ............................................................... 31
5. The Effect of Compost and Compost Tea ..................................................................... 35 a. General Benefits of Compost .................................................................................................. 35
3. Specific Economic Benefits of Compost for Participating Farmers ............................................ 41
6. Conclusion and next steps .......................................................................................... 44 a. Conclusion on Technical / Financial Feasibility ........................................................................ 44 b. ‘Social’ Feasibility ................................................................................................................... 44 c. The Way Forward ................................................................................................................... 44
1. Setting up The Project ............................................................................................................. 44 2. Integrating existing Monitoring Skills ....................................................................................... 45 3. Scalability to Other Countries / Projects .................................................................................. 45
List of Figures
Figure 1: HRNS Office .............................................................................................................................. 5 Figure 2: Cover Cropping in c&c Farmer Field School ............................................................................... 6 Figure 3: Root Growth Stimulation through Coffee Husk .......................................................................... 7 Figure 4: Comparison Reduction Potential ............................................................................................. 22 Figure 5: Coffee Production in Nicaragua ............................................................................................... 36 Figure 6: ‚Lasso Fungi’ trapping harmful nematodes in the soil .............................................................. 40 Figure 7: Bare Soil in Between Coffee Bushes ........................................................................................ 41 Figure 8: Enhanced Root Growth ........................................................................................................... 42 Figure 9: Coffee Bush with Compost ...................................................................................................... 43 Figure 10: Coffee Bush without Compost ............................................................................................... 43
List of Tables
Table 1: Overview available Input Materials .......................................................................................... 11 Table 2: Overview Economic Indicators ................................................................................................. 12 Table 3: Input and Transport Costs ........................................................................................................ 12 Table 4: Production Planning ................................................................................................................. 14 Table 5: Commercial Planning ................................................................................................................ 15 Table 6: Practices Baseline Current Projects .......................................................................................... 18 Table 7: Emissions Baseline Current Projects ......................................................................................... 19 Table 8: Practices Status Quo Current Projects ...................................................................................... 19 Table 9: Emissions Status Quo Current Projects ..................................................................................... 20 Table 10: Practices Further Reduction Current Projects ......................................................................... 20 Table 11: Emissions Further Reductions Current Projects....................................................................... 21 Table 12: Reduction Potential Overview ................................................................................................ 21 Table 13: Practices Baseline IDB Project ................................................................................................. 23 Table 14: Baseline Emissions IDB Project ............................................................................................... 23 Table 15: Practices Reduction Scenario IDB Project................................................................................ 24 Table 16: Emissions Reduction Scenario IDB Project .............................................................................. 24 Table 17: Overview Aggregated Reduction Potential ............................................................................. 25 Table 18: SusFlower Results ................................................................................................................... 27 Table 19: SusFlower Indicator Key ......................................................................................................... 27 Table 20: Water Footprint ..................................................................................................................... 30 Table 21: ‘Do-No-Harm Assessment’ ...................................................................................................... 32 Table 22: Sustainability Matrix ............................................................................................................... 35

1. Abstract
Soil & More International carried out a feasibility study and business plan for the implementation of a
composting project and related emission reduction options for the Initiative for coffee & climate within
the pilot region of Minas Gerais, Brazil managed and implemented by Hanns R. Neumann Stiftung do Brasil
(HRNS).
Figure 1: HRNS Office
Under the umbrella of the coffee & climate initiative as well as the Força Café project, HRNS currently
works with 4 separate projects to support farmers in adapting sound agricultural & business management
practices.
The 1,698 farmers that participate at the moment own a total of 16,930 ha of land, of which 5,110 ha are
under coffee cultivation, 2,477 are native forest, 7,262 are used for other agricultural purposes (maize,
cow grazing) and the rest is covered by infrastructure.

Soon however, new municipalities will join the program. This extension is funded by the Inter-American
Development Bank (IDB) and will bring a significant number of new farmers into the project. Even though
the exact numbers are not yet available, it is estimated that a total of 4,000 farmers will be then trained
on below-mentioned measures. The project area will cover a total of 39,883 ha, of which 12,000 are likely
to be under coffee, 5,886 under native forest, 17,000 under other agricultural purposes as above and the
rest is used for infrastructure.
Under the initiative for coffee & climate, a toolbox1 of interventions has been developed, which will help
farmers adapt to and mitigate climate change. Examples of this work could be the implementation of
cover cropping. Due to this new practise the project was able to reduce the application of pest control
applications from four to one occasion per year.
Furthermore, continuous field testing with different plants have resulted in a thorough understanding of
the benefits and challenges of cover cropping. One example could be a nitrogen-fixing legume that has
helped increase the soil organic matter content of this particular plot by 0.5 % in just 6 months – which is
considerable.
Figure 2: Cover Cropping in c&c Farmer Field School
1 http://toolbox.coffeeandclimate.org/content/
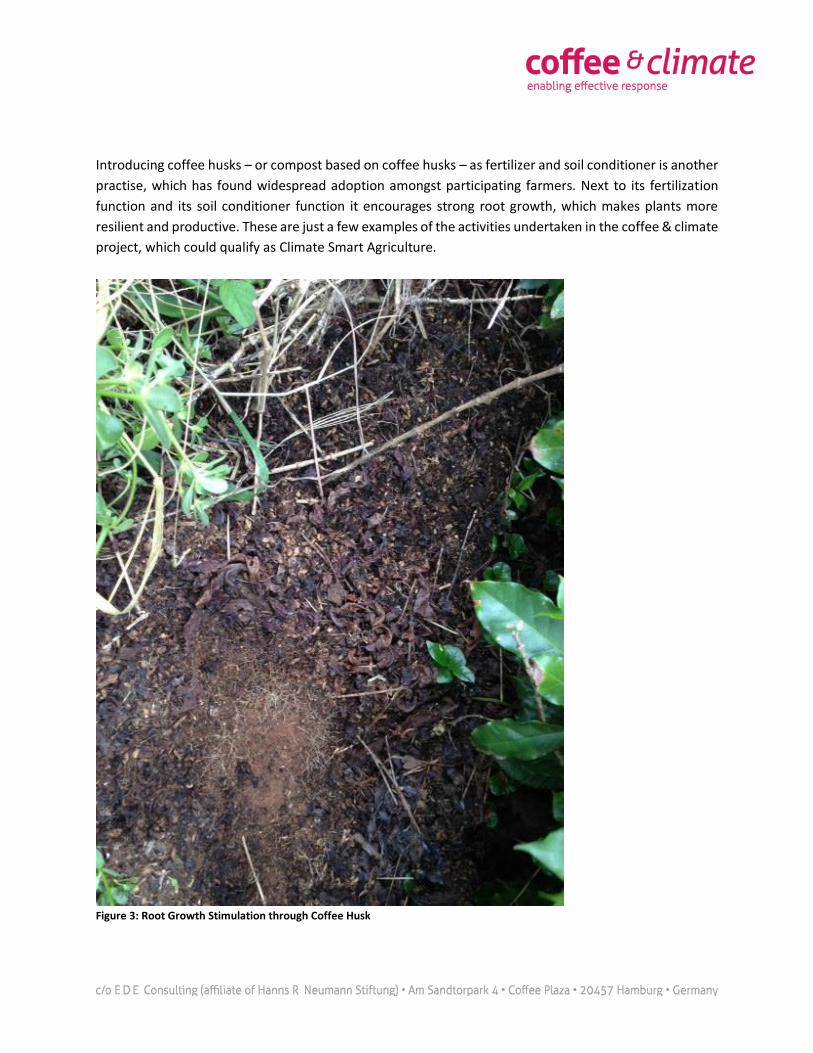
Introducing coffee husks – or compost based on coffee husks – as fertilizer and soil conditioner is another
practise, which has found widespread adoption amongst participating farmers. Next to its fertilization
function and its soil conditioner function it encourages strong root growth, which makes plants more
resilient and productive. These are just a few examples of the activities undertaken in the coffee & climate
project, which could qualify as Climate Smart Agriculture.
Figure 3: Root Growth Stimulation through Coffee Husk
The Gold Standard Foundation – the leading organization for high quality carbon credits – is currently
developing methodologies for the measurement and certification of ‘Climate Smart Agricultural
Practices’. Part of this feasibility study was to identify the possibilities for the HRNS program to benefit
from this development.
The following potential scenarios have been investigated:
1. A centralized composting facility that can supply farmers in the region with high quality compost.
2. A de-centralized approach that includes on-farm composting as well as the implementation and
further rollout of the above mentioned practices of the ‘Coffee & Climate Tool Box’.
It has to be stated that the centralized composting facility at this given time and situation seems
economically unfeasible. Compost production costs would be too high to allow for a sustained business
case. This is mostly due to high transport, labour and input material costs. Furthermore, it does not seem
to be common practise to purchase organic fertilizers or compost. Coffee residues are applied when
available, but that is currently as far as it goes.
A de-centralized approach seems to be more promising, especially when the application of farm-made,
static compost is combined with a more extensive use of cover cropping and the planting of trees as life
fences to prevent diseases.
The technical and economic feasibility of a composting facility is very much dependent on the local
circumstances. Especially the quantity and condition of the on - and off-site available biomass, distance
to the site and the requirements from the market, determine whether or not a composting project would
qualify as an emission reduction project and therefore is eligible to generate carbon credits. Therefore,
prior to investments into composting equipment and operations a feasibility study was carried out.
This feasibility study evaluates the economic and technical feasibility of turning the locally available,
currently un-used biomass into compost. The amount of available biomass has been assessed during on-
site interviews and questionnaires. Based on the amount of available biomass, the necessary investments
into equipment were selected.
The target is to not only produce good quality compost but as well compost tea as an alternative organic
fertilizer, stimulating the microbial activity in the soils where the compost is applied. Both good quality
compost and compost tea requires certain parameters to be met during the composting process,
specifically the composition of the input materials. For this reason Soil & More didn‘t consider all available
biomass as indicated in the questionnaires to guarantee a good quality output.

For the decentralized option, two different scenarios have been investigated. Based on information given
during an on-site interview the agricultural practices of an ‘average’ coffee farmer in Minas Gerais have
been estimated. This ‘baseline’ scenario has been used to benchmark the current activities as well as
future reduction potentials in regards to greenhouse gas emissions from fertilizer & pesticide use, as well
as the carbon sequestration potential of cover cropping, compost application and tree planting for
windbreakers.
2. How do Carbon Projects Work?
Carbon credits can be awarded to project activities that reduce the emissions of greenhouse gases against
a certain baseline scenario. For example, if large amounts of coffee residues were to be stored in large
piles in humid conditions, the resulting fermentation process would release methane – a powerful
greenhouse gas. Aerobic composting of these materials would avoid large parts of the emissions of the
above mentioned baseline scenario and the difference in emissions between those two scenarios would
potentially qualify for certification as carbon credits.
Another example could be the following situation. In a coffee growing region with certain agricultural
practices (high agrochemical inputs, little shade trees, little cover cropping, etc.) climate change is having
an increasing effect on coffee farmers, their production and livelihoods. An international NGO approaches
these farmers and suggests supporting them in the implementation of certain agricultural practices that
will results in more climate change resilient farming practices. Amongst these measures are:
Incorporation of crop residues back into the field (either as mulch or as compost)
Cover cropping / green manure
Reduced use of agrochemicals
Afforestation / shade & fencing trees
All of these measures have the potential to either reduce greenhouse gas emissions or even to sequester
carbon. If those were measured and certified one could generate an additional stream of income from
those ‘carbon credits’, which could be used to partly finance the project activities.
The most common way to set up such a project is that the project developer (e.g. coffee & climate)
approaches the farmers and jointly develops a project plan outlining the activities & responsibilities. Once
these plans are drawn up, the emission reductions can be calculated and the potential revenue stream of
carbon credits can be factored into the financial planning of the project activities.
The project developer and the participants (farmers) agree on a deal in which the developer commits to
managing the project, to provide training & planning services, to either provide project materials (trees,

compost, etc.) for free or subsidized. The farmers commit to the project activities and to implementing
and maintaining said measures. Farmers should have sound land titles for the period of the project
activities (approx. 30 years), as legally the person who owns the land on which reductions are certified to
become carbon credits, also owns those credits.
There is now two ways to set up the legal side of the carbon aspect of the project. The standard way is
that the project developer and the participants (farmers) draft a legal document in which the developer
commits to providing trainings and material and farmers in return hand over the claim of the carbon credit
to the project developer, who uses them to subsidize the project.
Farmers often do not get a share of the sales of the carbon credits, but have to be satisfied with the project
activities themselves as reward. There are however those developers that share revenues from the sales
of carbon credits with the participants.
It has to be noted however, that not all revenue should be transferred to the participants. If that is the
case, one of the most important prerequisites of a carbon project has not been met to begin with – the
requirement of additionallity.
This concept simply states that carbon credits are only awarded to project activities that would not have
happened anyways. Carbon credits are therefore a means to generate additional income for a project
activity (be it a hydro-plant, a composting site or an agroforestry system) that would otherwise not have
been financially feasible.
3. Feasibility Assessment
a. Centralised Option
Soil & More collected the required data during a field visit in Brazil. The questionnaire used included
amount and cost of biomass by type (green fresh, woody brown, manures and others) available in the
proximity of the project location, the current use of the biomass such as landfilling, illegal anaerobic
dumping, in-situ usage or other use as well as other general data on expected compost prices and markets.
The amount and cost of biomass by type was needed to assess the technical and economic feasibility of
the composting project whereas the data on current use is required to define the baseline scenario as a
basis for the calculation of the emission reduction potential.

The data gathering exercise proved to be challenging, as much of the information was not easily
accessible. Especially information regarding availability of input materials such as manure and green, fresh
biomass was not readily available. However, the amount of available coffee husk, the core ingredient in
this scenario could be extrapolated from the amount of processed green coffee. The ratio between green
coffee bean and husk in the dry processing step, was given by the local expert Patrik Avelar – technical
director of Associação Hanns R. Neumann Stiftung do Brasil and local c&c project manager– to be 1:1. It
was furthermore established, that even though exact amounts for the other ingredients could not be
given, sufficient supply of manure and green biomass could be expected.
Minas Gerais is a major producer of cattle and farmers do occasionally buy manure already. Green
materials can either be sourced from surrounding farms or even from the municipalities themselves. Mr
Avelar assumed that for example all the green waste of Santo Antonio do Amparo – one of the cities where
the project is based – brings all its green waste to the landfill. It should therefore be possible to also source
green material locally and at reasonable costs.
Table 1: Overview available Input Materials
Input Material Amount available 50 Km from site in metric
tons
Current use
Land Fill Other
Coffee Husk 20.000 N/a 80%
Cow manure No detailed numbers available, but sufficient
supply assumed
N/a 100%
Chicken manure No detailed numbers available, but sufficient
supply assumed
N/a 100%
Green materials No detailed numbers available, but sufficient
supply assumed.
It is assumed that the city
of San Antonio do
Amparo brings a large
share of the city’s green
waste to the landfill.
Clay/Old
compost
No detailed numbers available, but sufficient
supply assumed.
N/a 100%
The following economic figures were collected and used in the feasibility study.
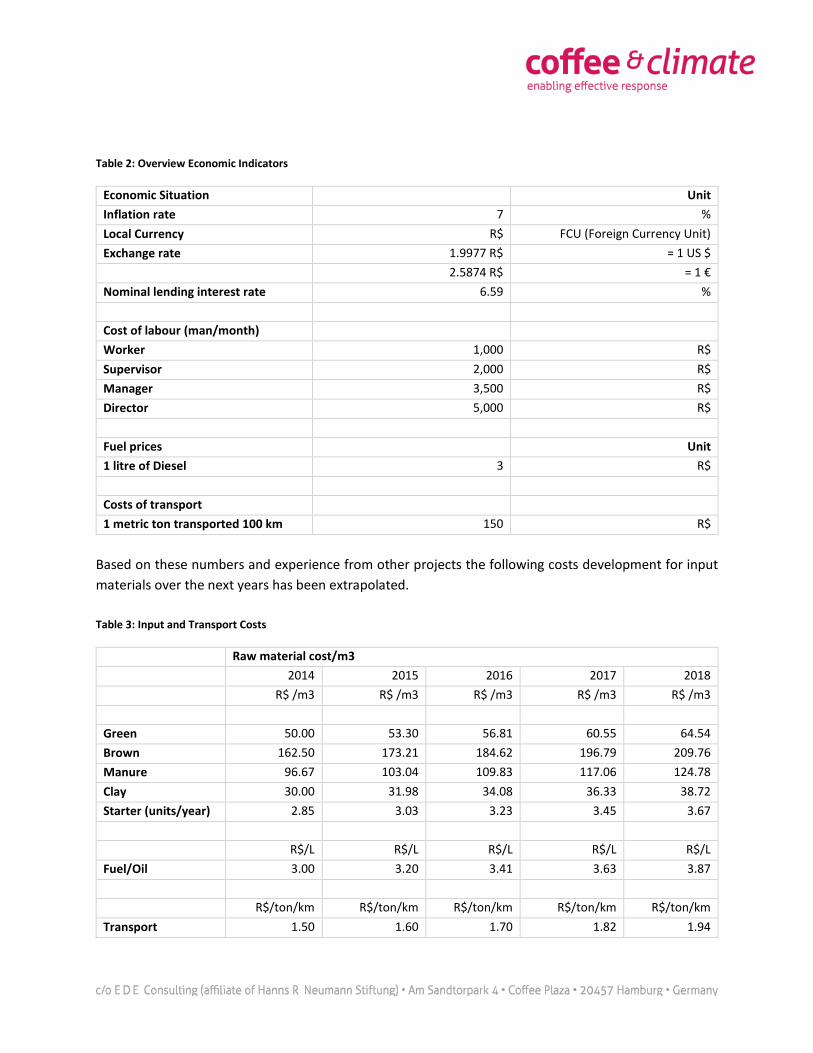
Table 2: Overview Economic Indicators
Economic Situation Unit
Inflation rate 7 %
Local Currency R$ FCU (Foreign Currency Unit)
Exchange rate 1.9977 R$ = 1 US $
2.5874 R$ = 1 €
Nominal lending interest rate 6.59 %
Cost of labour (man/month)
Worker 1,000 R$
Supervisor 2,000 R$
Manager 3,500 R$
Director 5,000 R$
Fuel prices Unit
1 litre of Diesel 3 R$
Costs of transport
1 metric ton transported 100 km 150 R$
Based on these numbers and experience from other projects the following costs development for input
materials over the next years has been extrapolated.
Table 3: Input and Transport Costs
Raw material cost/m3
2014 2015 2016 2017 2018
R$ /m3 R$ /m3 R$ /m3 R$ /m3 R$ /m3
Green 50.00 53.30 56.81 60.55 64.54
Brown 162.50 173.21 184.62 196.79 209.76
Manure 96.67 103.04 109.83 117.06 124.78
Clay 30.00 31.98 34.08 36.33 38.72
Starter (units/year) 2.85 3.03 3.23 3.45 3.67
R$/L R$/L R$/L R$/L R$/L
Fuel/Oil 3.00 3.20 3.41 3.63 3.87
R$/ton/km R$/ton/km R$/ton/km R$/ton/km R$/ton/km
Transport 1.50 1.60 1.70 1.82 1.94
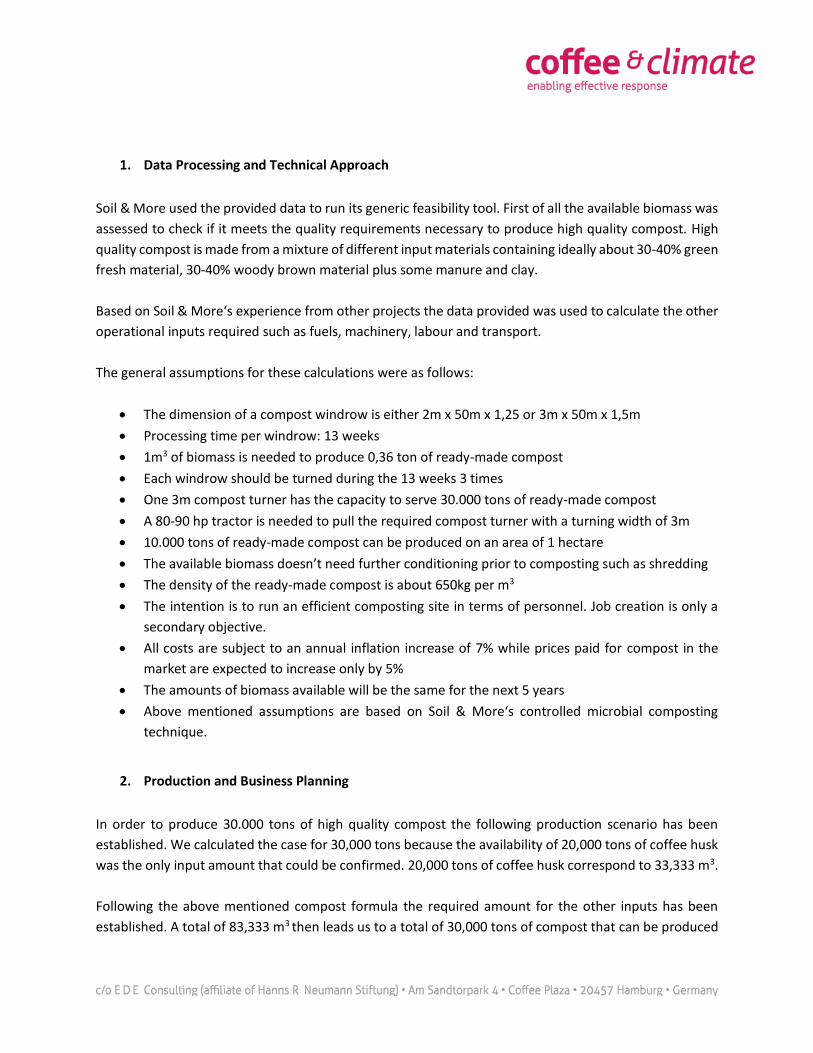
1. Data Processing and Technical Approach
Soil & More used the provided data to run its generic feasibility tool. First of all the available biomass was
assessed to check if it meets the quality requirements necessary to produce high quality compost. High
quality compost is made from a mixture of different input materials containing ideally about 30-40% green
fresh material, 30-40% woody brown material plus some manure and clay.
Based on Soil & More‘s experience from other projects the data provided was used to calculate the other
operational inputs required such as fuels, machinery, labour and transport.
The general assumptions for these calculations were as follows:
The dimension of a compost windrow is either 2m x 50m x 1,25 or 3m x 50m x 1,5m
Processing time per windrow: 13 weeks
1m3 of biomass is needed to produce 0,36 ton of ready-made compost
Each windrow should be turned during the 13 weeks 3 times
One 3m compost turner has the capacity to serve 30.000 tons of ready-made compost
A 80-90 hp tractor is needed to pull the required compost turner with a turning width of 3m
10.000 tons of ready-made compost can be produced on an area of 1 hectare
The available biomass doesn’t need further conditioning prior to composting such as shredding
The density of the ready-made compost is about 650kg per m3
The intention is to run an efficient composting site in terms of personnel. Job creation is only a
secondary objective.
All costs are subject to an annual inflation increase of 7% while prices paid for compost in the
market are expected to increase only by 5%
The amounts of biomass available will be the same for the next 5 years
Above mentioned assumptions are based on Soil & More‘s controlled microbial composting
technique.
2. Production and Business Planning
In order to produce 30.000 tons of high quality compost the following production scenario has been
established. We calculated the case for 30,000 tons because the availability of 20,000 tons of coffee husk
was the only input amount that could be confirmed. 20,000 tons of coffee husk correspond to 33,333 m3.
Following the above mentioned compost formula the required amount for the other inputs has been
established. A total of 83,333 m3 then leads us to a total of 30,000 tons of compost that can be produced
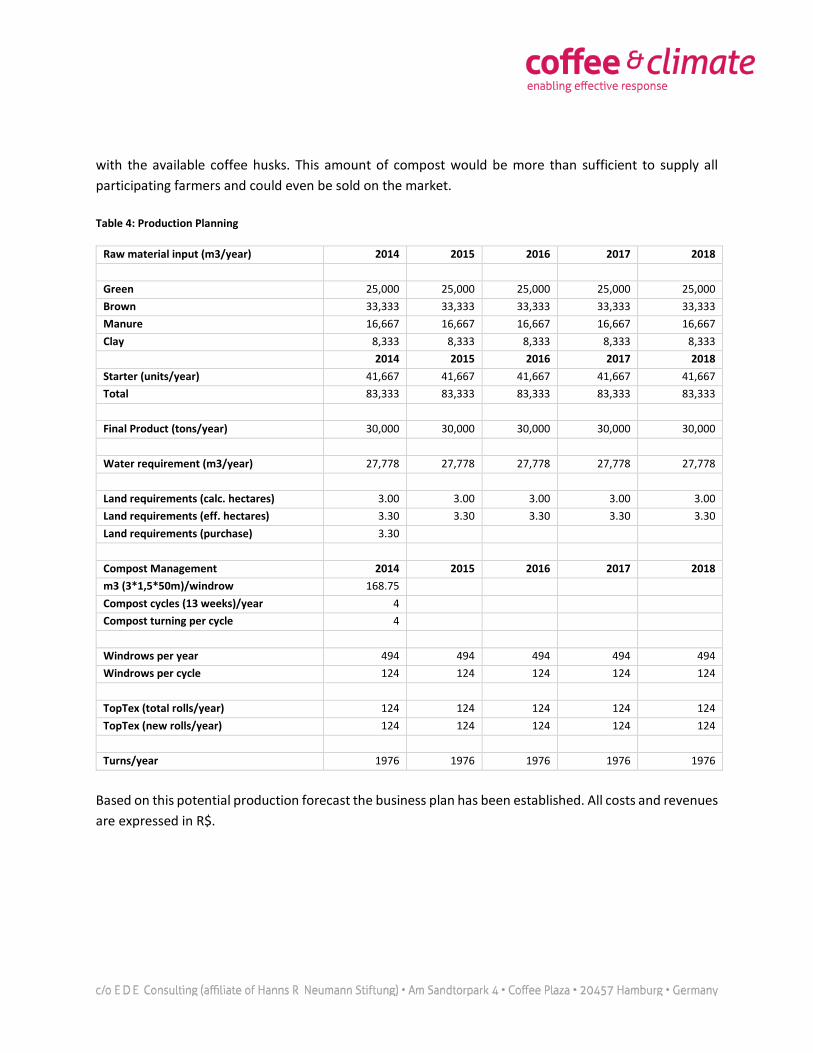
with the available coffee husks. This amount of compost would be more than sufficient to supply all
participating farmers and could even be sold on the market.
Table 4: Production Planning
Raw material input (m3/year) 2014 2015 2016 2017 2018
Green 25,000 25,000 25,000 25,000 25,000
Brown 33,333 33,333 33,333 33,333 33,333
Manure 16,667 16,667 16,667 16,667 16,667
Clay 8,333 8,333 8,333 8,333 8,333
2014 2015 2016 2017 2018
Starter (units/year) 41,667 41,667 41,667 41,667 41,667
Total 83,333 83,333 83,333 83,333 83,333
Final Product (tons/year) 30,000 30,000 30,000 30,000 30,000
Water requirement (m3/year) 27,778 27,778 27,778 27,778 27,778
Land requirements (calc. hectares) 3.00 3.00 3.00 3.00 3.00
Land requirements (eff. hectares) 3.30 3.30 3.30 3.30 3.30
Land requirements (purchase) 3.30
Compost Management 2014 2015 2016 2017 2018
m3 (3*1,5*50m)/windrow 168.75
Compost cycles (13 weeks)/year 4
Compost turning per cycle 4
Windrows per year 494 494 494 494 494
Windrows per cycle 124 124 124 124 124
TopTex (total rolls/year) 124 124 124 124 124
TopTex (new rolls/year) 124 124 124 124 124
Turns/year 1976 1976 1976 1976 1976
Based on this potential production forecast the business plan has been established. All costs and revenues
are expressed in R$.
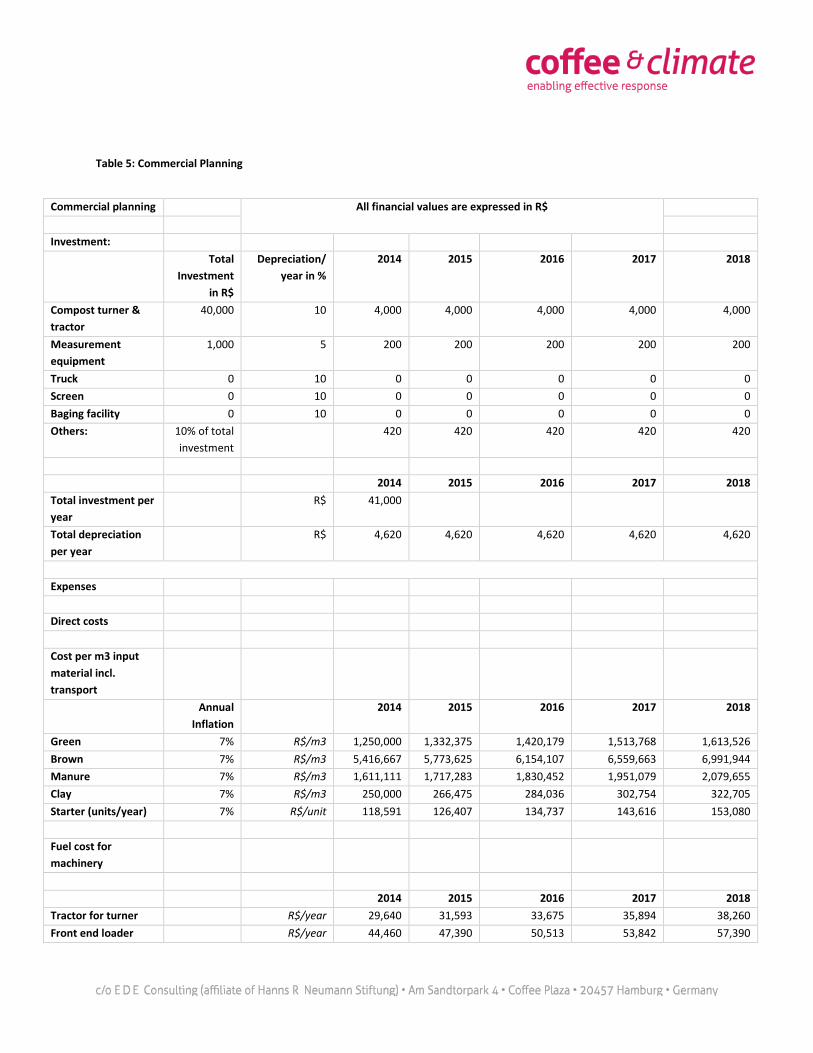
Table 5: Commercial Planning
Commercial planning All financial values are expressed in R$
Investment:
Total
Investment
in R$
Depreciation/
year in %
2014 2015 2016 2017 2018
Compost turner &
tractor
40,000 10 4,000 4,000 4,000 4,000 4,000
Measurement
equipment
1,000 5 200 200 200 200 200
Truck 0 10 0 0 0 0 0
Screen 0 10 0 0 0 0 0
Baging facility 0 10 0 0 0 0 0
Others: 10% of total
investment
420 420 420 420 420
2014 2015 2016 2017 2018
Total investment per
year
R$ 41,000
Total depreciation
per year
R$ 4,620 4,620 4,620 4,620 4,620
Expenses
Direct costs
Cost per m3 input
material incl.
transport
Annual
Inflation
2014 2015 2016 2017 2018
Green 7% R$/m3 1,250,000 1,332,375 1,420,179 1,513,768 1,613,526
Brown 7% R$/m3 5,416,667 5,773,625 6,154,107 6,559,663 6,991,944
Manure 7% R$/m3 1,611,111 1,717,283 1,830,452 1,951,079 2,079,655
Clay 7% R$/m3 250,000 266,475 284,036 302,754 322,705
Starter (units/year) 7% R$/unit 118,591 126,407 134,737 143,616 153,080
Fuel cost for
machinery
2014 2015 2016 2017 2018
Tractor for turner R$/year 29,640 31,593 33,675 35,894 38,260
Front end loader R$/year 44,460 47,390 50,513 53,842 57,390

As can be seen, the forecasted production costs per ton of compost amount to a total of 300 R$ in the
first year, increasing steadily over the years. The main reasons for these prohibitive costs are the high
expenses for input materials, transport and labour.
In the opinion of Patrik Avelar – given during the site visit in Brazil – the acceptable market price for 1 ton
of compost should not exceed 40-50 R$, which would be corresponding to the price of manure.
Maintenance of
machinery
25% of
depreciation
R$/year 1,155 1,155 1,155 1,155 1,155
2014 2015 2016 2017 2018
Other costs: Estimated
2% of direct
costs
R$/year 174,432 185,926 198,177 211,235 225,154
Total direct costs 8,896,057 9,482,229 10,107,030 10,773,006 11,482,870
Admin. expenses
2014 2015 2016 2017 2018
Annual salary
increase
10%
Site operator 5,000 R$/month 60,000 66,000 72,600 79,860 87,846
Drivers / forworker 2,000 R$/month 12,000 13,200 14,520 15,972 17,569
Workers 1,000 R$/month 24,000 26,400 29,040 31,944 35,138
Land rent 200 R$/ha/year plus
annual inflation
660 726 799 878 966
Depreciation 4,620 4,620 4,620 4,620 4,620
Others: 10% of
admin. exp.
10,128 11,095 12,158 13,327 14,614
Total admin.
expenses
111,408 122,041 133,736 146,602 160,754
2014 2015 2016 2017 2018
Total expenses 9,007,465 9,604,270 10,240,767 10,919,608 11,643,624
Cost per ton ready-
made compost
300.25 R$ 320.14 R$ 341.36 R$ 363.99 R$ 388.12 R$
Cost per m3 ready-
made compost
195.16 R$ 208.09 R$ 221.88 R$ 236.59 R$ 252.28 R$

Furthermore it was estimated that approximately 14,500 carbon credits could be generated from running
such a site. These carbon credits could potentially subsidize the price of compost to make it more
competitive in the market. However, at a current average market price of 3€ per carbon credit, this option
does not seem to be feasible in this case, as the potential price reduction would only be 4€ per ton of
compost leaving it well beyond the market price deemed feasible by Mr Avelar.
Based on the data that could be gathered it has to be concluded that a centralized composting facility in
these circumstances is technically feasible, but not financially.
3. Requirements for a Feasible Centralized Composting Site
Establishing a financially feasible, large scale composting site in this part of Brazil seems challenging.
Especially the high costs for the raw materials and the most importantly the transport costs make the final
compost prohibitively expensive.
As per the request of HRN foundation we would like to provide a fictional scenario in which compost
production at reasonable cost would be possible.
The following key indicators have to be changed to arrive at a cost of production of approximately 50 R$.
The total output of the compost site would have to be increased to 105.000 tons of compost per year. It
is assumed that the costs for inputs has been reduced drastically – with coffee husk being delivered for
free to the site in large quantities.
Furthermore, it was assumed that the transport costs per ton / km are now 0.25 R$ rather than the actual
1.5 R$. On top of these costs reductions, the potential subsidies from carbon credits amount to R$12 per
ton of compost (that assumes an optimistic 10€ per carbon credit), resulting in a ton of compost being
produced at zero profit for R$ 38. It needs no further pointing out that unfortunately such a scenario is
unlikely.
It would be a very different scenario, if local communities or municipalities could be engaged to solve
potential green waste problems through the implementation of a composting site. This however does not
seem to be the case.
b. De-Centralized Option
The second option that has been investigated in this feasibility study is that of a de-centralized composting
approach where farmers produce the required compost on or close to their farm. This way transport costs
can be reduced and the approach can be based on the on-farm available biomass for composting.
Combining this approach with measures already under implementation by the coffee& climate project
can significantly reduce emissions and can potentially qualify for an emission reduction project under the
umbrella of the ‘Climate Smart Agriculture’ initiative by the Gold Standard Foundation.
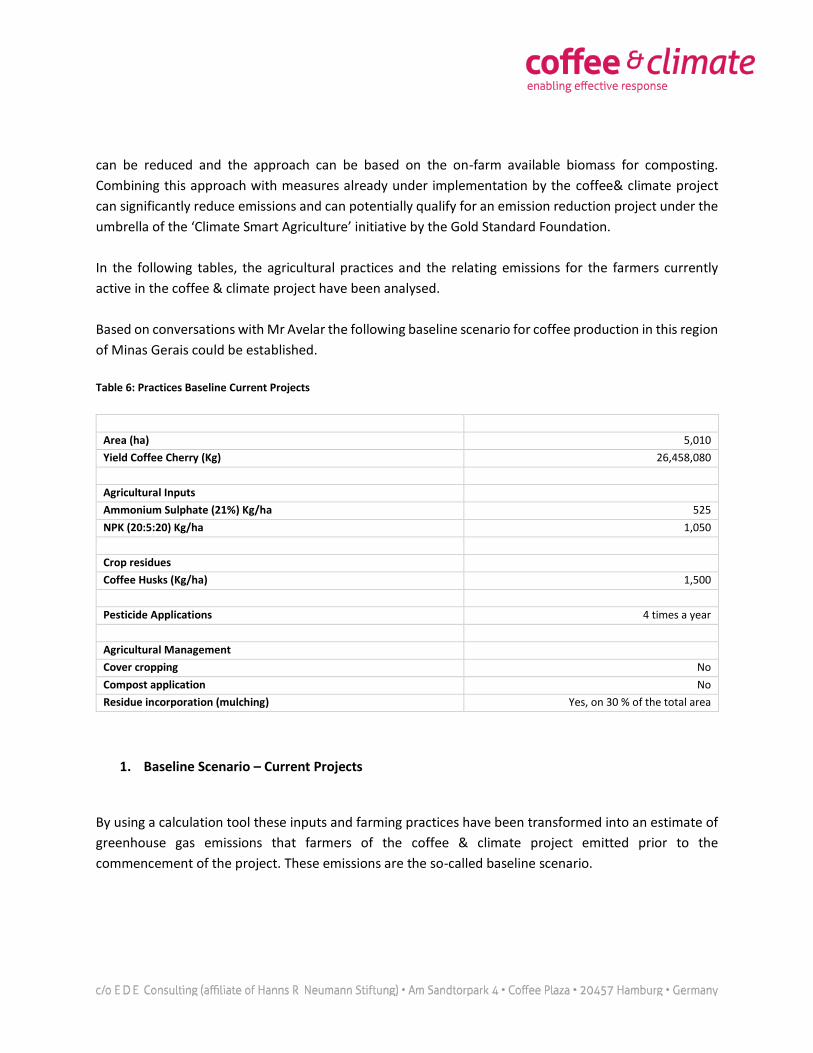
In the following tables, the agricultural practices and the relating emissions for the farmers currently
active in the coffee & climate project have been analysed.
Based on conversations with Mr Avelar the following baseline scenario for coffee production in this region
of Minas Gerais could be established.
Table 6: Practices Baseline Current Projects
1. Baseline Scenario – Current Projects
By using a calculation tool these inputs and farming practices have been transformed into an estimate of
greenhouse gas emissions that farmers of the coffee & climate project emitted prior to the
commencement of the project. These emissions are the so-called baseline scenario.
Area (ha) 5,010
Yield Coffee Cherry (Kg) 26,458,080
Agricultural Inputs
Ammonium Sulphate (21%) Kg/ha 525
NPK (20:5:20) Kg/ha 1,050
Crop residues
Coffee Husks (Kg/ha) 1,500
Pesticide Applications 4 times a year
Agricultural Management
Cover cropping No
Compost application No
Residue incorporation (mulching) Yes, on 30 % of the total area

Table 7: Emissions Baseline Current Projects
Emissions for total area, kg CO2 eq Per hectare
Fertiliser production 6,594,668.9 1,316.0
Direct and indirect field N2O 7,708,422.5 1,538.3
Pesticides 410,902.0 82.0
Crop residue management 509,074.6 101.6
Carbon stock changes - -
Totals 15,223,068.1 3,037.9
2. Status Quo – Current Projects
Analysing data from the projects’ database gives an insight into the impact that the project has had to
date. Especially the increased use of cover cropping and coffee husk for mulching reduced emissions
against the baseline already.
Table 8: Practices Status Quo Current Projects
Area (ha) 5,010
Yield Coffee Cherry (Kg) 26,458,080
Agricultural Inputs
Ammonium Sulphate (21%) Kg/ha 525
NPK (20:5:20) Kg/ha 1,050
Crop residues
Coffee Husks (Kg/ha) 1,500
Pesticide Applications 1.5 times a year
Agricultural Management
Cover cropping Yes, on 75% of the total area
Compost application No
Residue incorporation (mulching) Yes, on 70 % of the total area
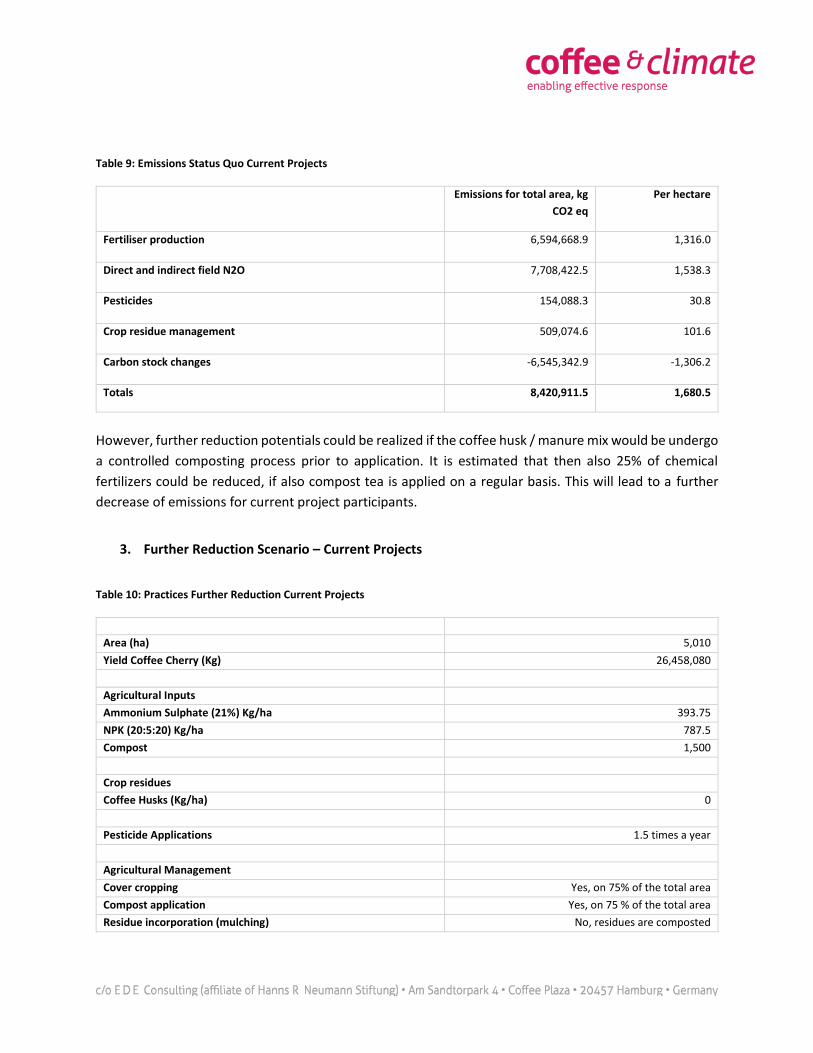
Table 9: Emissions Status Quo Current Projects
Emissions for total area, kg
CO2 eq
Per hectare
Fertiliser production 6,594,668.9 1,316.0
Direct and indirect field N2O 7,708,422.5 1,538.3
Pesticides 154,088.3 30.8
Crop residue management 509,074.6 101.6
Carbon stock changes -6,545,342.9 -1,306.2
Totals 8,420,911.5 1,680.5
However, further reduction potentials could be realized if the coffee husk / manure mix would be undergo
a controlled composting process prior to application. It is estimated that then also 25% of chemical
fertilizers could be reduced, if also compost tea is applied on a regular basis. This will lead to a further
decrease of emissions for current project participants.
3. Further Reduction Scenario – Current Projects
Table 10: Practices Further Reduction Current Projects
Area (ha) 5,010
Yield Coffee Cherry (Kg) 26,458,080
Agricultural Inputs
Ammonium Sulphate (21%) Kg/ha 393.75
NPK (20:5:20) Kg/ha 787.5
Compost 1,500
Crop residues
Coffee Husks (Kg/ha) 0
Pesticide Applications 1.5 times a year
Agricultural Management
Cover cropping Yes, on 75% of the total area
Compost application Yes, on 75 % of the total area
Residue incorporation (mulching) No, residues are composted
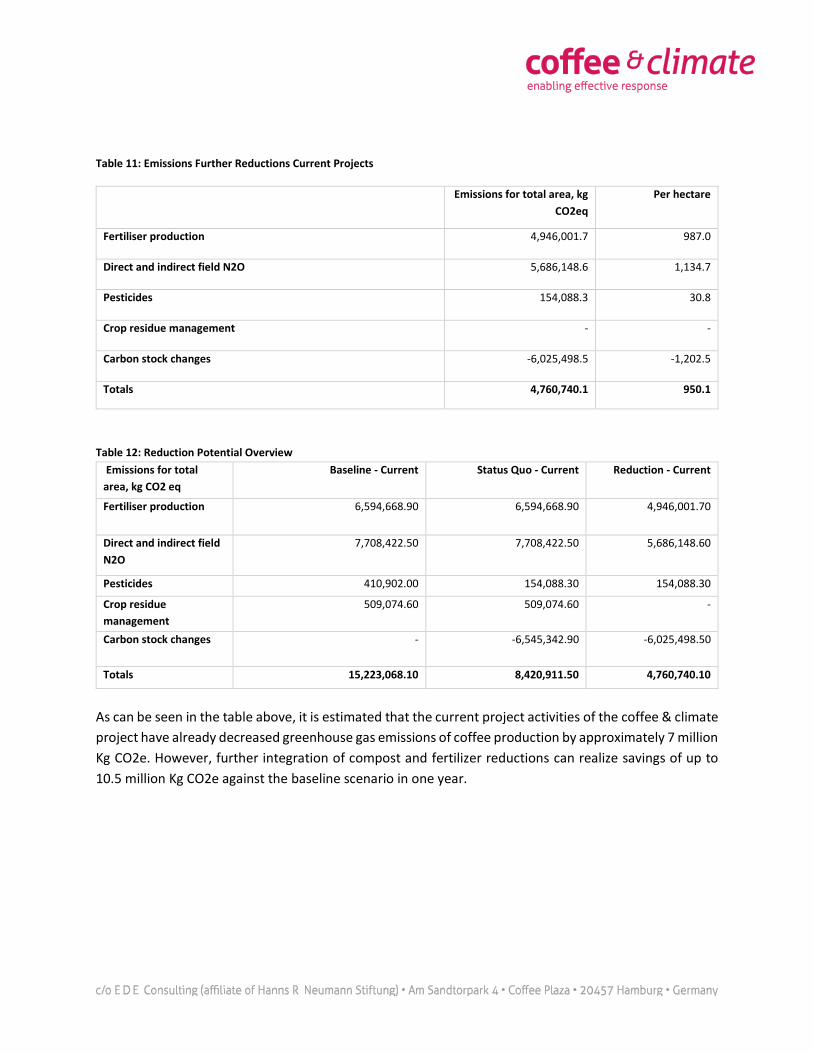
Table 11: Emissions Further Reductions Current Projects
Emissions for total area, kg
CO2eq
Per hectare
Fertiliser production 4,946,001.7 987.0
Direct and indirect field N2O 5,686,148.6 1,134.7
Pesticides 154,088.3 30.8
Crop residue management - -
Carbon stock changes -6,025,498.5 -1,202.5
Totals 4,760,740.1 950.1
Table 12: Reduction Potential Overview
Emissions for total
area, kg CO2 eq
Baseline - Current Status Quo - Current Reduction - Current
Fertiliser production 6,594,668.90 6,594,668.90 4,946,001.70
Direct and indirect field
N2O
7,708,422.50 7,708,422.50 5,686,148.60
Pesticides 410,902.00 154,088.30 154,088.30
Crop residue
management
509,074.60 509,074.60 -
Carbon stock changes - -6,545,342.90 -6,025,498.50
Totals 15,223,068.10 8,420,911.50 4,760,740.10
As can be seen in the table above, it is estimated that the current project activities of the coffee & climate
project have already decreased greenhouse gas emissions of coffee production by approximately 7 million
Kg CO2e. However, further integration of compost and fertilizer reductions can realize savings of up to
10.5 million Kg CO2e against the baseline scenario in one year.

Figure 4: Comparison Reduction Potential in Kg C02eq
4. Baseline Scenario – IDB Project
An even higher potential for greenhouse gas reductions can be found in the soon to launched IDB funded
project.
As no primary data could be established at this point, it was assumed that the new farmers joining the
project are practising the same management techniques as described in the baseline scenario above.
The following figures represent only the area under the IDB project.
0
2.000.000
4.000.000
6.000.000
8.000.000
10.000.000
12.000.000
14.000.000
16.000.000
Totals
15.223.068,10
8.420.911,50
4.760.740,10
GHG Emissions per Scenario
Baseline - Current
Status Quo - Current
Reduction - Current

Table 13: Practices Baseline IDB Project
Area (ha) 6,904
Yield Coffee Cherry (Kg) 36,453,120
Agricultural Inputs
Ammonium Sulphate (21%) Kg/ha 525
NPK (20:5:20) Kg/ha 1,050
Crop residues
Coffee Husks (Kg/ha) 1,500
Pesticide Applications 4 times a year
Agricultural Management
Cover cropping No
Compost application No
Residue incorporation (mulching) Yes, on 30 % of the total area
Table 14: Baseline Emissions IDB Project
Emissions for total area, kg CO2
eq
Per hectare
Fertiliser production 9,085,929.8 1,316.0
Direct and indirect field N2O 10,620,424.9 1,538.3
Pesticides 566,128.0 82.0
Crop residue management 701,387.2 101.6
Carbon stock changes - -
Totals 20,973,869.9 3,037.9
If we now apply the same management changes as described above, the following reduction potentials
could be established.

5. Reduction Scenario – IDB Project
Table 15: Practices Reduction Scenario IDB Project
Area (ha) 6,904
Yield Coffee Cherry (Kg) 36,453,120
Agricultural Inputs
Ammonium Sulphate (21%) Kg/ha 393.75
NPK (20:5:20) Kg/ha 787.5
Compost (Kg/ ha) 1,500
Crop residues
Coffee Husks (Kg/ha) 0
Pesticide Applications 1.5 times a year
Agricultural Management
Cover cropping Yes, on 75% of the total area
Compost application Yes, on 75 % of the total area
Residue incorporation (mulching) No, see compost application
Table 16: Emissions Reduction Scenario IDB Project
Emissions for total area,
kg CO2 eq
Per hectare
Fertiliser production 6,814,447.4 987.0
Direct and indirect field N2O 7,894,127.5 1,143.4
Pesticides 212,298.0 30.8
Crop residue management - -
Carbon stock changes -8,301,744.5 -1,202.5
Totals 6,619,128.3 958.7
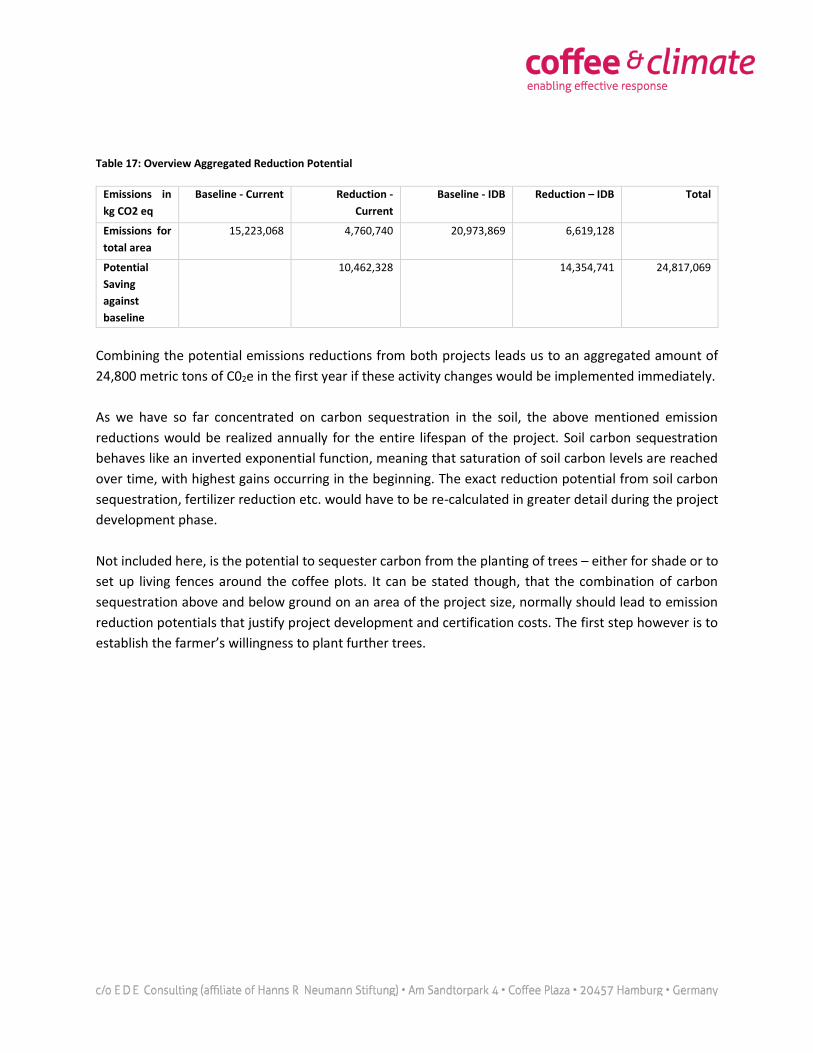
Table 17: Overview Aggregated Reduction Potential
Emissions in
kg CO2 eq
Baseline - Current Reduction -
Current
Baseline - IDB Reduction – IDB Total
Emissions for
total area
15,223,068 4,760,740 20,973,869 6,619,128
Potential
Saving
against
baseline
10,462,328 14,354,741 24,817,069
Combining the potential emissions reductions from both projects leads us to an aggregated amount of
24,800 metric tons of C02e in the first year if these activity changes would be implemented immediately.
As we have so far concentrated on carbon sequestration in the soil, the above mentioned emission
reductions would be realized annually for the entire lifespan of the project. Soil carbon sequestration
behaves like an inverted exponential function, meaning that saturation of soil carbon levels are reached
over time, with highest gains occurring in the beginning. The exact reduction potential from soil carbon
sequestration, fertilizer reduction etc. would have to be re-calculated in greater detail during the project
development phase.
Not included here, is the potential to sequester carbon from the planting of trees – either for shade or to
set up living fences around the coffee plots. It can be stated though, that the combination of carbon
sequestration above and below ground on an area of the project size, normally should lead to emission
reduction potentials that justify project development and certification costs. The first step however is to
establish the farmer’s willingness to plant further trees.
4. Sustainability Flower Quick Assessment
a. Executive Summary
1. Preface
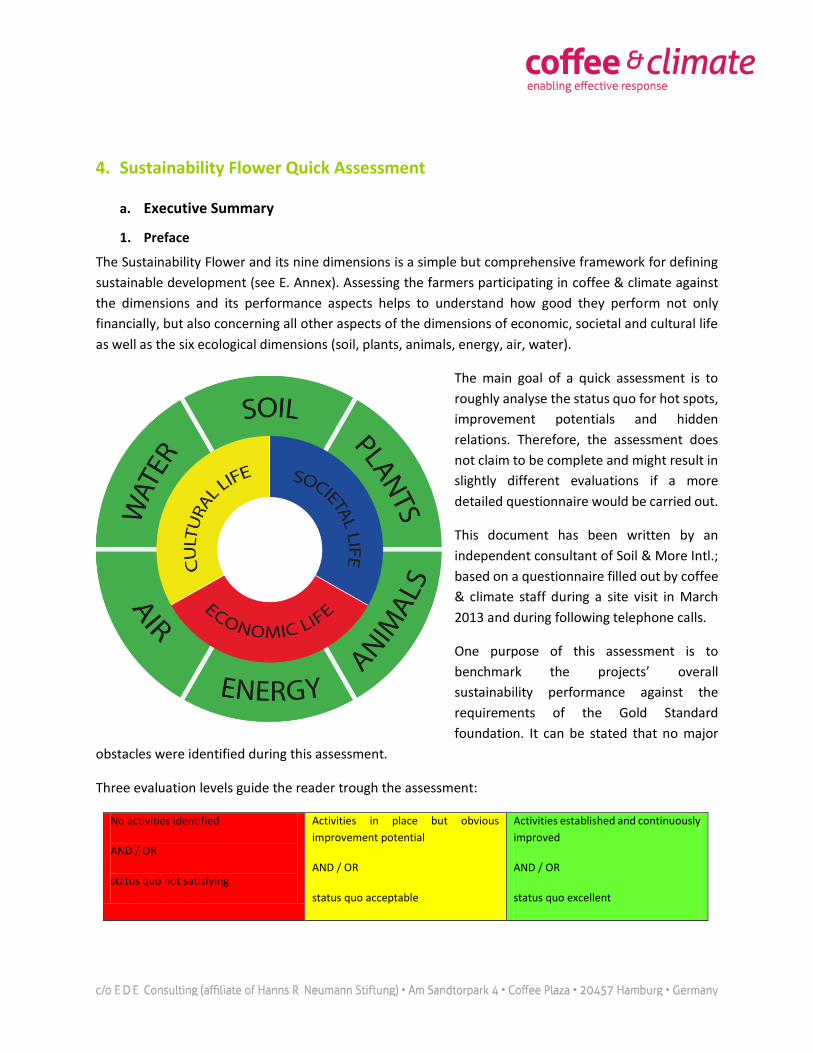
The Sustainability Flower and its nine dimensions is a simple but comprehensive framework for defining
sustainable development (see E. Annex). Assessing the farmers participating in coffee & climate against
the dimensions and its performance aspects helps to understand how good they perform not only
financially, but also concerning all other aspects of the dimensions of economic, societal and cultural life
as well as the six ecological dimensions (soil, plants, animals, energy, air, water).
The main goal of a quick assessment is to
roughly analyse the status quo for hot spots,
improvement potentials and hidden
relations. Therefore, the assessment does
not claim to be complete and might result in
slightly different evaluations if a more
detailed questionnaire would be carried out.
This document has been written by an
independent consultant of Soil & More Intl.;
based on a questionnaire filled out by coffee
& climate staff during a site visit in March
2013 and during following telephone calls.
One purpose of this assessment is to
benchmark the projects’ overall
sustainability performance against the
requirements of the Gold Standard
foundation. It can be stated that no major
obstacles were identified during this assessment.
Three evaluation levels guide the reader trough the assessment:
No activities identified
AND / OR
status quo not satisfying
Activities in place but obvious
improvement potential
AND / OR
status quo acceptable
Activities established and continuously
improved
AND / OR
status quo excellent

The headings of each performance aspect in the dimensions of Economic, Societal and Cultural Life and
the ecology dimensions are coloured according to the evaluation.
2. Results of the Quick Assessment
Table 18: SusFlower Results
Dimension Performance
Soil
Plants
Animals
Energy
Air
Water
Economic Life
Societal Life
Cultural Life
Table 19: SusFlower Indicator Key
Key Indicator
No action towards more sustainable practices
On a good path with still significant improvement potential
Good practise in place while developing continuously
Soil:
Coffee production is done as a mono crop system without shade trees. Farmers apply significant amounts
of agrochemicals. It has to be stated though that those farmers that participate in the Coffee & climate
project, have taken good steps towards more sustainable soil management practices, like cover cropping
and residue incorporation. Thus they use significantly less disease control than farmers outside the
project.
Even though encouraging steps have been taken in regards to soil management, further potential was
identified. A controlled composting of crop residues with farm-available biomass would increase the
nutrient efficiency, the soil water retention capacity, carbon storage etc. to only name a few. First trials
with compost tea have been scheduled and if positive results can be achieved a broad rollout should be
envisaged.
Plants:
Brazilian law is very strict when it comes to conservation of forest on farmland. 20% of the total area of a
farm has to be set aside as conservation area, plus buffer zones of 30m-50m next to water bodies.
Furthermore, in the farmer field schools they are currently testing the positive effects of planting further
trees around the area under coffee as windbreakers to avoid transportation of diseases through wind.
The further planting of trees as windbreakers should be encouraged if the field trials show positive results.
Further research could also be focused on the introduction of shade trees in the parts of the plantations
that are being rejuvenated.
Animals:
Cattle husbandry is done according to Brazilian law and customs, which in this case mean sufficient area
for grazing and other normal husbandry practices. No organic or biodynamic husbandry principles are
adopted. There is a range of endangered species (IUCN) in the area, but no specific plan to protect those
is in place.
A detailed analysis of endangered species in the area could be conducted and the project could then join
forces with other organizations to promote the conservation of these species.
Energy:
Energy consumption on farm level is minimal as much of the work is done manually. All fuel and electricity
is consumed on processing level for the hulling of the coffee cherries. 70% of the farmers use a mobile
hulling service, which is powered by Diesel, and 30% bring their coffee to a centralized processing facility
where they have access to electricity. The total consumption of fuels within the project boundary is quite
considerable, and no renewable energy sources are currently being used.

It might be worthwhile to investigate the usage of renewable energy sources to provide the energy for
the hulling. These could be decentralized biogas / solar power solutions as well as larger facilities on the
premises of the processing facilities.
Air:
The emissions per kg of green coffee are relatively low compared to coffees from other parts of the world.
However, it has to be stated that this is only true because the efficiency of these farming systems seem
to be also much higher, than for example in an African smallholder situation. The emissions per total area
and per ha are quite considerable due to the extensive use of chemical fertilizers and processing energy
(70% diesel and 30% electricity). For 2012 the total emissions on the entire area was 23,251 tons of C02e
(approx. 4.7 t/ha/year). This includes the carbon that is sequestered through mulching of crop residues.
We are thus looking at a considerable net source of emissions.
Despite the agricultural efficiency of the input/output ratio (fertilizer/harvest) - which keeps the emissions
per unit of coffee quite low - one should consider looking at potential emission reduction sources, which
in turn could also be beneficial for the soil, the plants and the water footprint. Over the long run, the
imbalance between agrochemicals and organic inputs will also lead to a decreasing efficiency of the
system, meaning increasing emissions per unit of output. One means to achieve further reduction while
maintaining/increasing soil quality and potentially yield is the composting and application (solid and
liquid) of the crop residues (coffee husks) with other inputs (manure, fresh material). An estimated 25%
of chemical fertilizer could potentially be saved in the long run, if this would be implemented widely.
Emissions would then sink drastically to 10,581 t / year / total area (a reduction of more than 50%) and to
2.1 t/ha/y.
Water:
All coffee in this project is being grown without irrigation, thus there is no depletion of water sources.
Furthermore, Brazilian environmental law requires buffer zones of 30-50m between agricultural land and
water bodies. If these regulations are met - and there is no hint otherwise here - these buffer zones play
an important role in the prevention of leeching of agrochemicals from the cropland into the water source.
The main effects of the coffee farms on the water performance are the use of chemical fertilizers and
disease control. However, project measures such as cover cropping and mulching have reduced the
application of 'round up' from three to one applications per year. Further activities like this should be
encouraged.
As already stated, the project activities have already had a positive impact on the overall water
performance when benchmarked with farmers outside the project framework (mostly due to reduced
disease control applications). Further activities to reduce chemical inputs and to increase organic ones
should be encouraged to further improve the water performance. One aspect next to water usage and
pollution is the challenging availability of water for the plants throughout the year. Even though this part
of Brazil still receives the same amount of rainfall as usual, its timely distribution is becoming more erratic
with occasions of heavy rainfalls and droughts becoming alarmingly frequent. The project conducts field
trials with gypsum to transport the nutrients deep into the soil and thus encourage the plant roots to grow
deeper than usual (with the ultimate goal to reach the groundwater table). Initial results are encouraging
and should be further tested - also a joint application with high quality compost should be investigated in
order to increase the water retention capacity of the topsoil as well.
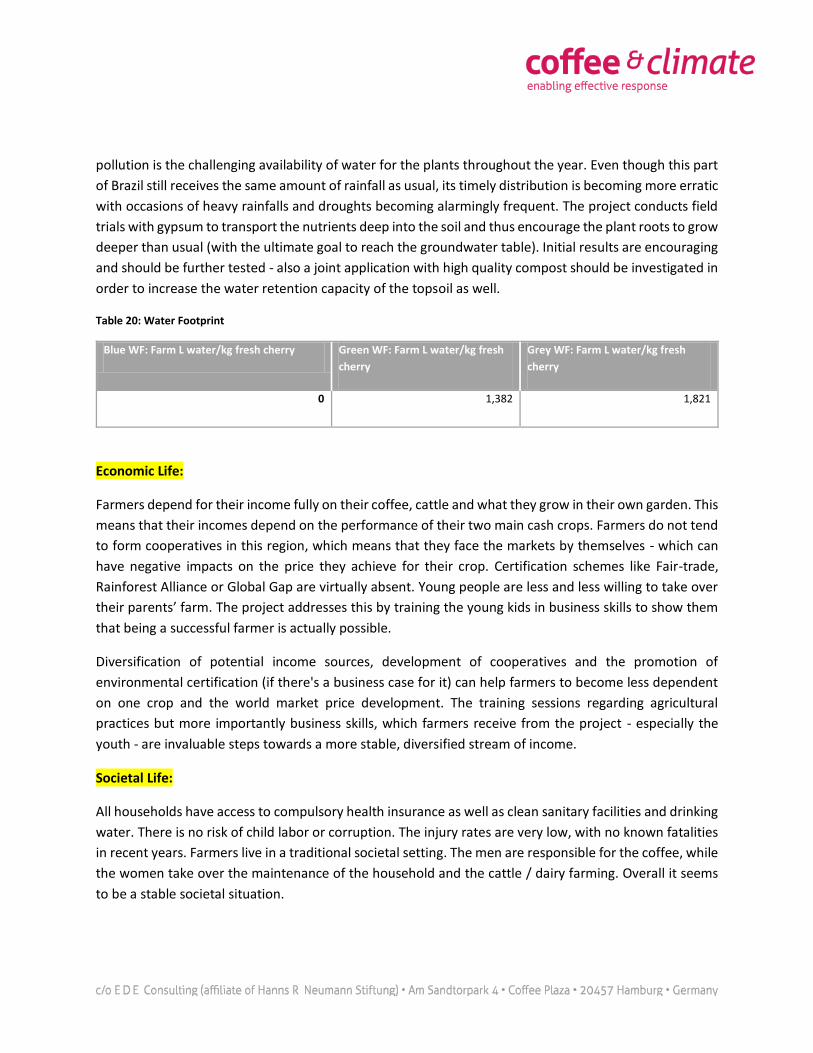
Table 20: Water Footprint
Blue WF: Farm L water/kg fresh cherry Green WF: Farm L water/kg fresh
cherry
Grey WF: Farm L water/kg fresh
cherry
0 1,382 1,821
Economic Life:
Farmers depend for their income fully on their coffee, cattle and what they grow in their own garden. This
means that their incomes depend on the performance of their two main cash crops. Farmers do not tend
to form cooperatives in this region, which means that they face the markets by themselves - which can
have negative impacts on the price they achieve for their crop. Certification schemes like Fair-trade,
Rainforest Alliance or Global Gap are virtually absent. Young people are less and less willing to take over
their parents’ farm. The project addresses this by training the young kids in business skills to show them
that being a successful farmer is actually possible.
Diversification of potential income sources, development of cooperatives and the promotion of
environmental certification (if there's a business case for it) can help farmers to become less dependent
on one crop and the world market price development. The training sessions regarding agricultural
practices but more importantly business skills, which farmers receive from the project - especially the
youth - are invaluable steps towards a more stable, diversified stream of income.
Societal Life:
All households have access to compulsory health insurance as well as clean sanitary facilities and drinking
water. There is no risk of child labor or corruption. The injury rates are very low, with no known fatalities
in recent years. Farmers live in a traditional societal setting. The men are responsible for the coffee, while
the women take over the maintenance of the household and the cattle / dairy farming. Overall it seems
to be a stable societal situation.

One aspect of concern however is the hiring of seasonal workers during the harvesting period. An average
farmer normally employs up to 5 workers for the period of a few weeks. These migrant workers come
from the north of Minas Gerais - a poorer part of the state - and they move from farm to farm. A few years
ago, an open truck transporting seasonal workers lost control while overtaking a car and toppled over
several times before coming to rest on the side of the road, having killed several and injured many of the
workers that were hitching a ride on the open back of the truck. Even though the government intervened
and provided legislation for better protection of seasonal workers, the project should consider the
development of a binding code for the treatment of seasonal workers. This could be based for example
on the Fair-trade or Rainforest Alliance standards.
Cultural Life:
Every farmer receives an average of 84 hours of free training on matters of agriculture and business from
the project. This is by far the single most outstanding achievement of this project, especially because the
conversation between project and farmers is one that goes in both directions, meaning that the farmers’
input is heard and integrated into the training schedule. Of particular importance is the training focusing
on young people providing them with the business skills to become successful coffee farmers.
One idea could be to involve farmers stronger in the development and delivery of trainings. The 'lead
farmer' model of the rainforest alliance could be an interesting one to look at. It enables those farmers
that want to take a leadership role in their communities to do so, while it offers the project the
opportunity to extend its reach.
b. Benchmarking against Gold Standard Requirements
This ‘do-no-harm’ assessment is the first step in the Gold Standard sustainability assessment cycle. It
serves as a first round of contemplation to identify broader areas of concern for the overall sustainability
of the project.
The project activities of coffee & climate project do perform very well in this assessment. One area of
concern in the general coffee industry in this area of Minas Gerais is the use of seasonal workers during
the harvest. The project could and should be more active to promote their rights as well.

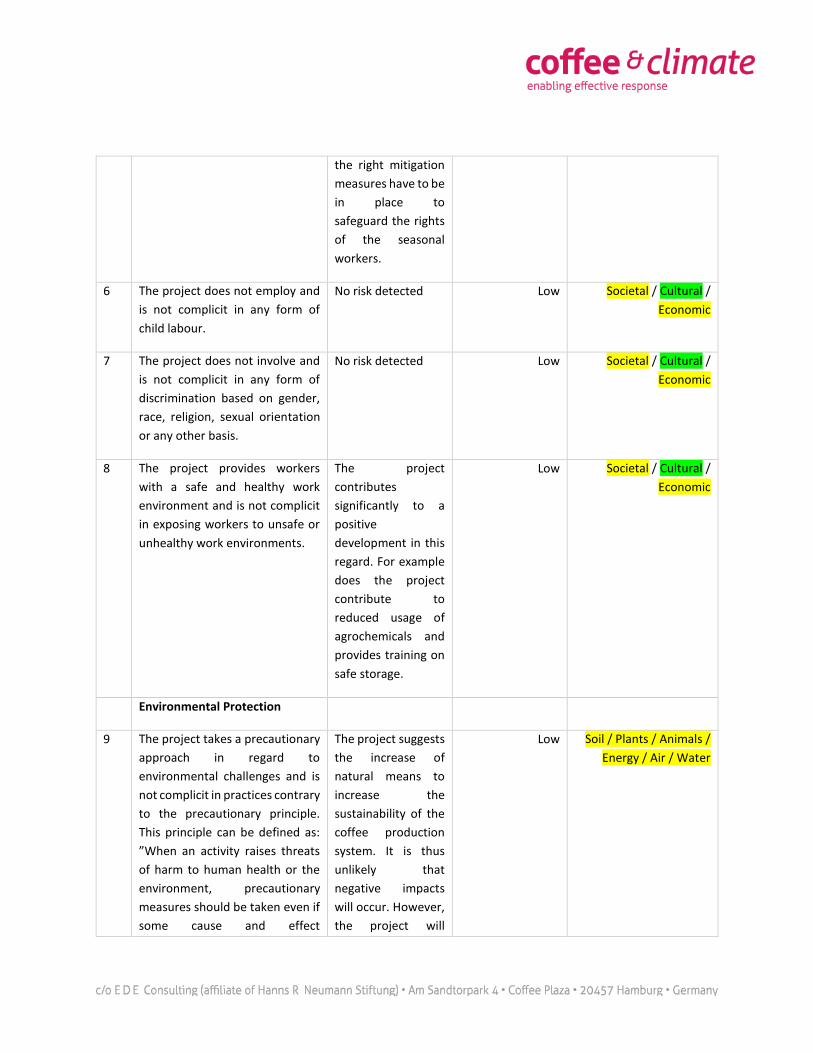
Table 21: ‘Do-No-Harm Assessment’
Safeguarding principle Relevance to
project
Risk of breaching SusFlower dimension
and performance
Human Rights
1 The project respects
internationally proclaimed
human rights including dignity,
cultural property and uniqueness
of indigenous people. The project
is not complicit in Human rights
abuses.
N/a Low Societal / Cultural
2 The project does not involve and
is not complicit in involuntary
resettlement.
The project is
suggesting changes
on existing
agricultural
structures, thus no
risk of replacement.
Low Societal / Cultural
3 The project does not involve and
is not complicit in the alteration,
damage or removal of any critical
cultural heritage.
See #2 Low Societal / Cultural
Labour Standards
4 The project respects the
employees’ freedom of
association and their right to
collective bargaining and is not
complicit in restrictions of these
freedoms and rights.
Yes, the project is
actually trying to
advance these
rights.
Low Societal / Cultural /
Economic
5 The project does not involve and
is not complicit in any form of
forced or compulsory labour.
The project is not
involved in this.
However, there is a
risk for labour
related issues due to
the annual use of
seasonal workers.
Before project start
Medium Societal / Cultural /
Economic
the right mitigation
measures have to be
in place to
safeguard the rights
of the seasonal
workers.
6 The project does not employ and
is not complicit in any form of
child labour.
No risk detected Low Societal / Cultural /
Economic
7 The project does not involve and
is not complicit in any form of
discrimination based on gender,
race, religion, sexual orientation
or any other basis.
No risk detected Low Societal / Cultural /
Economic
8 The project provides workers
with a safe and healthy work
environment and is not complicit
in exposing workers to unsafe or
unhealthy work environments.
The project
contributes
significantly to a
positive
development in this
regard. For example
does the project
contribute to
reduced usage of
agrochemicals and
provides training on
safe storage.
Low Societal / Cultural /
Economic
Environmental Protection
9 The project takes a precautionary
approach in regard to
environmental challenges and is
not complicit in practices contrary
to the precautionary principle.
This principle can be defined as:
”When an activity raises threats
of harm to human health or the
environment, precautionary
measures should be taken even if
some cause and effect
The project suggests
the increase of
natural means to
increase the
sustainability of the
coffee production
system. It is thus
unlikely that
negative impacts
will occur. However,
the project will
Low Soil / Plants / Animals /
Energy / Air / Water
relationships are not fully
established scientifically.”
follow this
precautionary rule.
The project does not involve and
is not complicit in significant
conversion or degradation of
critical natural habitats, including
those that are (a) legally
protected, (b) officially proposed
for protection, (c) identified by
authoritative sources for their
high conservation value or (d)
recognized as protected by
traditional local communities.
No risk detected Low Soil / Plants / Animals /
Energy / Air / Water
Anti-Corruption
11 The project does not involve and
is not complicit in corruption.
No risk detected Low Societal / Cultural /
Economic
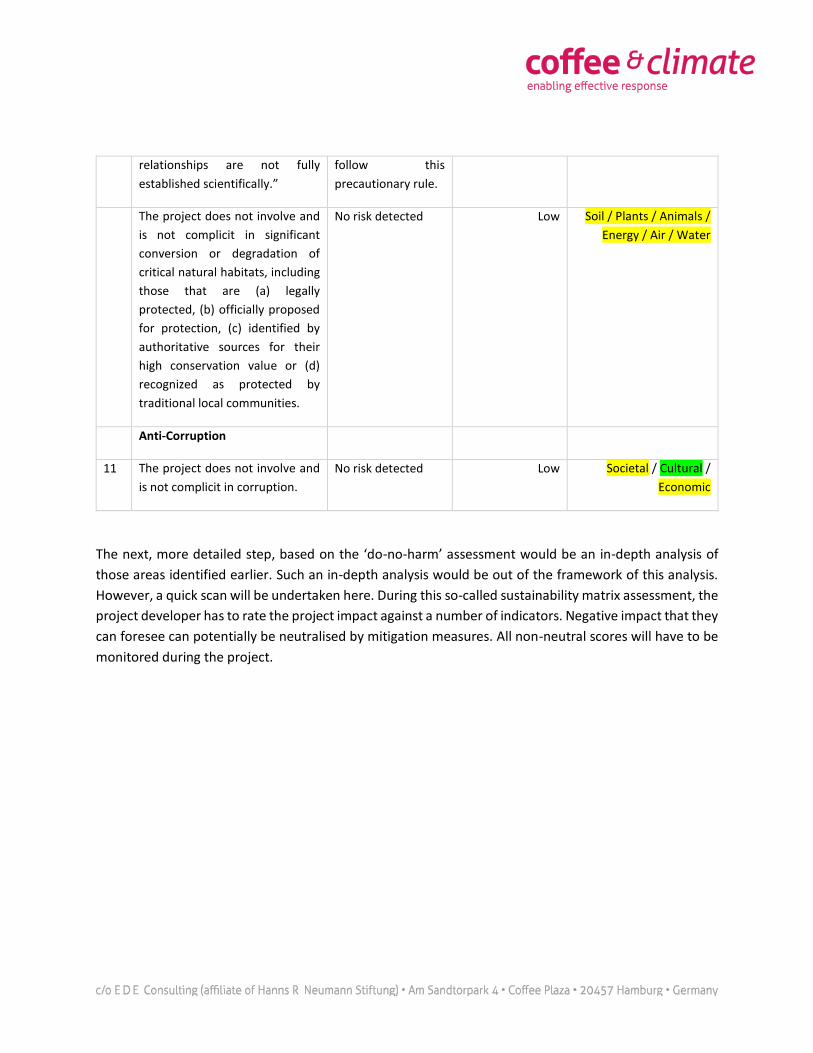
The next, more detailed step, based on the ‘do-no-harm’ assessment would be an in-depth analysis of
those areas identified earlier. Such an in-depth analysis would be out of the framework of this analysis.
However, a quick scan will be undertaken here. During this so-called sustainability matrix assessment, the
project developer has to rate the project impact against a number of indicators. Negative impact that they
can foresee can potentially be neutralised by mitigation measures. All non-neutral scores will have to be
monitored during the project.
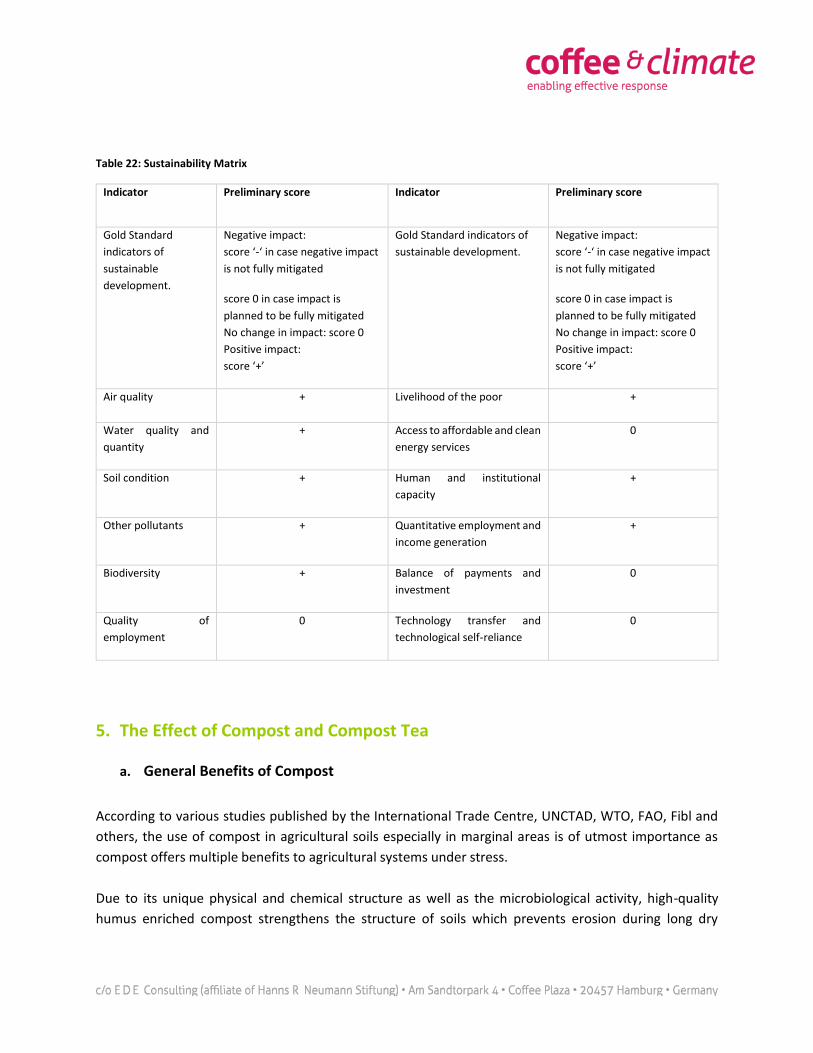
Table 22: Sustainability Matrix
Indicator Preliminary score Indicator Preliminary score
Gold Standard
indicators of
sustainable
development.
Negative impact:
score ‘-‘ in case negative impact
is not fully mitigated
score 0 in case impact is
planned to be fully mitigated
No change in impact: score 0
Positive impact:
score ‘+’
Gold Standard indicators of
sustainable development.
Negative impact:
score ‘-‘ in case negative impact
is not fully mitigated
score 0 in case impact is
planned to be fully mitigated
No change in impact: score 0
Positive impact:
score ‘+’
Air quality + Livelihood of the poor +
Water quality and
quantity
+ Access to affordable and clean
energy services
0
Soil condition + Human and institutional
capacity
+
Other pollutants + Quantitative employment and
income generation
+
Biodiversity + Balance of payments and
investment
0
Quality of
employment
0 Technology transfer and
technological self-reliance
0
5. The Effect of Compost and Compost Tea
a. General Benefits of Compost
According to various studies published by the International Trade Centre, UNCTAD, WTO, FAO, Fibl and
others, the use of compost in agricultural soils especially in marginal areas is of utmost importance as
compost offers multiple benefits to agricultural systems under stress.
Due to its unique physical and chemical structure as well as the microbiological activity, high-quality
humus enriched compost strengthens the structure of soils which prevents erosion during long dry
periods or floods caused by irregular rainfall, meaning compost enriched soils are more resistant to
extreme weather events which will happen more often due to climate change.
Additionally compost proved to be the main factor which made sustainable farming systems in marginal
areas perform better regarding yields and plant health compared to conventional practices (Badgley et al.
2007).
Especially the positive impact of compost on the water holding capacity of soils improves the sustainable
competitiveness of compost based agricultural practices. Due to less leakage and optimal pf-curves, crops
grown in compost enriched soils need up to 40% less irrigation water.
In times of climate change, emissions reduction policies and proposed carbon tax, the fact that compost
stimulates the carbon sequestration potential of soils with up to 26 tons of carbon per hectare over time
makes compost based agricultural systems only more competitive (Louis Bolk, Soil & More 2009).
No compost means higher risk of erosion and potential loss of soil fertility.
Figure 5: Coffee Production in Nicaragua
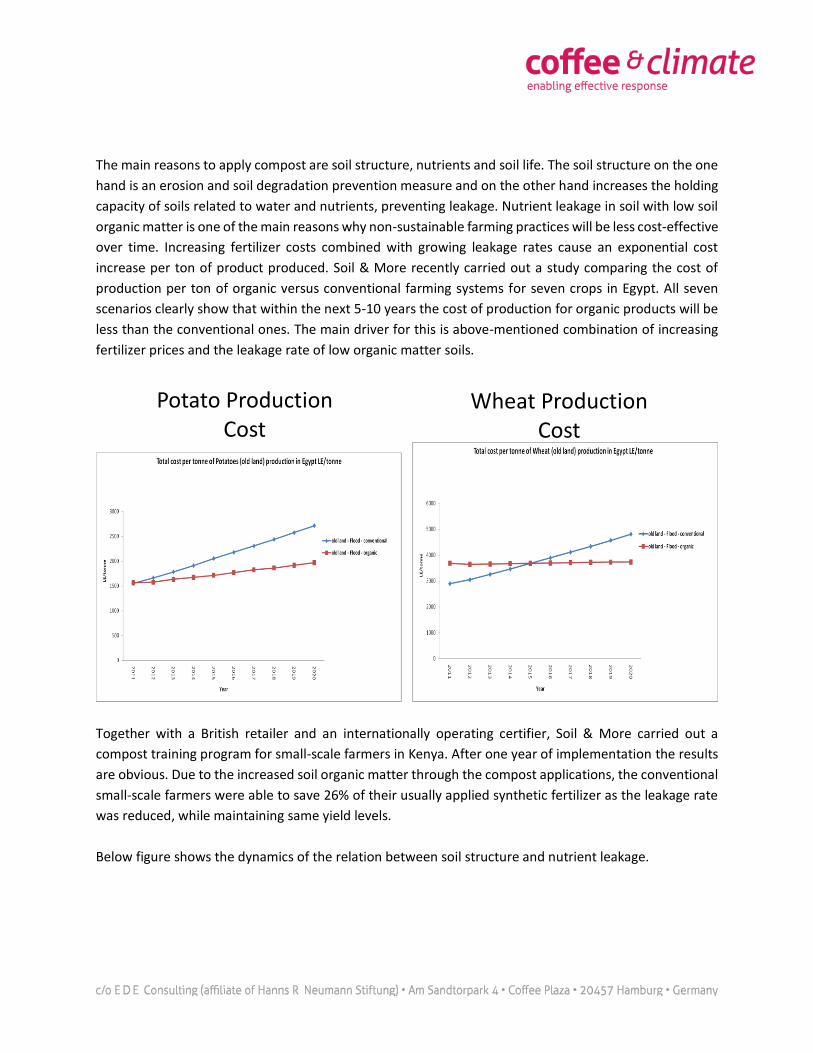
The main reasons to apply compost are soil structure, nutrients and soil life. The soil structure on the one
hand is an erosion and soil degradation prevention measure and on the other hand increases the holding
capacity of soils related to water and nutrients, preventing leakage. Nutrient leakage in soil with low soil
organic matter is one of the main reasons why non-sustainable farming practices will be less cost-effective
over time. Increasing fertilizer costs combined with growing leakage rates cause an exponential cost
increase per ton of product produced. Soil & More recently carried out a study comparing the cost of
production per ton of organic versus conventional farming systems for seven crops in Egypt. All seven
scenarios clearly show that within the next 5-10 years the cost of production for organic products will be
less than the conventional ones. The main driver for this is above-mentioned combination of increasing
fertilizer prices and the leakage rate of low organic matter soils.
Together with a British retailer and an internationally operating certifier, Soil & More carried out a
compost training program for small-scale farmers in Kenya. After one year of implementation the results
are obvious. Due to the increased soil organic matter through the compost applications, the conventional
small-scale farmers were able to save 26% of their usually applied synthetic fertilizer as the leakage rate
was reduced, while maintaining same yield levels.
Below figure shows the dynamics of the relation between soil structure and nutrient leakage.
Wheat Production Cost
blue = conventional; red
Potato Production Cost
blue = conventional; red
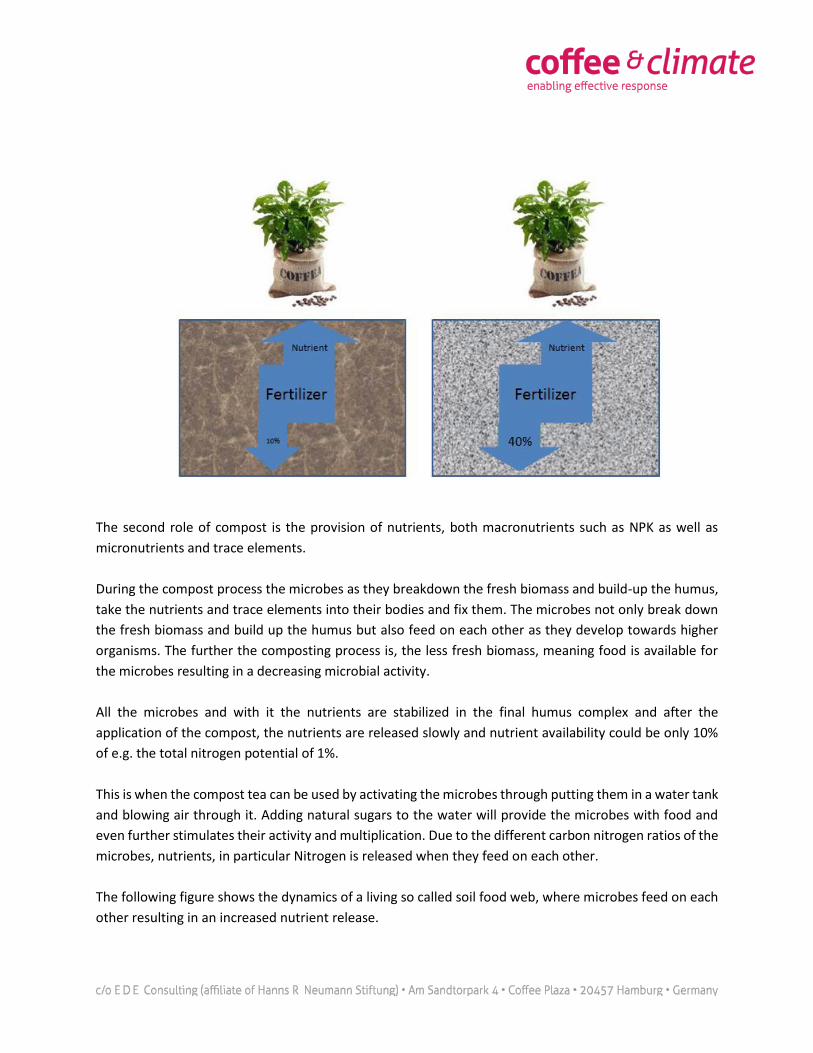
The second role of compost is the provision of nutrients, both macronutrients such as NPK as well as
micronutrients and trace elements.
During the compost process the microbes as they breakdown the fresh biomass and build-up the humus,
take the nutrients and trace elements into their bodies and fix them. The microbes not only break down
the fresh biomass and build up the humus but also feed on each other as they develop towards higher
organisms. The further the composting process is, the less fresh biomass, meaning food is available for
the microbes resulting in a decreasing microbial activity.
All the microbes and with it the nutrients are stabilized in the final humus complex and after the
application of the compost, the nutrients are released slowly and nutrient availability could be only 10%
of e.g. the total nitrogen potential of 1%.
This is when the compost tea can be used by activating the microbes through putting them in a water tank
and blowing air through it. Adding natural sugars to the water will provide the microbes with food and
even further stimulates their activity and multiplication. Due to the different carbon nitrogen ratios of the
microbes, nutrients, in particular Nitrogen is released when they feed on each other.
The following figure shows the dynamics of a living so called soil food web, where microbes feed on each
other resulting in an increased nutrient release.
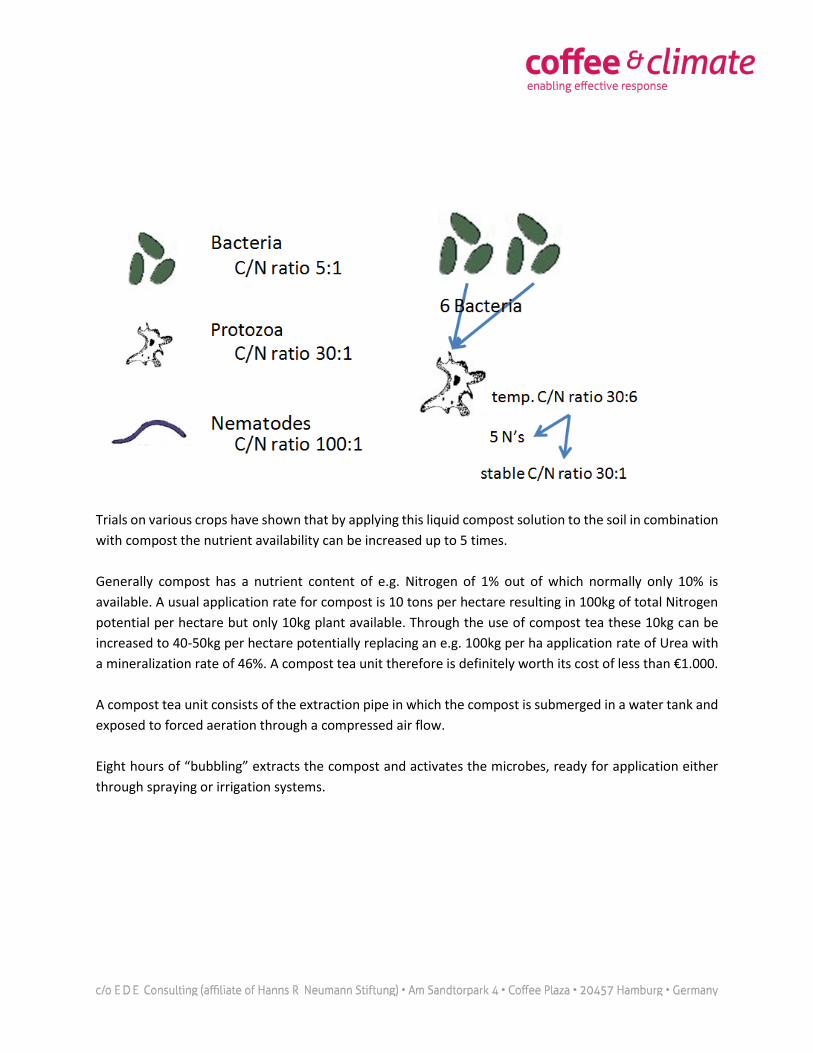
Trials on various crops have shown that by applying this liquid compost solution to the soil in combination
with compost the nutrient availability can be increased up to 5 times.
Generally compost has a nutrient content of e.g. Nitrogen of 1% out of which normally only 10% is
available. A usual application rate for compost is 10 tons per hectare resulting in 100kg of total Nitrogen
potential per hectare but only 10kg plant available. Through the use of compost tea these 10kg can be
increased to 40-50kg per hectare potentially replacing an e.g. 100kg per ha application rate of Urea with
a mineralization rate of 46%. A compost tea unit therefore is definitely worth its cost of less than €1.000.
A compost tea unit consists of the extraction pipe in which the compost is submerged in a water tank and
exposed to forced aeration through a compressed air flow.
Eight hours of “bubbling” extracts the compost and activates the microbes, ready for application either
through spraying or irrigation systems.
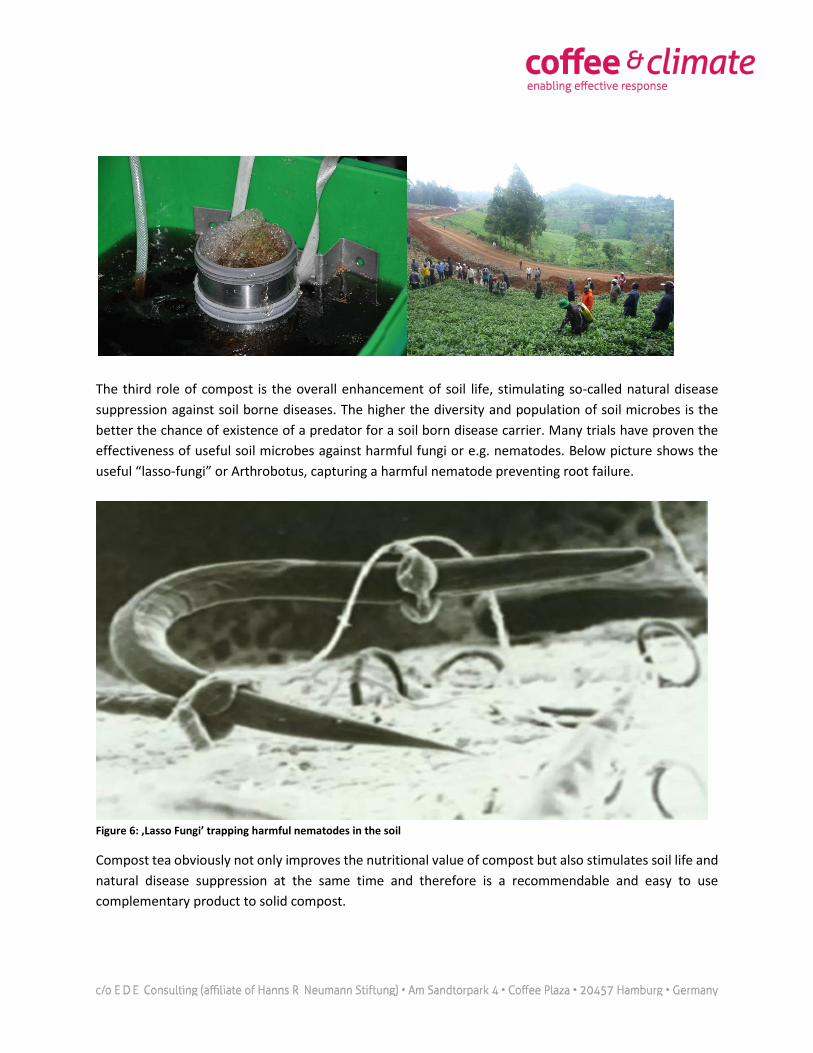
The third role of compost is the overall enhancement of soil life, stimulating so-called natural disease
suppression against soil borne diseases. The higher the diversity and population of soil microbes is the
better the chance of existence of a predator for a soil born disease carrier. Many trials have proven the
effectiveness of useful soil microbes against harmful fungi or e.g. nematodes. Below picture shows the
useful “lasso-fungi” or Arthrobotus, capturing a harmful nematode preventing root failure.
Figure 6: ‚Lasso Fungi’ trapping harmful nematodes in the soil
Compost tea obviously not only improves the nutritional value of compost but also stimulates soil life and
natural disease suppression at the same time and therefore is a recommendable and easy to use
complementary product to solid compost.
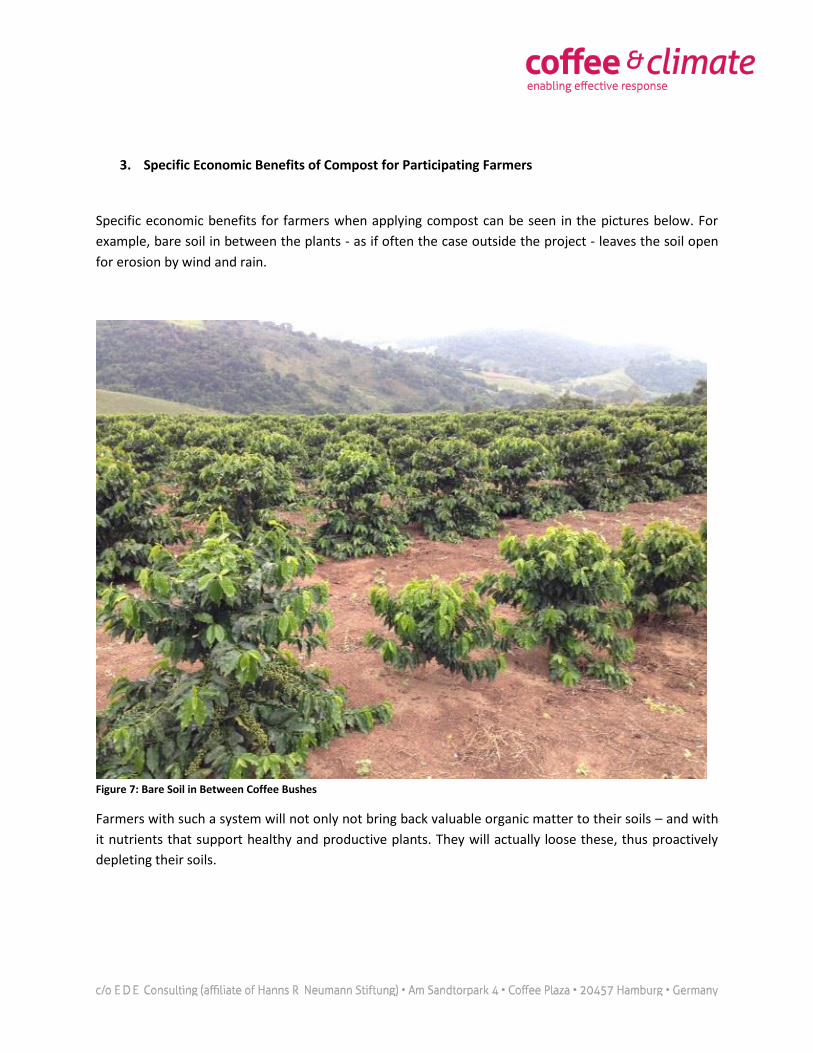
3. Specific Economic Benefits of Compost for Participating Farmers
Specific economic benefits for farmers when applying compost can be seen in the pictures below. For
example, bare soil in between the plants - as if often the case outside the project - leaves the soil open
for erosion by wind and rain.
Figure 7: Bare Soil in Between Coffee Bushes
Farmers with such a system will not only not bring back valuable organic matter to their soils – and with
it nutrients that support healthy and productive plants. They will actually loose these, thus proactively
depleting their soils.
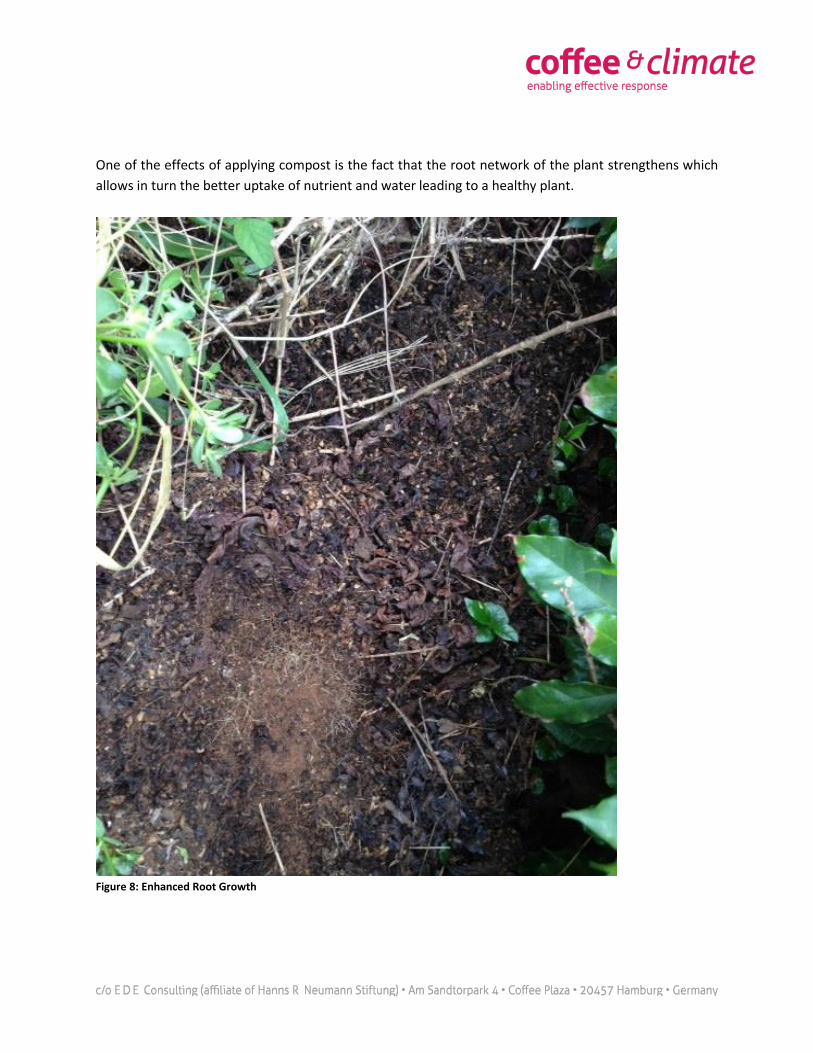
One of the effects of applying compost is the fact that the root network of the plant strengthens which
allows in turn the better uptake of nutrient and water leading to a healthy plant.
Figure 8: Enhanced Root Growth
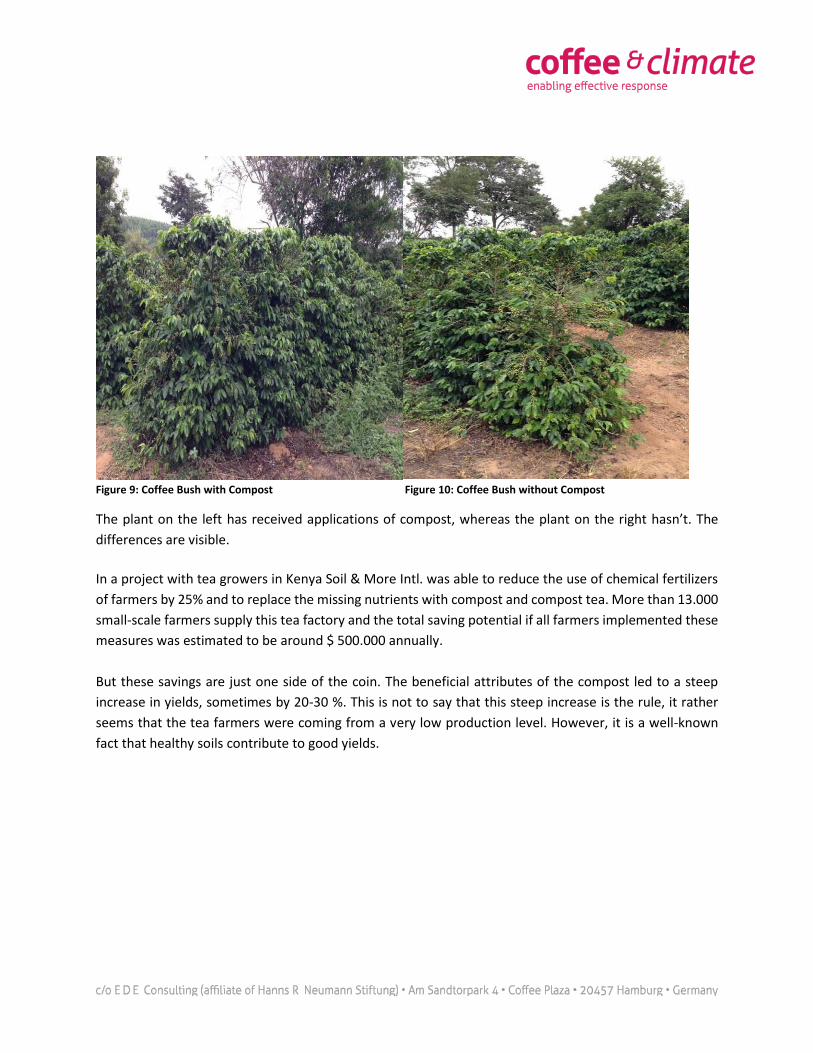
Figure 9: Coffee Bush with Compost Figure 10: Coffee Bush without Compost
The plant on the left has received applications of compost, whereas the plant on the right hasn’t. The
differences are visible.
In a project with tea growers in Kenya Soil & More Intl. was able to reduce the use of chemical fertilizers
of farmers by 25% and to replace the missing nutrients with compost and compost tea. More than 13.000
small-scale farmers supply this tea factory and the total saving potential if all farmers implemented these
measures was estimated to be around $ 500.000 annually.
But these savings are just one side of the coin. The beneficial attributes of the compost led to a steep
increase in yields, sometimes by 20-30 %. This is not to say that this steep increase is the rule, it rather
seems that the tea farmers were coming from a very low production level. However, it is a well-known
fact that healthy soils contribute to good yields.

6. Conclusion and next steps
a. Conclusion on Technical / Financial Feasibility
A large-scale composting facility – the core approach under scrutiny here in this study – is unfortunately
financially not feasible. As explained earlier the high input costs, prohibitive transport costs and an under-
developed market for high quality compost rule out this option.
A de-centralised option however shows potential to be feasible to generate carbon credits. This would
have to be further investigated once certain parameters are established. Questions like, how many
farmers would actually incorporate farm-made compost and the planting of shade trees or living fences
need to be answered before detailed calculations can be made.
But potential reductions of up to 24.000 tons from a compost scenario (excluding trees) alone are already
encouraging and this path should be further investigated while including trees in the calculations.
Especially as many of the actual practices are in place or will be implemented soon – a great advantage
to other projects that often struggle with this part. In this case we will ‘only’ have to add the
corresponding reduction figures next to the relevant action plans.
b. ‘Social’ Feasibility
As was established through the Sustainability Flower Quick Assessment the project activities have already
had a very beneficial impact on the farming communities that participate in comparison to those outside
the project. Sustainable farming practices, access to training and to experts allows a good rating across
the board of the nine dimensions and the trend is looking positive.
The assessment according to the sustainability flower also helped to establish a first understanding of the
projects’ potential performance against the Gold Standard Sustainability requirements. And it can be
stated that it performed rather well and there do not seem to be any major obstacles from this angle at
this point in time.
c. The Way Forward
1. Setting up The Project
The recommendation that can be given here is to further investigate the opportunities of a de-centralized
compost / afforestation option.
The required next steps would entail:
Further integration of composting and tree planting in the overall project design and share these
plans with Soil & More Intl. for investigation
Calculation of emission reductions based on different adoption scenarios
Community engagement to negotiate participation and share of revenues (if any)
Project Design Document (PDD) development
2. Integrating existing Monitoring Skills
One of the major challenges for carbon sequestration projects is the question of how to effectively
monitor the adoption of project activities. coffee & climate is an exceptional position here, having this
infrastructure already in place.
This structure would not only be crucial for the implementation of project activities but also during the
project life and especially for certification purposes.
In a nutshell it could look like this:
coffee & climate and farmers jointly agree to implement certain activities that reduce / sequester carbon
emissions. A plan is drawn up, which gives information about the total emission reductions at different
adoption rates of these practices across the project participants. For example, one could estimate that
50% of the farmers actually implement the measures and that would result in a certain amount of
emission reductions. During the certification, the auditors will then investigate whether actually 50% of
the farmers have implemented the measures.
This is where any kind of monitoring infrastructure will come in handy.
3. Scalability to Other Countries / Projects
The measures and approaches here suggested can be rolled-out to other countries where HRN foundation
and coffee & climate is active. Actually, it might very well be that from a carbon credit perspective Brazil
might be the least feasible country due to its overall development status and the resulting costs (as
mentioned above).
It might very well be that a centralized composting facility in – for example – Tanzania would be quite
feasible; or the de-centralized option; or both.
The really encouraging part though is that the measures are already road-tested, the HRN infrastructure
for project delivery and monitoring are given in these countries as well. All one has to do is to put the
amount of carbon reduced / sequestered next to the project activities and to scale it up.
coffee & climate has therefore a great opportunity to benefit from but also to influence the development
of the Gold standards’ climate smart agriculture methodologies – an opportunity that should not be
missed.