Embed Size (px)
Citation preview
Connecting the Dots:
Opportunities for Regional Transit Cooperation
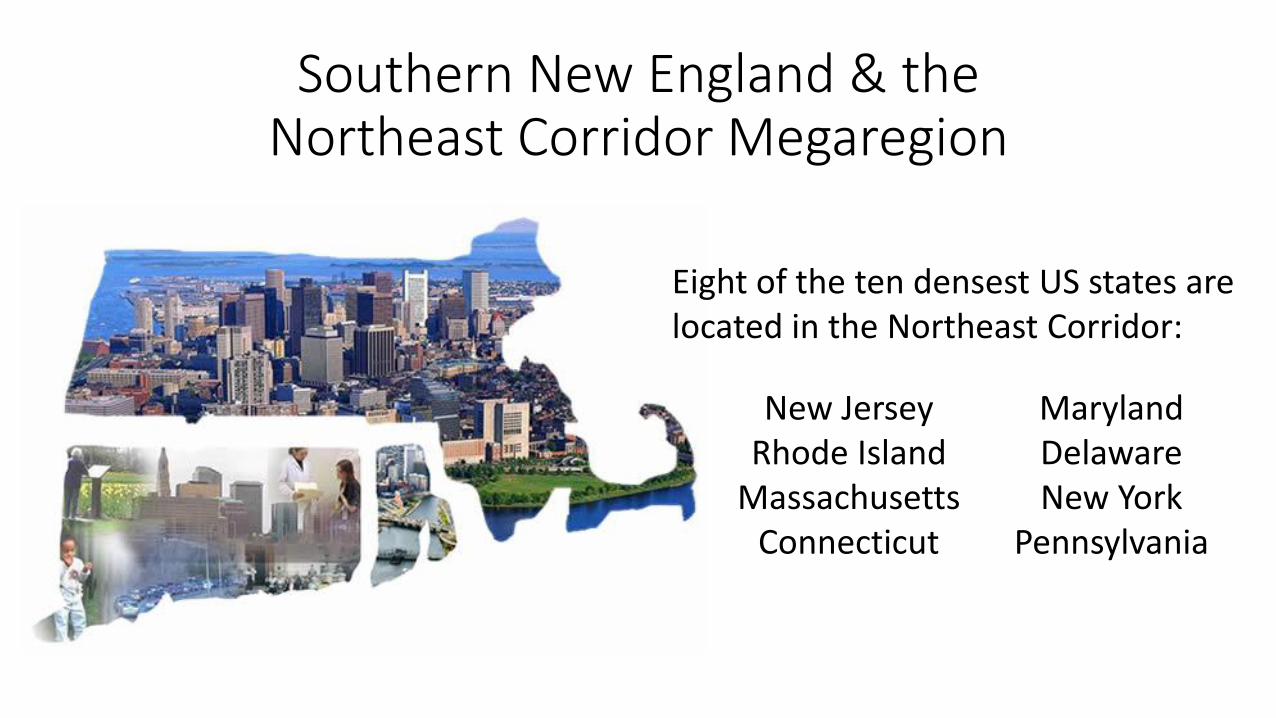
Southern New England & the Northeast Corridor Megaregion
Eight of the ten densest US states are located in the Northeast Corridor:
New Jersey Rhode Island
Massachusetts Connecticut
Maryland Delaware New York
Pennsylvania
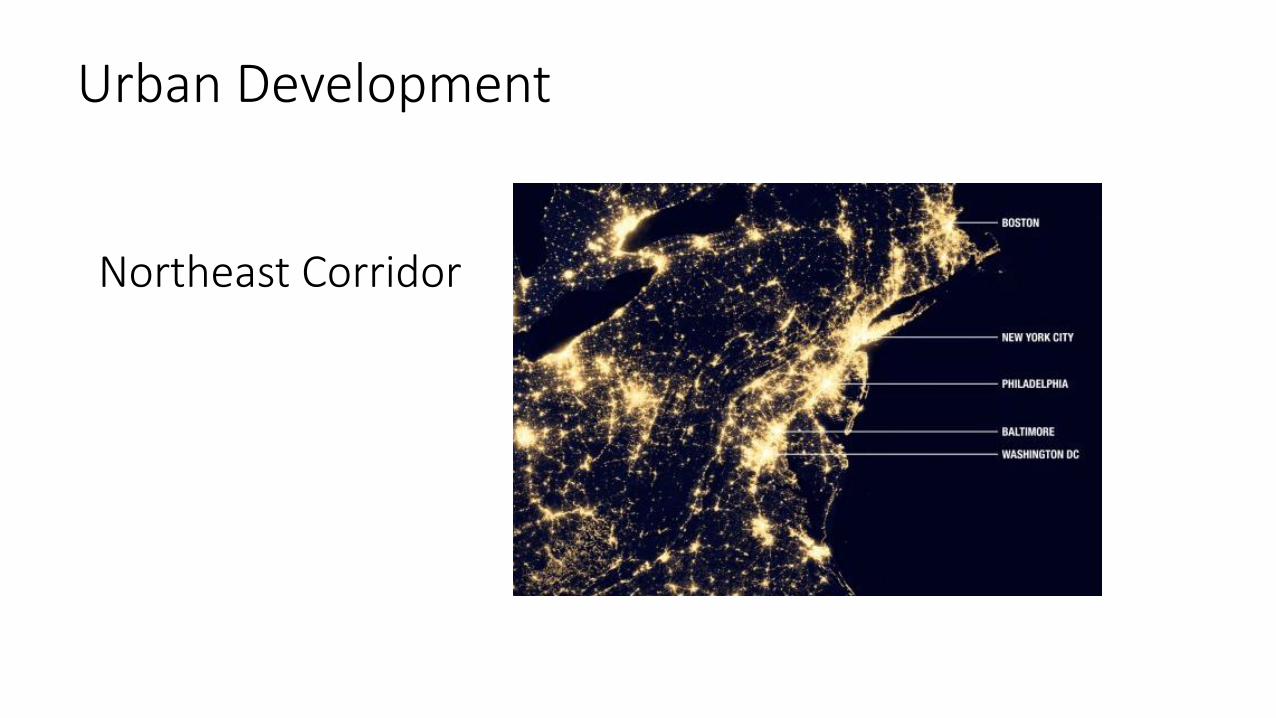
Northeast Corridor
Urban Development
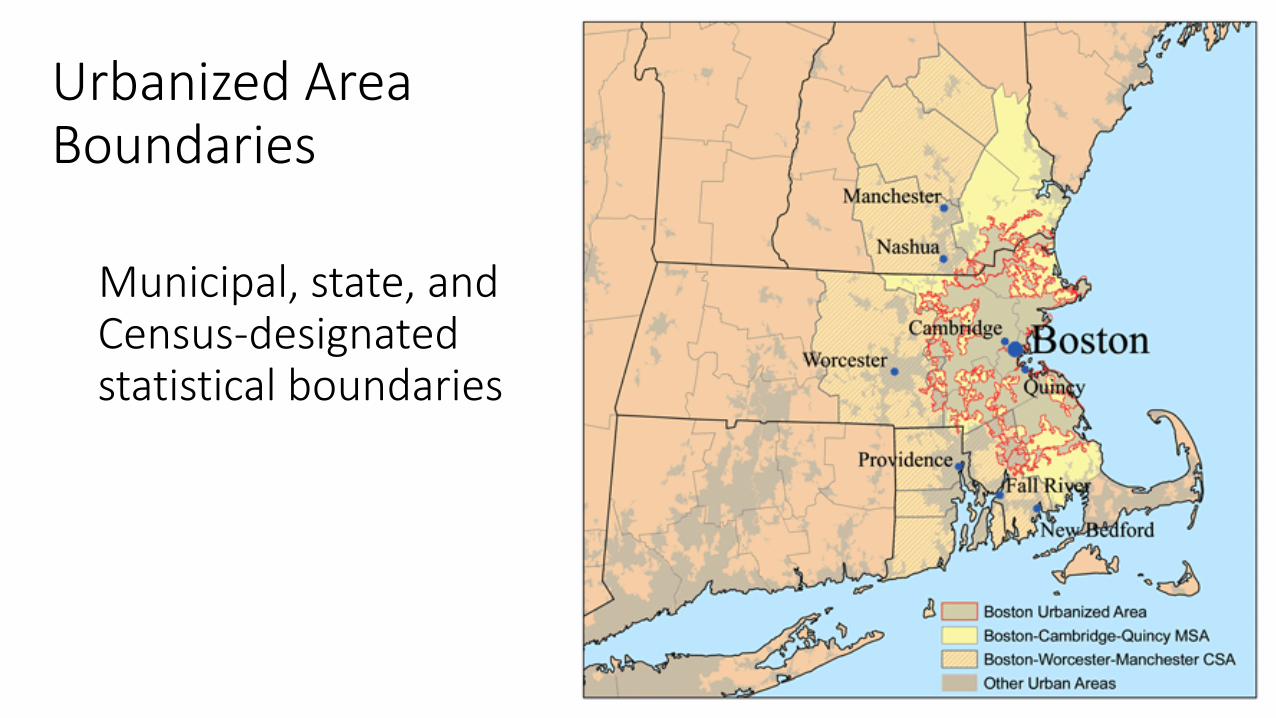
Urbanized Area Boundaries
Municipal, state, and Census-designated statistical boundaries
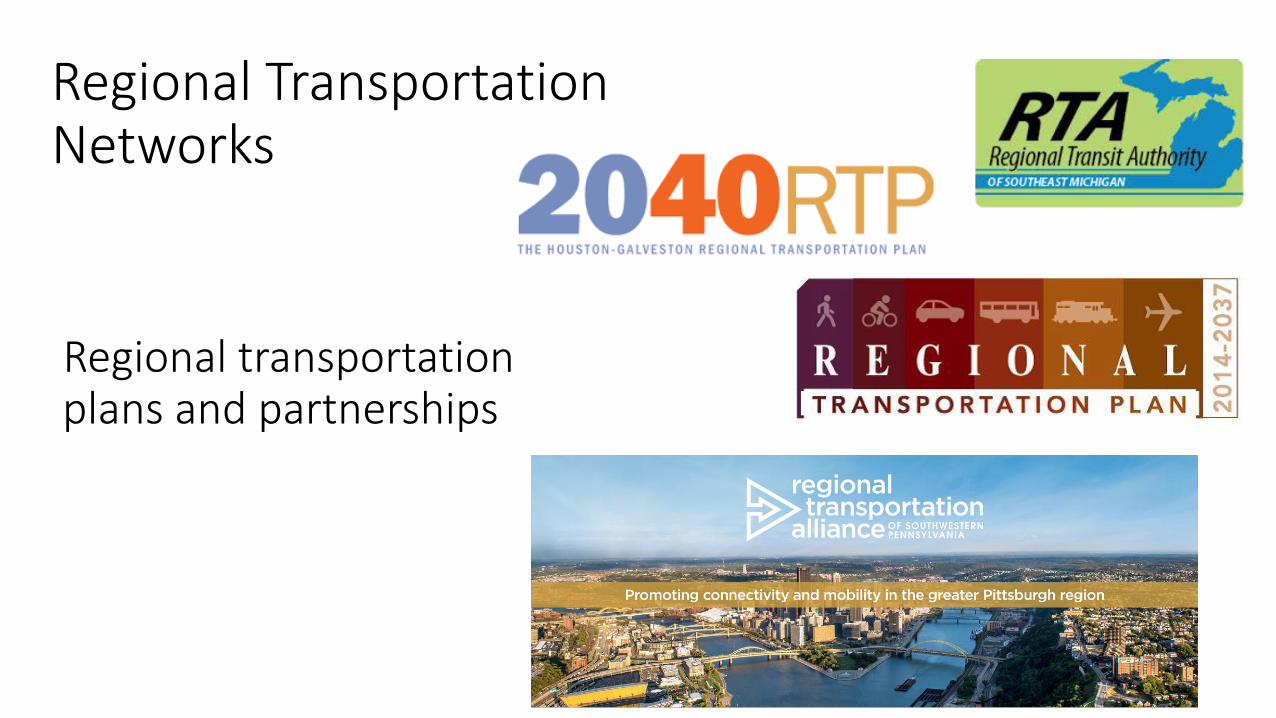
Regional Transportation Networks
Regional transportation plans and partnerships
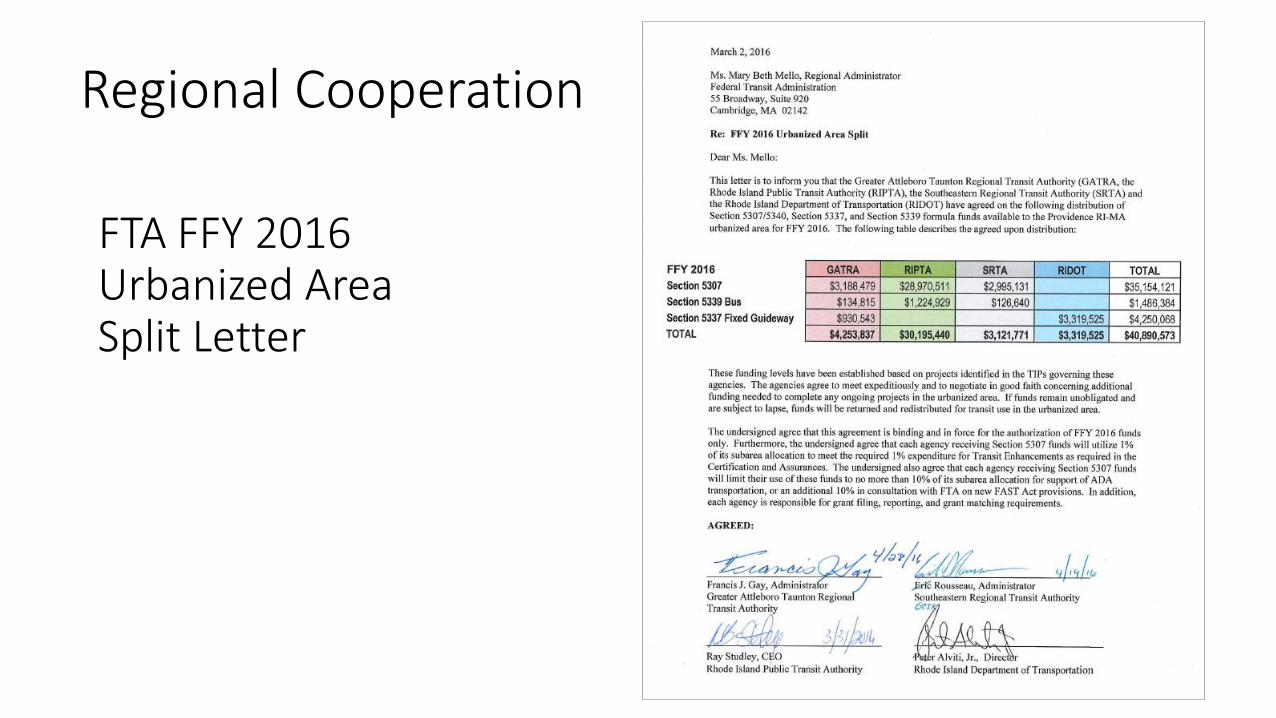
FTA FFY 2016 Urbanized Area Split Letter
Regional Cooperation
A New Federal Perspective?
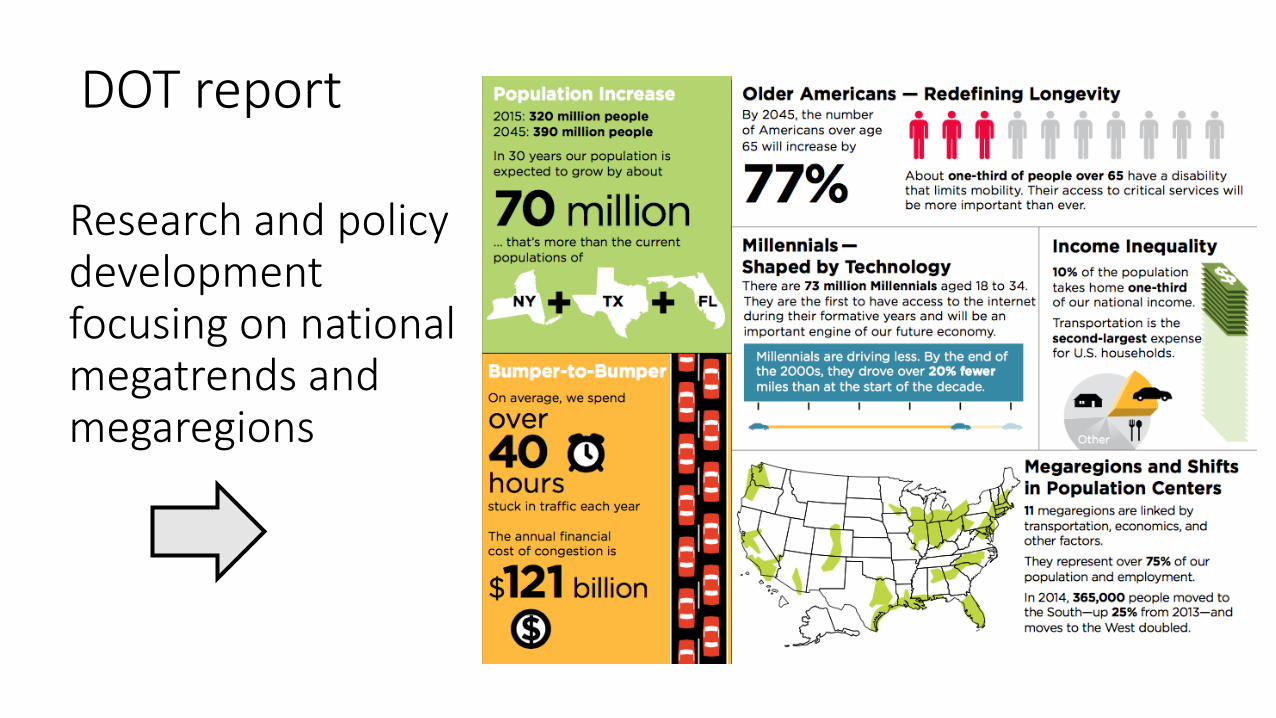
DOT report
Research and policy development focusing on national megatrends and megaregions
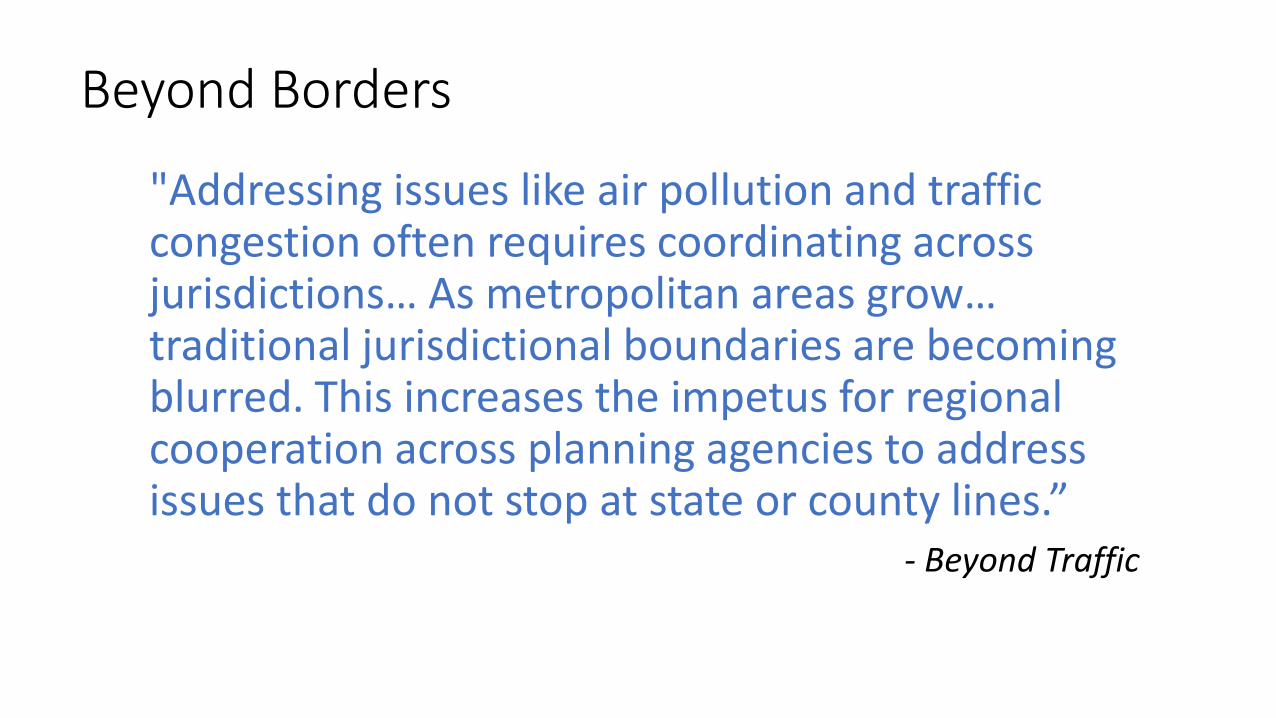
Beyond Borders
"Addressing issues like air pollution and traffic congestion often requires coordinating across jurisdictions… As metropolitan areas grow… traditional jurisdictional boundaries are becoming blurred. This increases the impetus for regional cooperation across planning agencies to address issues that do not stop at state or county lines.”
- Beyond Traffic
Performance Based
Planning
SNEAPA
10-20-16
2
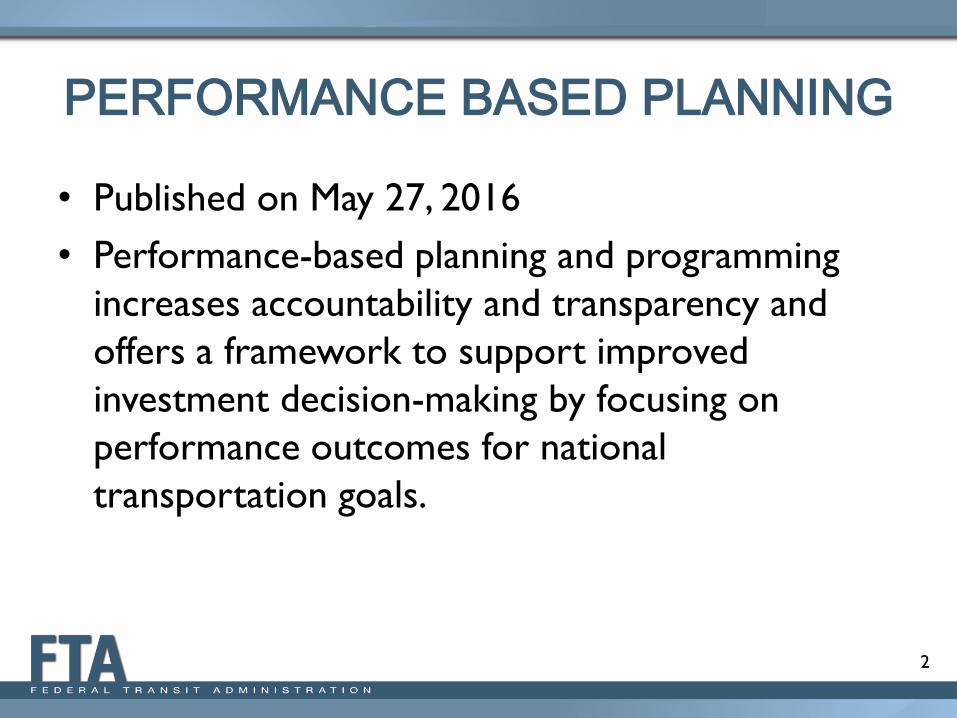
PERFORMANCE BASED PLANNING
• Published on May 27, 2016
• Performance-based planning and programming
increases accountability and transparency and
offers a framework to support improved
investment decision-making by focusing on
performance outcomes for national
transportation goals.
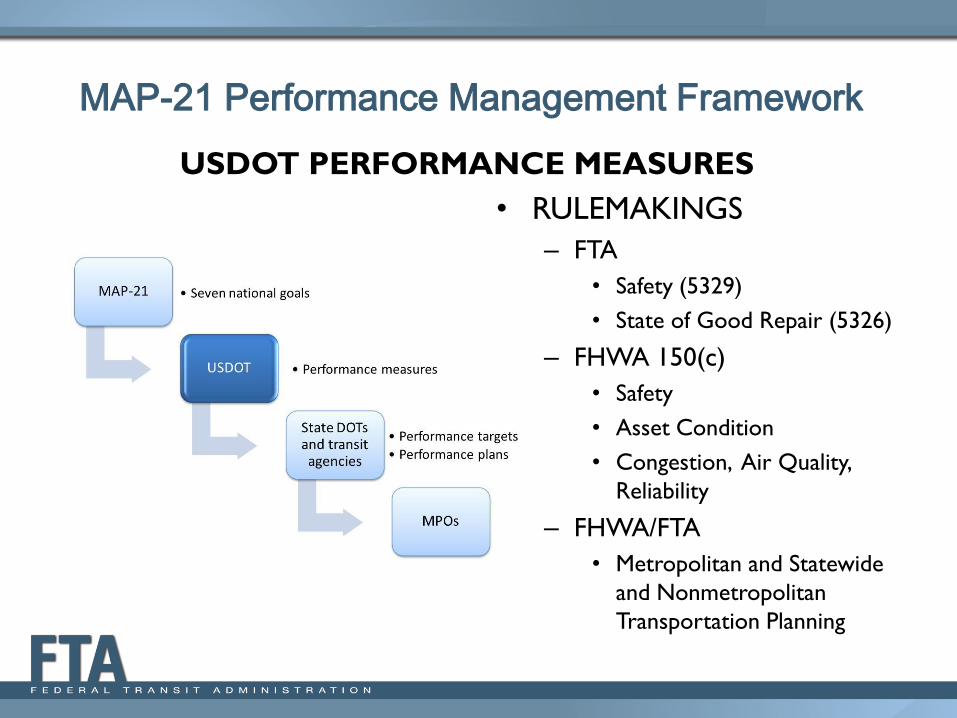
MAP-21 Performance Management Framework
USDOT PERFORMANCE MEASURES
• RULEMAKINGS
– FTA
• Safety (5329)
• State of Good Repair (5326)
– FHWA 150(c)
• Safety
• Asset Condition
• Congestion, Air Quality,
Reliability
– FHWA/FTA
• Metropolitan and Statewide
and Nonmetropolitan
Transportation Planning
MAP-21 Performance Management Framework
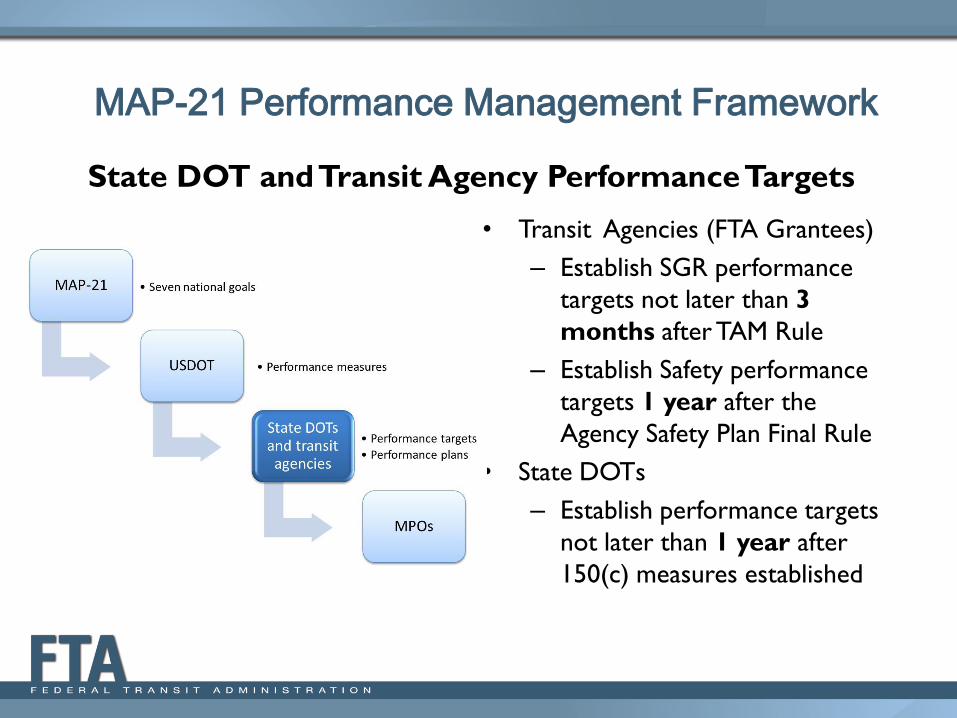
State DOT and Transit Agency Performance Targets
• Transit Agencies (FTA Grantees)
– Establish SGR performance
targets not later than 3
months after TAM Rule
– Establish Safety performance
targets 1 year after the
Agency Safety Plan Final Rule
• State DOTs
– Establish performance targets
not later than 1 year after
150(c) measures established
MAP-21 Performance Management Framework
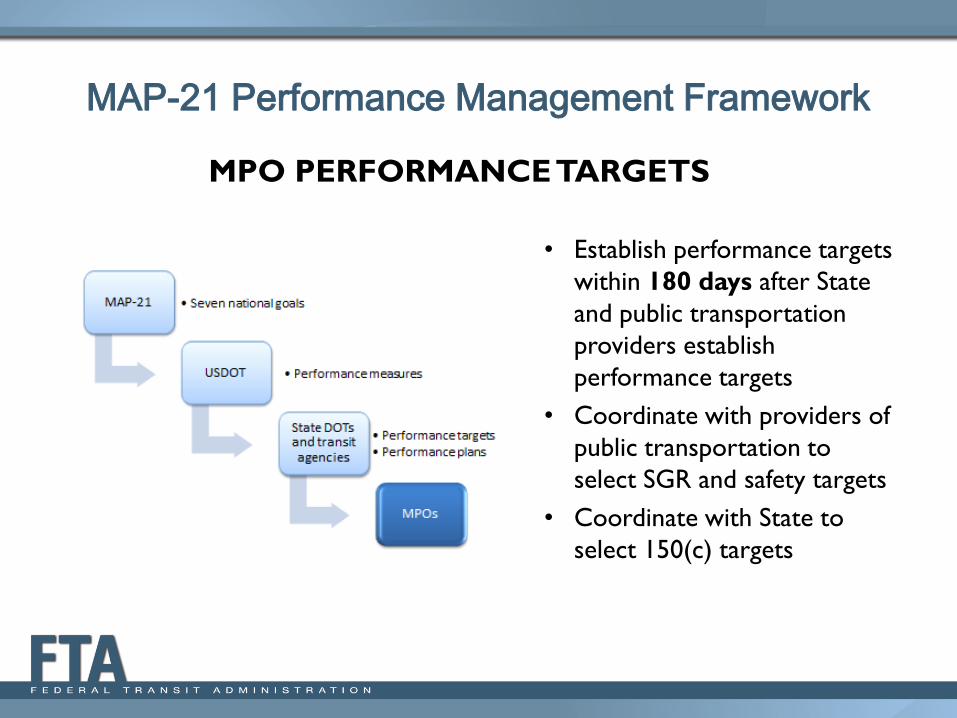
MPO PERFORMANCE TARGETS
• Establish performance targets
within 180 days after State
and public transportation
providers establish
performance targets
• Coordinate with providers of
public transportation to
select SGR and safety targets
• Coordinate with State to
select 150(c) targets
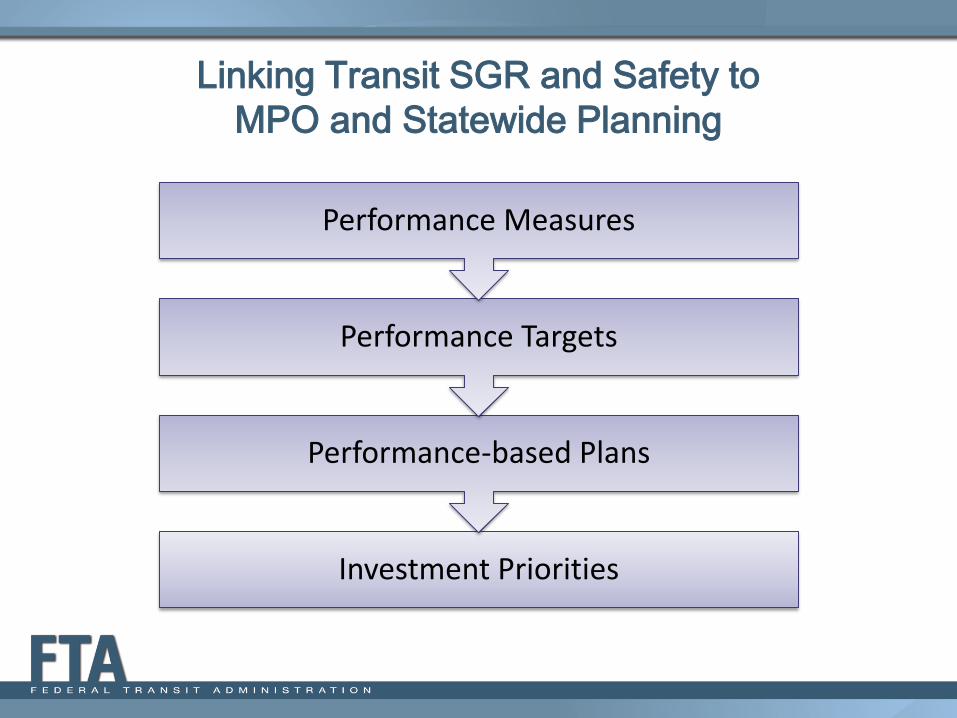
Linking Transit SGR and Safety to
MPO and Statewide Planning
Investment Priorities
Performance-based Plans
Performance Targets
Performance Measures
7
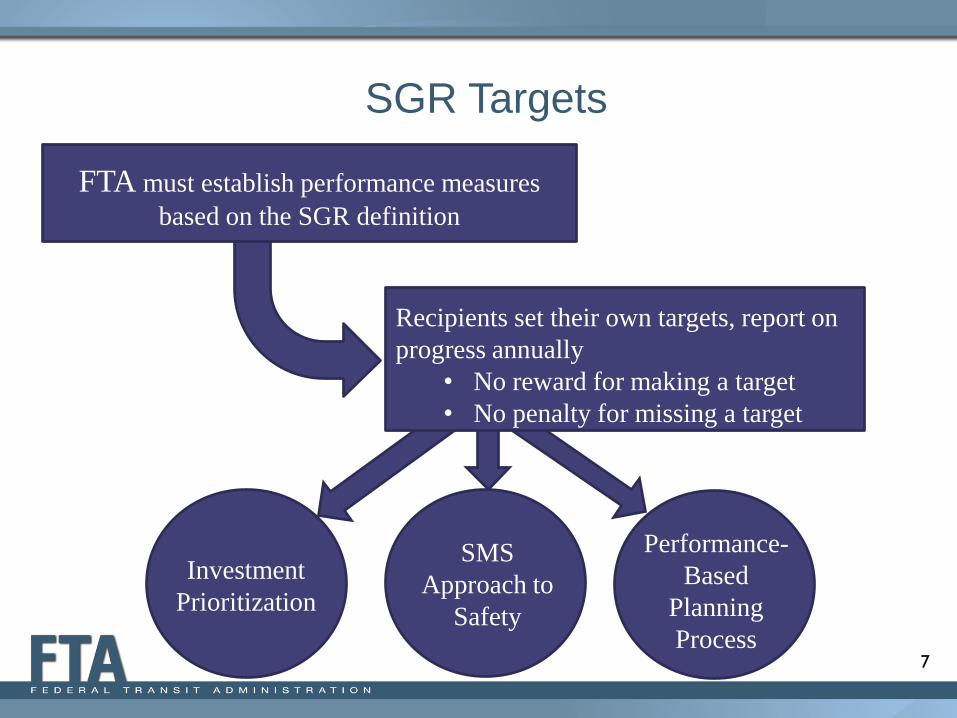
SGR Targets
FTA must establish performance measures
based on the SGR definition
Recipients set their own targets, report on
progress annually
• No reward for making a target
• No penalty for missing a target
Performance-
Based
Planning
Process
SMS
Approach to
Safety
Investment
Prioritization
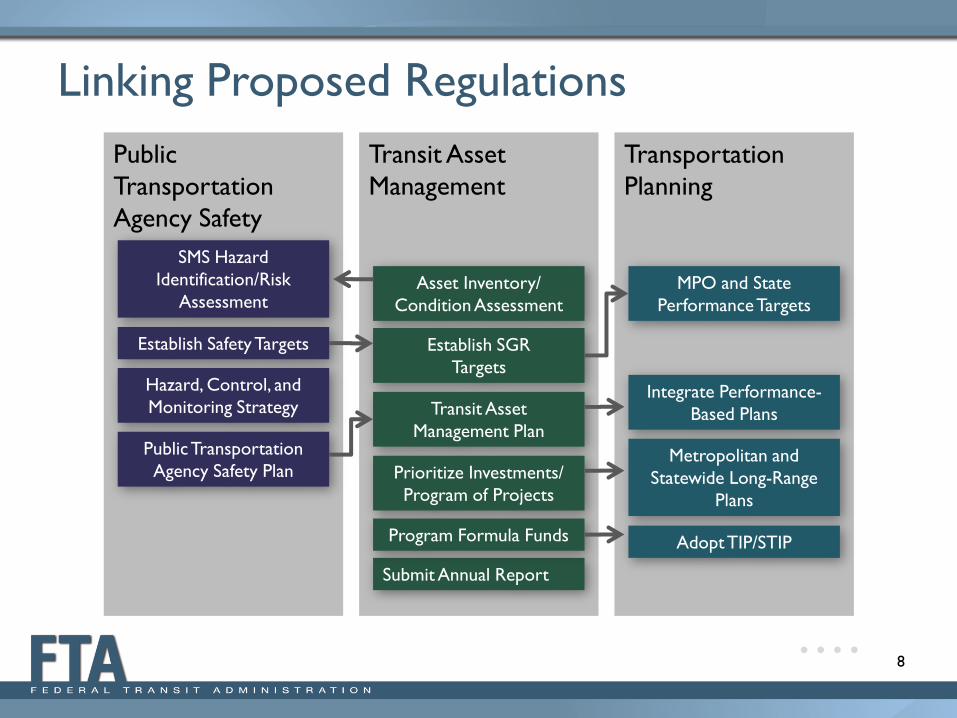
8
Public
Transportation
Agency Safety
Transit Asset
Management
Submit Annual Report
Transportation
Planning
SMS Hazard
Identification/Risk
Assessment
Establish Safety Targets
Hazard, Control, and
Monitoring Strategy
Public Transportation
Agency Safety Plan
Asset Inventory/
Condition Assessment
Establish SGR
Targets
Transit Asset
Management Plan
Prioritize Investments/
Program of Projects
Program Formula Funds
MPO and State
Performance Targets
Integrate Performance-
Based Plans
Metropolitan and
Statewide Long-Range
Plans
Adopt TIP/STIP
Linking Proposed Regulations
8 • • • •
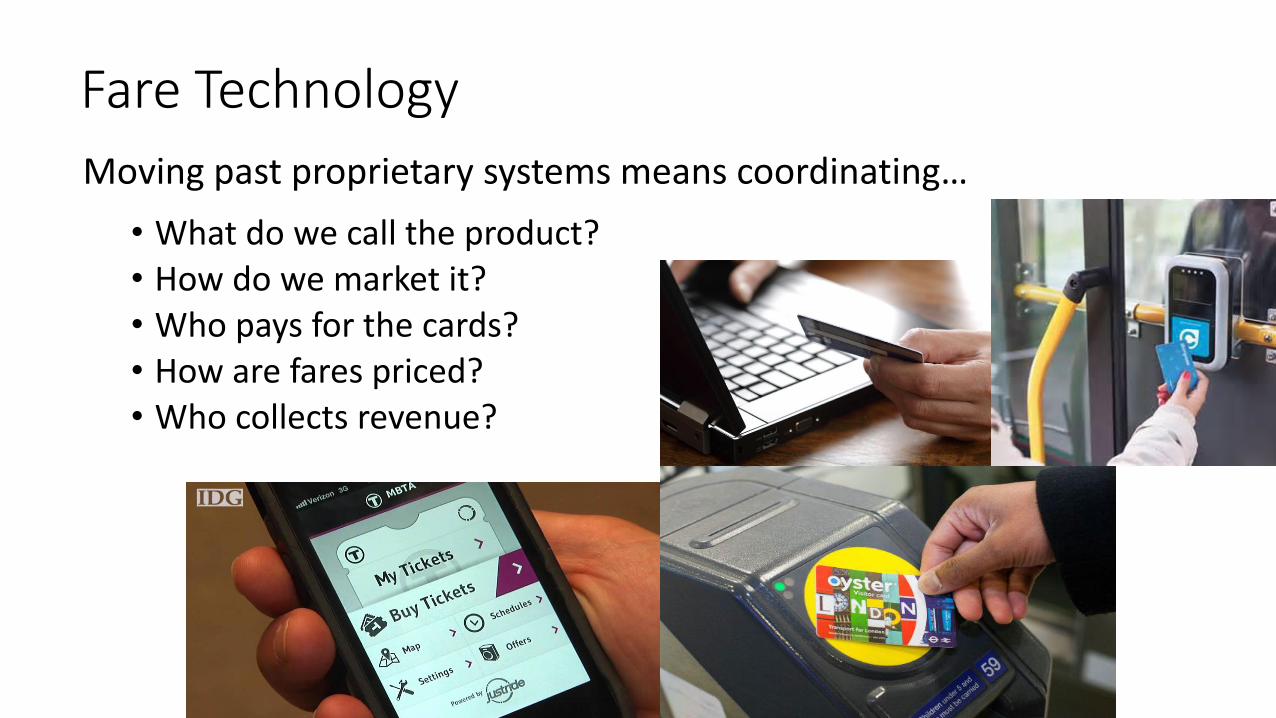
Moving past proprietary systems means coordinating…
• What do we call the product? • How do we market it? • Who pays for the cards? • How are fares priced? • Who collects revenue?
Fare Technology
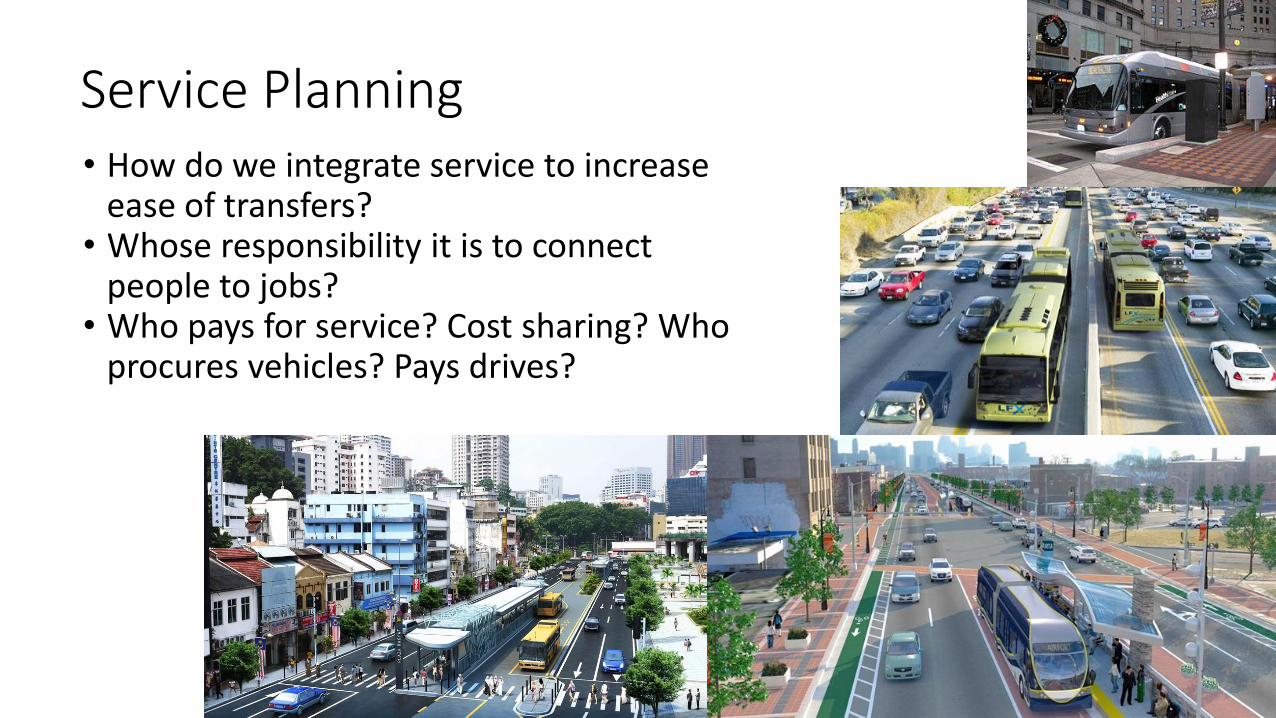
• How do we integrate service to increase ease of transfers?
• Whose responsibility it is to connect people to jobs?
• Who pays for service? Cost sharing? Who procures vehicles? Pays drives?
Service Planning
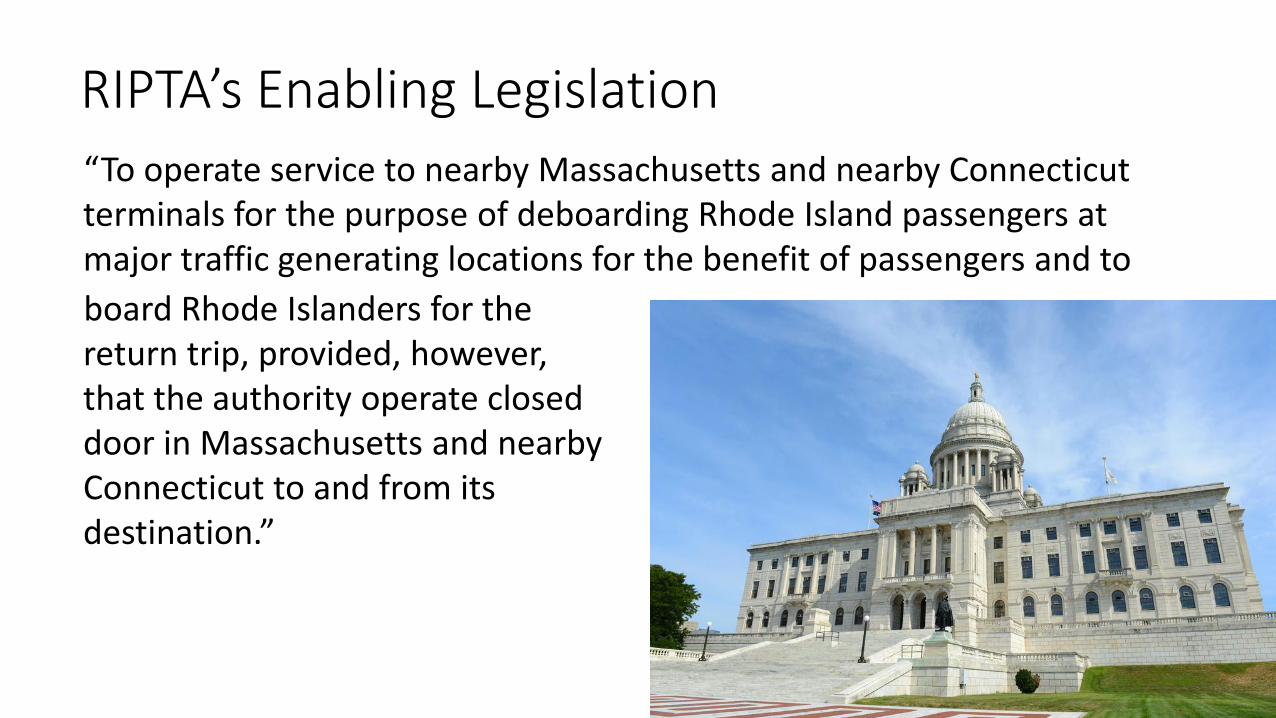
“To operate service to nearby Massachusetts and nearby Connecticut terminals for the purpose of deboarding Rhode Island passengers at major traffic generating locations for the benefit of passengers and to
RIPTA’s Enabling Legislation
board Rhode Islanders for the return trip, provided, however, that the authority operate closed door in Massachusetts and nearby Connecticut to and from its destination.”
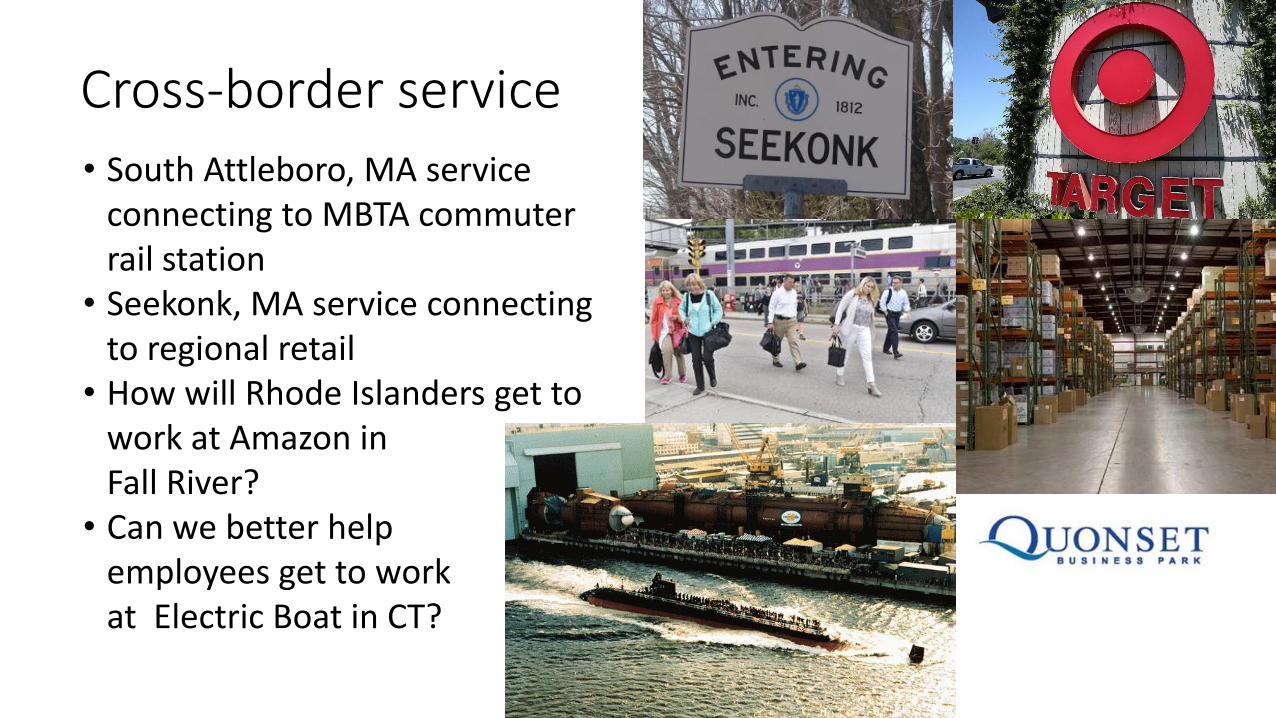
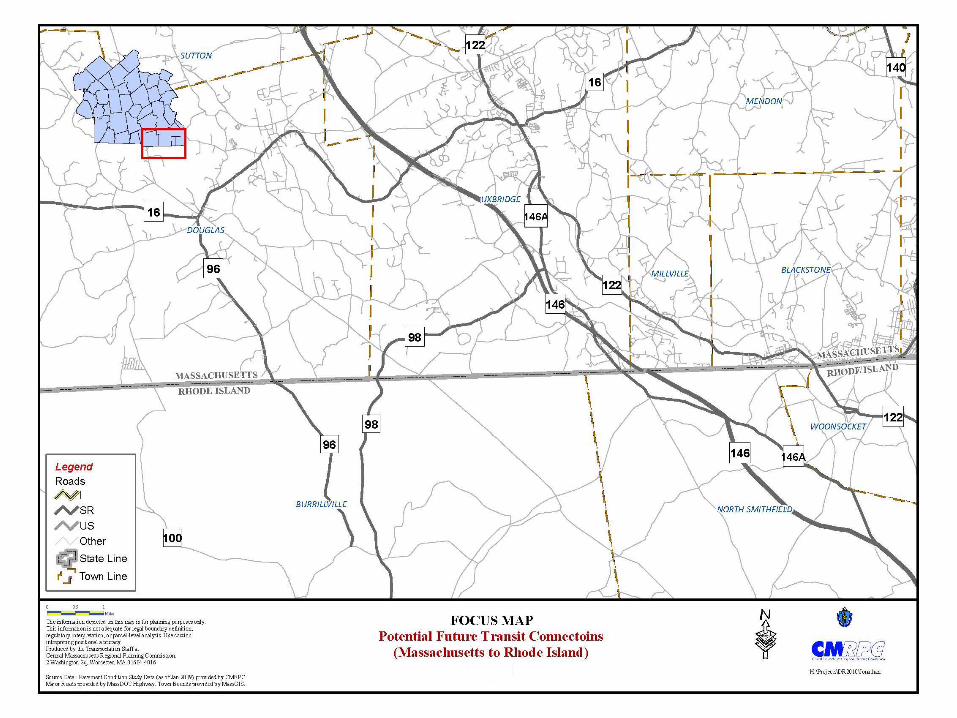
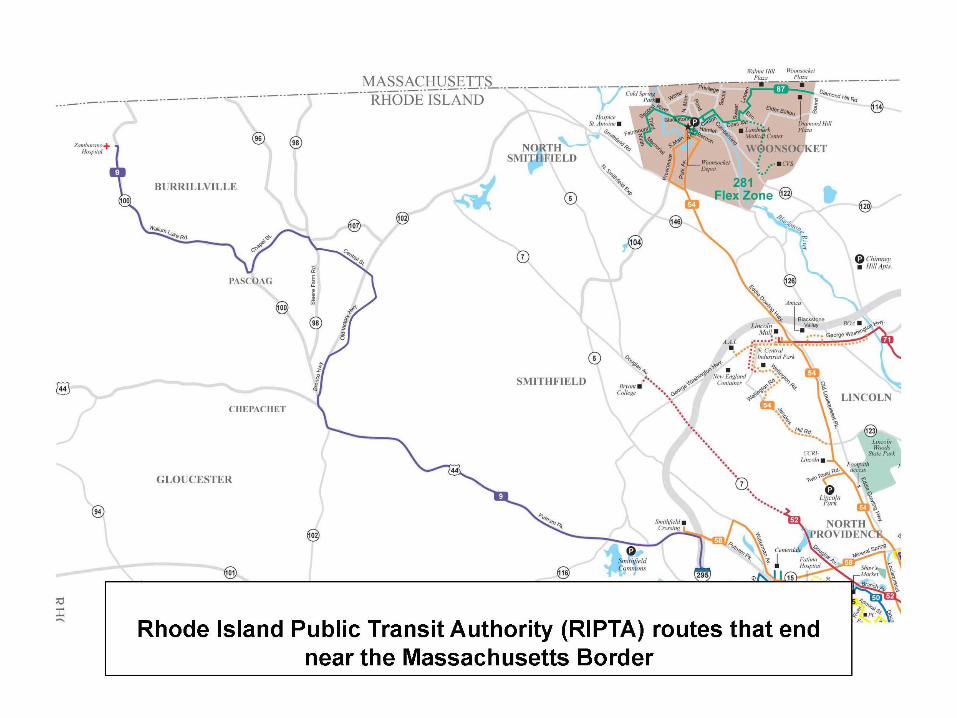
Cross-border service
• South Attleboro, MA service connecting to MBTA commuter rail station
• Seekonk, MA service connecting to regional retail
• How will Rhode Islanders get to work at Amazon in Fall River?
• Can we better help employees get to work at Electric Boat in CT?
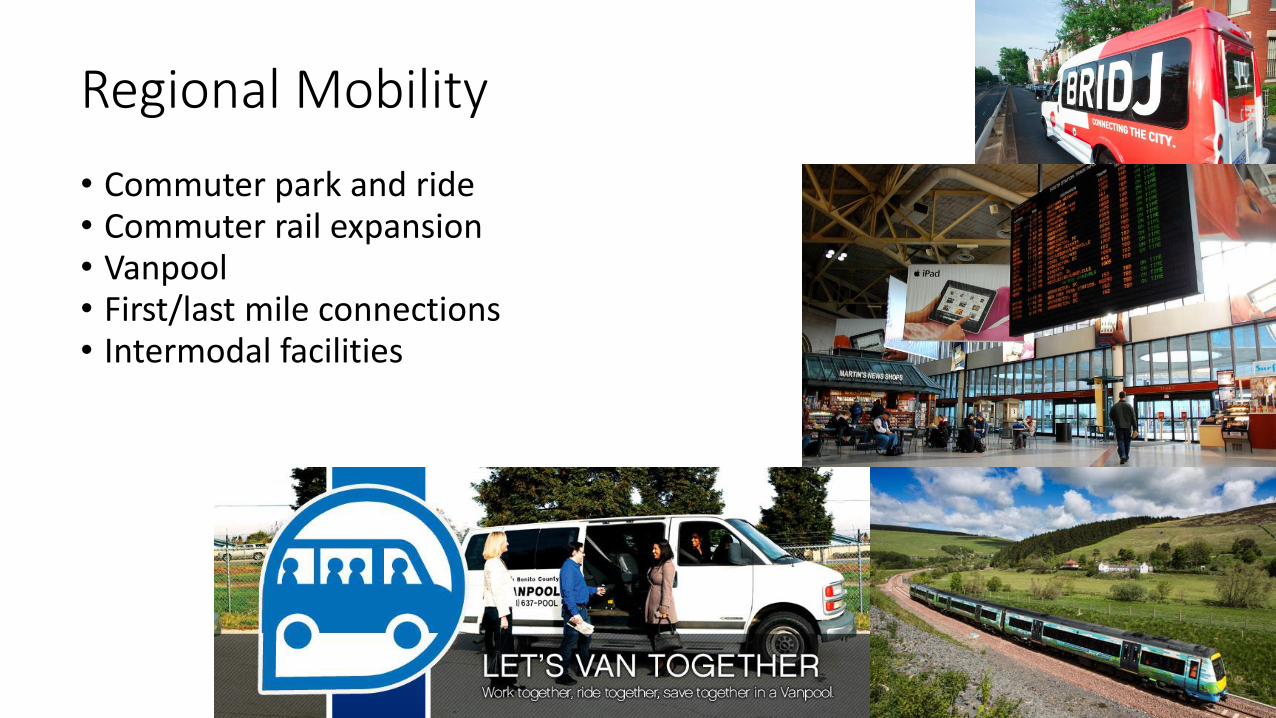
Regional Mobility
• Commuter park and ride • Commuter rail expansion • Vanpool • First/last mile connections • Intermodal facilities
Connecting the Dots: Opportunities for Regional Transit Cooperation
– A North Central Connecticut Perspective Lyle Wray, Executive Director
Capitol Region Council of Governments
SNEAPA 2016
October 20, 2016
DCU Center, Worcester MA
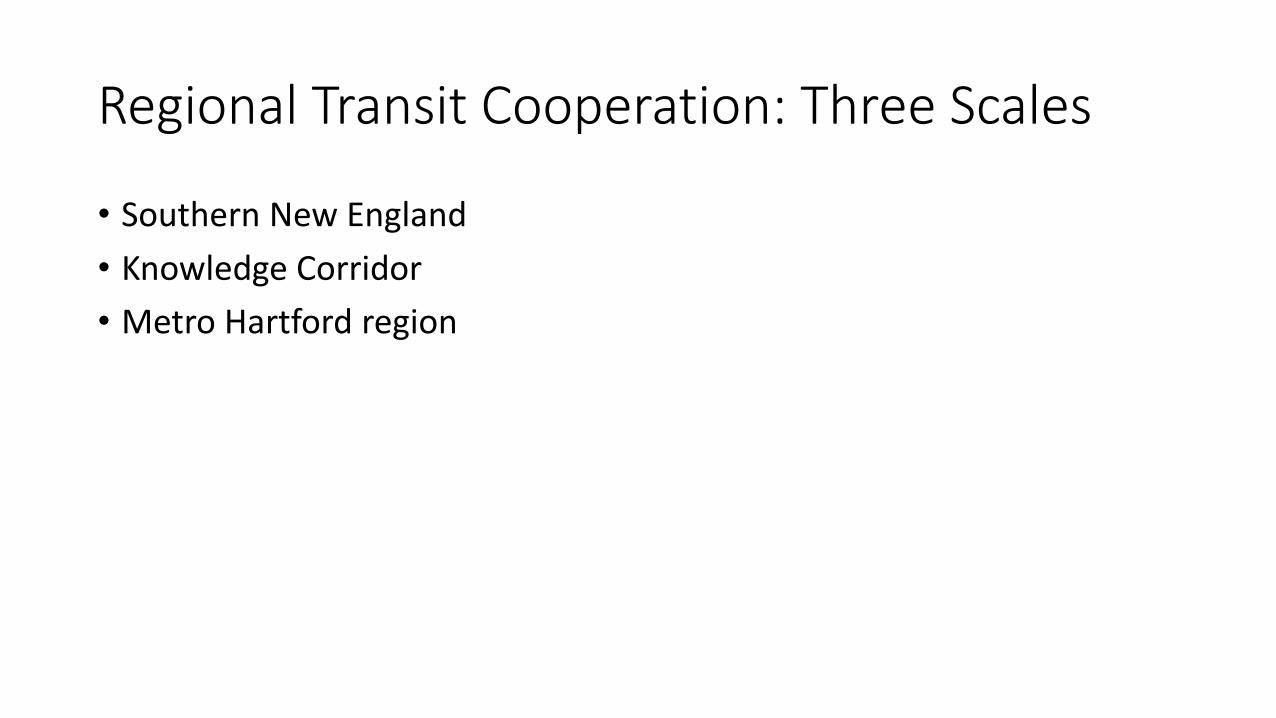
Regional Transit Cooperation: Three Scales
• Southern New England
• Knowledge Corridor
• Metro Hartford region
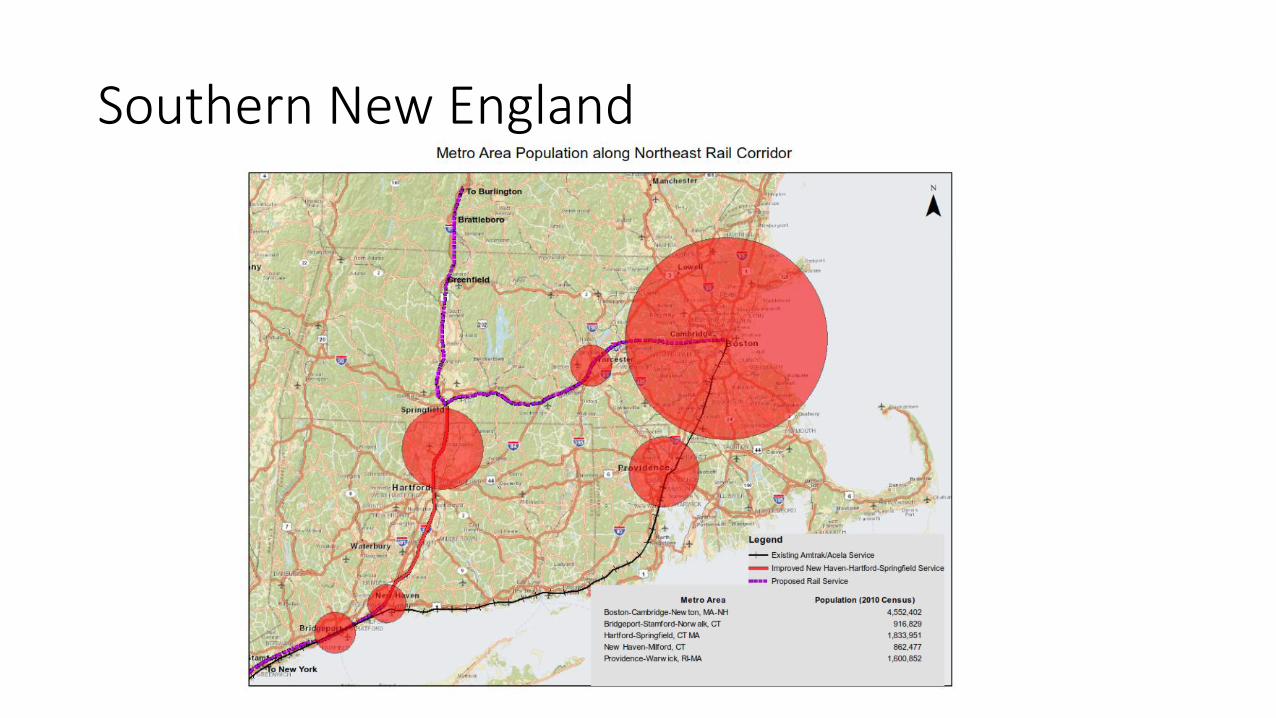
Southern New England

Southern New England What We Have and What We Need
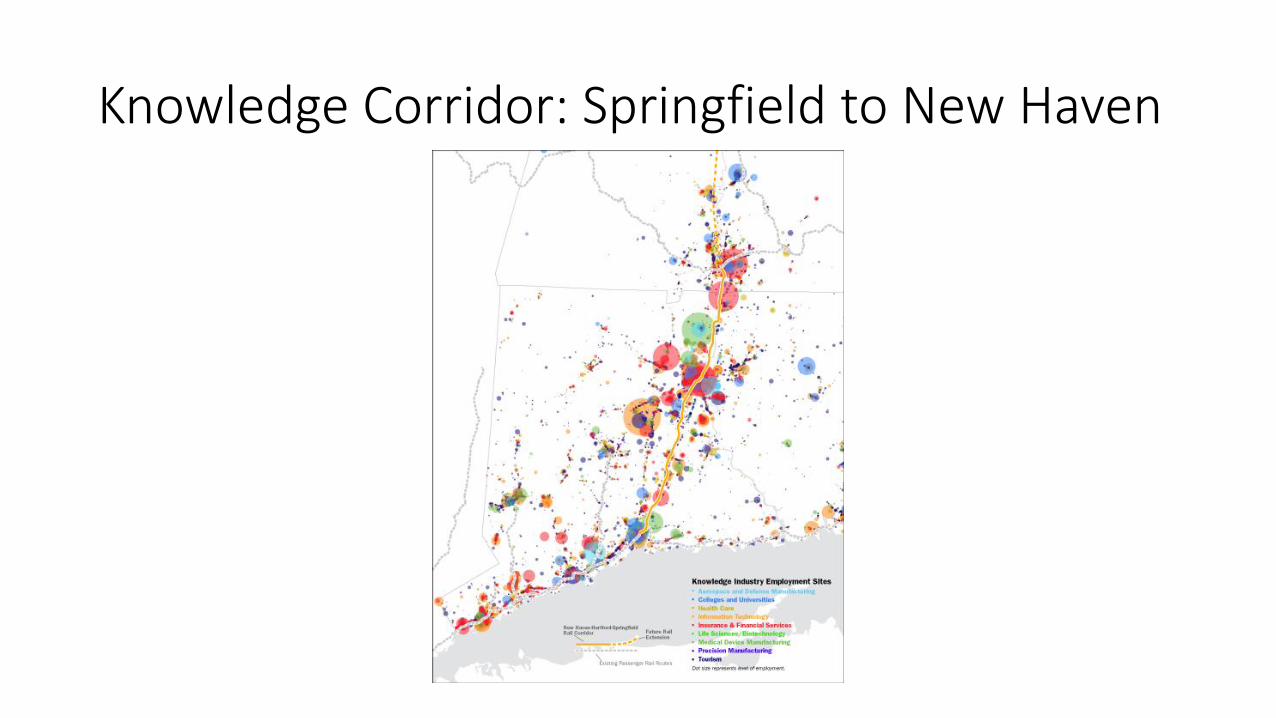
Knowledge Corridor: Springfield to New Haven
Knowledge Corridor: What We Have and What We Need
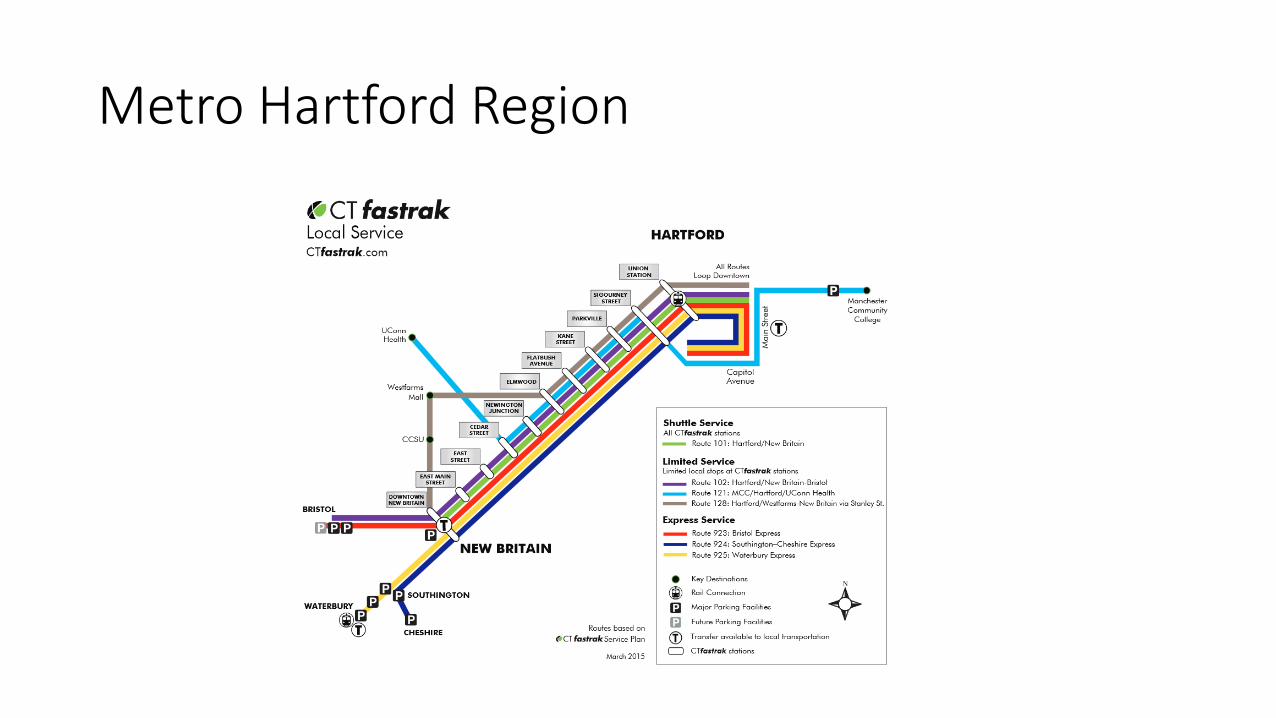
Metro Hartford Region
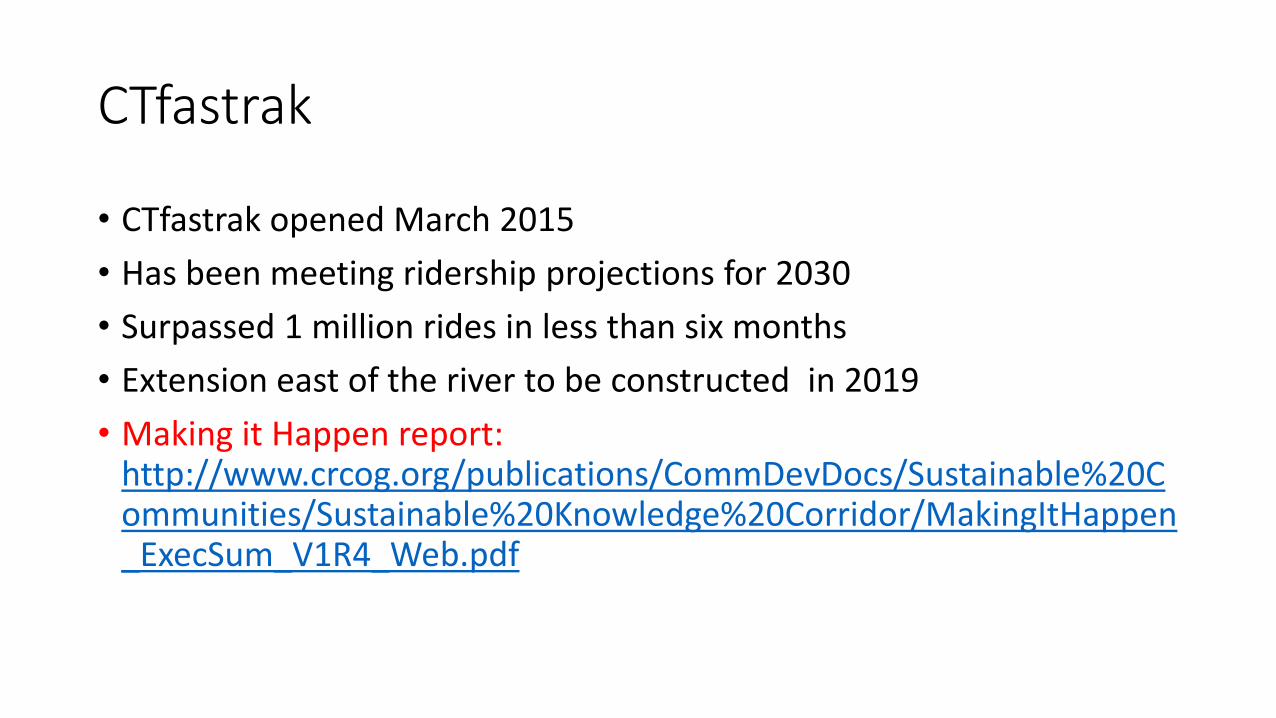
CTfastrak
• CTfastrak opened March 2015
• Has been meeting ridership projections for 2030
• Surpassed 1 million rides in less than six months
• Extension east of the river to be constructed in 2019
• Making it Happen report: http://www.crcog.org/publications/CommDevDocs/Sustainable%20Communities/Sustainable%20Knowledge%20Corridor/MakingItHappen_ExecSum_V1R4_Web.pdf
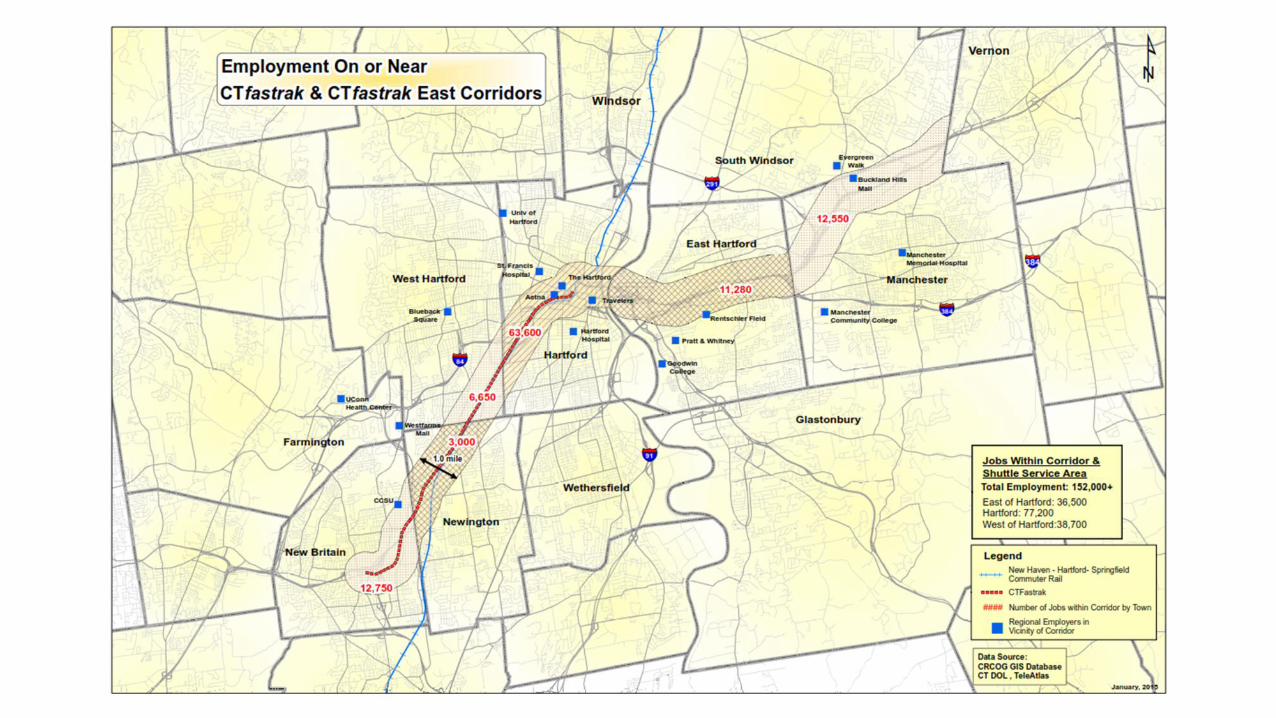
CTfastrak Employment Corridor
• 152,000 jobs in corridor from New Britain to Manchester (not including University of Connecticut) on CTfastrak or circulators • 38,700 jobs west of Hartford
• 77,200 jobs in Hartford
• 36,500 jobs east of Hartford

Metro Hartford Region: What We Have and What We Need
Mobility Network Providers and Low, Medium and High Density Urban Environments • High density: Option instead of transit – moving goods, lack direct
route, convenience, complement to rapid transit for first and last mile
• Medium density: Uber, Lyft and Bridj type services have great potential to drive users to transit with first and last mile or two barrier issues, limited pedestrian access to rapid and regular route transit, transit on demand complement or replacement
• Low density: Mobility network providers as possible replacement for low volume routes, for transit on demand replacement
Mobility Network Providers and Transit
• IT Common interface: Transit app, Google maps, others – options of walking, biking, rapid transit, fixed route transit, mobility network provides (e.g. Uber, Lyft, Bridj) as a single or shared ride
• Number one destination of mobility network provider trips is a rapid transit station
• Next: Trip and fare integration
Wrap Up
• The compelling case for good transit and rapid transit
• Technology to attract and retain non single car users: AVL and transit apps for smartphone users
• Way finding signage and tools
• Harmonization of modes: bus, rapid transit and rail with mobility network providers
• Vision: Build regional mobility networks
Thank You!
Contact information:
Lyle Wray, Executive Director
Capitol Region Council of Governments
www.crcog.org
Thank You! Sarah Ingle, RIPTA 401.784.9500 x 284 [email protected] Mary Beth Mello, FTA 617.494.1784 [email protected] Jonathan Church, WRTA 508.453.3400 [email protected]
Greg Nordin, RIPTA 401.784.9500 x 237 [email protected] Lyle Wray, CRCOG 860.522.2217 x 232 [email protected]