Embed Size (px)
Citation preview
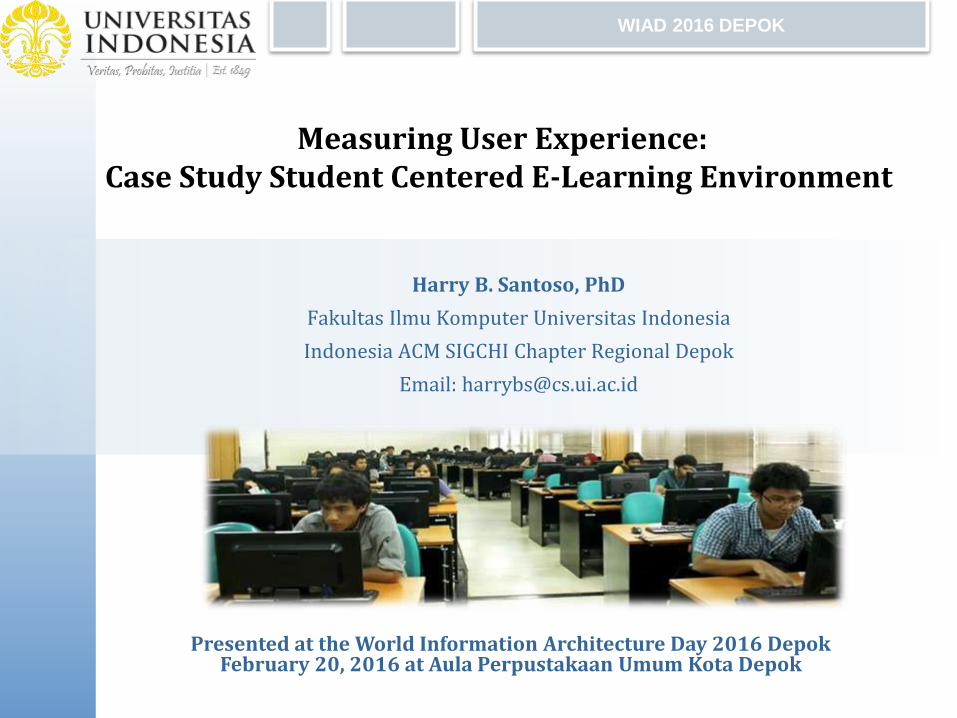
Measuring User Experience: Case Study Student Centered E-Learning Environment
Harry B. Santoso, PhD
Fakultas Ilmu Komputer Universitas Indonesia
Indonesia ACM SIGCHI Chapter Regional Depok
Email: [email protected]
WIAD 2016 DEPOK
Presented at the World Information Architecture Day 2016 DepokFebruary 20, 2016 at Aula Perpustakaan Umum Kota Depok
Agenda
Introduction: Towards a Better Environment
Think Global, Act Local
World Usability Day 2015
World Information Architecture Day 2016
Usability and User Experience
Measuring User Experience: Student Centered e-Learning Environment
Conclusions
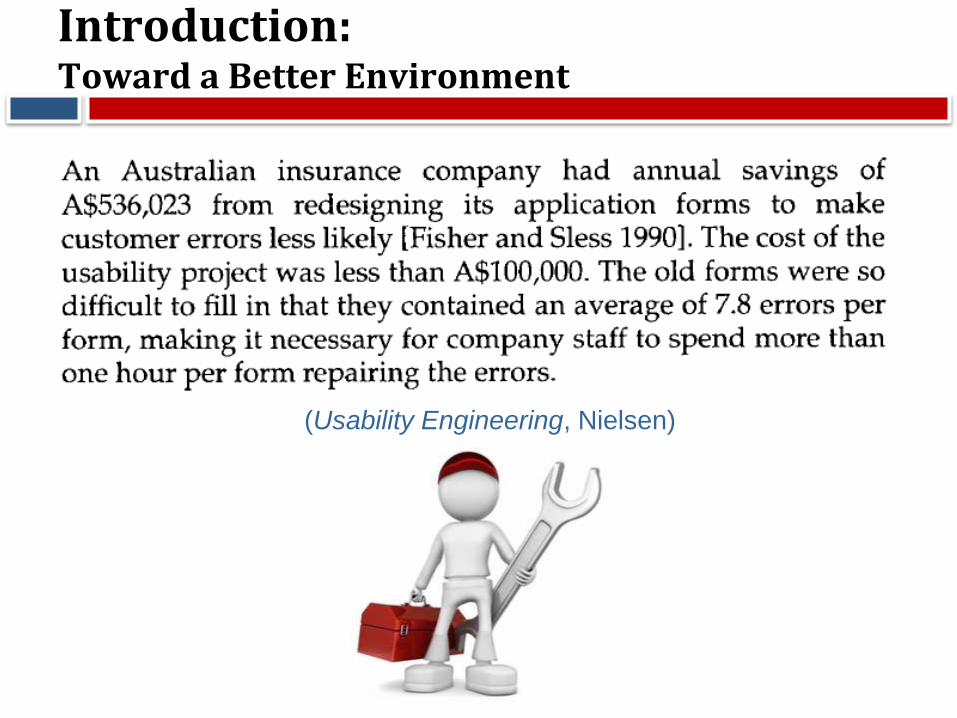
Introduction: Toward a Better Environment
(Usability Engineering, Nielsen)

Think Global, Act Local
World Usability Day 2015 Depok
World Information Architecture Day 2016 Depok
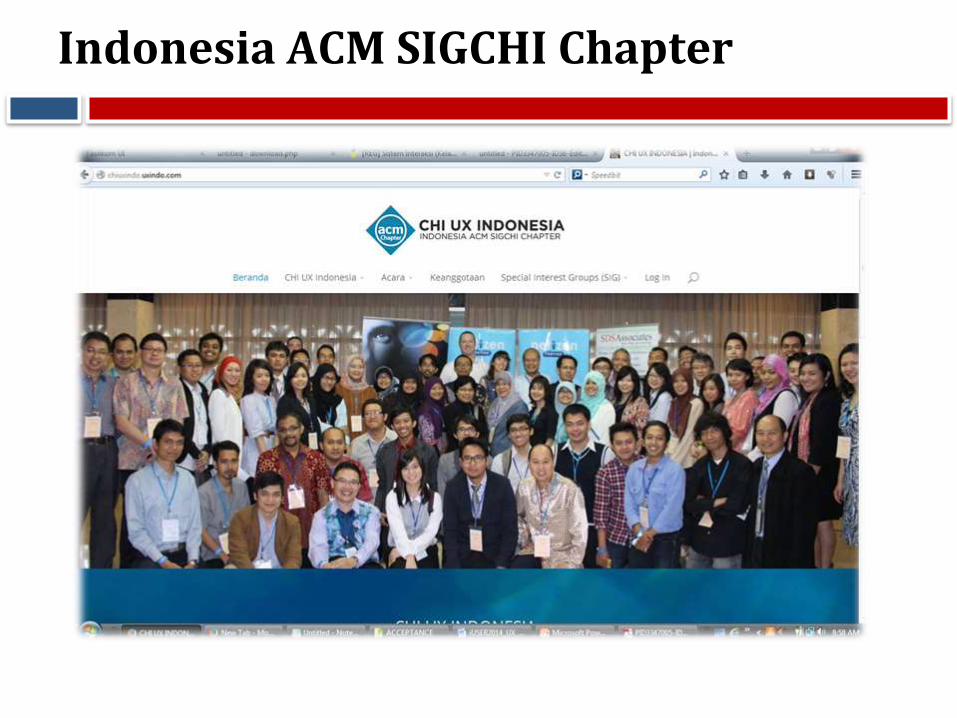
Indonesia ACM SIGCHI Chapter
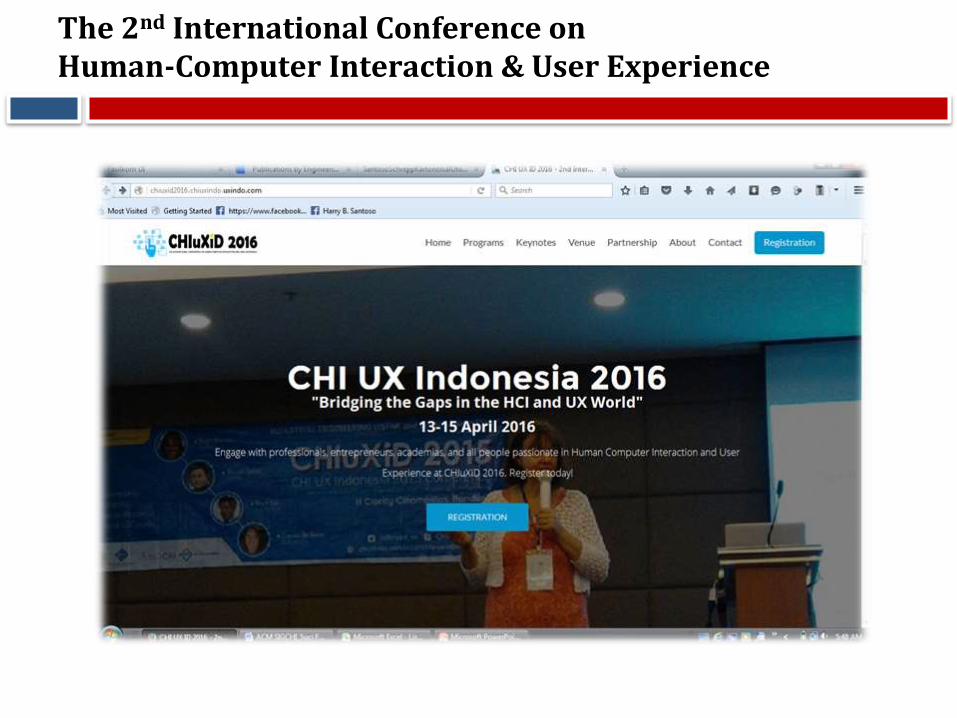
The 2nd International Conference on Human-Computer Interaction & User Experience
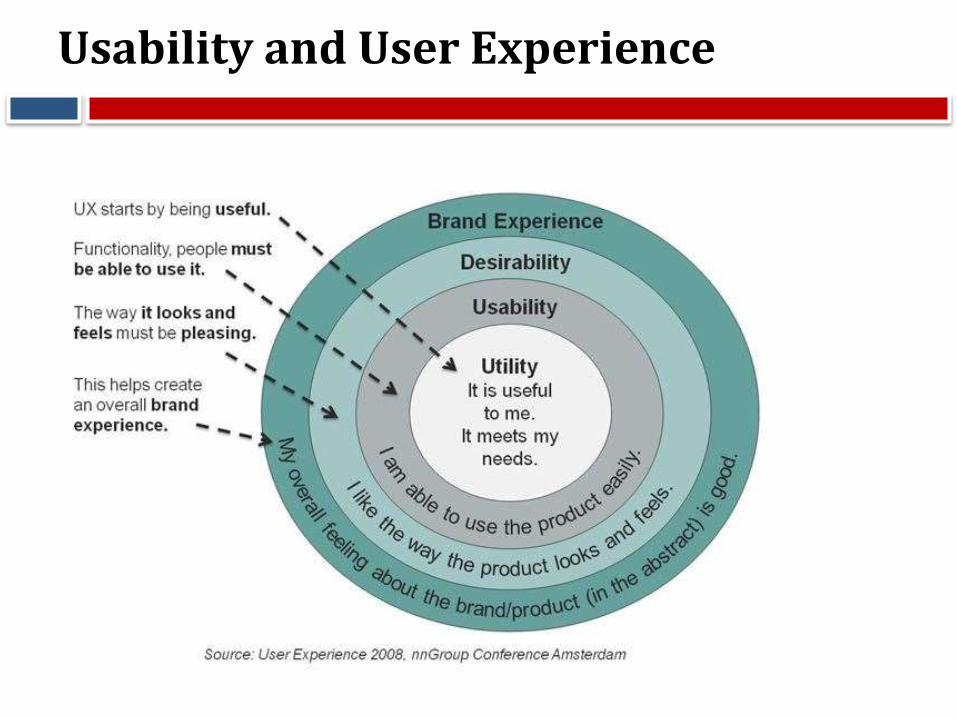
Usability and User Experience
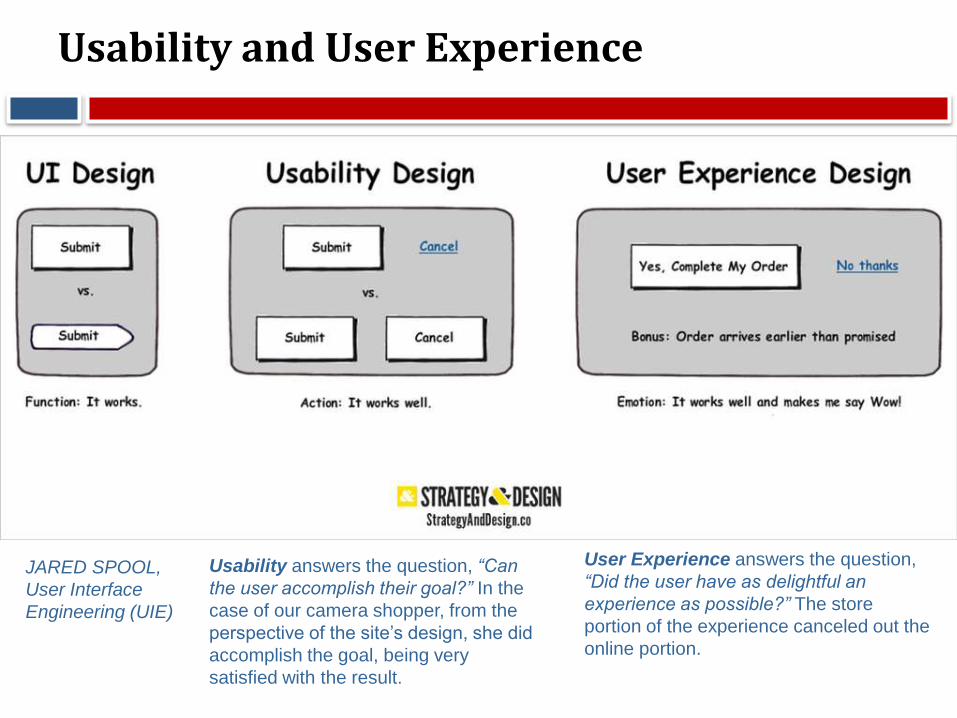
Usability and User Experience
Usability answers the question, “Can
the user accomplish their goal?” In the
case of our camera shopper, from the
perspective of the site’s design, she did
accomplish the goal, being very
satisfied with the result.
User Experience answers the question,
“Did the user have as delightful an
experience as possible?” The store
portion of the experience canceled out the
online portion.
JARED SPOOL,
User Interface
Engineering (UIE)
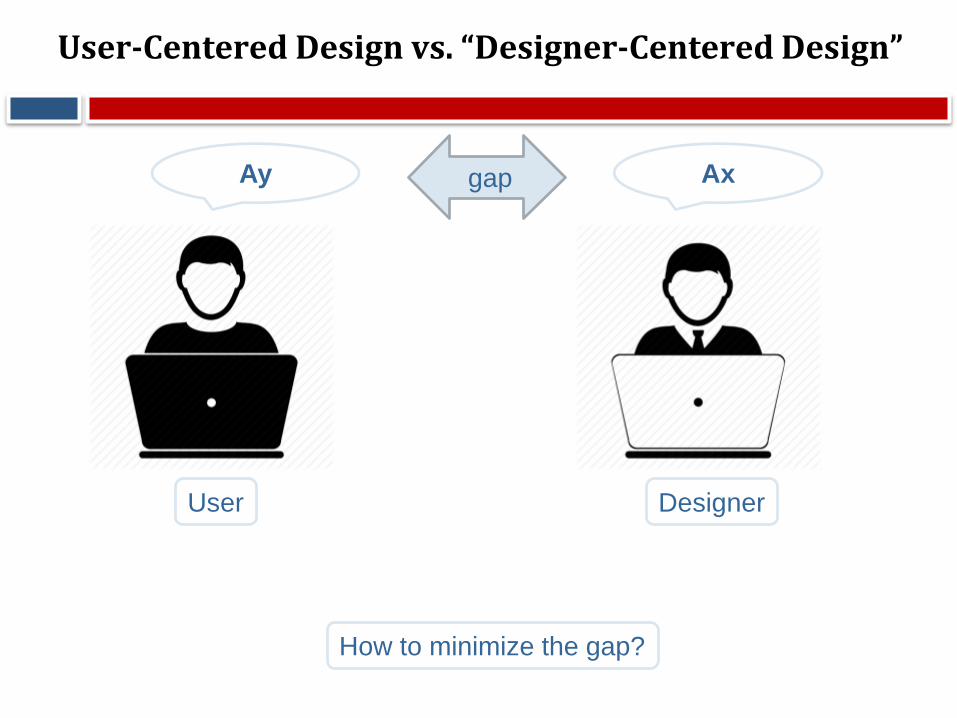
User-Centered Design vs. “Designer-Centered Design”
Ay Ax
User Designer
gap
How to minimize the gap?
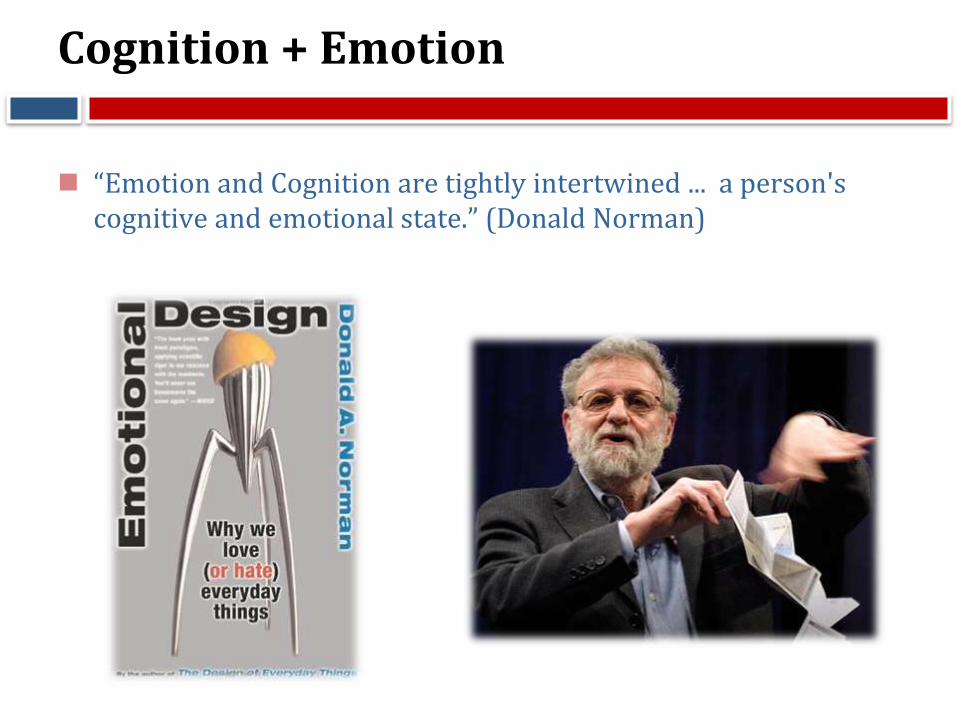
Cognition + Emotion
“Emotion and Cognition are tightly intertwined ... a person's cognitive and emotional state.” (Donald Norman)
Schneiderman and Requirements
1. Functional Requirements
2. Non-Functional Requirements
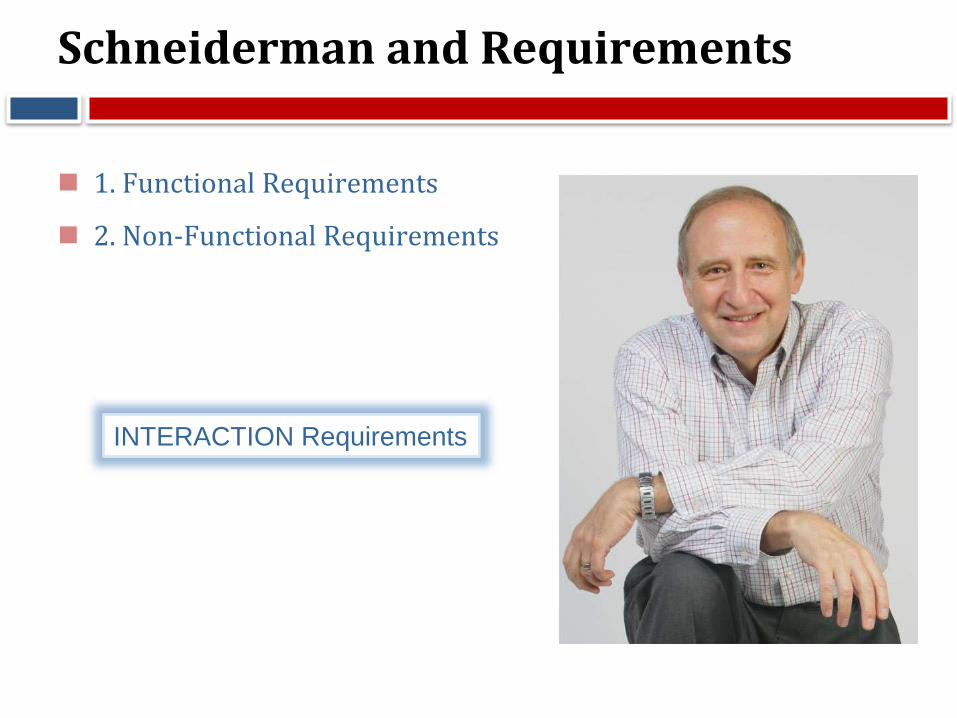
Schneiderman and Requirements
1. Functional Requirements
2. Non-Functional Requirements
INTERACTION Requirements
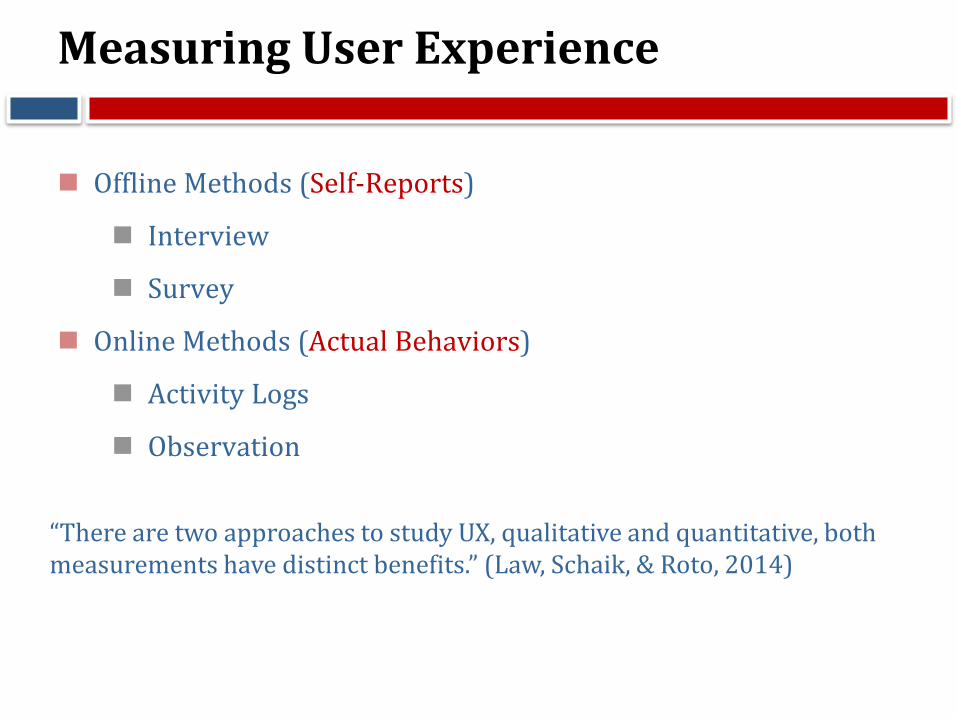
Measuring User Experience
Offline Methods (Self-Reports)
Interview
Survey
Online Methods (Actual Behaviors)
Activity Logs
Observation
“There are two approaches to study UX, qualitative and quantitative, both measurements have distinct benefits.” (Law, Schaik, & Roto, 2014)
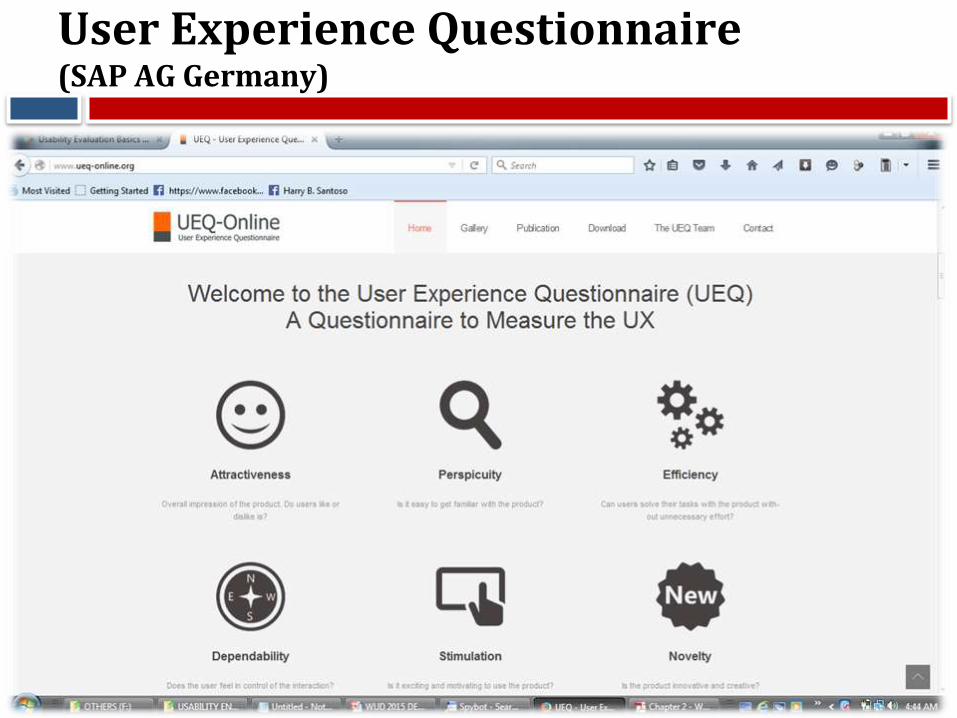
User Experience Questionnaire(SAP AG Germany)
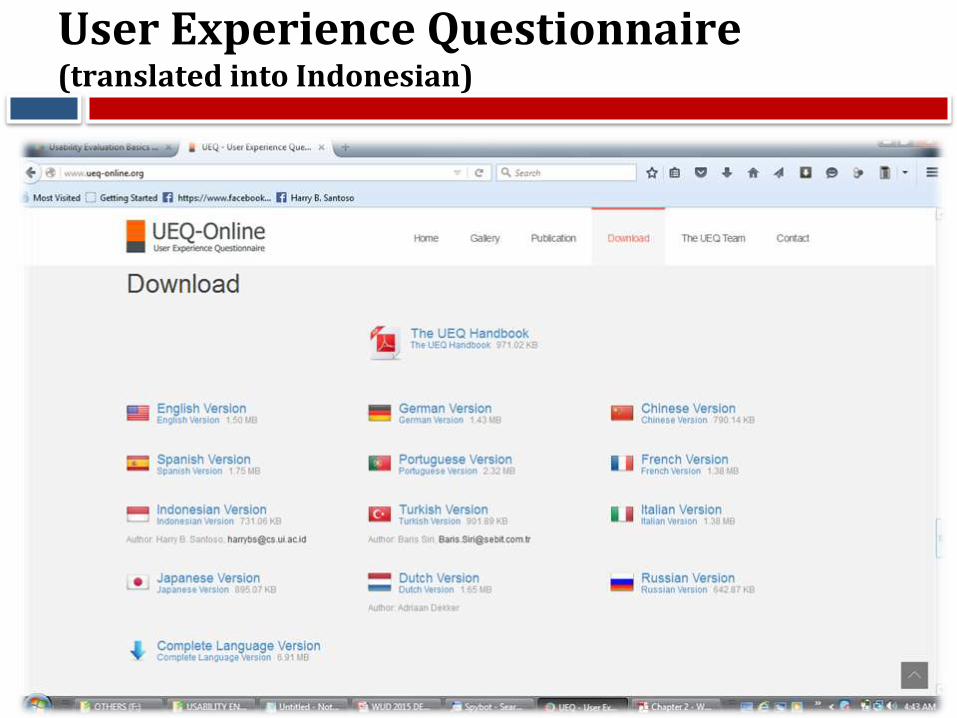
User Experience Questionnaire(translated into Indonesian)
Collaboration
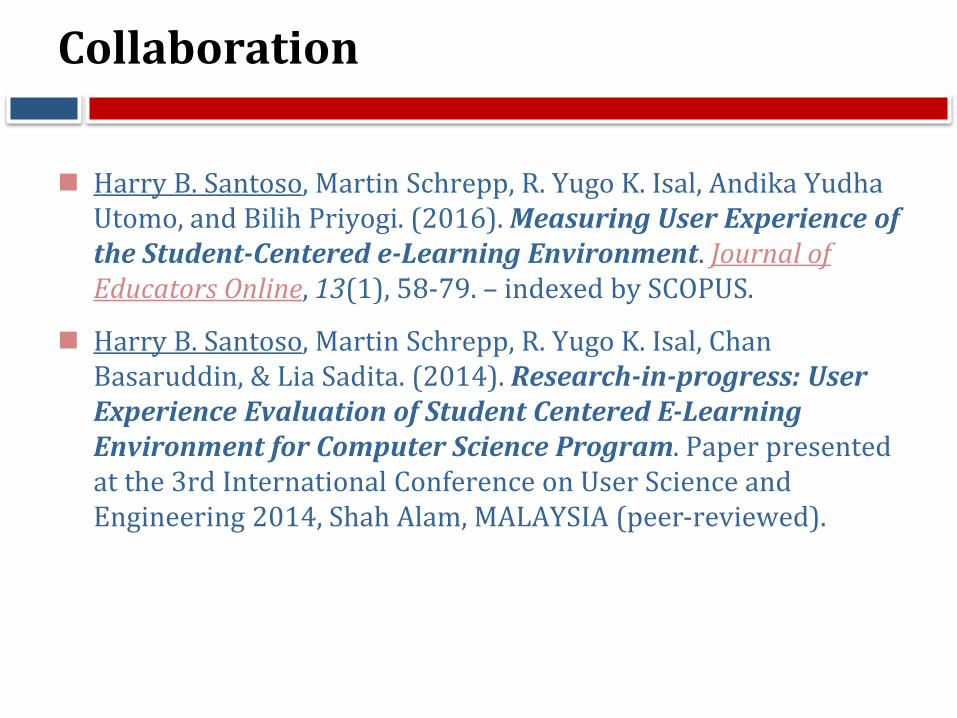
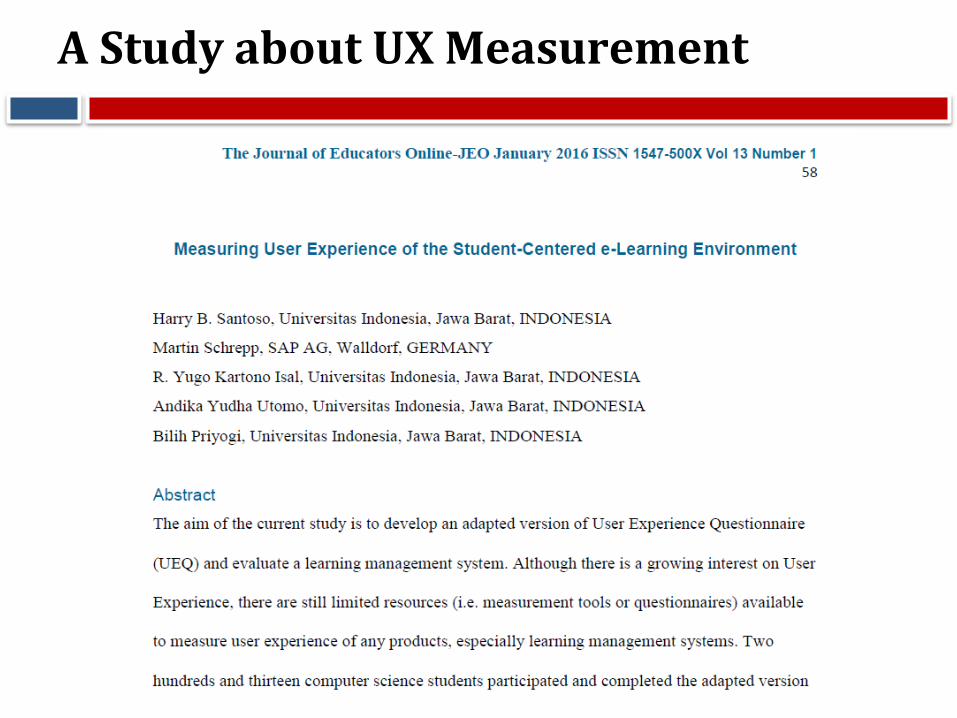
Harry B. Santoso, Martin Schrepp, R. Yugo K. Isal, Andika YudhaUtomo, and Bilih Priyogi. (2016). Measuring User Experience of the Student-Centered e-Learning Environment. Journal of Educators Online, 13(1), 58-79. – indexed by SCOPUS.
Harry B. Santoso, Martin Schrepp, R. Yugo K. Isal, Chan Basaruddin, & Lia Sadita. (2014). Research-in-progress: User Experience Evaluation of Student Centered E-Learning Environment for Computer Science Program. Paper presented at the 3rd International Conference on User Science and Engineering 2014, Shah Alam, MALAYSIA (peer-reviewed).
A Study about UX Measurement
Introduction to the Study
Although user experience measurements have been used to evaluate any products, there is still limited effort to evaluate learning management systems.
Any evaluation effort to measure their usability are usually taken from students’ perspectives.
This issue is critical because the quality of learning management systems usage will affect students’ learning performance while learning online.
The purposes for this current study were:
to understand students’ user experience while using a learning management system in Computer Science education;
to apply multi-methods approach in evaluating students’ user experience; and
to provide recommendations for improving a learning management system.
Participants & Context of the Study
Two hundred thirteen Computer Science students at a university in Indonesia participated and completed the Indonesian UEQ. They were informed about the purposes and methods of the study.
Participants have been using SCELE for years.
Instructors use SCELE to facilitate teaching and learning activities outside the classroom.
They can upload learning materials, post questions on discussion forums, and set up quizzes and assignments.
The current study uses the UEQ and open-ended questions to evaluate user experience of the students while using SCELE.
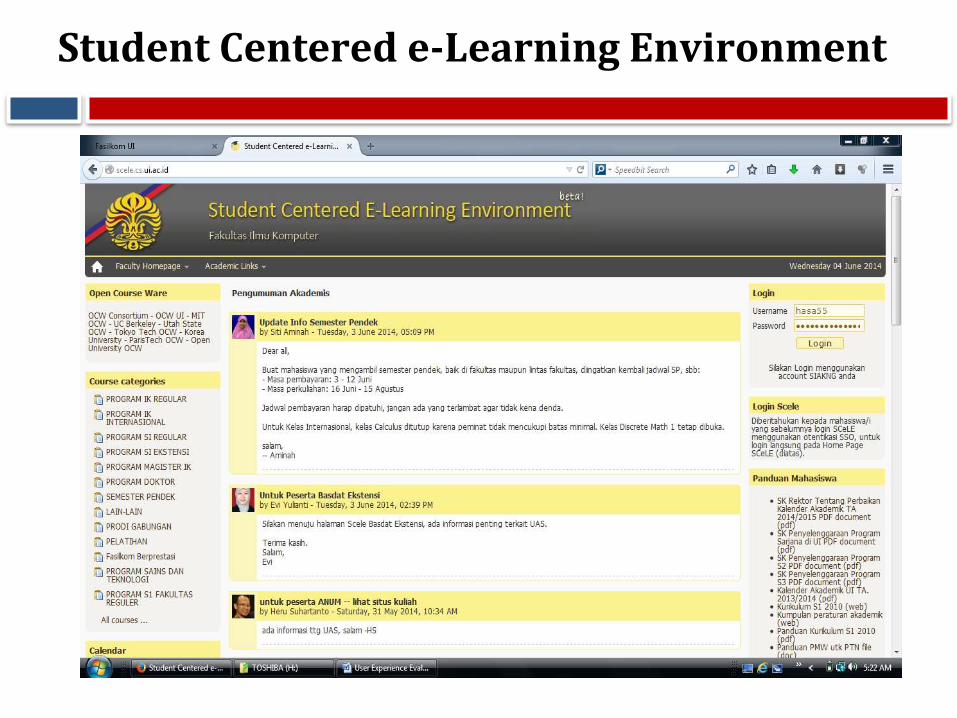
Student Centered e-Learning Environment
Instrumentation
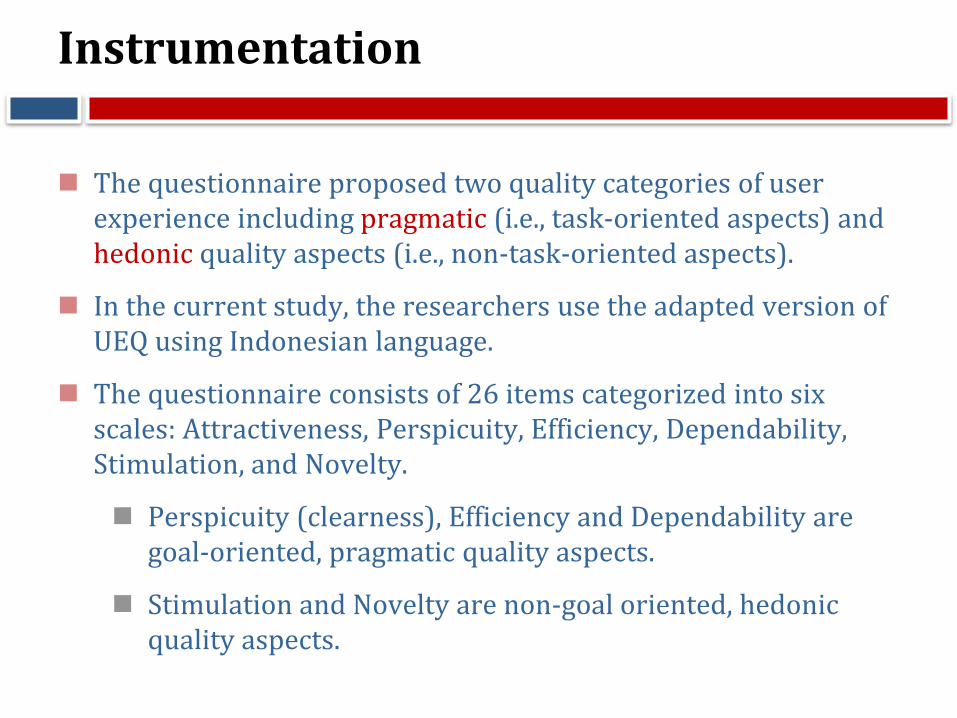
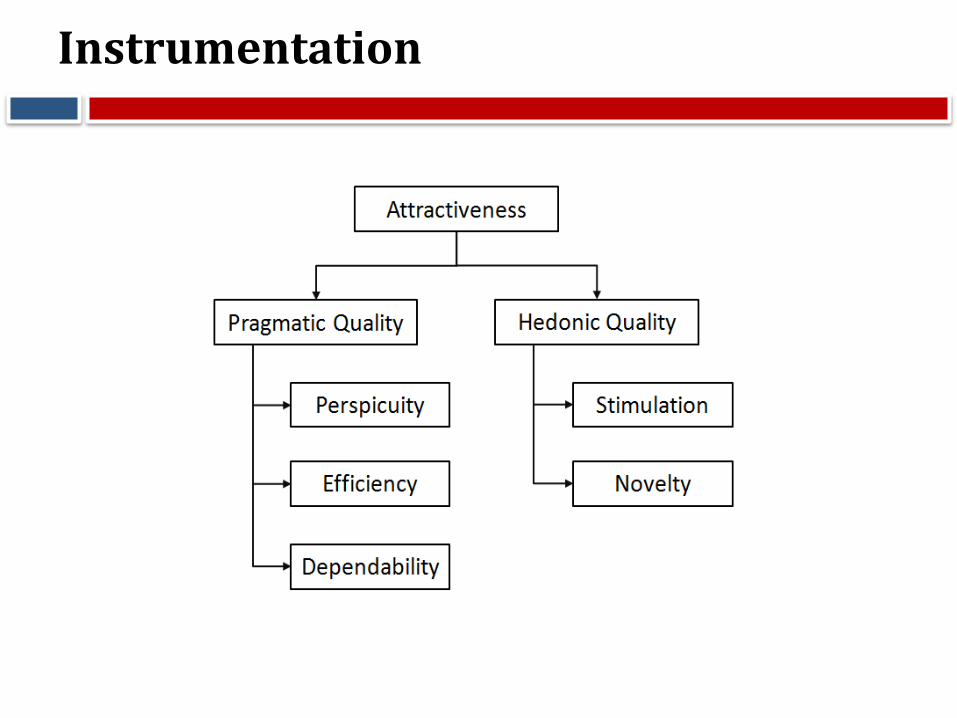
The questionnaire proposed two quality categories of user experience including pragmatic (i.e., task-oriented aspects) and hedonic quality aspects (i.e., non-task-oriented aspects).
In the current study, the researchers use the adapted version of UEQ using Indonesian language.
The questionnaire consists of 26 items categorized into six scales: Attractiveness, Perspicuity, Efficiency, Dependability, Stimulation, and Novelty.
Perspicuity (clearness), Efficiency and Dependability are goal-oriented, pragmatic quality aspects.
Stimulation and Novelty are non-goal oriented, hedonic quality aspects.
Instrumentation
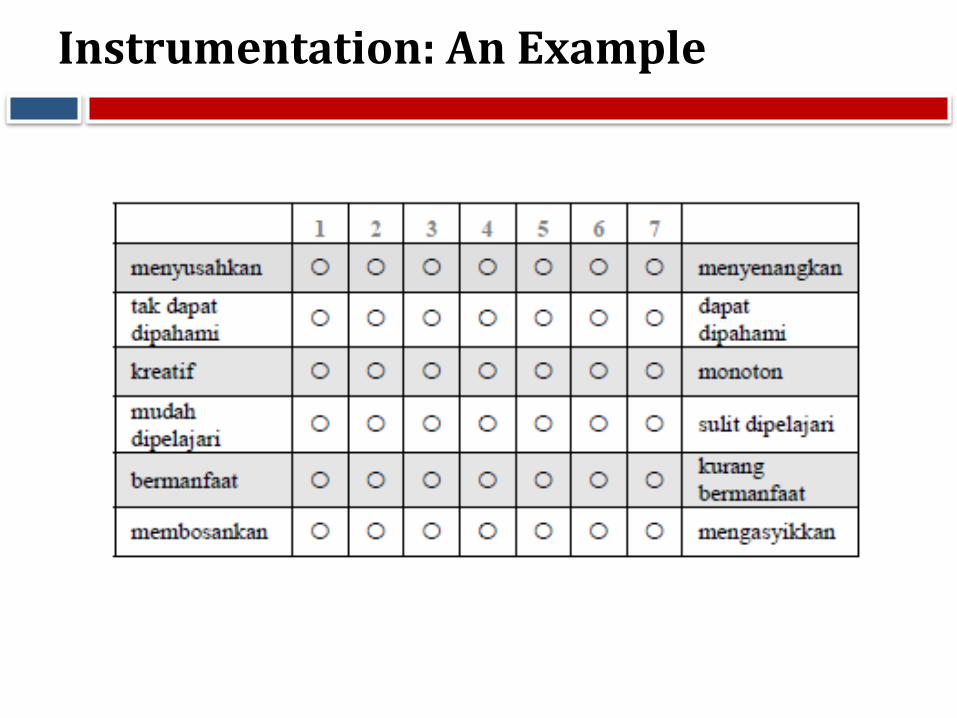
Instrumentation: An Example
Data Collection Procedures and Analysis
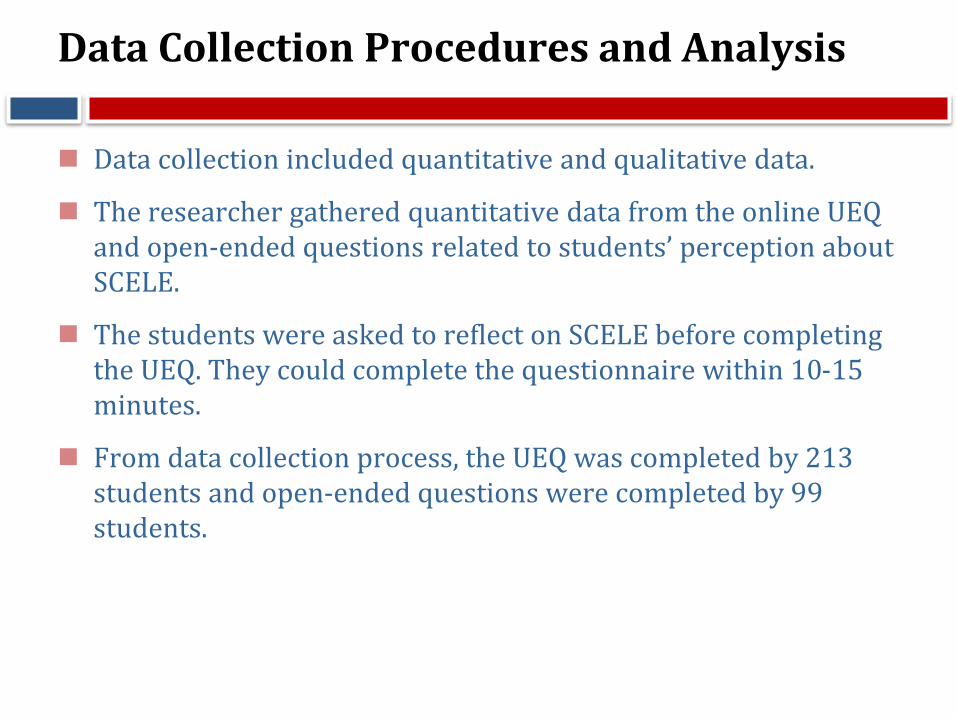
Data collection included quantitative and qualitative data.
The researcher gathered quantitative data from the online UEQ and open-ended questions related to students’ perception about SCELE.
The students were asked to reflect on SCELE before completing the UEQ. They could complete the questionnaire within 10-15 minutes.
From data collection process, the UEQ was completed by 213 students and open-ended questions were completed by 99 students.
Data Collection Procedures and Analysis
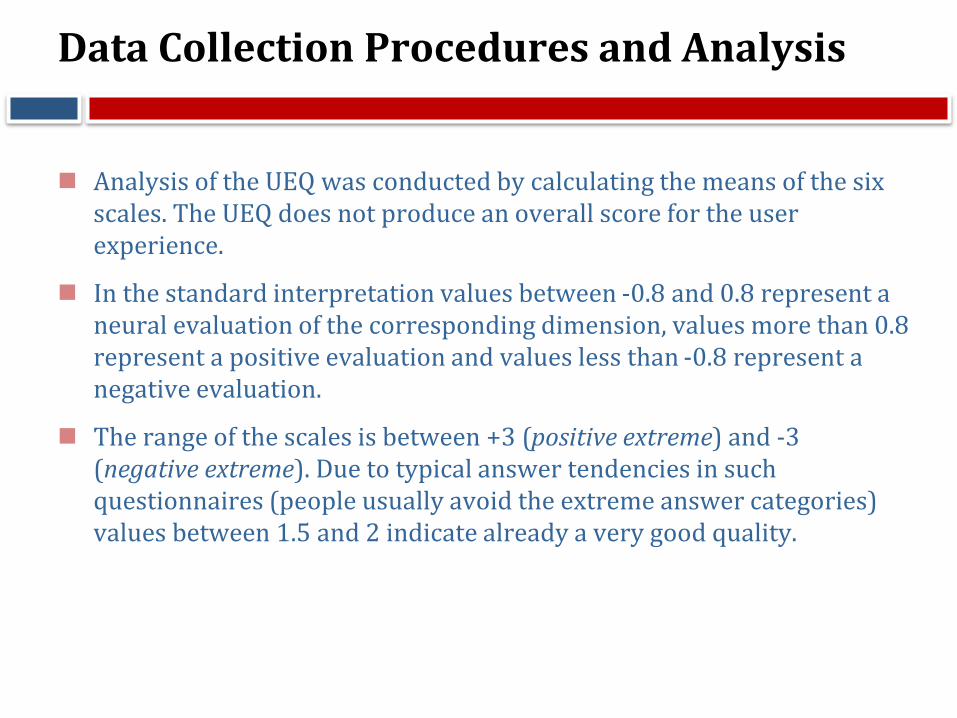
Analysis of the UEQ was conducted by calculating the means of the six scales. The UEQ does not produce an overall score for the user experience.
In the standard interpretation values between -0.8 and 0.8 represent a neural evaluation of the corresponding dimension, values more than 0.8 represent a positive evaluation and values less than -0.8 represent a negative evaluation.
The range of the scales is between +3 (positive extreme) and -3 (negative extreme). Due to typical answer tendencies in such questionnaires (people usually avoid the extreme answer categories) values between 1.5 and 2 indicate already a very good quality.
Findings
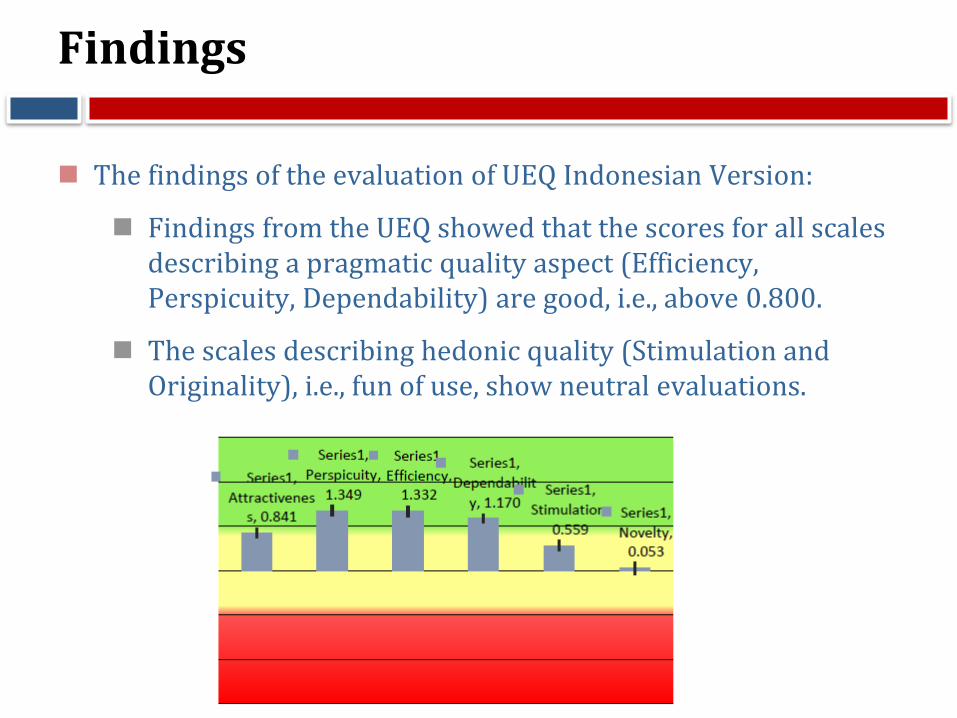
The findings of the evaluation of UEQ Indonesian Version:
Findings from the UEQ showed that the scores for all scales describing a pragmatic quality aspect (Efficiency, Perspicuity, Dependability) are good, i.e., above 0.800.
The scales describing hedonic quality (Stimulation and Originality), i.e., fun of use, show neutral evaluations.
Findings
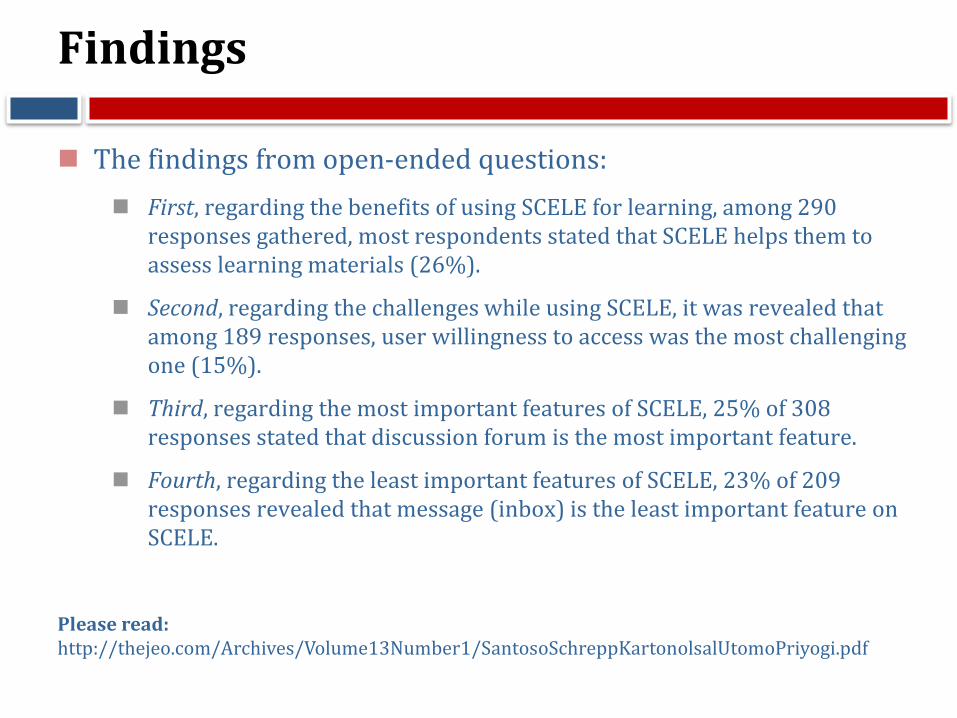
The findings from open-ended questions:
First, regarding the benefits of using SCELE for learning, among 290 responses gathered, most respondents stated that SCELE helps them to assess learning materials (26%).
Second, regarding the challenges while using SCELE, it was revealed that among 189 responses, user willingness to access was the most challenging one (15%).
Third, regarding the most important features of SCELE, 25% of 308 responses stated that discussion forum is the most important feature.
Fourth, regarding the least important features of SCELE, 23% of 209 responses revealed that message (inbox) is the least important feature on SCELE.
Please read:http://thejeo.com/Archives/Volume13Number1/SantosoSchreppKartonolsalUtomoPriyogi.pdf
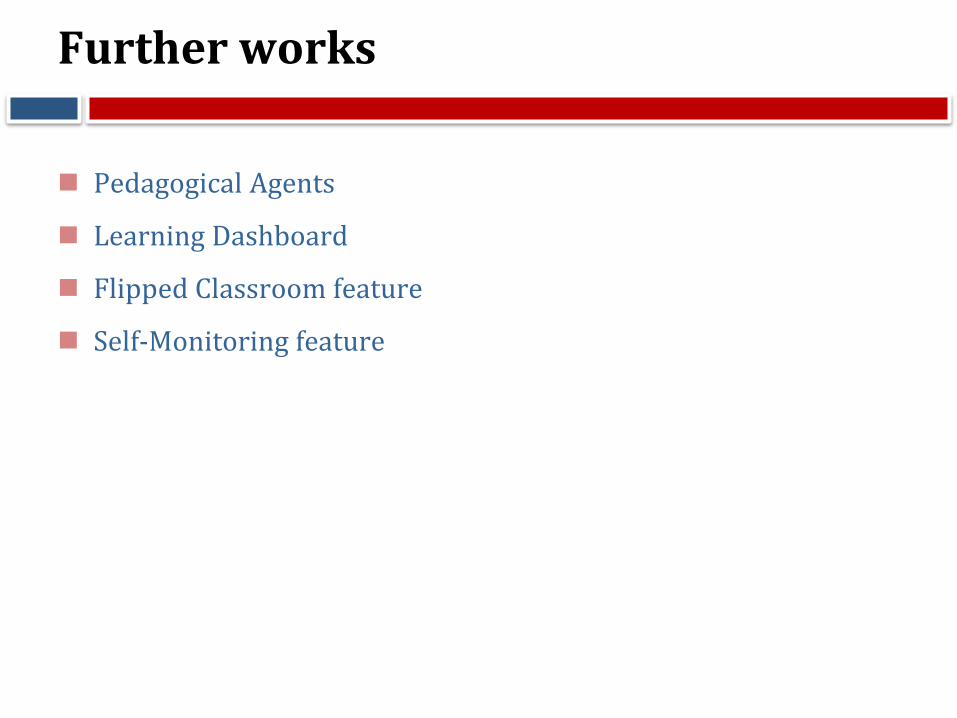
Further works
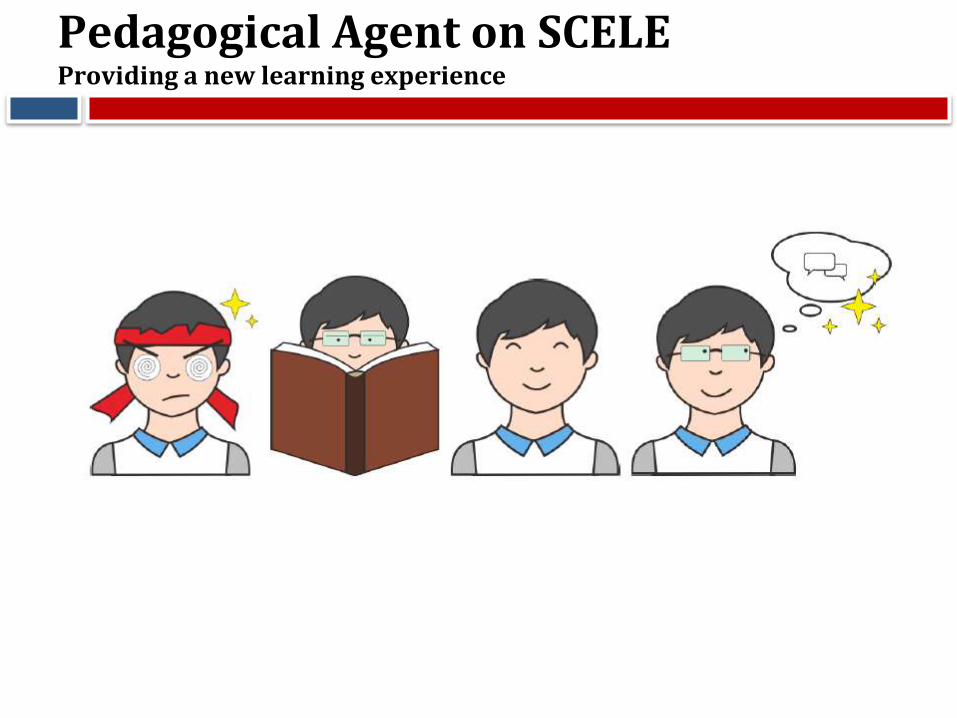
Pedagogical Agents
Learning Dashboard
Flipped Classroom feature
Self-Monitoring feature
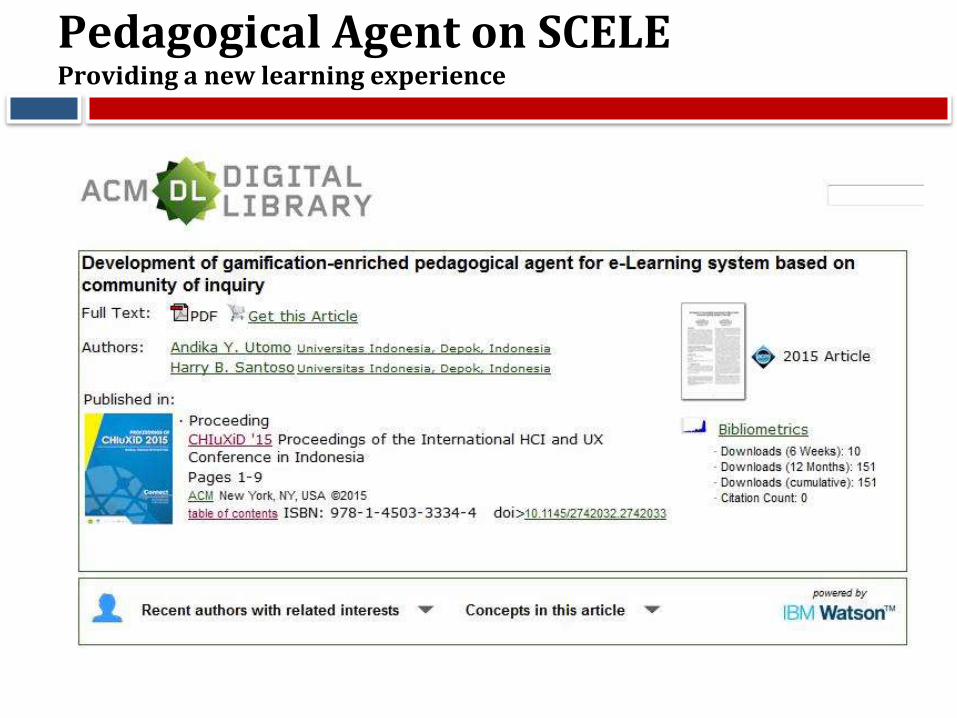
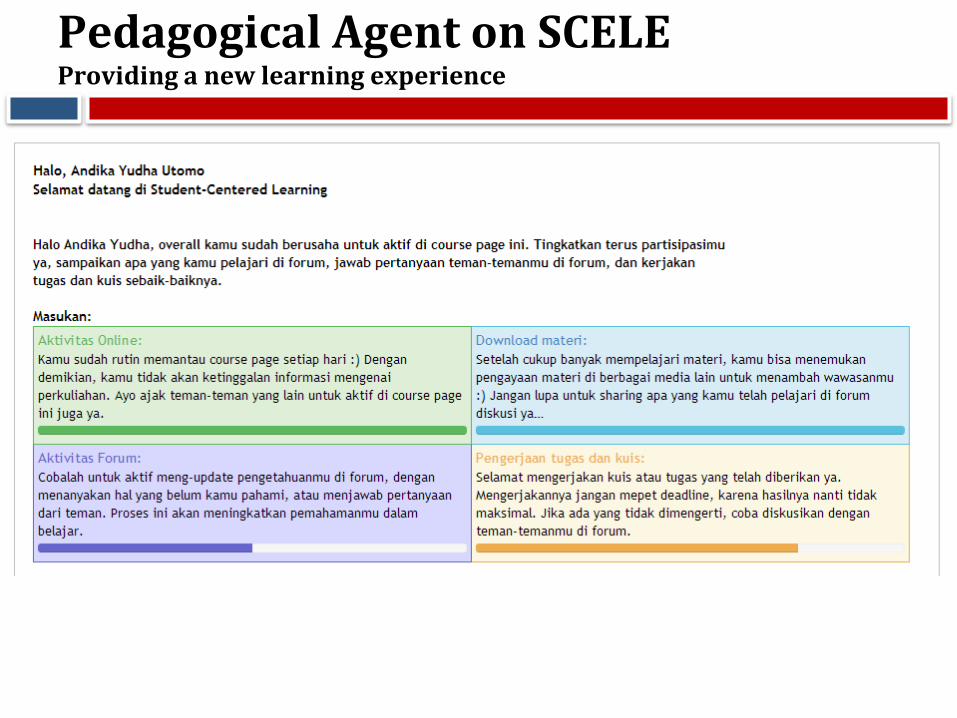
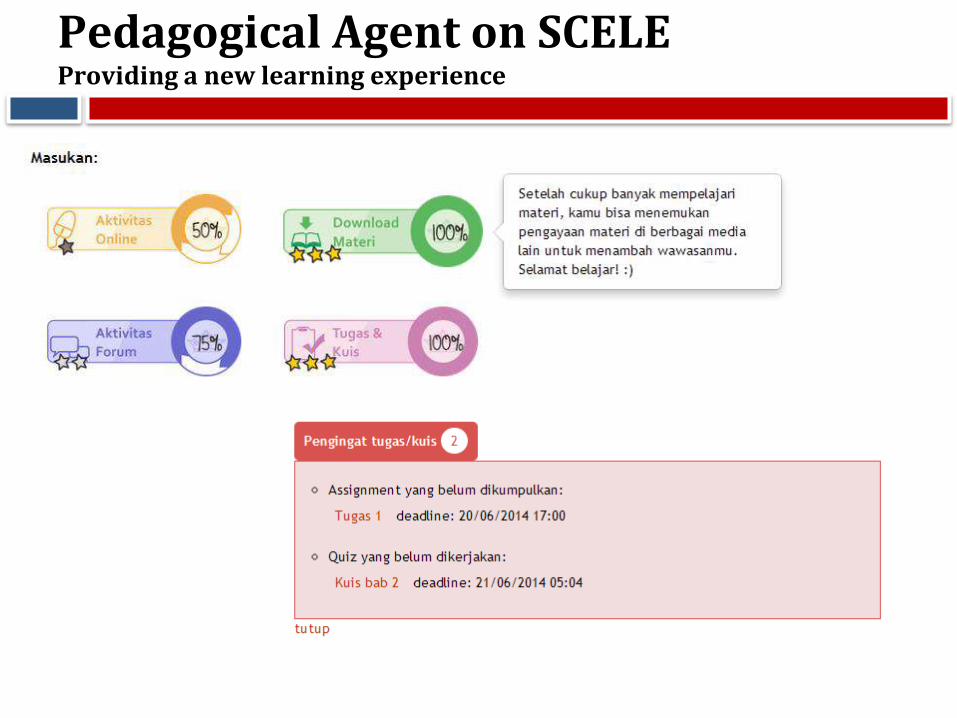
Pedagogical Agent on SCELEProviding a new learning experience
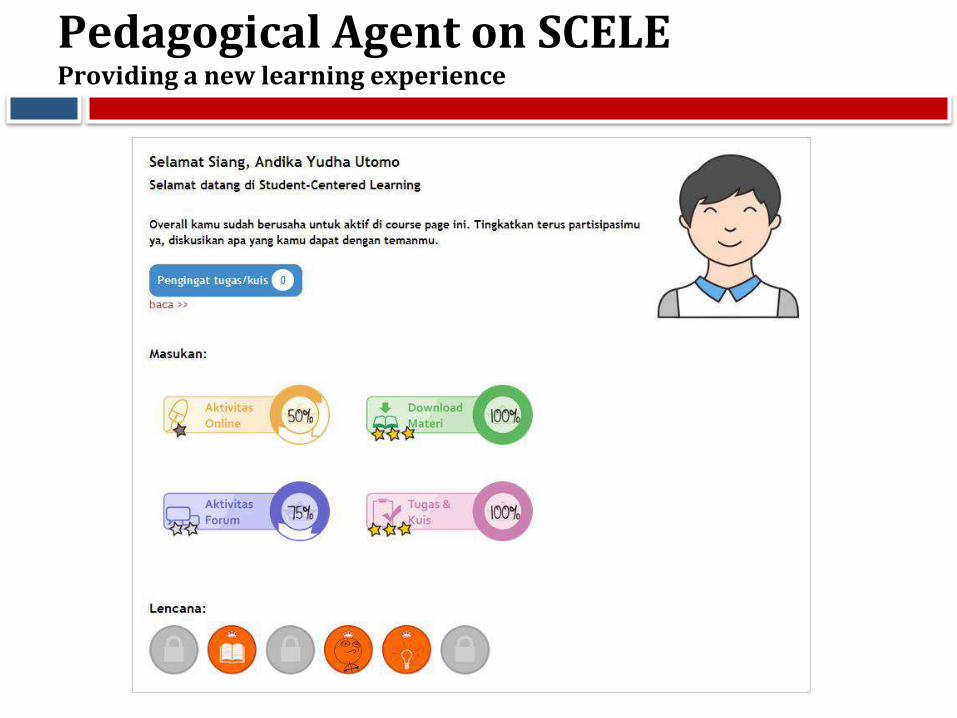
Pedagogical Agent on SCELEProviding a new learning experience
Pedagogical Agent on SCELEProviding a new learning experience
Pedagogical Agent on SCELEProviding a new learning experience
Pedagogical Agent on SCELEProviding a new learning experience
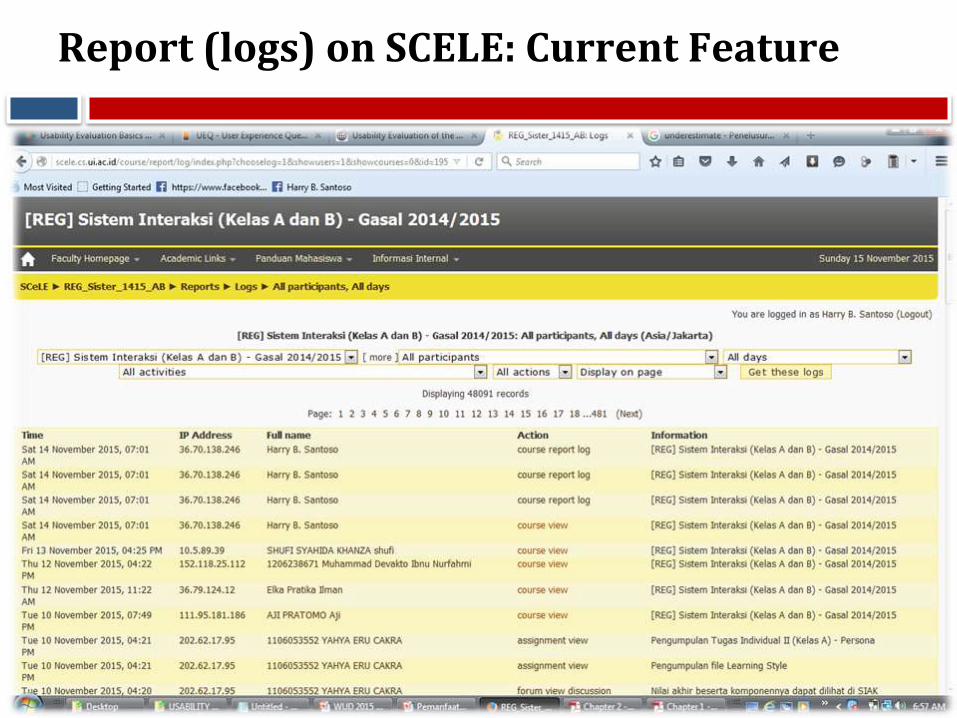
Report (logs) on SCELE: Current Feature
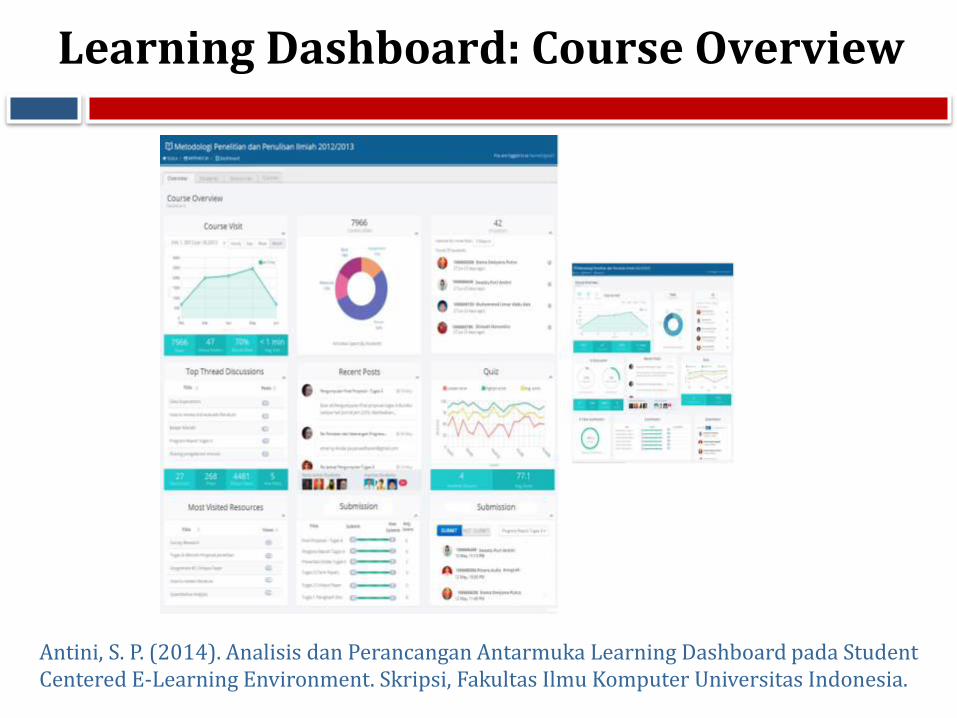
Learning Dashboard: Course Overview
Antini, S. P. (2014). Analisis dan Perancangan Antarmuka Learning Dashboard pada Student Centered E-Learning Environment. Skripsi, Fakultas Ilmu Komputer Universitas Indonesia.
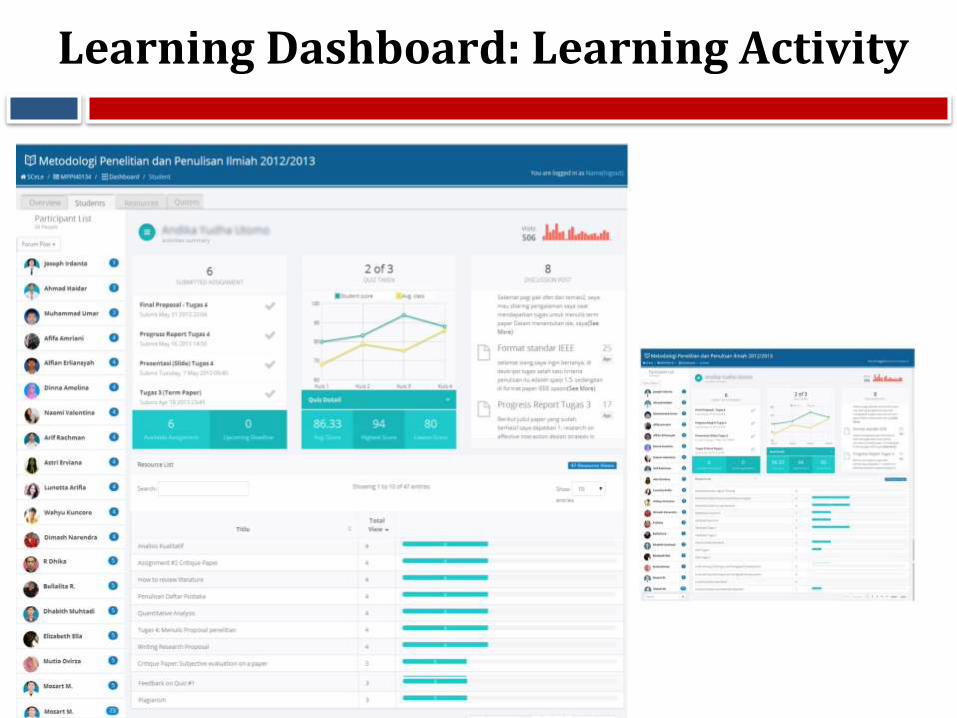
Learning Dashboard: Learning Activity
Conclusions
The UEQ can be used to measure user experience of interactive products, including web-based applications. It captures the pragmatic as well as the hedonic quality aspects of the interactive products.
Although the translated version must also be proven in further studies with other types of products to get a more complete picture, the use of this version for practical product evaluations appears viable.
The results of validation revealed that, while the scores for all scales describing a pragmatic quality aspect were good, the scales describing hedonic quality showed neutral evaluations.
The findings were also supported by students’ answers to open-ended questions.
Moreover, the measurement results provide additional insights into future development of the SCELE learning management system.

Recommended Books (“Homework”)
Thank you
Thank you for your attention!~ Questions and Answers ~