Embed Size (px)
Citation preview
4Q07 and 2007Results Presentation
March 2008
2
4Q07 and 2007 Results
Results from the 2006 and 2007, unless otherwise indicated, are presented on a pro forma basis,
combining Tegma, Bonifácio Logística e Transportes Ltda, Coimex Logística Integrada S.A. (C.L.I.) and
P.D.I Comércio Indústria e Serviços Ltda (P.D.I) as if the acquisitions of Boni, C.L.I, and P.D.I had taken
place on January 1, 2006.
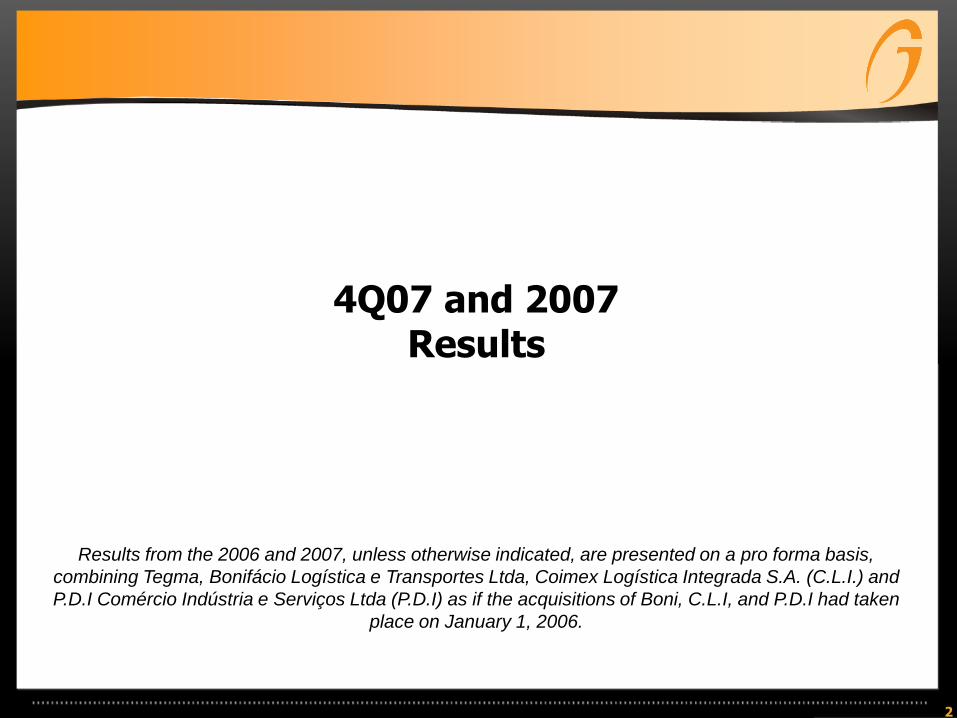
Agenda
• Recent Events
• Financial Highlights
• Financial Results
• Guidance 2008
3
Recent Events
• SHARE BUY-BACK PROGRAM:
On January 24, 2008, the Board of Directors approved the Company’s Share Buy-back Program involving the acquisition of up to 2,547,445. To date, the Company has reacquired 538,300 common shares for R$ 8.5 million.
• Fire CLI:
Fire occurred in CLI’s general cargo warehouses in March 6, 2008. Theoperations involved in these warehouses represent 2% of the netrevenue.The products, warehouses and other stored in thesewarehouses were insured by top-of-the-line insurance companies
4
5
Financial Highlights – 4Q07
• Net Revenue in the 4Q07 totaled R$ 224.5 million, 39.4% over the
4Q06.
• Adjusted EBITDAR had a 29.6% upturn in the 4Q07 and moved
from R$ 28.5 million in the 4Q06 to R$ 36.9 million in the 4Q07.
• Net Profit, excluding the non-recurring expenses, totaled R$ 19.0
million in the 4Q07, representing an upturn of 63.0% year-on-year.

443.4
614.9
73.0102.1
NET REVENUE Adjusted EBITDAR
2006 2007
38.7%
39.9%
130.2
188.0
22.432.0
NET REVENUE Adjusted EBITDAR
4Q06 4Q07
44.4%
42.9%
6
Automotive Division
Net Revenue grew by 44.4% year-on-year due to:
• The volume of transported automobiles increased by 36.8%;
• 2.4% increase in the average km;• Increase of R$ 15.0 million in Gross Revenue with autopart
transportation operations.
2007
4Q07
Adjusted EBITDAR grew by 42.9% year-on-year. In relation to the Net Revenue, Adjusted EBITDAR margin was of 17.0%,representing a slight decrease of 0.2 p.p. when compared to 4Q06.
Net Revenue grew by 38.7% when compared to 2006 due to:
• The volume of transported automobiles increased by 24.9%, totaling 910,841 automobiles in 2007;
• 8.2% increase in the average km;• Increase of R$ 44.9 million in Gross Revenue with autopart
transportation operations.
Adjusted EBITDAR totaled R$ 102.1 million in 2007. In relation to the Net Revenue, Adjusted EBITDAR margin was of 16.6%,representing a slight decrease of 0.1 p.p. when compared to 2006.
111.2
130.0
16,5 18,4
NET REVENUE Adjusted EBITDAR
4Q06 4Q07
16.9%
11.1%
30.8
36.5
6.1 4.9
NET REVENUE Adjusted EBITDAR
4Q06 4Q07
18.3%
-19.2%
7
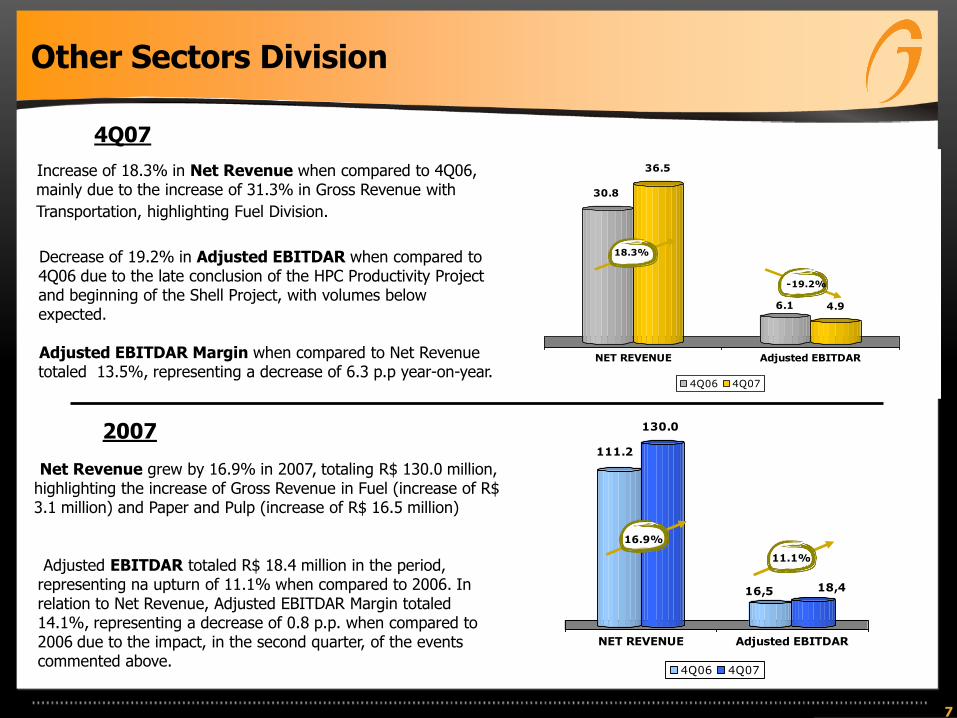
Other Sectors Division
4Q07
2007
Increase of 18.3% in Net Revenue when compared to 4Q06, mainly due to the increase of 31.3% in Gross Revenue with
Transportation, highlighting Fuel Division.
Decrease of 19.2% in Adjusted EBITDAR when compared to 4Q06 due to the late conclusion of the HPC Productivity Project and beginning of the Shell Project, with volumes belowexpected.
Adjusted EBITDAR Margin when compared to Net Revenuetotaled 13.5%, representing a decrease of 6.3 p.p year-on-year.
Net Revenue grew by 16.9% in 2007, totaling R$ 130.0 million, highlighting the increase of Gross Revenue in Fuel (increase of R$ 3.1 million) and Paper and Pulp (increase of R$ 16.5 million)
Adjusted EBITDAR totaled R$ 18.4 million in the period, representing na upturn of 11.1% when compared to 2006. In relation to Net Revenue, Adjusted EBITDAR Margin totaled 14.1%, representing a decrease of 0.8 p.p. when compared to 2006 due to the impact, in the second quarter, of the events commented above.
8
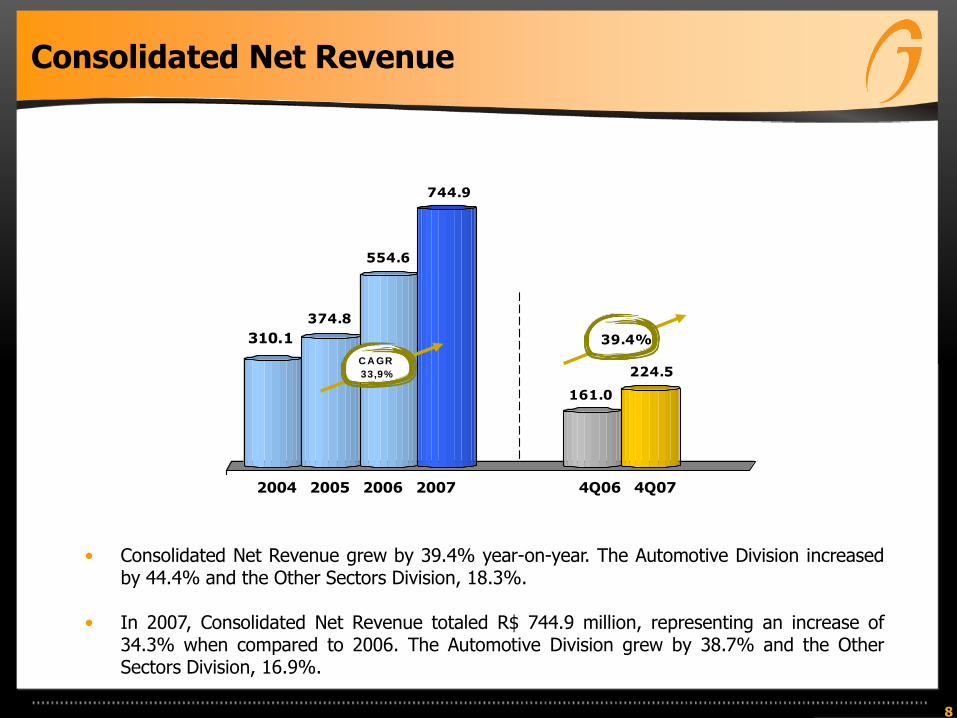
Consolidated Net Revenue
• Consolidated Net Revenue grew by 39.4% year-on-year. The Automotive Division increasedby 44.4% and the Other Sectors Division, 18.3%.
• In 2007, Consolidated Net Revenue totaled R$ 744.9 million, representing an increase of34.3% when compared to 2006. The Automotive Division grew by 38.7% and the OtherSectors Division, 16.9%.
310.1
374.8
554.6
744.9
161.0
224.5
2004 2005 2006 2007 4Q06 4Q07
C A GR
33,9%
39.4%

9
Consolidated Adjusted EBITDAR
• Consolidated Adjusted EBITDAR in the 4Q07 totaled R$ 36.9 million, representing an upturnof 29.6% year-on-year.
• In 2007, Adjusted EBITDAR totaled R$ 120.5 million, an upturn of 34.6% when comparedto 2006.
53.159.2
89.6
120.5
28.536.9
2004 2005 2006 2007 4Q06 4Q07
29.6%
C A GR
31,4%
10
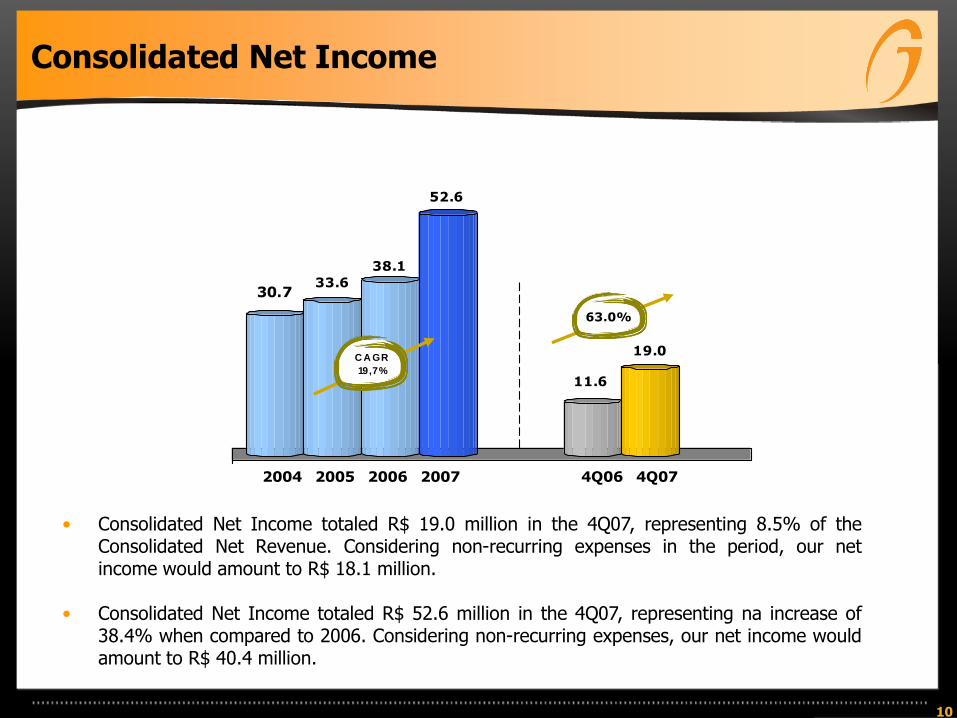
Consolidated Net Income
• Consolidated Net Income totaled R$ 19.0 million in the 4Q07, representing 8.5% of theConsolidated Net Revenue. Considering non-recurring expenses in the period, our netincome would amount to R$ 18.1 million.
• Consolidated Net Income totaled R$ 52.6 million in the 4Q07, representing na increase of38.4% when compared to 2006. Considering non-recurring expenses, our net income wouldamount to R$ 40.4 million.
30.733.6
38.1
52.6
11.6
19.0
2004 2005 2006 2007 4Q06 4Q07
63.0%
C A GR
19,7%
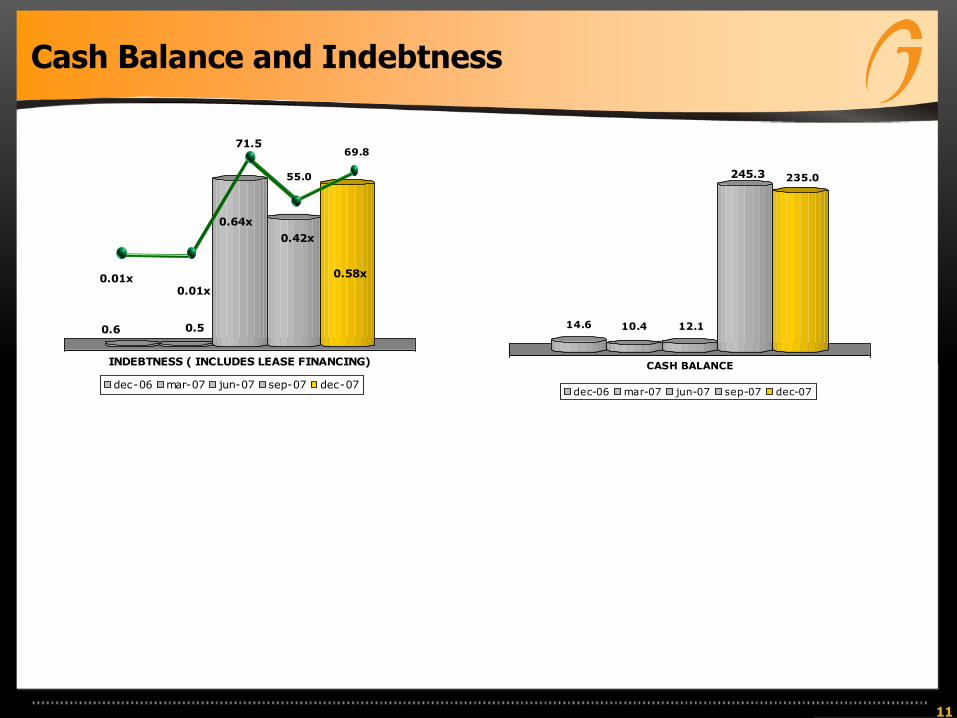
Cash Balance and Indebtness
0.6 0.5
71.5
55.0
69.8
INDEBTNESS ( INCLUDES LEASE FINANCING)
dec-06 mar-07 jun-07 sep-07 dec-07
0.01x0.01x
0.64x
0.58x
0.42x
14.6 10.4 12.1
245.3 235.0
CASH BALANCE
dec-06 mar-07 jun-07 sep-07 dec-07
11
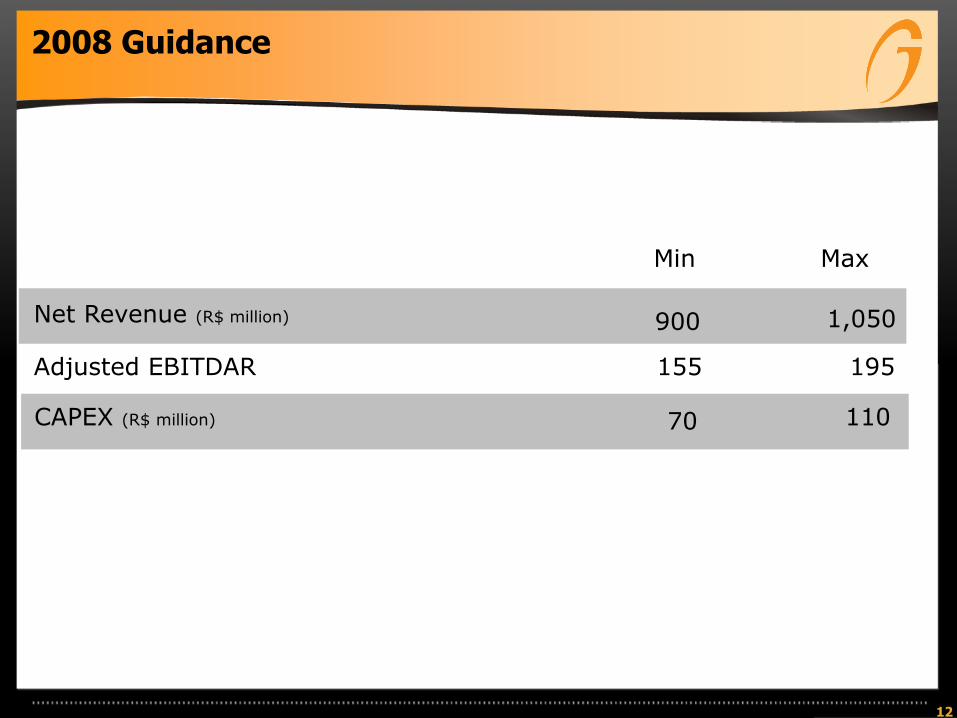
12
1,050
110
195
Net Revenue (R$ million)
CAPEX (R$ million)
Adjusted EBITDAR
MaxMin
900
155
70
2008 Guidance
IR Contact
Gennaro Oddone
+55 (11) 4346-2678
Alexandre Brandão
+55 (11) 4346-2532
13
The forward-looking statements contained in this report are subject to risks anduncertainties, being based on beliefs and assumptions of our management andinformation currently available to the Company. Such statements include informationon our current intentions, beliefs or expectations, as well as those of our Board ofDirectors and Board of Executive Officers.
These reservations concerning forward-looking statements also apply to informationon our possible or presumed operating results, as well as declarations preceded by,including or followed by such words as "believe", "may", "will", "continue", "expect","foresee", "intend", "plan", "estimate" and other similar expressions.
Forward-looking statements do not constitute a guarantee of performance. Since theyrefer to the future, they depend on circumstances that they may or may not occur andare therefore subject to risks, uncertainties and assumptions. Future results and thecreation of shareholder value may differ substantially from those expressed orsuggested by the forward-looking statements. These results and values depend onmany factors beyond the TEGMA control or foresight.
14