Embed Size (px)
Citation preview
February 9, 2017
Investor Presentation KBW Winter Financial Services Symposium
1 1
When used in this presentation and in documents filed with or furnished to the Securities and Exchange Commission (the “SEC”), or other public shareholder communications, or in oral statements made with the approval of an authorized executive officer, the words or phrases “believe,” “will,” “should,” “will likely result,” “are expected to,” “will continue,” “is anticipated,” “estimate,” “project,” “plans,” or similar expressions are intended to identify “forward-looking statements” within the meaning of the Private Securities Litigation Reform Act of 1995. You are cautioned not to place undue reliance on any forward-looking statements, which speak only as of the date made. These statements may relate to future financial performance, strategic plans or objectives, revenue, expense or earnings projections, or other financial items of Banc of California Inc. and its affiliates (“BANC,” the “Company,” “we,” “us” or “our”). By their nature, these statements are subject to numerous uncertainties that could cause actual results to differ materially from those anticipated in the statements. Factors that could cause actual results to differ materially from the results anticipated or projected include, but are not limited to, the following: (i) Pending governmental and internal investigations may result in adverse findings, reputational damage, the imposition of sanctions and other negative consequences; (ii) management time and resources may be diverted to address pending governmental and internal investigations as well as any related litigation; (iii) the recent resignation of our chief executive officer might cause a loss of confidence among certain customers who may withdraw their deposits or terminate their business relationships with us; (iv) our performance may be adversely affected by the management transition resulting from the recent resignation of our chief executive officer; (v) risks that the Company’s acquisitions and dispositions, including the acquisitions of branches from Banco Popular, The Private Bank of California, and CS Financial, Inc., and the acquisition and disposition of The Palisades Group, may disrupt current plans and operations, the potential difficulties in customer and employee retention as a result of those transactions and the amount of the costs, fees, expenses and charges related to those transactions; (vi) the credit risks of lending activities, which may be affected by further deterioration in real estate markets and the financial condition of borrowers, may lead to increased loan and lease delinquencies, losses and nonperforming assets in our loan portfolio, and may result in our allowance for loan and lease losses not being adequate to cover actual losses and require us to materially increase our loan and lease loss reserves; (vii) the quality and composition of our securities and loan portfolios; (viii) changes in general economic conditions, either nationally or in our market areas; (ix) continuation of the historically low short-term interest rate environment, changes in the levels of general interest rates, and the relative differences between short- and long-term interest rates, deposit interest rates, our net interest margin and funding sources; (x) fluctuations in the demand for loans and leases, the number of unsold homes and other properties and fluctuations in commercial and residential real estate values in our market area; (xi) results of examinations of us by regulatory authorities and the possibility that any such regulatory authority may, among other things, require us to increase our allowance for loan and lease losses, write-down asset values, increase our capital levels, or affect our ability to borrow funds or maintain or increase deposits, which could adversely affect our liquidity and earnings; (xii) legislative or regulatory changes that adversely affect our business, including changes in regulatory capital or other rules; (xiii) our ability to control operating costs and expenses; (xiv) staffing fluctuations in response to product demand or the implementation of corporate strategies that affect our work force and potential associated charges; (xv) errors in our estimates in determining fair value of certain of our assets, which may result in significant declines in valuation; (xvi) the network and computer systems on which we depend could fail or experience a security breach; (xvii) our ability to attract and retain key members of our senior management team; (xviii) costs and effects of litigation, including settlements and judgments; (xix) increased competitive pressures among financial services companies; (xx) changes in consumer spending, borrowing and saving habits; (xxi) adverse changes in the securities markets; (xxii) earthquake, fire or other natural disasters affecting the condition of real estate collateral; (xxiii) the availability of resources to address changes in laws, rules or regulations or to respond to regulatory actions; (xxiv) inability of key third-party providers to perform their obligations to us; (xxv) changes in accounting policies and practices, as may be adopted by the financial institution regulatory agencies or the Financial Accounting Standards Board or their application to our business or final audit adjustments, including additional guidance and interpretation on accounting issues and details of the implementation of new accounting methods; (xxvi) war or terrorist activities; and (xxvii) other economic, competitive, governmental, regulatory, and technological factors affecting our operations, pricing, products and services and the other risks described in this report and from time to time in other documents that we file with or furnish to the SEC. You should not place undue reliance on forward-looking statements, and we undertake no obligation to update any such statements to reflect circumstances or events that occur after the date on which the forward-looking statement is made.
Forward-looking Statements
2 2
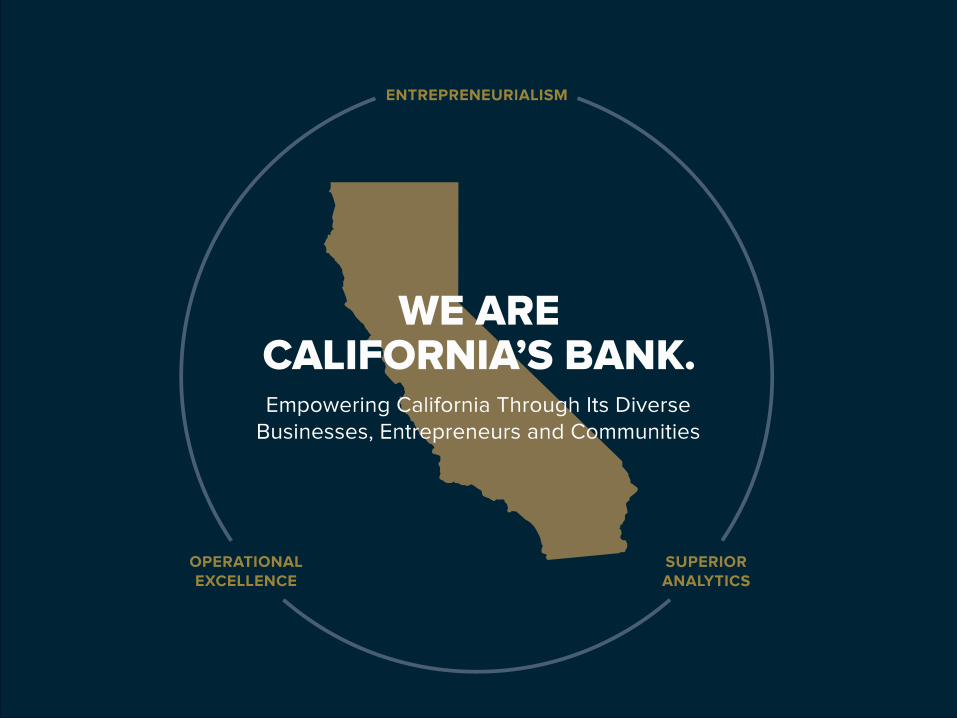
ENTREPRENEURIALISM
SUPERIOR ANALYTICS
OPERATIONAL EXCELLENCE
WE ARE CALIFORNIA’S BANK.
Empowering California Through Its Diverse Businesses, Entrepreneurs and Communities
3 3
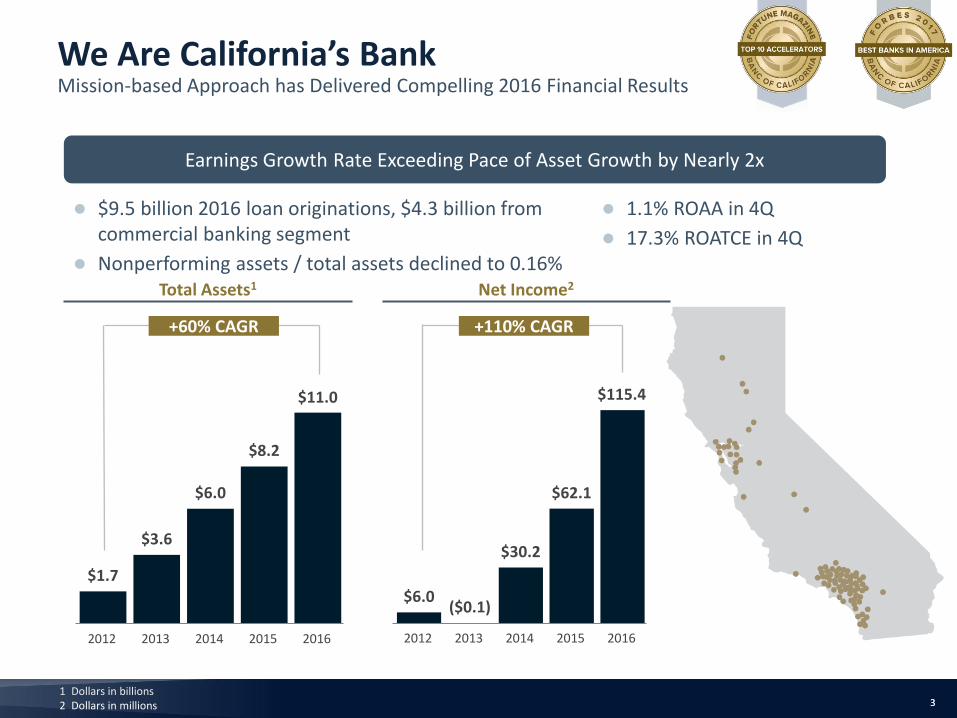
+60% CAGR +110% CAGR
Total Assets1 Net Income2
We Are California’s Bank Mission-based Approach has Delivered Compelling 2016 Financial Results
$1.7
$3.6
$6.0
$8.2
$11.0
2012 2013 2014 2015 2016
$6.0 ($0.1)
$30.2
$62.1
2012 2013 2014 2015 2016
$9.5 billion 2016 loan originations, $4.3 billion from commercial banking segment
Nonperforming assets / total assets declined to 0.16%
Earnings Growth Rate Exceeding Pace of Asset Growth by Nearly 2x
1.1% ROAA in 4Q
17.3% ROATCE in 4Q
$115.4
1 Dollars in billions 2 Dollars in millions
4 4
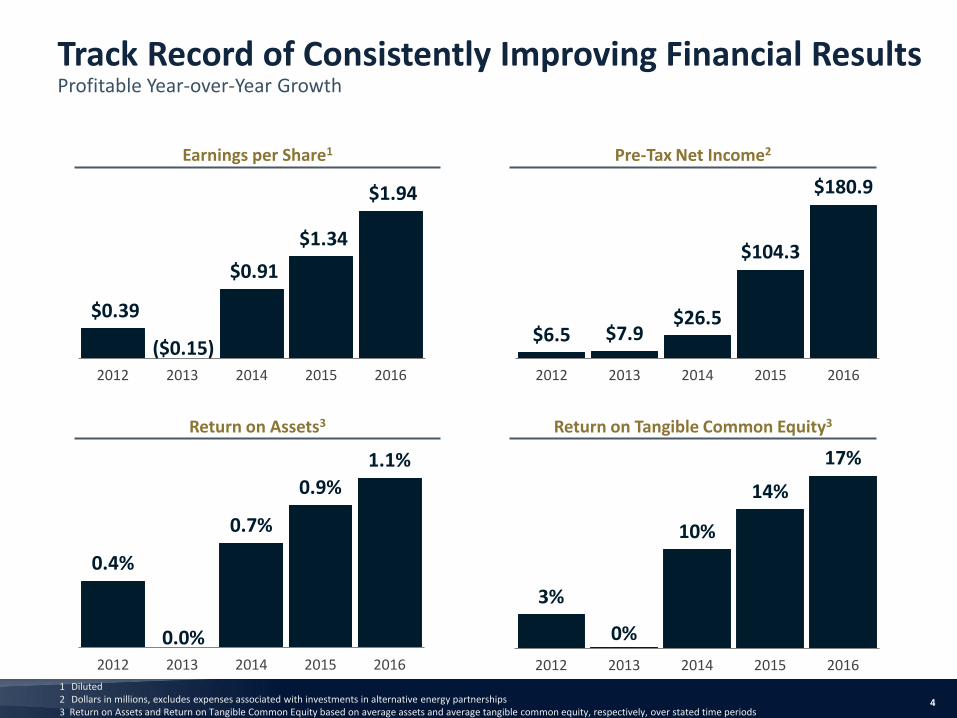
$0.39
($0.15)
$0.91
$1.34
$1.94
2012 2013 2014 2015 2016
$6.5 $7.9 $26.5
$104.3
$180.9
2012 2013 2014 2015 2016
0.4%
0.0%
0.7%
0.9%
1.1%
2012 2013 2014 2015 2016
3%
0%
10%
14%
17%
2012 2013 2014 2015 20161 Diluted 2 Dollars in millions, excludes expenses associated with investments in alternative energy partnerships 3 Return on Assets and Return on Tangible Common Equity based on average assets and average tangible common equity, respectively, over stated time periods
Pre-Tax Net Income2 Earnings per Share1
Return on Tangible Common Equity3 Return on Assets3
Track Record of Consistently Improving Financial Results Profitable Year-over-Year Growth
5 5
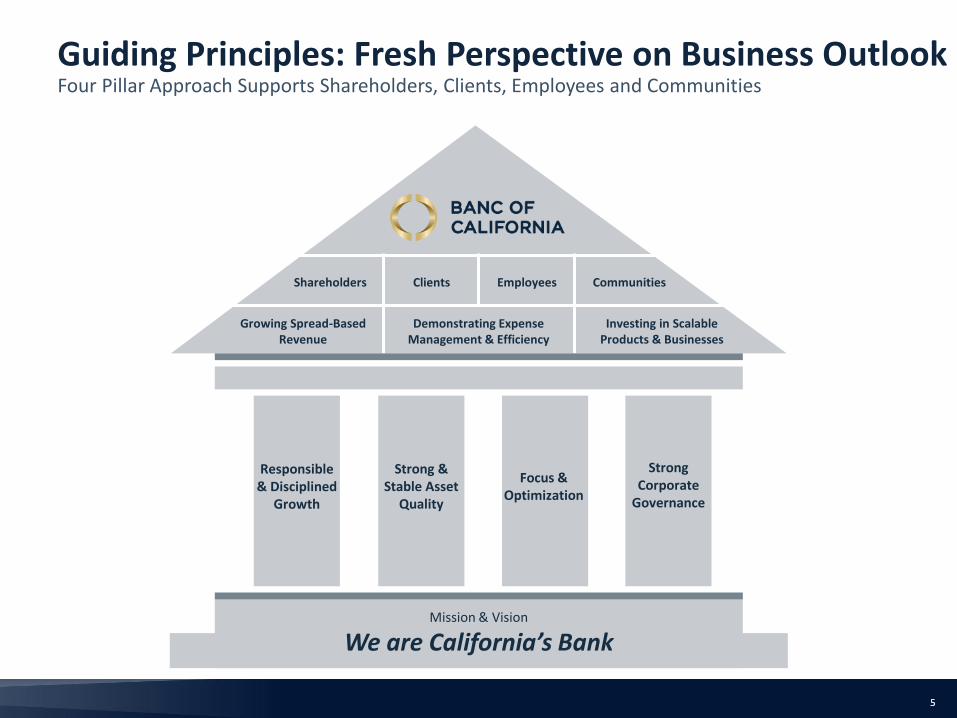
Guiding Principles: Fresh Perspective on Business Outlook Four Pillar Approach Supports Shareholders, Clients, Employees and Communities
Mission & Vision
We are California’s Bank
Responsible & Disciplined
Growth
Strong & Stable Asset
Quality
Focus & Optimization
Growing Spread-Based Revenue
Demonstrating Expense Management & Efficiency
Investing in Scalable Products & Businesses
Shareholders Clients Employees Communities
Strong Corporate
Governance
6 6
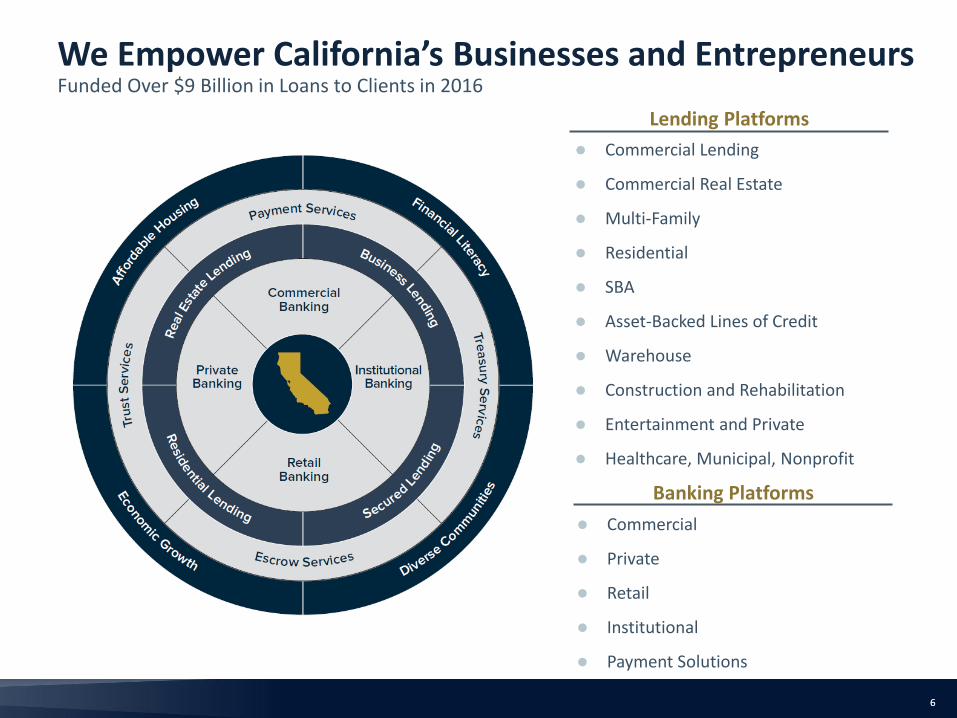
We Empower California’s Businesses and Entrepreneurs Funded Over $9 Billion in Loans to Clients in 2016
Lending Platforms
Commercial Lending
Commercial Real Estate
Multi-Family
Residential
SBA
Asset-Backed Lines of Credit
Warehouse
Construction and Rehabilitation
Entertainment and Private
Healthcare, Municipal, Nonprofit
Banking Platforms
Commercial
Private
Retail
Institutional
Payment Solutions
7 7
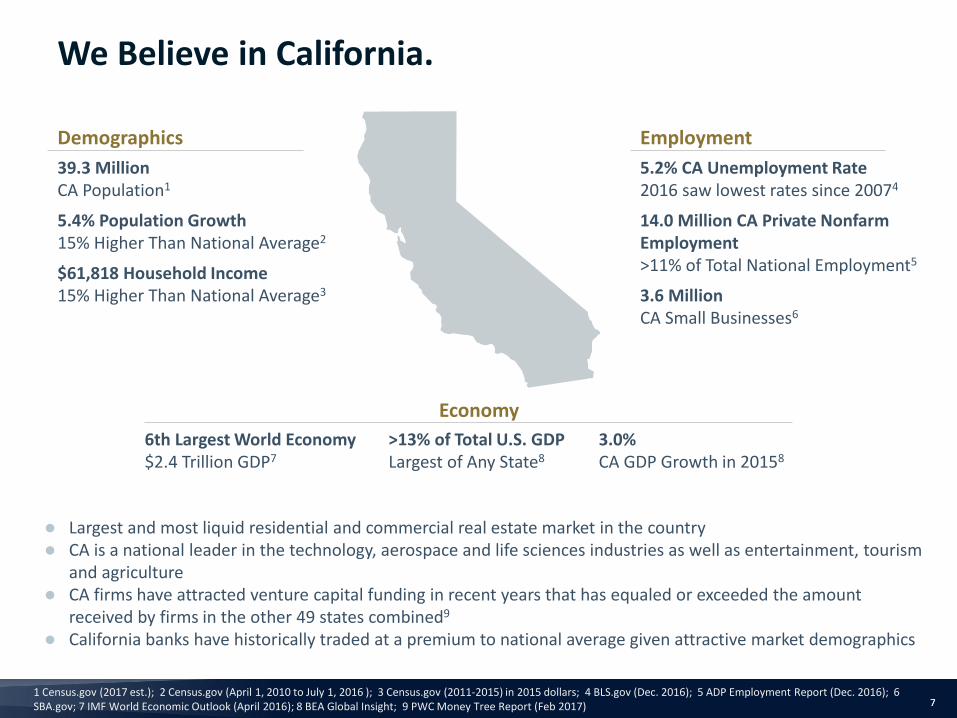
We Believe in California.
39.3 Million CA Population1
5.4% Population Growth 15% Higher Than National Average2
$61,818 Household Income 15% Higher Than National Average3
5.2% CA Unemployment Rate
2016 saw lowest rates since 20074
14.0 Million CA Private Nonfarm Employment >11% of Total National Employment5
3.6 Million CA Small Businesses6
6th Largest World Economy $2.4 Trillion GDP7
>13% of Total U.S. GDP Largest of Any State8
3.0% CA GDP Growth in 20158
1 Census.gov (2017 est.); 2 Census.gov (April 1, 2010 to July 1, 2016 ); 3 Census.gov (2011-2015) in 2015 dollars; 4 BLS.gov (Dec. 2016); 5 ADP Employment Report (Dec. 2016); 6 SBA.gov; 7 IMF World Economic Outlook (April 2016); 8 BEA Global Insight; 9 PWC Money Tree Report (Feb 2017)
Largest and most liquid residential and commercial real estate market in the country CA is a national leader in the technology, aerospace and life sciences industries as well as entertainment, tourism
and agriculture CA firms have attracted venture capital funding in recent years that has equaled or exceeded the amount
received by firms in the other 49 states combined9
California banks have historically traded at a premium to national average given attractive market demographics
Demographics Employment
Economy
8 8
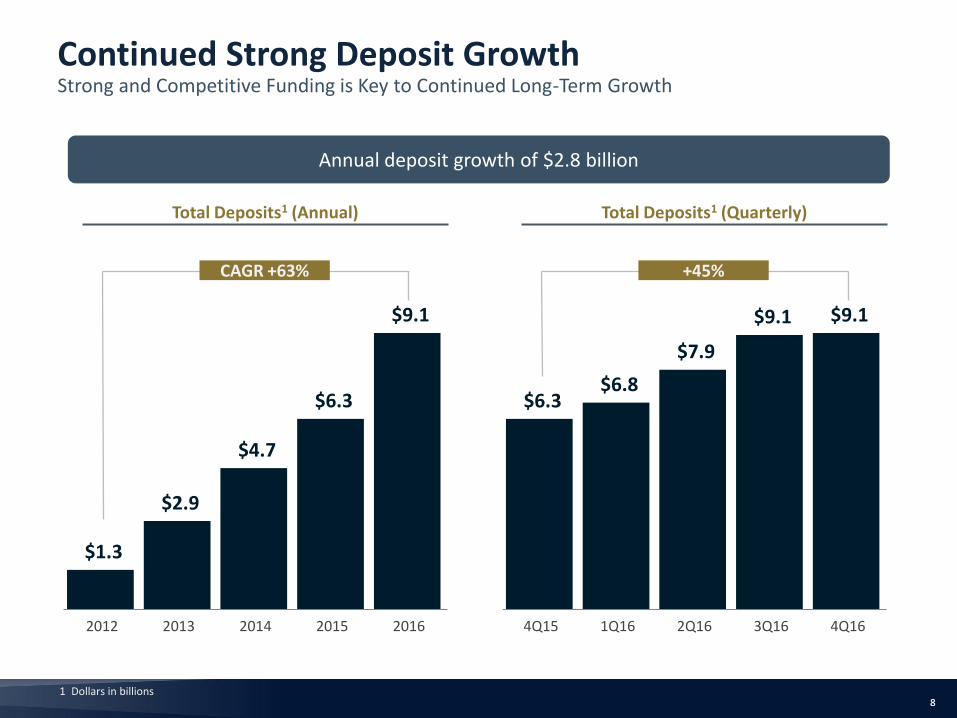
$1.3
$2.9
$4.7
$6.3
$9.1
2012 2013 2014 2015 2016
CAGR +63%
Total Deposits1 (Annual)
Annual deposit growth of $2.8 billion
$6.3 $6.8
$7.9
$9.1 $9.1
4Q15 1Q16 2Q16 3Q16 4Q16
+45%
Total Deposits1 (Quarterly)
1 Dollars in billions
Continued Strong Deposit Growth Strong and Competitive Funding is Key to Continued Long-Term Growth
9 9
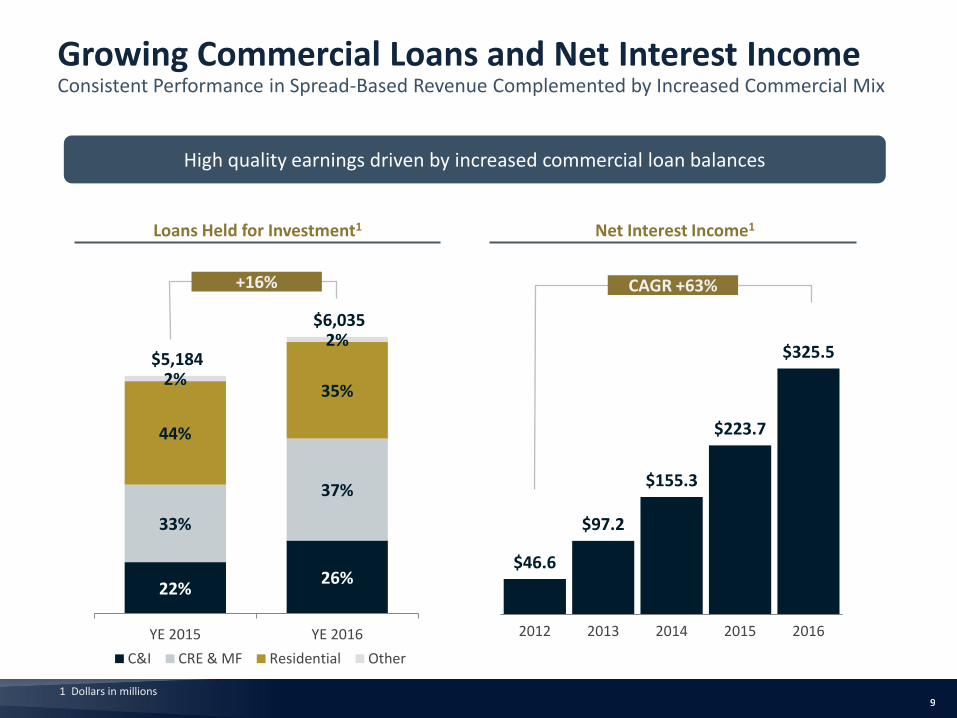
$46.6
$97.2
$155.3
$223.7
$325.5
2012 2013 2014 2015 2016
CAGR +63%
1 Dollars in millions
High quality earnings driven by increased commercial loan balances
Loans Held for Investment1
22% 26%
33%
37%
44%
35% 2%
2% $5,184
$6,035
YE 2015 YE 2016
C&I CRE & MF Residential Other
Net Interest Income1
+16%
Growing Commercial Loans and Net Interest Income Consistent Performance in Spread-Based Revenue Complemented by Increased Commercial Mix
10 10
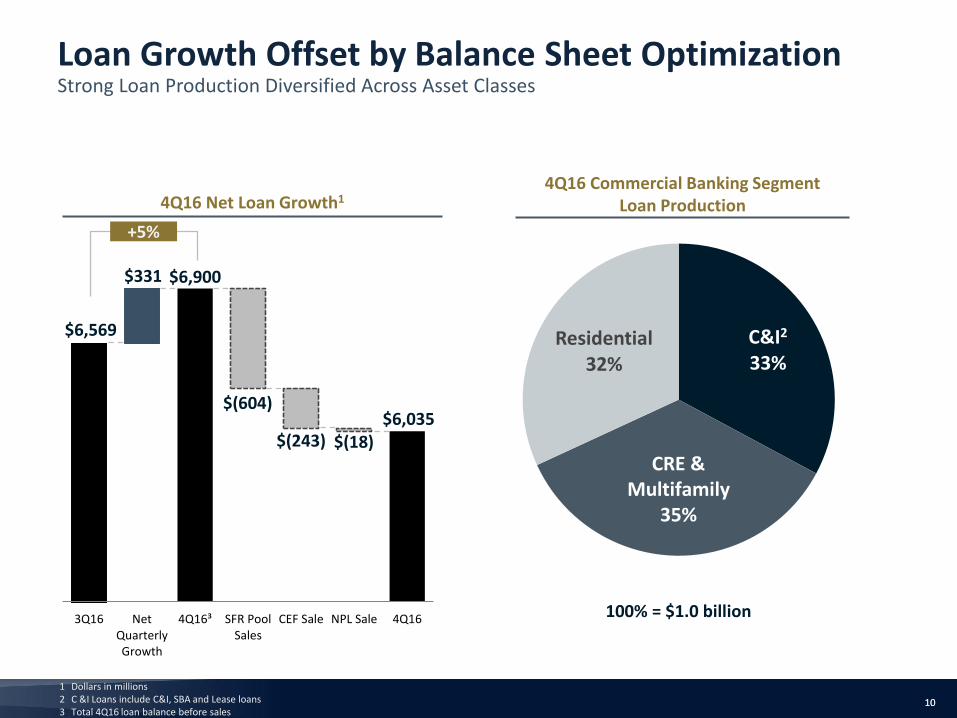
C&I2 33%
Residential 32%
CRE & Multifamily
35%
1 Dollars in millions 2 C &I Loans include C&I, SBA and Lease loans 3 Total 4Q16 loan balance before sales
100% = $1.0 billion
4Q16 Commercial Banking Segment Loan Production 4Q16 Net Loan Growth1
$6,900
$6,035 $(604)
$(243) $(18)
$6,569
$331
3Q16 NetQuarterlyGrowth
4Q16³ SFR PoolSales
CEF Sale NPL Sale 4Q16
+5%
Loan Growth Offset by Balance Sheet Optimization Strong Loan Production Diversified Across Asset Classes
11 11
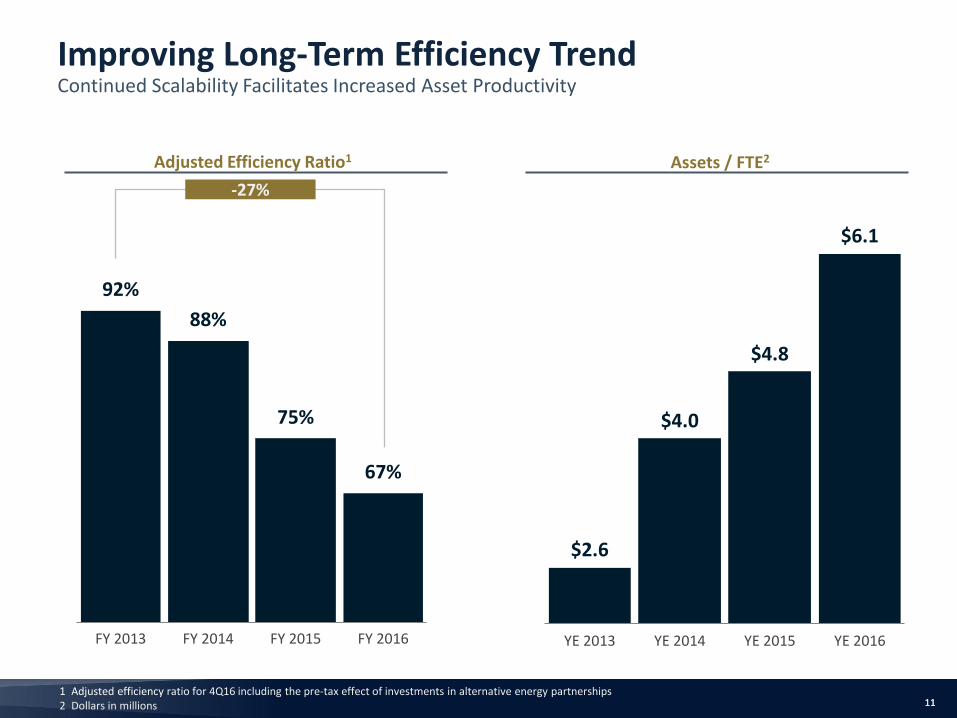
92%
88%
75%
67%
FY 2013 FY 2014 FY 2015 FY 2016
1 Adjusted efficiency ratio for 4Q16 including the pre-tax effect of investments in alternative energy partnerships 2 Dollars in millions
Adjusted Efficiency Ratio1
-27%
$2.6
$4.0
$4.8
$6.1
YE 2013 YE 2014 YE 2015 YE 2016
Assets / FTE2
Improving Long-Term Efficiency Trend Continued Scalability Facilitates Increased Asset Productivity
12 12
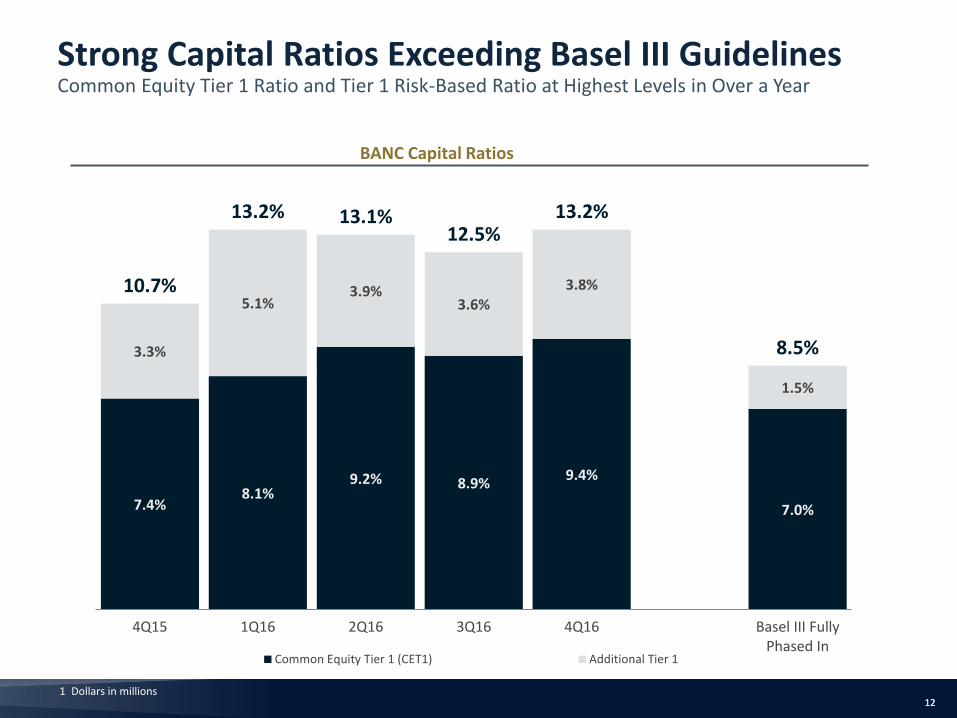
7.4% 8.1%
9.2% 8.9% 9.4%
7.0%
3.3%
5.1% 3.9%
3.6% 3.8%
1.5%
10.7%
13.2% 13.1% 12.5%
13.2%
8.5%
4Q15 1Q16 2Q16 3Q16 4Q16 Basel III FullyPhased In
Common Equity Tier 1 (CET1) Additional Tier 1
BANC Capital Ratios
1 Dollars in millions
Strong Capital Ratios Exceeding Basel III Guidelines Common Equity Tier 1 Ratio and Tier 1 Risk-Based Ratio at Highest Levels in Over a Year
13 13
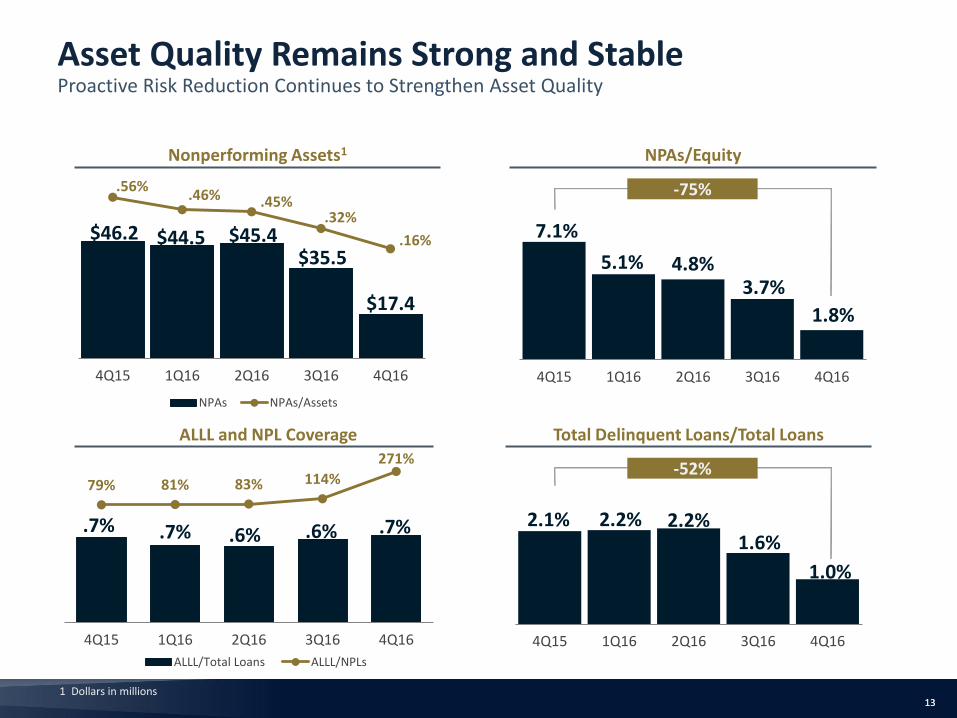
$46.2 $44.5 $45.4 $35.5
$17.4
.56% .46% .45%
.32%
.16%
4Q15 1Q16 2Q16 3Q16 4Q16
NPAs NPAs/Assets
NPAs/Equity Nonperforming Assets1
ALLL and NPL Coverage
7.1%
5.1% 4.8% 3.7%
1.8%
4Q15 1Q16 2Q16 3Q16 4Q16
.7% .7% .6% .6% .7%
79% 81% 83% 114%
271%
4Q15 1Q16 2Q16 3Q16 4Q16
ALLL/Total Loans ALLL/NPLs
Total Delinquent Loans/Total Loans
2.1% 2.2% 2.2% 1.6%
1.0%
4Q15 1Q16 2Q16 3Q16 4Q16
-75%
-52%
1 Dollars in millions
Asset Quality Remains Strong and Stable Proactive Risk Reduction Continues to Strengthen Asset Quality
14 14
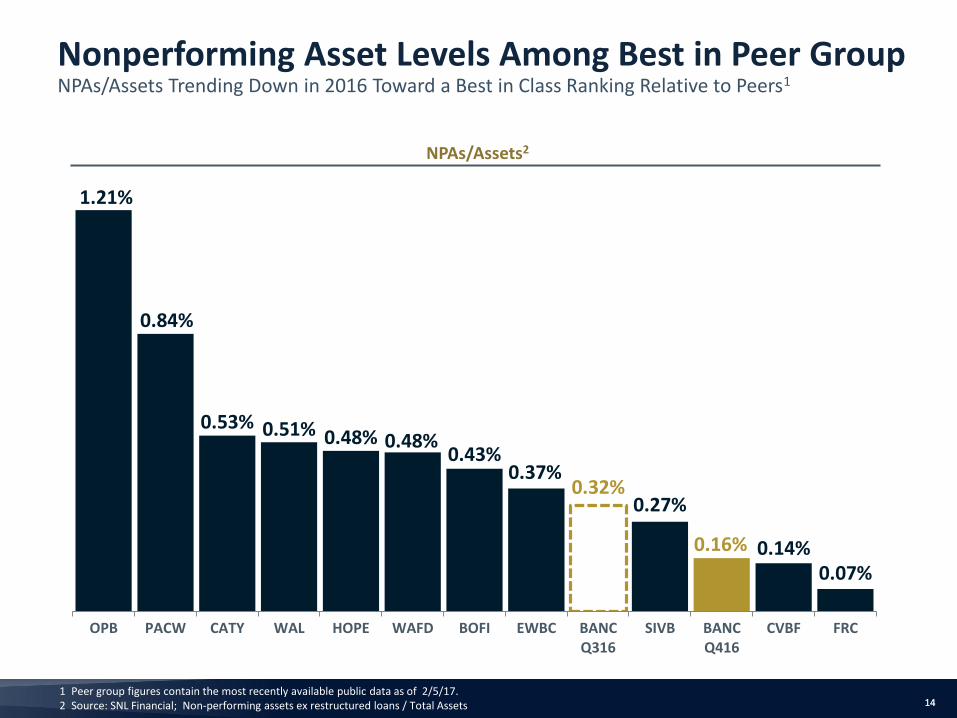
1.21%
0.84%
0.53% 0.51% 0.48% 0.48% 0.43%
0.37% 0.32%
0.27%
0.16% 0.14% 0.07%
OPB PACW CATY WAL HOPE WAFD BOFI EWBC BANCQ316
SIVB BANCQ416
CVBF FRC
NPAs/Assets2
1 Peer group figures contain the most recently available public data as of 2/5/17. 2 Source: SNL Financial; Non-performing assets ex restructured loans / Total Assets
Nonperforming Asset Levels Among Best in Peer Group NPAs/Assets Trending Down in 2016 Toward a Best in Class Ranking Relative to Peers1
15 15
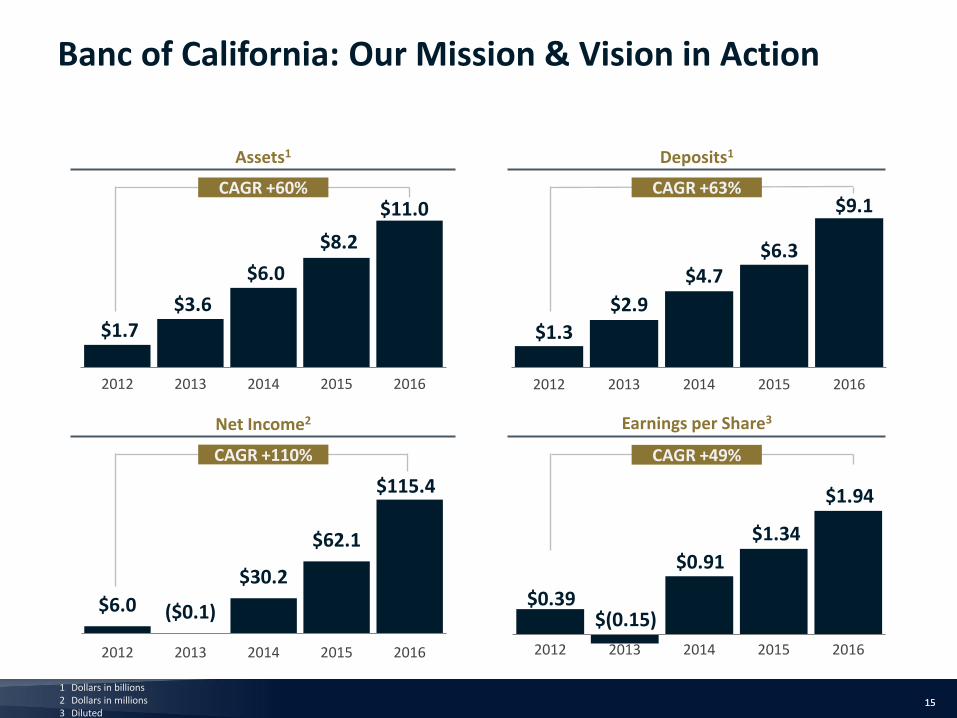
Banc of California: Our Mission & Vision in Action
$6.0 ($0.1)
$30.2
$62.1
$115.4
2012 2013 2014 2015 2016
$1.7 $3.6
$6.0
$8.2
$11.0
2012 2013 2014 2015 2016
$(0.15)
$1.34
$0.39
$0.91
$1.94
2012 2013 2014 2015 2016
$1.3
$2.9
$4.7 $6.3
$9.1
2012 2013 2014 2015 2016
Deposits1
Earnings per Share3 Net Income2
Assets1
CAGR +60% CAGR +63%
CAGR +110% CAGR +49%
1 Dollars in billions 2 Dollars in millions 3 Diluted
16 16
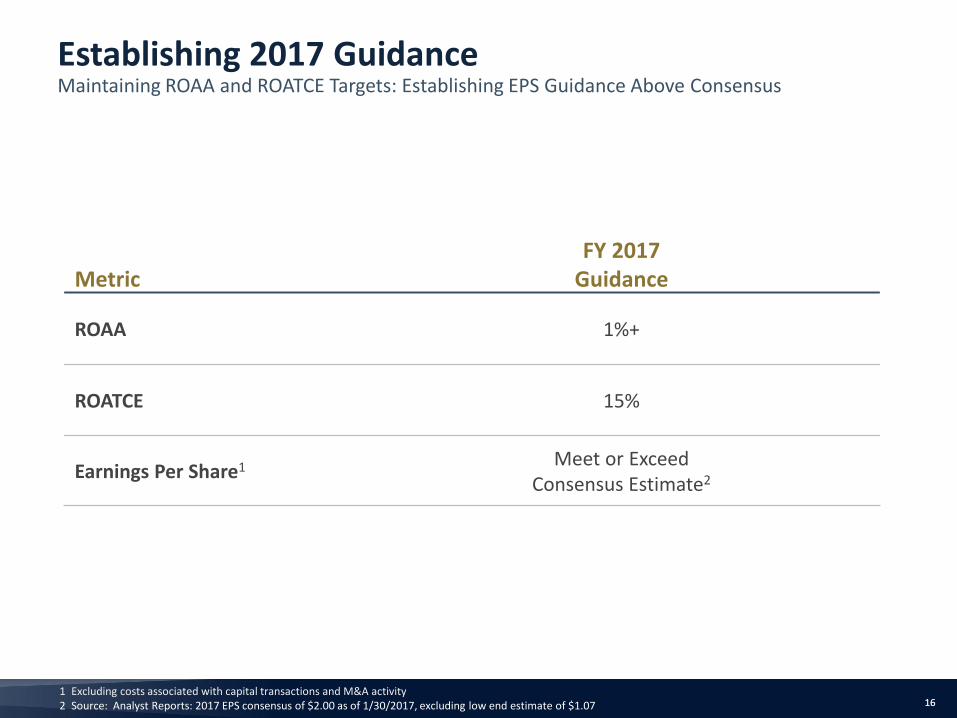
Metric FY 2017
Guidance
ROAA 1%+
ROATCE 15%
Earnings Per Share1 Meet or Exceed Consensus Estimate2
1 Excluding costs associated with capital transactions and M&A activity 2 Source: Analyst Reports: 2017 EPS consensus of $2.00 as of 1/30/2017, excluding low end estimate of $1.07
Establishing 2017 Guidance Maintaining ROAA and ROATCE Targets: Establishing EPS Guidance Above Consensus
17 17
V I S I O N
We Are California’s Bank.
18 18
M I S S I O N
Empowering California through its Diverse Businesses, Entrepreneurs and Communities
19 19
W E B E L I E V E
We Believe In Empowering Dreams.
We Believe In Strong Partnerships.
We Believe In California.
20 20


![KBW European Financials Conferencefiles.investis.com/experian/docs/kbw_conference.pdfMicrosoft PowerPoint - EXPERIAN Presentation for KBW Conference London 16 September 2008.ppt [Read-Only]](https://img.pdfslide.net/doc/110x75/5fb816144c7ec3113d13550e/kbw-european-financials-microsoft-powerpoint-experian-presentation-for-kbw-conference.jpg)


![Kbw office comm assist candidate[bws-edit]](https://img.pdfslide.net/doc/110x75/58edcdb21a28abf82e8b45a3/kbw-office-comm-assist-candidatebws-edit.jpg)