Embed Size (px)
Citation preview
January 25, 2017
4th Quarter 2016
Earnings Conference Call
2
Cautionary Statement
Regarding Forward-Looking Statements
This presentation contains forward-looking statements in which FCX discusses its potential future performance. Forward-looking statements are all statements other than statements of historical facts, such as projections or expectations relating to ore grades and milling rates, production and sales volumes, unit net cash costs, operating cash flows, capital expenditures, debt reduction initiatives, exploration efforts and results, development and production activities and costs, liquidity, tax rates, the impact of copper, gold and molybdenum price changes, the impact of deferred intercompany profits on earnings, reserve estimates, future dividend payments, and share purchases and sales. The words “anticipates,” “may,” “can,” “plans,” “believes,” “estimates,” “expects,” “projects,” "targets," “intends,” “likely,” “will,” “should,” “to be,” ”potential" and any similar expressions are intended to identify those assertions as forward-looking statements. Under its revolving credit facility, as amended, FCX is not permitted to pay dividends on common stock on or prior to March 31, 2017. The declaration of dividends is at the discretion of FCX's Board of Directors (Board), subject to restrictions under FCX's credit agreements, and will depend on FCX's financial results, cash requirements, future prospects, and other factors deemed relevant by the Board. This presentation also includes forward-looking statements regarding mineralized material and potential recourses not included in proven and probable mineral reserves. The mineralized material and potential resources described in this presentation will not qualify as reserves until comprehensive engineering studies establish their economic feasibility. Accordingly, no assurance can be given that the estimated mineralized material and potential resources not included in reserves will become proven and probable reserves.
FCX cautions readers that forward-looking statements are not guarantees of future performance and actual results may differ materially from those anticipated, projected or assumed in the forward-looking statements. Important factors that can cause FCX's actual results to differ materially from those anticipated in the forward-looking statements include supply of and demand for, and prices of, copper, gold and molybdenum, mine sequencing, production rates, potential effects of cost and capital expenditure reductions and production curtailments on financial results and cash flow, the outcome of FCX's debt reduction initiatives, FCX's ability to secure regulatory approvals, potential inventory adjustments, potential impairment of long-lived mining assets, the outcome of ongoing discussions with the Indonesian government regarding PT Freeport Indonesia's (PT-FI) Contract of Work (COW), the potential effects of violence in Indonesia generally and in the province of Papua, industry risks, regulatory changes, political risks, labor relations, weather-and climate-related risks, environmental risks, litigation results (including the final disposition of the recent unfavorable Indonesian Tax Court ruling relating to surface water taxes) and other factors described in more detail under the heading “Risk Factors” in FCX's Annual Report on Form 10-K for the year ended December 31, 2015, filed with the U.S. Securities and Exchange Commission (SEC) as updated by FCX's subsequent filings with the SEC. With respect to FCX's operations in Indonesia, such factors include whether PT-FI will be able to resume exporting its copper concentrate directly and indirectly through PT Smelting (PT-FI's 25 percent-owned Indonesian smelting unit), which depends upon the satisfactory resolution of complex regulatory matters in Indonesia. PT-FI's inability to export copper concentrate itself and through PT Smelting for any extended period of time would lead to the suspension of all of FCX's production in Indonesia.
Investors are cautioned that many of the assumptions upon which FCX's forward-looking statements are based are likely to change after the forward-looking statements are made, including for example commodity prices, which FCX cannot control, and production volumes and costs, some aspects of which FCX may not be able to control. Further, FCX may make changes to its business plans that could affect its results. FCX cautions investors that it does not intend to update forward-looking statements more frequently than quarterly notwithstanding any changes in its assumptions, changes in business plans, actual experience or other changes, and FCX undertakes no obligation to update any forward-looking statements.
This presentation also contains certain financial measures such as unit net cash costs per pound of copper and molybdenum, oil and gas realized revenues, cash production costs and cash operating margin, which are not recognized under U.S. generally accepted accounting principles. As required by SEC Regulation G, reconciliations of these measures to amounts reported in FCX's consolidated financial statements are in the supplemental schedules of FCX’s 4Q16 press release, which are also available on FCX's website, "fcx.com."
3
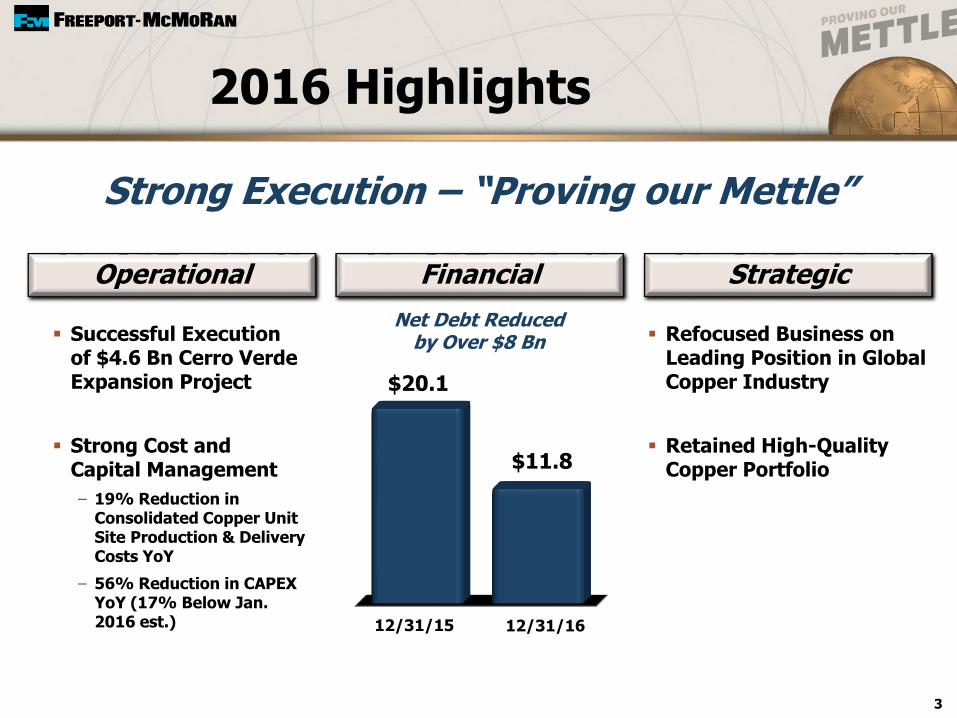
2016 Highlights
Refocused Business on Leading Position in Global Copper Industry
Retained High-Quality Copper Portfolio
Strategic
Successful Execution of $4.6 Bn Cerro Verde Expansion Project
Strong Cost and Capital Management
− 19% Reduction in Consolidated Copper Unit Site Production & Delivery Costs YoY
− 56% Reduction in CAPEX YoY (17% Below Jan. 2016 est.)
Operational Financial
12/31/15
$20.1
$11.8
12/31/16
Strong Execution – “Proving our Mettle”
Net Debt Reduced by Over $8 Bn

4
Completed $6.6 Billion in Asset Sale Transactions in 2016
Morenci (13% Interest) $1.00 n/a
Timok Exploration Project 0.13 $0.11
Other Sales 0.25 n/a
Tenke Fungurume 2.65 0.12
Oil & Gas Transactions 2.59 0.30
Total $6.62 $0.53
Aggregate Cash Contingent Consideration Consideration
(1)
(1) Payable to FCX in stages based upon achievement of defined development milestones.
(2) Up to $60 mm payable to FCX if the avg copper price exceeds $3.50/lb and $60 mm if the avg cobalt price exceeds $20/lb, both for the 24-month period ending December 31, 2019.
(3) Up to $150 mm payable to FCX over time as DW GOM buyer realizes future cash flows in connection with third-party production handling agreement for the Marlin platform and up to $50 mm per annum in each of 2018, 2019 and 2020 if the price of Brent crude oil averages over $70/bbl in each calendar year.
($ in billions)
No Additional Sales Required
(2)
(3)
Completed in 4Q16
5
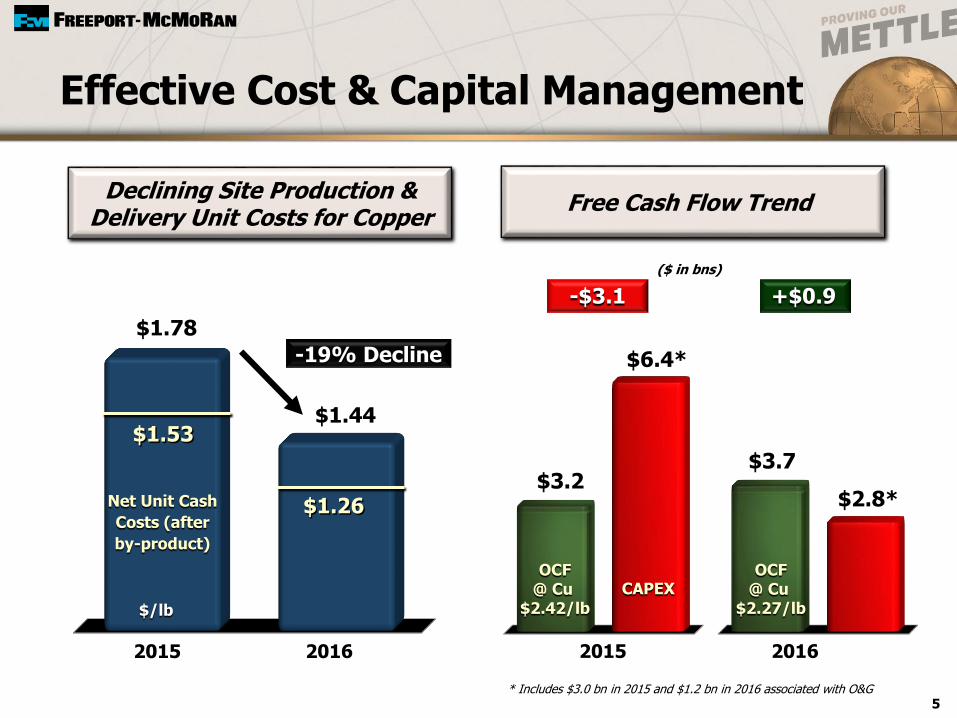
Declining Site Production & Delivery Unit Costs for Copper
($ in bns)
Free Cash Flow Trend
2015 2016
Net Unit Cash
Costs (after
by-product)
$1.53
$1.26
$/lb
$1.44
$1.78
-19% Decline
-$3.1 +$0.9
$6.4*
$3.7
$2.8*
OCF@ Cu
$2.42/lb
CAPEX
2015 2016
OCF@ Cu
$2.27/lb
* Includes $3.0 bn in 2015 and $1.2 bn in 2016 associated with O&G
Effective Cost & Capital Management
$3.2
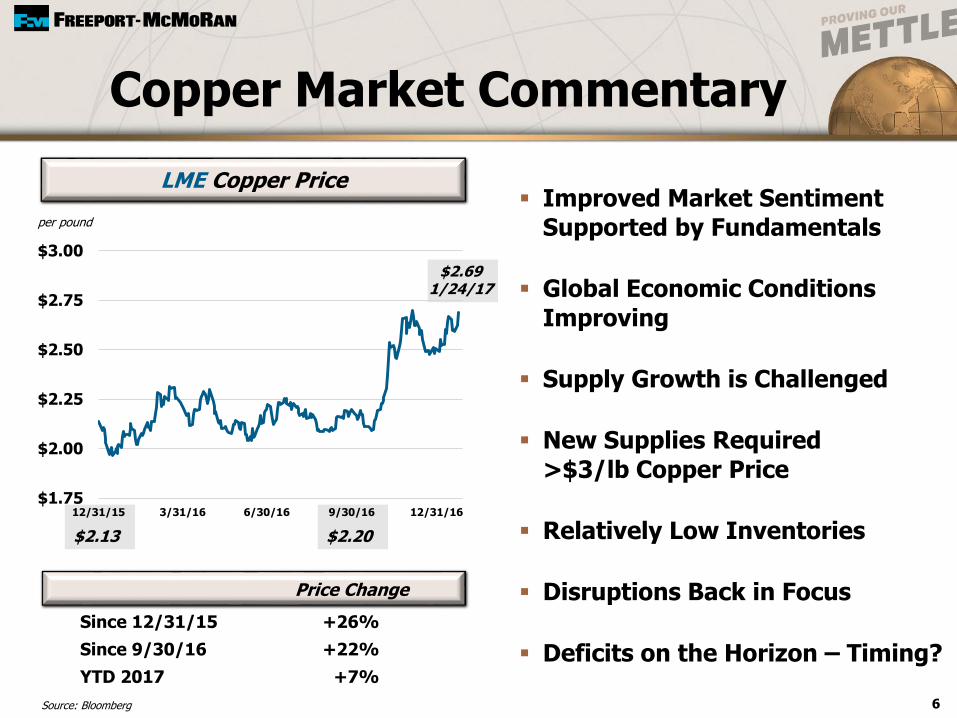
6Source: Bloomberg
$1.75
$2.00
$2.25
$2.50
$2.75
$3.00
12/31/15 3/31/16 6/30/16 9/30/16 12/31/16
$2.13 $2.20
$2.691/24/17
per pound
Since 12/31/15 +26%
Since 9/30/16 +22%
YTD 2017 +7%
LME Copper Price Improved Market Sentiment
Supported by Fundamentals
Global Economic Conditions
Improving
Supply Growth is Challenged
New Supplies Required
>$3/lb Copper Price
Relatively Low Inventories
Disruptions Back in Focus
Deficits on the Horizon – Timing?
Copper Market Commentary
Price Change

World’s Leading Copper Producers
7
0
500
1,000
1,500
2,000
Codelco Freeport-McMoRan
Glencore BHP SouthernCopper
KGHM Rio Tinto Antofagasta FirstQuantum
Vale
(000 t)
Top 10 Copper Producers (2016e)
Source: Wood Mackenzie December 13, 2016. Rankings based on net equity ownership.* Reflects Morenci ownership of 85% interest through 5/31/16 and 72% interest from 6/1/16; excludes Tenke Fungurume which was sold November 2016.
*
8
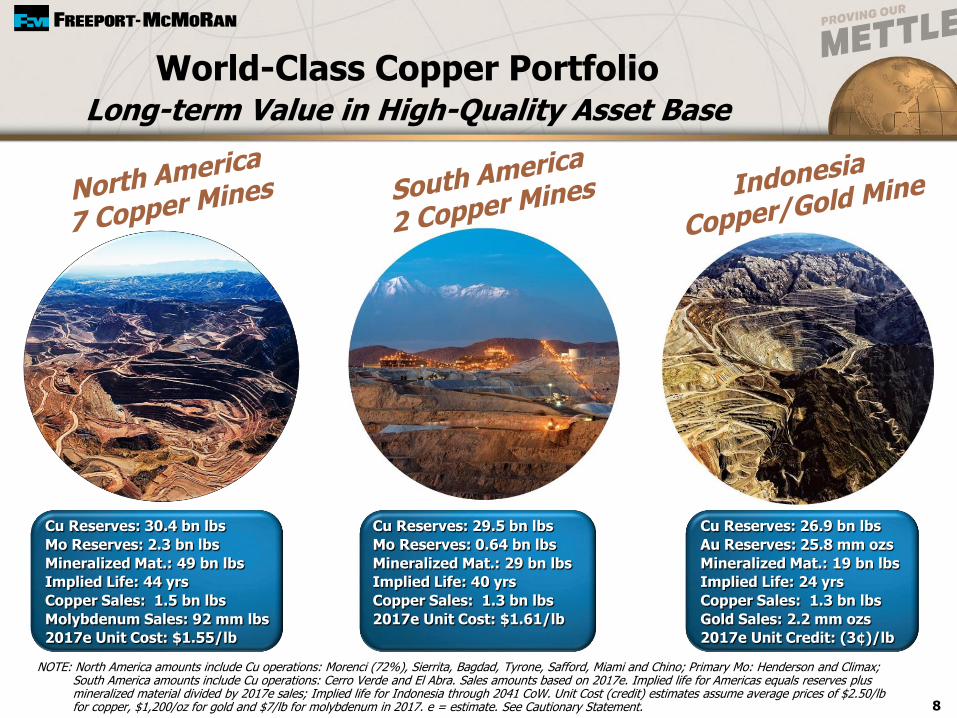
World-Class Copper PortfolioLong-term Value in High-Quality Asset Base
NOTE: North America amounts include Cu operations: Morenci (72%), Sierrita, Bagdad, Tyrone, Safford, Miami and Chino; Primary Mo: Henderson and Climax; South America amounts include Cu operations: Cerro Verde and El Abra. Sales amounts based on 2017e. Implied life for Americas equals reserves plus mineralized material divided by 2017e sales; Implied life for Indonesia through 2041 CoW. Unit Cost (credit) estimates assume average prices of $2.50/lbfor copper, $1,200/oz for gold and $7/lb for molybdenum in 2017. e = estimate. See Cautionary Statement.
Cu Reserves: 30.4 bn lbs
Mo Reserves: 2.3 bn lbs
Mineralized Mat.: 49 bn lbs
Implied Life: 44 yrs
Copper Sales: 1.5 bn lbs
Molybdenum Sales: 92 mm lbs
2017e Unit Cost: $1.55/lb
Cu Reserves: 26.9 bn lbs
Au Reserves: 25.8 mm ozs
Mineralized Mat.: 19 bn lbs
Implied Life: 24 yrs
Copper Sales: 1.3 bn lbs
Gold Sales: 2.2 mm ozs
2017e Unit Credit: (3¢)/lb
Cu Reserves: 29.5 bn lbs
Mo Reserves: 0.64 bn lbs
Mineralized Mat.: 29 bn lbs
Implied Life: 40 yrs
Copper Sales: 1.3 bn lbs
2017e Unit Cost: $1.61/lb
9
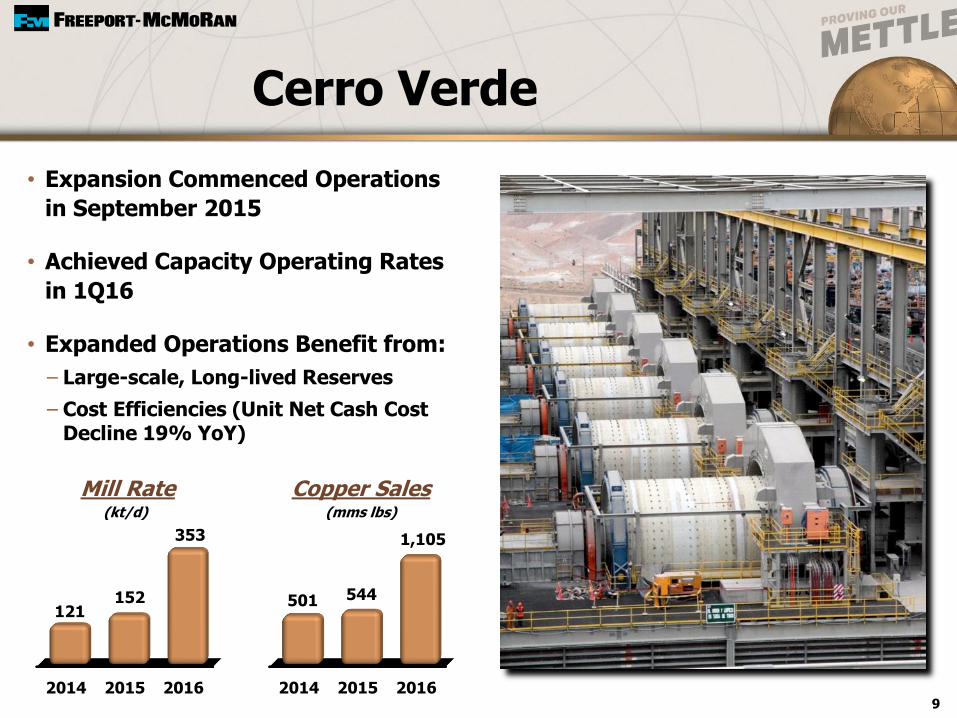
Cerro Verde
• Expansion Commenced Operations
in September 2015
• Achieved Capacity Operating Rates
in 1Q16
• Expanded Operations Benefit from:
− Large-scale, Long-lived Reserves
− Cost Efficiencies (Unit Net Cash Cost Decline 19% YoY)
Mill Rate
2014 2015 2016
Copper Sales
2014 2015 2016
(kt/d) (mms lbs)
152
353 1,105
121544501
10
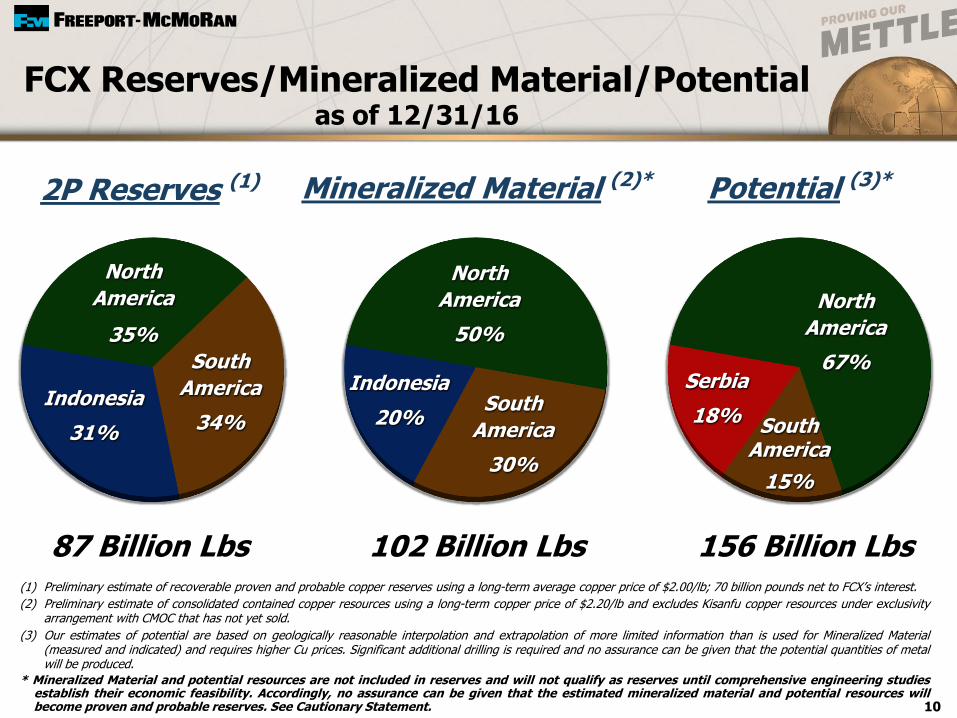
Mineralized Material (2)*
FCX Reserves/Mineralized Material/Potentialas of 12/31/16
2P Reserves (1)
87 Billion Lbs 102 Billion Lbs 156 Billion Lbs
Potential (3)*
South
America
30%
Indonesia
20%
North
America
50%
South
America
34%Indonesia
31%
North
America
35%
South America
15%
Serbia
18%
North
America
67%
(1) Preliminary estimate of recoverable proven and probable copper reserves using a long-term average copper price of $2.00/lb; 70 billion pounds net to FCX’s interest.
(2) Preliminary estimate of consolidated contained copper resources using a long-term copper price of $2.20/lb and excludes Kisanfu copper resources under exclusivityarrangement with CMOC that has not yet sold.
(3) Our estimates of potential are based on geologically reasonable interpolation and extrapolation of more limited information than is used for Mineralized Material(measured and indicated) and requires higher Cu prices. Significant additional drilling is required and no assurance can be given that the potential quantities of metalwill be produced.
* Mineralized Material and potential resources are not included in reserves and will not qualify as reserves until comprehensive engineering studiesestablish their economic feasibility. Accordingly, no assurance can be given that the estimated mineralized material and potential resources willbecome proven and probable reserves. See Cautionary Statement.
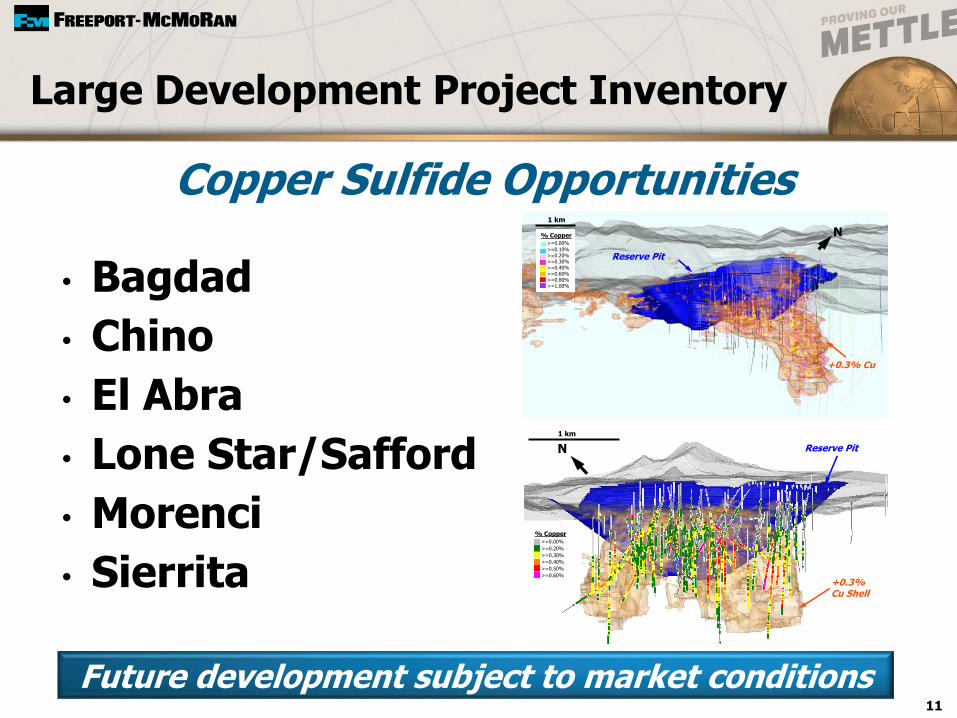
• Bagdad
• Chino
• El Abra
• Lone Star/Safford
• Morenci
• Sierrita
Large Development Project Inventory
11
N
+0.3% Cu
Reserve Pit
1 km
% Copper>=0.00%
>=0.10%>=0.20%>=0.30%>=0.40%>=0.60%>=0.80%>=1.00%
N
+0.3%Cu Shell
Reserve Pit
1 km
% Copper>=0.00%
>=0.20%
>=0.30%
>=0.40%
>=0.50%
>=0.60%
Copper Sulfide Opportunities
Future development subject to market conditions

0.0
1.0
2.0
3.0
1Q16 2Q16 3Q16 4Q16 1Q17e 2Q17e 3Q17e 4Q17e 1Q18e 2Q18e 3Q18e
12
Grasberg Operations Update
Mining Rates (kt/d) Continueto be Impacted by Lower Productivity
Grasberg Open Pit Ore Grades
e = estimate. See Cautionary Statement.
Timing of Open Pit Production from 2017 to 2018
Grasberg Block Cave Start-up Adjusted by 3 Months
Revisions to Deep MLZ Mine Ramp-up Plan
Five-Year Forecast Within 2-3% of Previous Forecast
23%
Below
Target
160122
171
0.0
0.5
1.0
1.5
1Q16 2Q16 3Q16 4Q16 1Q17e 2Q17e 3Q17e 4Q17e 1Q18e 2Q18e 3Q18e
Copper % Gold (g/t)
Revised Plans Incorporate
* Includes 10-day work stoppage in 4Q 2016
3Q16Actual
4Q16Forecast
4Q16Actual*

Indonesia – Historical Dates
FCX Signs COW, Providing Legal & Fiscal Certainty Through 2041, Multi-billion Dollar Investment Campaign Begins
GoI Provides FCX with Letter of Assurance Regarding Legal & Fiscal Certainty
GoI Introduces New Regulations, Requires COW Holders to Convert to IUPK in Order to Export (No Assurance of Legal and Fiscal Certainty)
GoI Passes New Mining Law & Implements New Regulations - Law Provides Existing COWs Valid Until Expiry- Seek Amendments to COW Within One Year - GoI Established Evaluation Team in Early 2012 to Review COWs
13
Concentrate Exports Halted for More than 6-Months Following January Regulation on Exports
FCX & GoI Agree to MOU in July on Six Main Points, Including Exports, Smelter Development & Divestment, Subject to Negotiation of Legal and Fiscal Certainty Post-2021
1995
2009 –2012
2014
2015
2017
1991
FCX Formed Strategic Partnership with Rio Tinto to Advance Development
FCX Completed Construction of Gresik, Indonesia’s First Copper Smelter1999
14
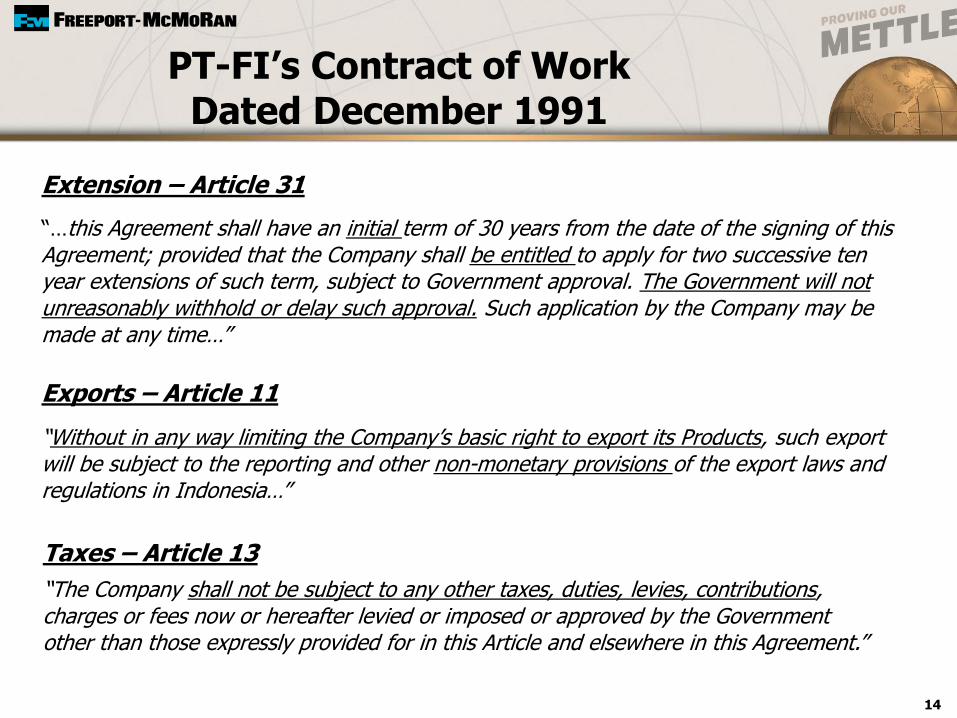
PT-FI’s Contract of WorkDated December 1991
“…this Agreement shall have an initial term of 30 years from the date of the signing of this Agreement; provided that the Company shall be entitled to apply for two successive ten year extensions of such term, subject to Government approval. The Government will not unreasonably withhold or delay such approval. Such application by the Company may be made at any time…”
Extension – Article 31
Exports – Article 11
“Without in any way limiting the Company’s basic right to export its Products, such export will be subject to the reporting and other non-monetary provisions of the export laws and regulations in Indonesia…”
Taxes – Article 13
“The Company shall not be subject to any other taxes, duties, levies, contributions, charges or fees now or hereafter levied or imposed or approved by the Government other than those expressly provided for in this Article and elsewhere in this Agreement.”
15
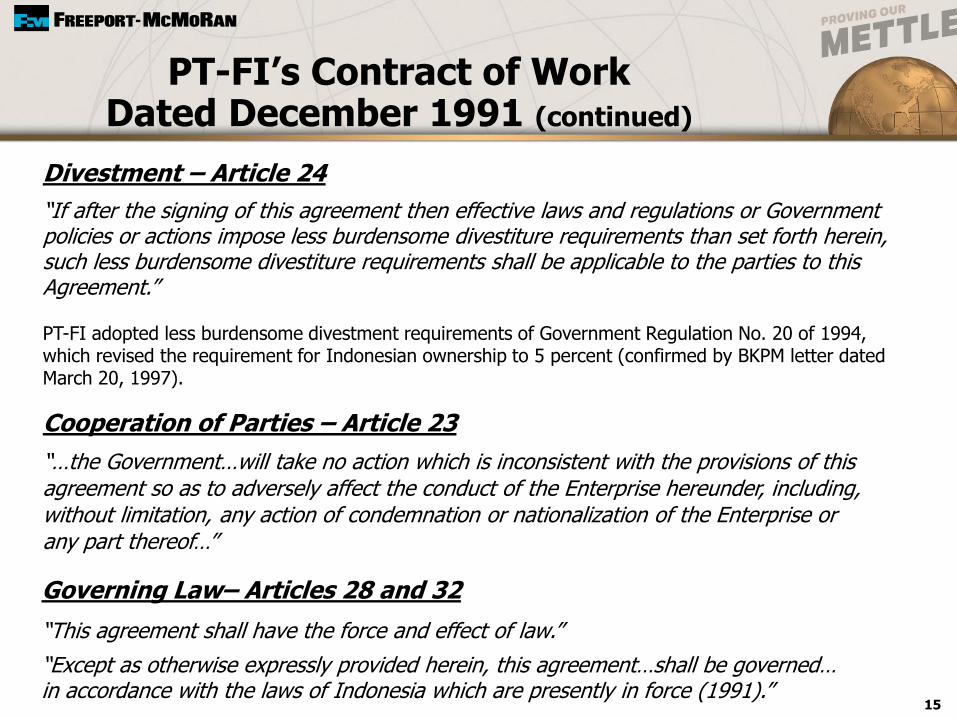
PT-FI’s Contract of Work Dated December 1991 (continued)
Cooperation of Parties – Article 23
“…the Government…will take no action which is inconsistent with the provisions of this agreement so as to adversely affect the conduct of the Enterprise hereunder, including, without limitation, any action of condemnation or nationalization of the Enterprise or any part thereof…”
Divestment – Article 24
“If after the signing of this agreement then effective laws and regulations or Government policies or actions impose less burdensome divestiture requirements than set forth herein, such less burdensome divestiture requirements shall be applicable to the parties to this Agreement.”
PT-FI adopted less burdensome divestment requirements of Government Regulation No. 20 of 1994, which revised the requirement for Indonesian ownership to 5 percent (confirmed by BKPM letter dated March 20, 1997).
“This agreement shall have the force and effect of law.”
Governing Law– Articles 28 and 32
“Except as otherwise expressly provided herein, this agreement…shall be governed… in accordance with the laws of Indonesia which are presently in force (1991).”
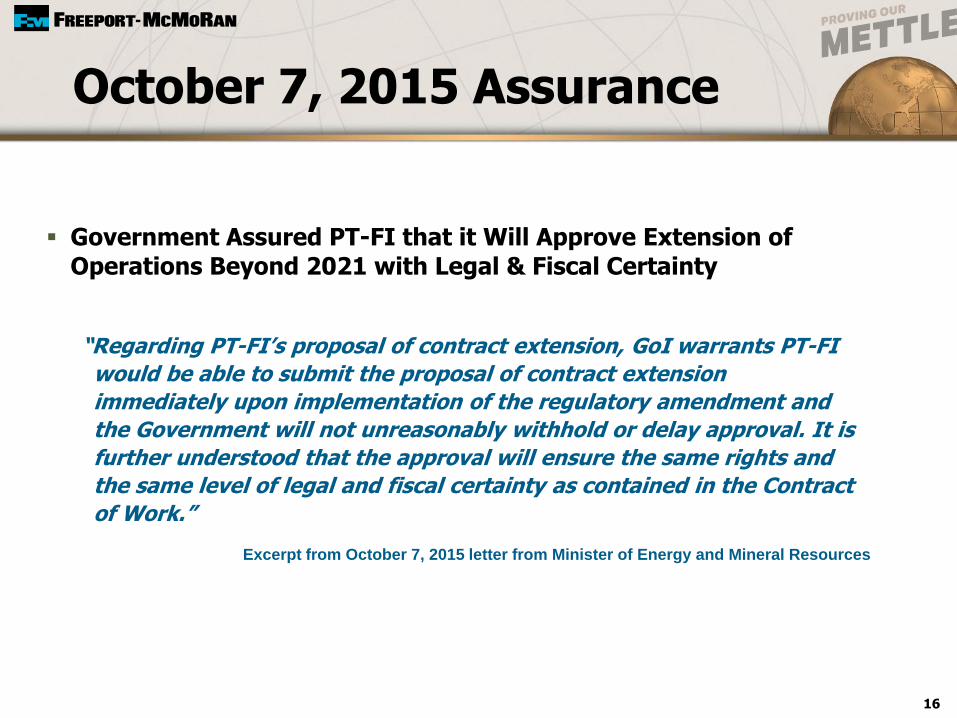
Government Assured PT-FI that it Will Approve Extension of
Operations Beyond 2021 with Legal & Fiscal Certainty
16
October 7, 2015 Assurance
Excerpt from October 7, 2015 letter from Minister of Energy and Mineral Resources
“Regarding PT-FI’s proposal of contract extension, GoI warrants PT-FI
would be able to submit the proposal of contract extension
immediately upon implementation of the regulatory amendment and
the Government will not unreasonably withhold or delay approval. It is
further understood that the approval will ensure the same rights and
the same level of legal and fiscal certainty as contained in the Contract
of Work.”
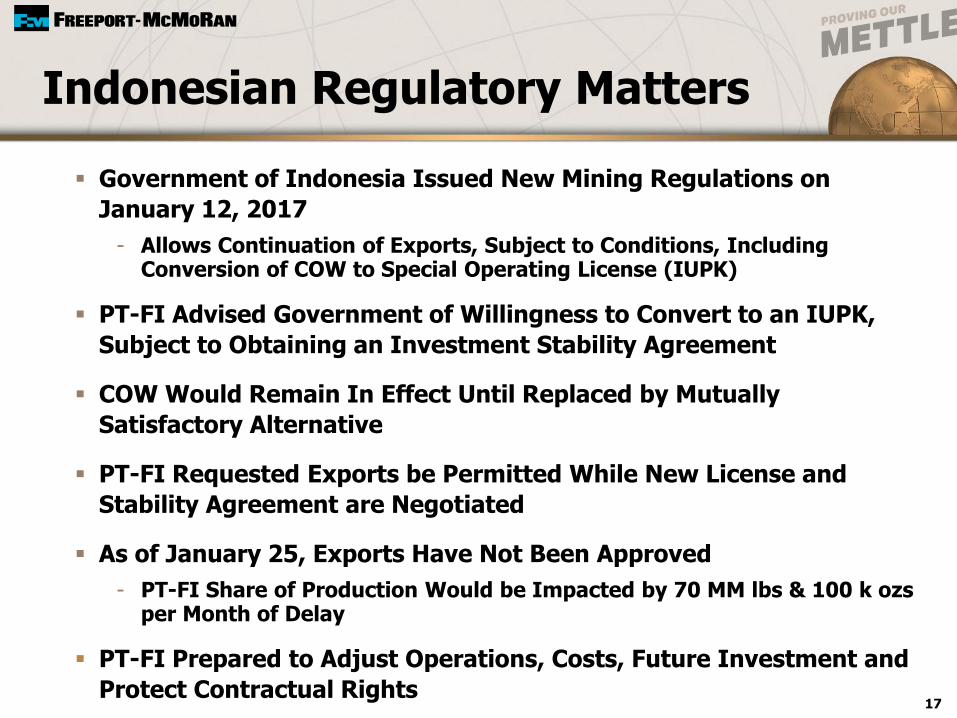
Government of Indonesia Issued New Mining Regulations on
January 12, 2017
- Allows Continuation of Exports, Subject to Conditions, Including Conversion of COW to Special Operating License (IUPK)
PT-FI Advised Government of Willingness to Convert to an IUPK,
Subject to Obtaining an Investment Stability Agreement
COW Would Remain In Effect Until Replaced by Mutually
Satisfactory Alternative
PT-FI Requested Exports be Permitted While New License and
Stability Agreement are Negotiated
As of January 25, Exports Have Not Been Approved
- PT-FI Share of Production Would be Impacted by 70 MM lbs & 100 k ozsper Month of Delay
PT-FI Prepared to Adjust Operations, Costs, Future Investment and
Protect Contractual Rights17
Indonesian Regulatory Matters
18
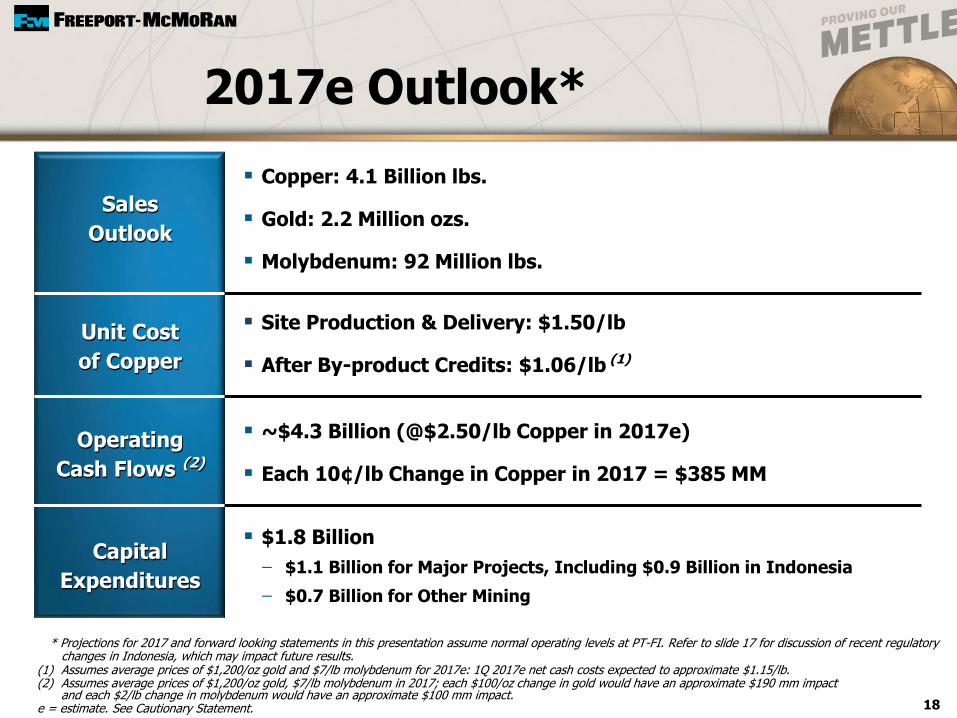
Copper: 4.1 Billion lbs.
Gold: 2.2 Million ozs.
Molybdenum: 92 Million lbs.
Sales
Outlook
Unit Cost
of Copper
Operating
Cash Flows (2)
Capital
Expenditures
Site Production & Delivery: $1.50/lb
After By-product Credits: $1.06/lb (1)
~$4.3 Billion (@$2.50/lb Copper in 2017e)
Each 10¢/lb Change in Copper in 2017 = $385 MM
$1.8 Billion
$1.1 Billion for Major Projects, Including $0.9 Billion in Indonesia
$0.7 Billion for Other Mining
2017e Outlook*
(1) Assumes average prices of $1,200/oz gold and $7/lb molybdenum for 2017e: 1Q 2017e net cash costs expected to approximate $1.15/lb.(2) Assumes average prices of $1,200/oz gold, $7/lb molybdenum in 2017; each $100/oz change in gold would have an approximate $190 mm impact
and each $2/lb change in molybdenum would have an approximate $100 mm impact.e = estimate. See Cautionary Statement.
* Projections for 2017 and forward looking statements in this presentation assume normal operating levels at PT-FI. Refer to slide 17 for discussion of recent regulatory changes in Indonesia, which may impact future results.

0
1
2
3
4
5
2016 2017e 2018e
4.65
4.13.9
Copper Sales (billion lbs)
19
Sales Profile
Note: Consolidated copper sales include 910 mm lbs in 2016, 740 mm lbs in 2017e and 680 mm lbs in 2018e for noncontrolling interest; excludes purchased copper.
* Projections for 2017 and forward looking statements in this presentation assume normal operating levels at PT-FI. Refer to slide 17 for discussion of recent regulatory changes in Indonesia, which may impact future results.
e = estimate. See Cautionary Statement.
Note: Consolidated gold sales include 99k ozs in 2016, 202k ozs in 2017e and 200k ozs in 2018e for noncontrolling interest.
0
1
2
3
2016 2017e 2018e
1.1
2.2 2.15
0
30
60
90
2016 2017e 2018e
7492 91
Gold Sales (million ozs)
Molybdenum Sales (million lbs)
Copper Sales (billion lbs)
*
*
4.17
Net of Volumes
Sold in
Tenke/Morenci
Transactions
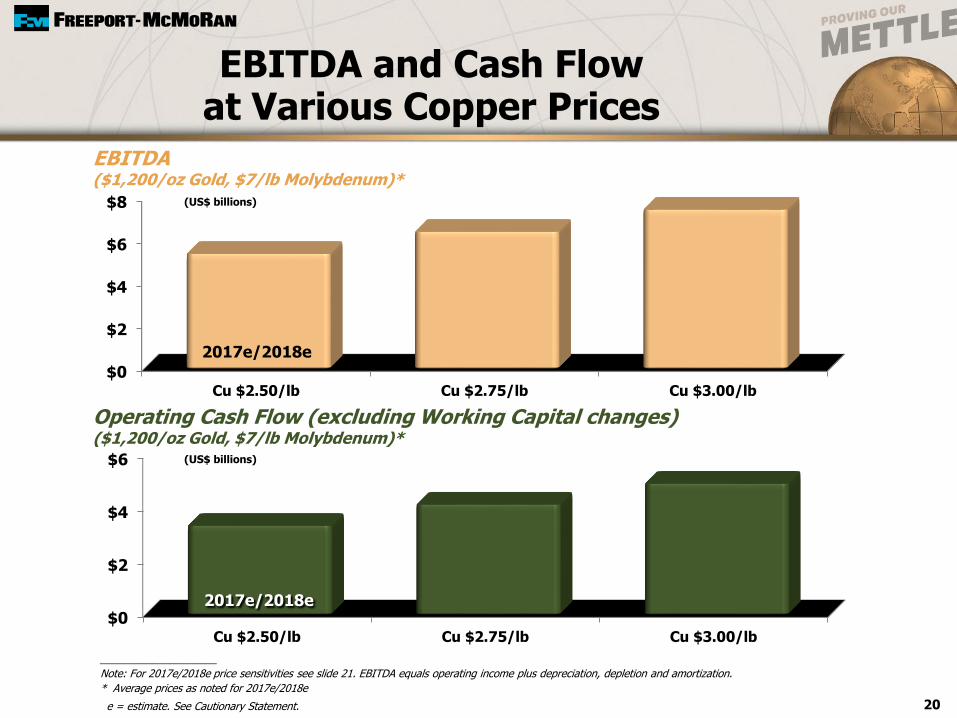
$0
$2
$4
$6
$8
Cu $2.50/lb Cu $2.75/lb Cu $3.00/lb
$0
$2
$4
$6
Cu $2.50/lb Cu $2.75/lb Cu $3.00/lb
20
EBITDA and Cash Flow at Various Copper Prices
EBITDA ($1,200/oz Gold, $7/lb Molybdenum)*
Operating Cash Flow (excluding Working Capital changes)($1,200/oz Gold, $7/lb Molybdenum)*
(US$ billions)
(US$ billions)
____________________
Note: For 2017e/2018e price sensitivities see slide 21. EBITDA equals operating income plus depreciation, depletion and amortization.
* Average prices as noted for 2017e/2018e
e = estimate. See Cautionary Statement.
2017e/2018e
2017e/2018e
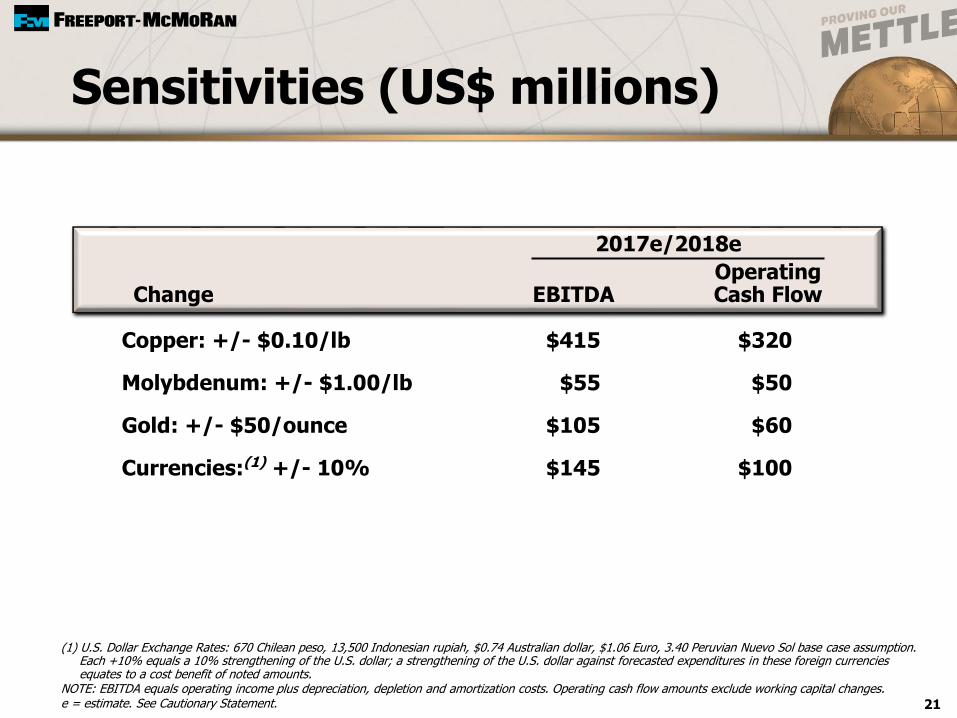
OperatingChange EBITDA Cash Flow
Sensitivities (US$ millions)
(1) U.S. Dollar Exchange Rates: 670 Chilean peso, 13,500 Indonesian rupiah, $0.74 Australian dollar, $1.06 Euro, 3.40 Peruvian Nuevo Sol base case assumption. Each +10% equals a 10% strengthening of the U.S. dollar; a strengthening of the U.S. dollar against forecasted expenditures in these foreign currencies equates to a cost benefit of noted amounts.
NOTE: EBITDA equals operating income plus depreciation, depletion and amortization costs. Operating cash flow amounts exclude working capital changes.e = estimate. See Cautionary Statement.
2017e/2018e
21
Copper: +/- $0.10/lb $415 $320
Molybdenum: +/- $1.00/lb $55 $50
Gold: +/- $50/ounce $105 $60
Currencies:(1) +/- 10% $145 $100

2016 2017e 2018e
22
Capital Expenditures(US$ billions)
Note: Includes capitalized interest.
e= estimate. See Cautionary Statement.
Other Mining
Oil & Gas
1.2
0.4
MajorMining
Projects
1.2
1.1*
0.7
$2.8
0.9
0.9*
$1.8
1.6
TOTALMINING
Future Spending Dependent on Improvement in Market Conditions
$1.8
* Major mining projects include $0.9 billion associated with Grasberg Underground development in 2017e and $0.75 billion for 2018e
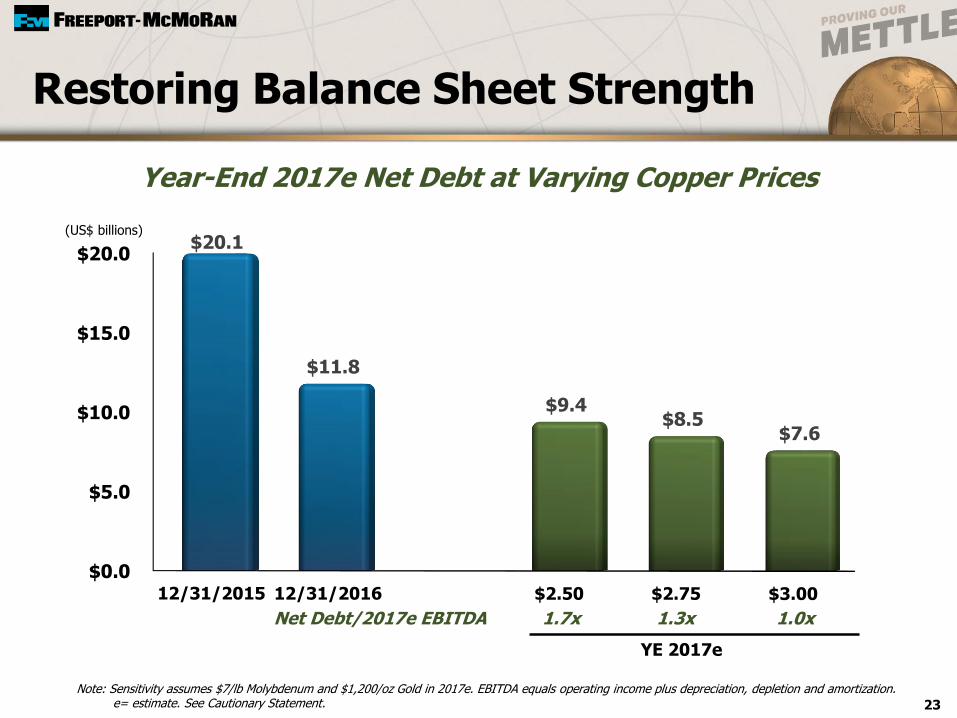
Restoring Balance Sheet Strength
Year-End 2017e Net Debt at Varying Copper Prices
YE 2017e
(US$ billions)
Note: Sensitivity assumes $7/lb Molybdenum and $1,200/oz Gold in 2017e. EBITDA equals operating income plus depreciation, depletion and amortization. e= estimate. See Cautionary Statement. 23
$0.0
$5.0
$10.0
$15.0
$20.0
12/31/2015 12/31/2016 $2.50 $2.75 $3.00
$20.1
$11.8
$9.4$8.5
$7.6
Net Debt/2017e EBITDA 1.7x 1.3x 1.0x
$0
$1
$2
$3
$4
$5
2017 2018
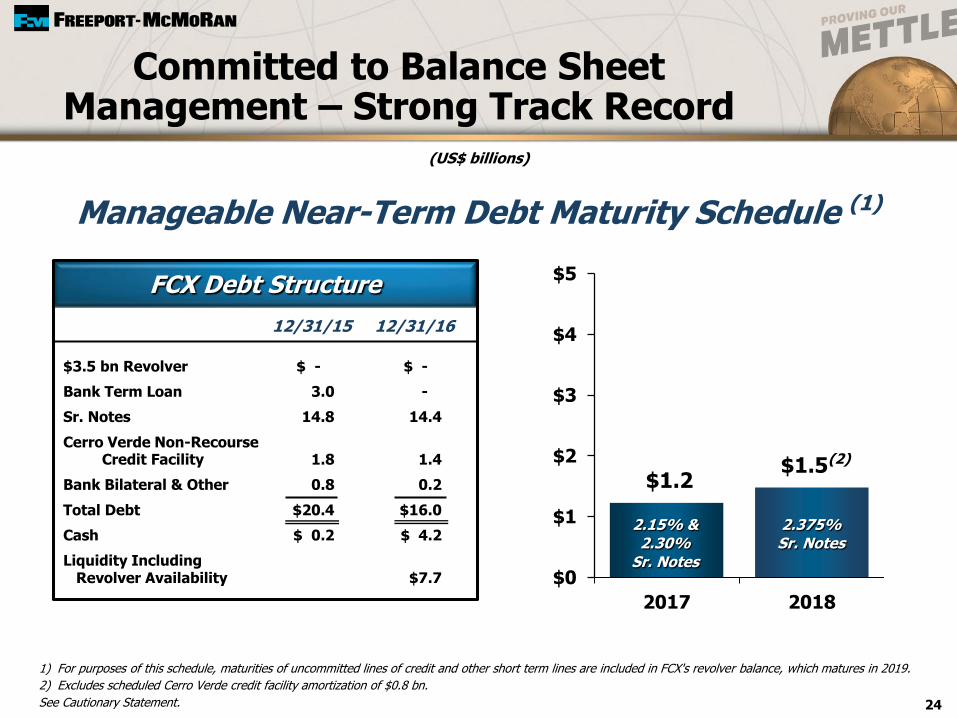
Committed to Balance Sheet Management – Strong Track Record
$1.2
(US$ billions)
$1.5(2)
2.15% & 2.30%
Sr. Notes
1) For purposes of this schedule, maturities of uncommitted lines of credit and other short term lines are included in FCX's revolver balance, which matures in 2019.
2) Excludes scheduled Cerro Verde credit facility amortization of $0.8 bn.
See Cautionary Statement. 24
Manageable Near-Term Debt Maturity Schedule (1)
FCX Debt Structure
$3.5 bn Revolver $ - $ -
Bank Term Loan 3.0 -
Sr. Notes 14.8 14.4
Cerro Verde Non-RecourseCredit Facility 1.8 1.4
Bank Bilateral & Other 0.8 0.2
Total Debt $20.4 $16.0
Cash $ 0.2 $ 4.2
Liquidity Including Revolver Availability $7.7
12/31/15 12/31/16
2.375%Sr. Notes
25
Positive Long-term Outlook
Experienced Team
of Operators &
Developers
Long-lived,
Geographically
Diverse Portfolio
Industry Leading
Copper Position
Executing Clearly Defined Strategy
Financially
Strong

Reference
Slides
27
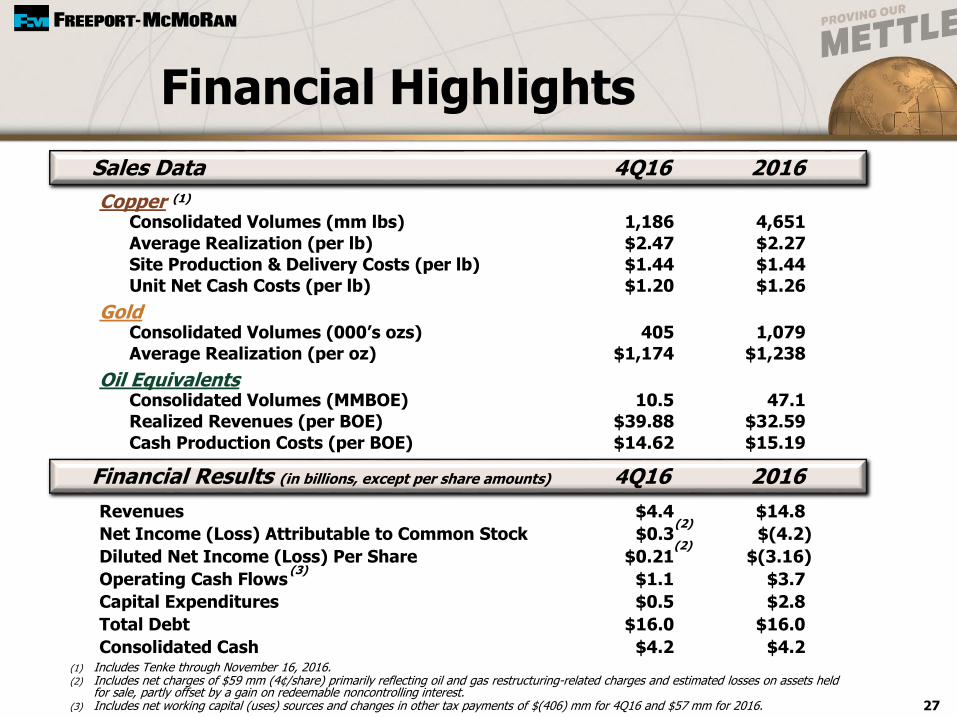
Financial Highlights
CopperConsolidated Volumes (mm lbs) 1,186 4,651
Average Realization (per lb) $2.47 $2.27
Site Production & Delivery Costs (per lb) $1.44 $1.44
Unit Net Cash Costs (per lb) $1.20 $1.26
GoldConsolidated Volumes (000’s ozs) 405 1,079
Average Realization (per oz) $1,174 $1,238
Oil Equivalents Consolidated Volumes (MMBOE) 10.5 47.1
Realized Revenues (per BOE) $39.88 $32.59
Cash Production Costs (per BOE) $14.62 $15.19
Sales Data 4Q16 2016
Financial Results (in billions, except per share amounts) 4Q16 2016
(1) Includes Tenke through November 16, 2016. (2) Includes net charges of $59 mm (4¢/share) primarily reflecting oil and gas restructuring-related charges and estimated losses on assets held
for sale, partly offset by a gain on redeemable noncontrolling interest.(3) Includes net working capital (uses) sources and changes in other tax payments of $(406) mm for 4Q16 and $57 mm for 2016.
Revenues $4.4 $14.8
Net Income (Loss) Attributable to Common Stock $0.3 $(4.2)
Diluted Net Income (Loss) Per Share $0.21 $(3.16)
Operating Cash Flows $1.1 $3.7
Capital Expenditures $0.5 $2.8
Total Debt $16.0 $16.0
Consolidated Cash $4.2 $4.2
(2)
(2)
(3)
(1)
28
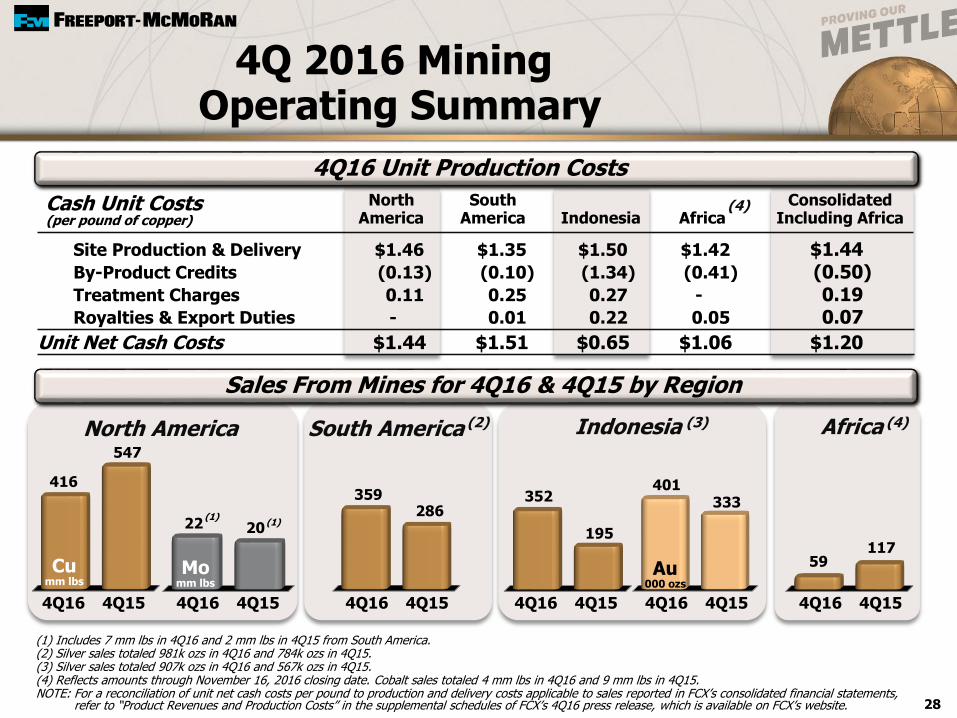
4Q 2016 MiningOperating Summary
(1) Includes 7 mm lbs in 4Q16 and 2 mm lbs in 4Q15 from South America.(2) Silver sales totaled 981k ozs in 4Q16 and 784k ozs in 4Q15.(3) Silver sales totaled 907k ozs in 4Q16 and 567k ozs in 4Q15.(4) Reflects amounts through November 16, 2016 closing date. Cobalt sales totaled 4 mm lbs in 4Q16 and 9 mm lbs in 4Q15.NOTE: For a reconciliation of unit net cash costs per pound to production and delivery costs applicable to sales reported in FCX’s consolidated financial statements,
refer to “Product Revenues and Production Costs” in the supplemental schedules of FCX’s 4Q16 press release, which is available on FCX’s website.
(per pound of copper)
North South ConsolidatedAmerica America Indonesia Africa Including Africa
Site Production & Delivery $1.46 $1.35 $1.50 $1.42 $1.44By-Product Credits (0.13) (0.10) (1.34) (0.41) (0.50)Treatment Charges 0.11 0.25 0.27 - 0.19Royalties & Export Duties - 0.01 0.22 0.05 0.07
Unit Net Cash Costs $1.44 $1.51 $0.65 $1.06 $1.20
Cash Unit Costs
North America South America Indonesia(2) (3) Africa (4)
547
416
4Q16 4Q15
2022 (1)(1)
Momm lbs
4Q16 4Q154Q16 4Q15
Cumm lbs
195
352
4Q16 4Q15
333401
4Q16 4Q15
Au000 ozs
11759
4Q16 4Q15
359286
4Q16 Unit Production Costs
Sales From Mines for 4Q16 & 4Q15 by Region
(4)
1,841
74(2)
1,332
1,054
1.1424
33
29
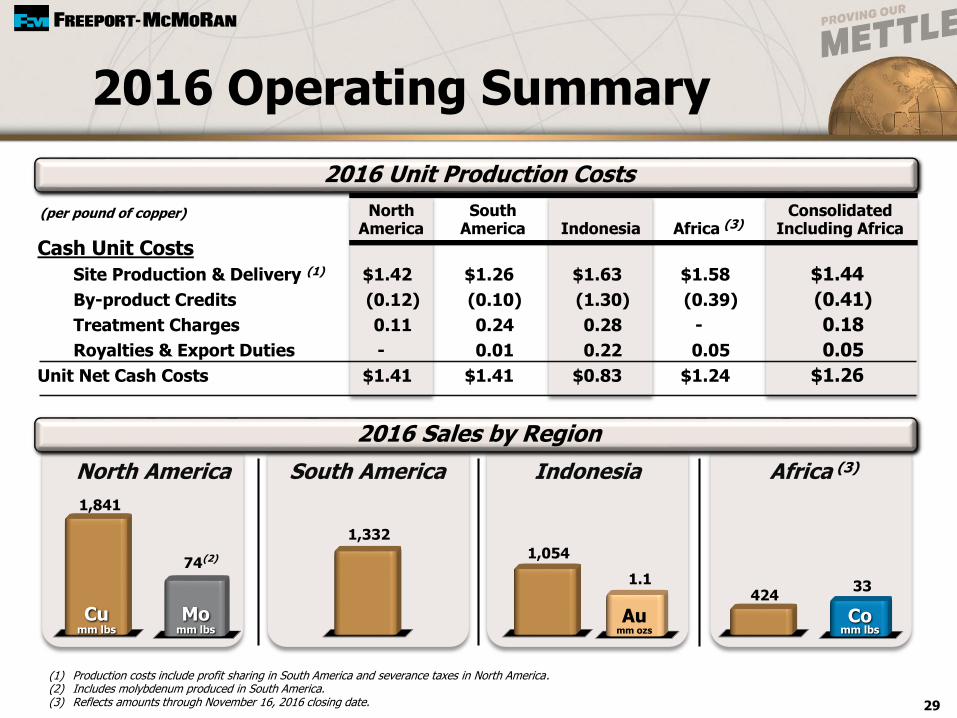
2016 Operating Summary
(1) Production costs include profit sharing in South America and severance taxes in North America.(2) Includes molybdenum produced in South America.(3) Reflects amounts through November 16, 2016 closing date.
Momm lbs
North America South America Indonesia Africa (3)
(per pound of copper) North South ConsolidatedAmerica America Indonesia Africa (3) Including Africa
Cash Unit Costs
Site Production & Delivery (1) $1.42 $1.26 $1.63 $1.58 $1.44
By-product Credits (0.12) (0.10) (1.30) (0.39) (0.41)
Treatment Charges 0.11 0.24 0.28 - 0.18
Royalties & Export Duties - 0.01 0.22 0.05 0.05
Unit Net Cash Costs $1.41 $1.41 $0.83 $1.24 $1.26
2016 Sales by Region
2016 Unit Production Costs
Cumm lbs
Aumm ozs
Comm lbs
1,315
South America
1,465
92(3)
Momm lbs
Cumm lbs
1,3252.2(4)
Indonesia
Aumm ozs
30
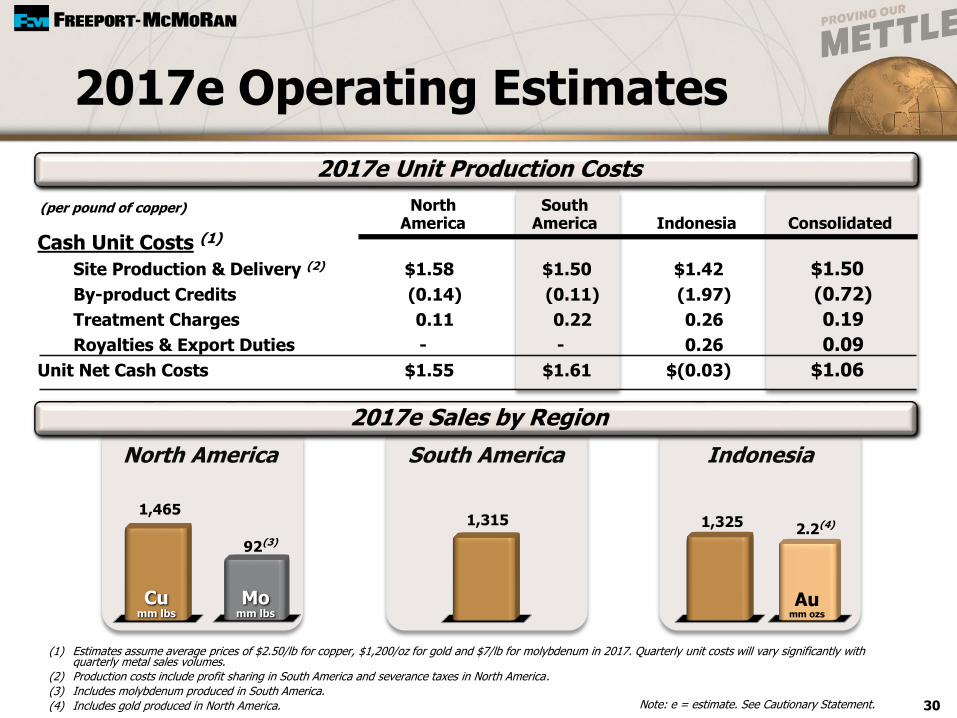
2017e Operating Estimates
(1) Estimates assume average prices of $2.50/lb for copper, $1,200/oz for gold and $7/lb for molybdenum in 2017. Quarterly unit costs will vary significantly with quarterly metal sales volumes.
(2) Production costs include profit sharing in South America and severance taxes in North America.
(3) Includes molybdenum produced in South America.
(4) Includes gold produced in North America.
North America
(per pound of copper) North SouthAmerica America Indonesia Consolidated
Cash Unit Costs (1)
Site Production & Delivery (2) $1.58 $1.50 $1.42 $1.50
By-product Credits (0.14) (0.11) (1.97) (0.72)
Treatment Charges 0.11 0.22 0.26 0.19
Royalties & Export Duties - - 0.26 0.09
Unit Net Cash Costs $1.55 $1.61 $(0.03) $1.06
2017e Sales by Region
2017e Unit Production Costs
Note: e = estimate. See Cautionary Statement.

0
300
600
900
1,200
1Q17e 2Q17e 3Q17e 4Q17e
1,000 1,030 1,055 1,020
31
2017e Quarterly Sales
0
250
500
750
1Q17e 2Q17e 3Q17e 4Q17e
460 470 480
760
Gold Sales (thousand ozs)
0
5
10
15
20
25
1Q17e 2Q17e 3Q17e 4Q17e
23 23 23 23
Molybdenum Sales (million lbs)
Note: Consolidated gold sales include approximately 43k ozs in 1Q17e, 44k ozsin 2Q17e, 45k ozs in 3Q17e and 70k ozs in 4Q17e for noncontrolling interest.
e = estimate. See Cautionary Statement.
Note: Consolidated copper sales include approximately 185 mm lbs in 1Q17e, 185 mm lbs in 2Q17e, 195 mm lbs in 3Q17e and 175 mm lbs in 4Q17e for noncontrolling interest; excludes purchased copper.
Copper Sales (million lbs)

Copper Molybdenum Gold
billion lbs billion lbs million ozs
Reserves @ 12/31/15 99.5 3.05 27.1
Divestitures* (8.6) (0.02) --
Additions/revisions 0.5 -- 0.1
Production (4.6) (0.08) (1.1)
Net change (12.7) (0.10) (1.0)
Reserves @ 12/31/16 86.8 2.95 26.1
Reserves @ 12/31/06 93.6 1.95 42.5
Divestitures** (12.3) (0.02) (1.0)
Additions/revisions 45.5 1.82 (0.1)
Production (40.0) (0.80) (15.3)
Net change (6.8) 1.00 (16.4)
Reserves @ 12/31/16 86.8 2.95 26.1
% of production*** 114% 228% -1%
* 13% undivided interest in Morenci and Tenke Fungurume in 2016
** sale of Candelaria/Ojos (in 2014), 13% undivided interest in Morenci & Tenke
*** Additions/revisions as % of production
32
Preliminary Reserves at 12/31/16Consolidated Proven & Probable Reserves
12/31/16Copper Reserves
by Geographical Region
NorthAmerica
Indonesia31%
35%South
America34%
(1)
(1)
(1) Long-term prices of $2/lb copper, $10/lb molybdenum, and $1,000/oz gold(2) Long-term prices of ~$1/lb copper, $5/lb molybdenum, and $400/oz gold; reserves as of 12/31/06 are pro forma
(2)
(1)

Plan View
DOZ
DMLZ
Grasberg &Kucing Liar
BigGossan
N
N
DOZ
DMLZ
GrasbergBlock Cave
KucingLiar
Grasbergopen pit
MLA
Common Infrastructure2,500 m elev
GrasbergBC Spur
Kucing Liar Spur
Big Gossan Spur
DMLZ Spur
Portals(at Ridge Camp)
BigGossan
Amole2,900 m elev
N
33
Grasberg Minerals District
e = estimate. See Cautionary Statement.
GrasbergDMLZ Block Cave
Tonnes (mm) 439 964
Copper Grade (%) 0.9 1.03
Gold Grade (g/t) 0.75 0.78
Copper (bn lbs) 7.6 18.5
Gold (mm ozs) 8.4 15.7
Start-up Year 2015 2018
Target (K t/d) 80 140-160
Ramp-up (years) 6 6
* 100% Basis
NOTE: Ore grades in ramp-up of underground mines expected to be higher than life-of-mine average
Reserves*
(as of December 31, 2016)
34
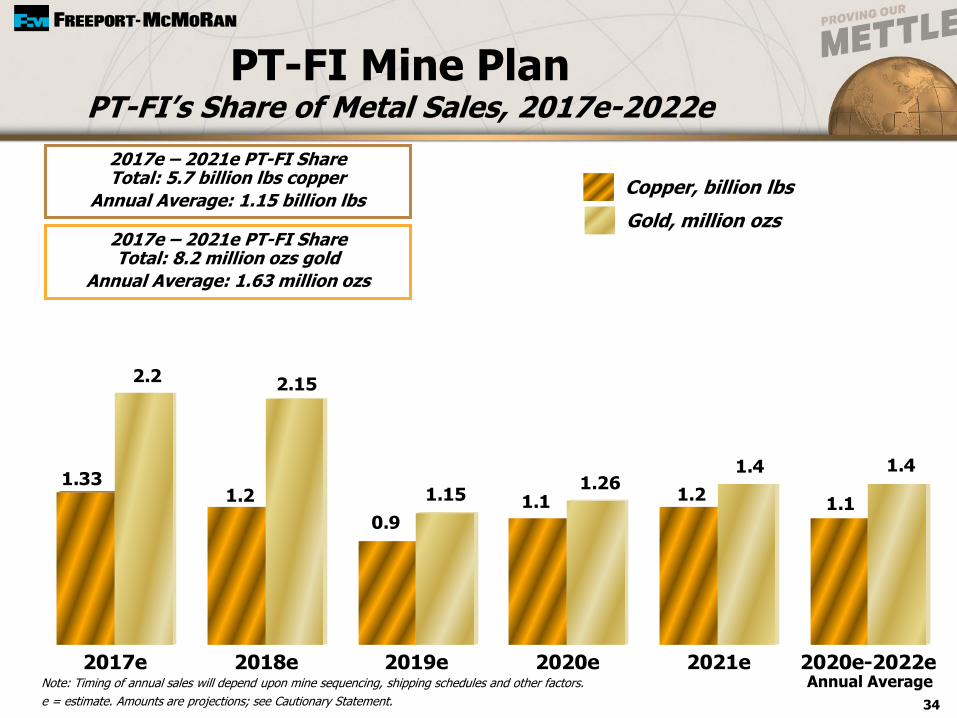
PT-FI Mine Plan PT-FI’s Share of Metal Sales, 2017e-2022e
1.33
2.2
1.2
2.15
0.9
1.15 1.11.26
1.2
1.4
1.1
1.4
2017e 2018e 2019e 2020e 2021e 2020e-2022e
Copper, billion lbs
Gold, million ozs
2017e – 2021e PT-FI ShareTotal: 5.7 billion lbs copper
Annual Average: 1.15 billion lbs
2017e – 2021e PT-FI ShareTotal: 8.2 million ozs gold
Annual Average: 1.63 million ozs
Note: Timing of annual sales will depend upon mine sequencing, shipping schedules and other factors.
e = estimate. Amounts are projections; see Cautionary Statement.
Annual Average
$0
$2
$4
$6
$8
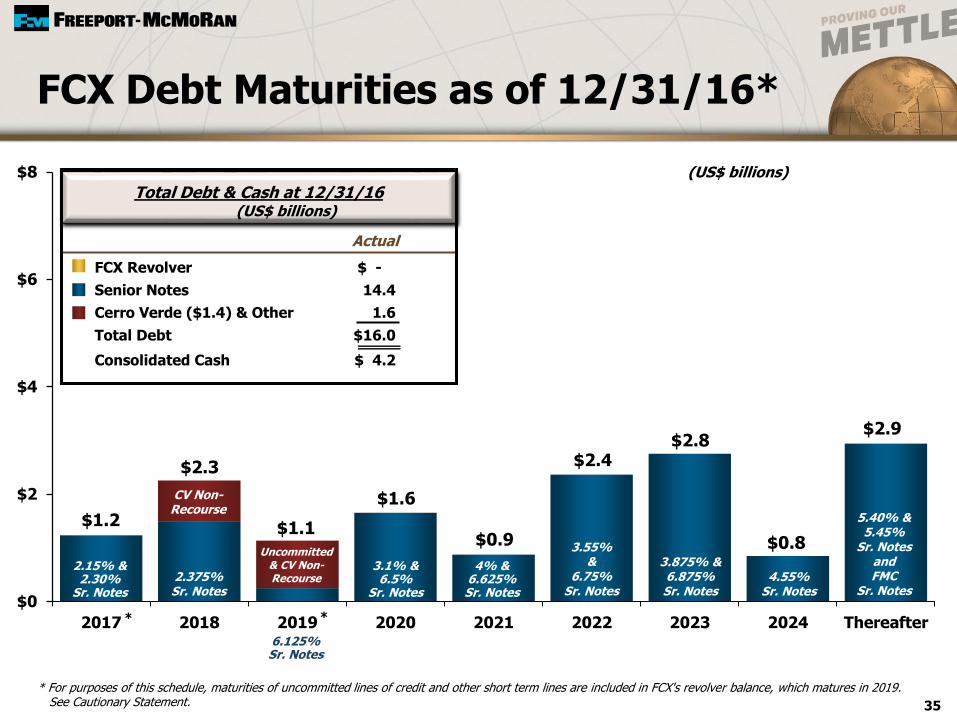
2017 2018 2019 2020 2021 2022 2023 2024 Thereafter
FCX Debt Maturities as of 12/31/16*
$2.3
$1.1
(US$ billions)
$0.9
$2.9
5.40% & 5.45%
Sr. Notes andFMC
Sr. Notes
$1.2
$1.6
$2.4
6.125% Sr. Notes
* For purposes of this schedule, maturities of uncommitted lines of credit and other short term lines are included in FCX's revolver balance, which matures in 2019.See Cautionary Statement.
* *
Uncommitted & CV Non-Recourse
35
$2.8
3.875% &6.875%Sr. Notes
3.55% &
6.75%Sr. Notes
4% & 6.625% Sr. Notes
3.1% &6.5%
Sr. Notes
2.375%Sr. Notes
2.15% & 2.30%
Sr. Notes
CV Non-Recourse
Total Debt & Cash at 12/31/16
FCX Revolver $ -
Senior Notes 14.4
Cerro Verde ($1.4) & Other 1.6
Total Debt $16.0
Consolidated Cash $ 4.2
Actual
(US$ billions)
$0.8
4.55% Sr. Notes
36
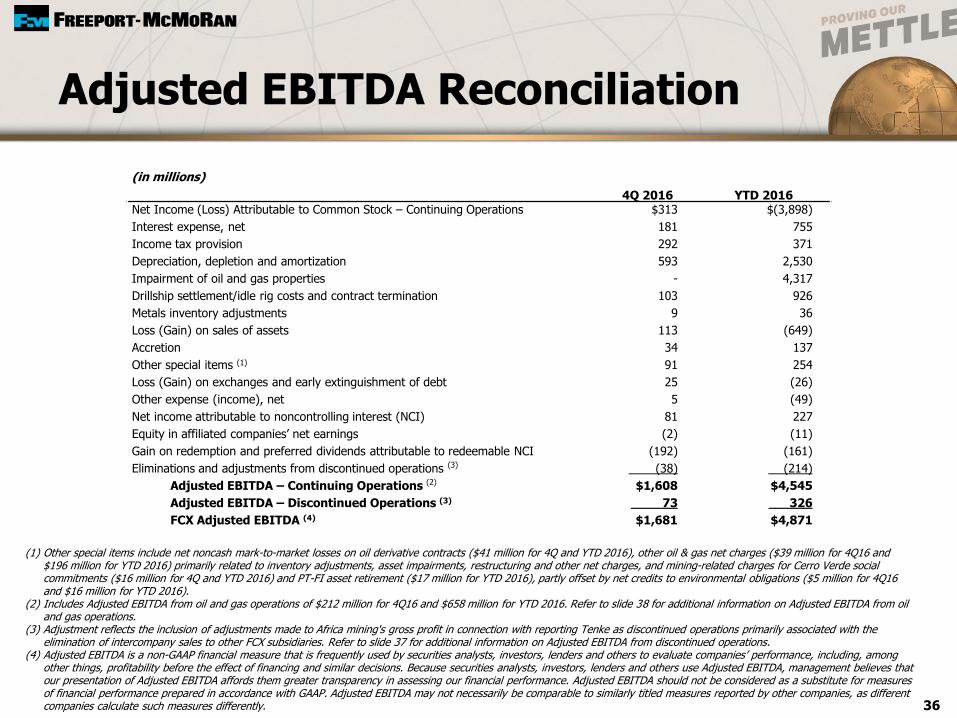
Adjusted EBITDA Reconciliation
(in millions)
4Q 2016 YTD 2016Net Income (Loss) Attributable to Common Stock – Continuing Operations $313 $(3,898)
Interest expense, net 181 755
Income tax provision 292 371
Depreciation, depletion and amortization 593 2,530
Impairment of oil and gas properties - 4,317
Drillship settlement/idle rig costs and contract termination 103 926
Metals inventory adjustments 9 36
Loss (Gain) on sales of assets 113 (649)
Accretion 34 137
Other special items (1) 91 254
Loss (Gain) on exchanges and early extinguishment of debt 25 (26)
Other expense (income), net 5 (49)
Net income attributable to noncontrolling interest (NCI) 81 227
Equity in affiliated companies’ net earnings (2) (11)
Gain on redemption and preferred dividends attributable to redeemable NCI (192) (161)
Eliminations and adjustments from discontinued operations (3) (38) (214)
Adjusted EBITDA – Continuing Operations (2) $1,608 $4,545
Adjusted EBITDA – Discontinued Operations (3) 73 326
FCX Adjusted EBITDA (4) $1,681 $4,871
(1) Other special items include net noncash mark-to-market losses on oil derivative contracts ($41 million for 4Q and YTD 2016), other oil & gas net charges ($39 million for 4Q16 and $196 million for YTD 2016) primarily related to inventory adjustments, asset impairments, restructuring and other net charges, and mining-related charges for Cerro Verde social commitments ($16 million for 4Q and YTD 2016) and PT-FI asset retirement ($17 million for YTD 2016), partly offset by net credits to environmental obligations ($5 million for 4Q16 and $16 million for YTD 2016).
(2) Includes Adjusted EBITDA from oil and gas operations of $212 million for 4Q16 and $658 million for YTD 2016. Refer to slide 38 for additional information on Adjusted EBITDA from oil and gas operations.
(3) Adjustment reflects the inclusion of adjustments made to Africa mining's gross profit in connection with reporting Tenke as discontinued operations primarily associated with the elimination of intercompany sales to other FCX subsidiaries. Refer to slide 37 for additional information on Adjusted EBITDA from discontinued operations.
(4) Adjusted EBITDA is a non-GAAP financial measure that is frequently used by securities analysts, investors, lenders and others to evaluate companies’ performance, including, among other things, profitability before the effect of financing and similar decisions. Because securities analysts, investors, lenders and others use Adjusted EBITDA, management believes that our presentation of Adjusted EBITDA affords them greater transparency in assessing our financial performance. Adjusted EBITDA should not be considered as a substitute for measures of financial performance prepared in accordance with GAAP. Adjusted EBITDA may not necessarily be comparable to similarly titled measures reported by other companies, as different companies calculate such measures differently.
37
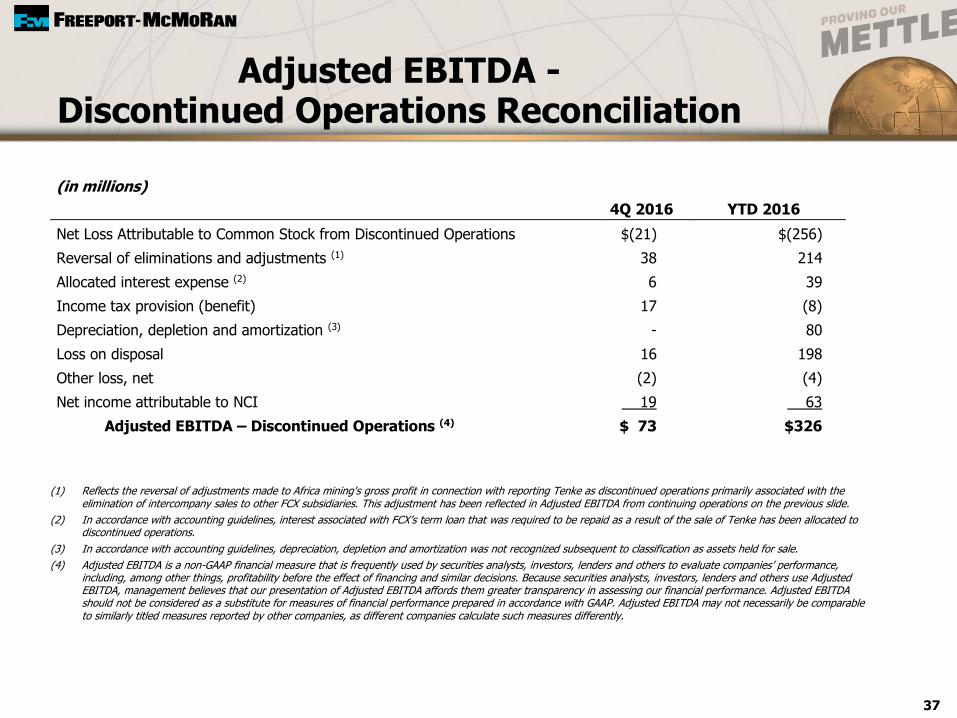
Adjusted EBITDA -Discontinued Operations Reconciliation
(in millions)
4Q 2016 YTD 2016
Net Loss Attributable to Common Stock from Discontinued Operations $(21) $(256)
Reversal of eliminations and adjustments (1) 38 214
Allocated interest expense (2) 6 39
Income tax provision (benefit) 17 (8)
Depreciation, depletion and amortization (3) - 80
Loss on disposal 16 198
Other loss, net (2) (4)
Net income attributable to NCI 19 63
Adjusted EBITDA – Discontinued Operations (4) $ 73 $326
(1) Reflects the reversal of adjustments made to Africa mining's gross profit in connection with reporting Tenke as discontinued operations primarily associated with the elimination of intercompany sales to other FCX subsidiaries. This adjustment has been reflected in Adjusted EBITDA from continuing operations on the previous slide.
(2) In accordance with accounting guidelines, interest associated with FCX’s term loan that was required to be repaid as a result of the sale of Tenke has been allocated to discontinued operations.
(3) In accordance with accounting guidelines, depreciation, depletion and amortization was not recognized subsequent to classification as assets held for sale.
(4) Adjusted EBITDA is a non-GAAP financial measure that is frequently used by securities analysts, investors, lenders and others to evaluate companies’ performance, including, among other things, profitability before the effect of financing and similar decisions. Because securities analysts, investors, lenders and others use Adjusted EBITDA, management believes that our presentation of Adjusted EBITDA affords them greater transparency in assessing our financial performance. Adjusted EBITDA should not be considered as a substitute for measures of financial performance prepared in accordance with GAAP. Adjusted EBITDA may not necessarily be comparable to similarly titled measures reported by other companies, as different companies calculate such measures differently.
38
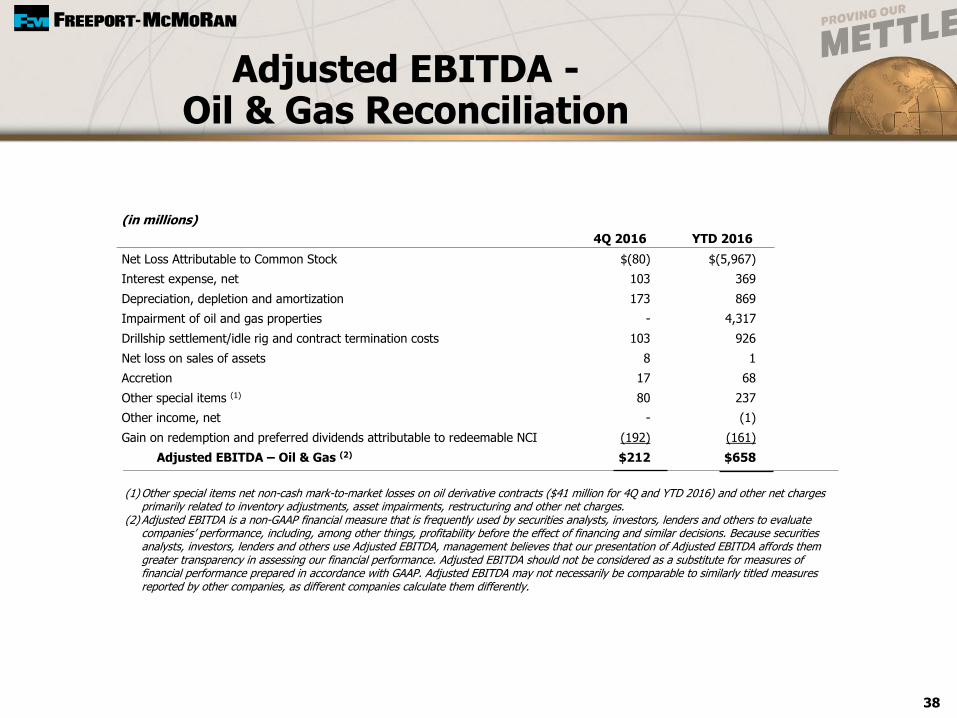
Adjusted EBITDA -Oil & Gas Reconciliation
(in millions)
4Q 2016 YTD 2016
Net Loss Attributable to Common Stock $(80) $(5,967)
Interest expense, net 103 369
Depreciation, depletion and amortization 173 869
Impairment of oil and gas properties - 4,317
Drillship settlement/idle rig and contract termination costs 103 926
Net loss on sales of assets 8 1
Accretion 17 68
Other special items (1) 80 237
Other income, net - (1)
Gain on redemption and preferred dividends attributable to redeemable NCI (192) (161)
Adjusted EBITDA – Oil & Gas (2) $212 $658
(1) Other special items net non-cash mark-to-market losses on oil derivative contracts ($41 million for 4Q and YTD 2016) and other net charges primarily related to inventory adjustments, asset impairments, restructuring and other net charges.
(2) Adjusted EBITDA is a non-GAAP financial measure that is frequently used by securities analysts, investors, lenders and others to evaluate companies’ performance, including, among other things, profitability before the effect of financing and similar decisions. Because securities analysts, investors, lenders and others use Adjusted EBITDA, management believes that our presentation of Adjusted EBITDA affords them greater transparency in assessing our financial performance. Adjusted EBITDA should not be considered as a substitute for measures of financial performance prepared in accordance with GAAP. Adjusted EBITDA may not necessarily be comparable to similarly titled measures reported by other companies, as different companies calculate them differently.