Embed Size (px)
Citation preview

Corporate PresentationJanuary 11, 2017

This presentation contains forward-looking statements within the meaning of the UnitedStates Private Securities Litigation Reform Act of 1995 and forward-looking information withinthe meaning of the Securities Act (Ontario) (together, "forward-looking statements"). Suchforward-looking statements may include but are not limited to the Company's plans forproduction at its Guanajuato and Topia Mines in Mexico, exploring its other properties inMexico, the overall economic potential of its properties, the availability of adequate financingand involve known and unknown risks, uncertainties and other factors which may cause theactual results, performance or achievements expressed or implied by such forward-lookingstatements to be materially different. Such factors include, among others, risks anduncertainties relating to potential political risks involving the Company's operations in aforeign jurisdiction, uncertainty of production and cost estimates and the potential forunexpected costs and expenses, physical risks inherent in mining operations, currencyfluctuations, fluctuations in the price of silver, gold and base metals, completion of economicevaluations, changes in project parameters as plans continue to be refined, the inability orfailure to obtain adequate financing on a timely basis, and other risks and uncertainties,including those described in the Company's Annual Information Form for the year endedDecember 31, 2015 and Material Change Reports filed with the Canadian SecuritiesAdministrators available at www.sedar.com, and reports on Form 40-F and Form 6-K filed withthe Securities and Exchange Commission and available at www.sec.gov.
Statements concerning mineral reserve and resource estimates may also be deemed toconstitute forward-looking statements to the extent that they involve estimates of themineralization that will be encountered if the property is developed. Any statements thatexpress or involve discussions with respect to predictions, expectations, beliefs, plans,projections, objectives, assumptions or future events or performance (often, but not always,using words or phrases such as “expects”, “anticipates”, “plans”, “projects”, “estimates”,“assumes”, “intends”, “strategy”, “goals”, “objectives”, “potential” or variations thereof, orstating that certain actions, events or results “may”, “could”, “would”, “might” or “will” betaken, occur or be achieved, or the negative of any of these terms and similar expressions) arenot statements of historical fact and may be forward-looking statements.
Robert Brown, P. Eng. is the Qualified Person under NI 43-101 for the projects discussed in thispresentation.
2
DISCLAIMER

3
The terms "Measured resource", "Indicated resource" and "Inferred resource" used in thisdocument are Canadian mining terms as defined in National Instrument 43-101 Standards ofDisclosure for Mineral Projects (“NI 43-101”) and CIM Standards on Mineral Resources andMineral Reserves. Mineral resources that are not mineral reserves have not beendemonstrated to be economically and legally extractable. Mineral resource estimates do notaccount for mineability, selectivity, mining loss and dilution. It should not be assumed that allor any part of a resource will ever be converted to a reserve. The mineral resource estimatespresented herein include Inferred mineral resources that are normally considered toospeculative geologically to have economic considerations applied to them that would enablethem to be categorized as mineral reserves. There is also no certainty that these Inferredresources will be converted to Measured and Indicated resource categories through furtherdrilling, or into mineral reserves once economic considerations are applied.
We advise U.S. Investors that while the terms "Measured resource", "Indicated resource" and"Inferred resource" are recognized and required to be reported by Canadian regulations, theU.S. Securities and Exchange Commission ("SEC") does not recognize these terms and doesnot normally permit such terms to be used in reports and registration statements filed withthe SEC. As such, information contained in this document concerning descriptions ofmineralization and resources under Canadian standards may not be comparable to similarinformation made public by U.S. companies subject to the reporting and disclosurerequirements of the SEC. Inferred resources have a great amount of uncertainty as to theirexistence and a great uncertainty as to their economic and legal feasibility. It cannot beassumed that all or any part of a Measured, Indicated or Inferred resource will ever beupgraded to a higher category. U.S. investors are cautioned not to assume that any part or allof an Inferred mineral resource exists, or is economically or legally mineable. U.S. investors arealso cautioned not to assume that any part or all of the mineral deposits in the Measuredresource or Indicated resource categories will ever be converted into reserves.
CAUTIONARY NOTETO U.S. INVESTORS
44
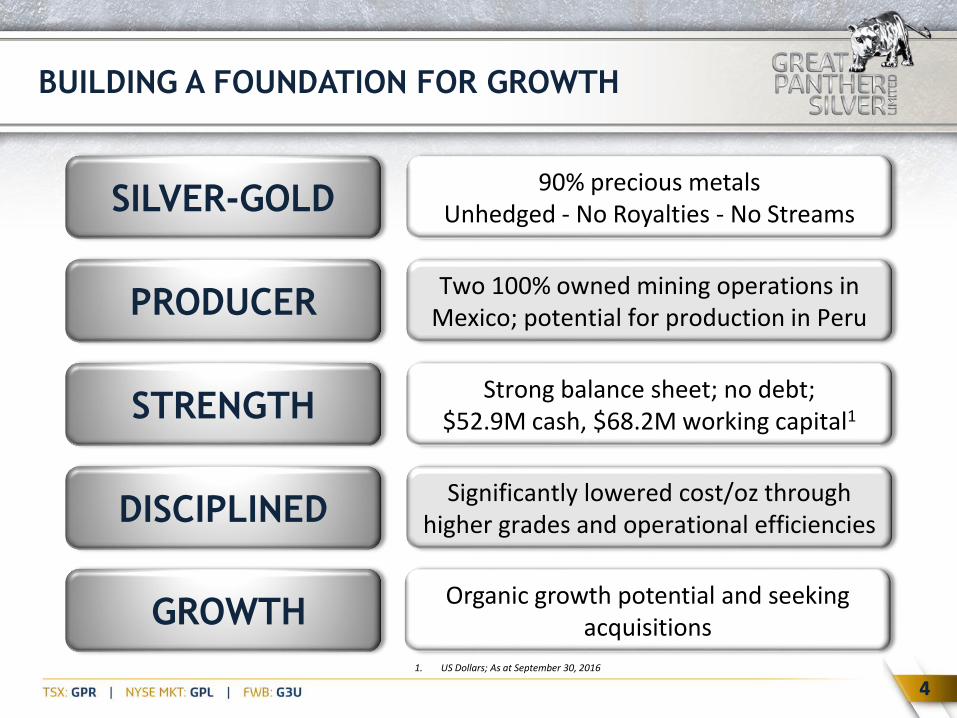
BUILDING A FOUNDATION FOR GROWTH
1. US Dollars; As at September 30, 2016
SILVER-GOLD90% precious metals
Unhedged - No Royalties - No Streams
PRODUCERTwo 100% owned mining operations in
Mexico; potential for production in Peru
GROWTH
Significantly lowered cost/oz through higher grades and operational efficiencies
STRENGTHStrong balance sheet; no debt;
$52.9M cash, $68.2M working capital1
DISCIPLINED
Organic growth potential and seeking acquisitions

5
MAINTAINING LOW COSTS
5
3.8 – 3.9 Guidance
Cost per ounce has improved due to stronger USD and higher by-product credits
$6.50
$8.14
$4.20
$1.72
$3.30
$-
$5.00
$10.00
$15.00
$20.00
$25.00
Q3 2015 Q4 2015 Q1 2016 Q2 2016 Q3 2016
Total cash cost per Ag oz Average realized silver price
$13.08
$15.10
$10.49 $7.19
$11.97
$-
$5.00
$10.00
$15.00
$20.00
$25.00
Q3 2015 Q4 2015 Q1 2016 Q2 2016 Q3 2016
All-in sustaining cost per Ag oz Average realized silver price

6
RECENT FINANCIAL PERFORMANCE
3.8 – 3.9 Guidance
Maintained strong balance sheet, no debt
Solid revenue and gross profit achieved through increased production and significant reduction in cash cost
$13.98
$13.57
$16.19 $17.82
$19.65
$-
$5.00
$10.00
$15.00
$20.00
$25.00
$-
$2,000
$4,000
$6,000
$8,000
$10,000
$12,000
Q3 2015 Q4 2015 Q1 2016 Q2 2016 Q3 2016
Mine operating earnings before non-cash items
Average realized silver price
$13.98
$13.57
$16.19 $17.82
$19.65
$-
$5.00
$10.00
$15.00
$20.00
$25.00
$-
$5,000
$10,000
$15,000
$20,000
$25,000
Q3 2015 Q4 2015 Q1 2016 Q2 2016 Q3 2016
Revenue
Average realized silver price

7
AISC AMONGST OUR PEERS
GPR’s operations are outperforming many of our peers on AISC
AverageAg Spot
Price
$-
$5.00
$10.00
$15.00
$20.00
$25.00
San
Jo
se
Cay
llom
a
Co
nso
lidat
ed
Gu
anac
evi
Bo
lan
ito
s
El C
ub
o
Co
nso
lidat
ed
La E
nca
nta
da
La P
arill
a
De
l To
ro
San
Mar
tin
La G
uit
arra
San
ta E
len
a
Co
nso
lidat
ed
Pla
tosa
Co
sala
Gal
ena
Co
nso
lidat
ed
Avi
no
GM
C
Top
ia
Co
nso
lidat
ed
Fortuna Endeavour First Majestic Excellon Americas Silver AvinoSilver
GreatPanther
.FY 2015 AISC

8
FINANCIAL SUMMARY
1. The Company has included the non-IFRS performance measures cost per tonne milled, cash cost, AISC, mine operating earnings before non-cash items, cost of sales beforenon-cash items and adjusted EBITDA throughout this document. Refer to the Non-IFRS Measures section of this MD&A for an explanation of these measures andreconciliation to the Company’s reported financial results in accordance with IFRS. As these are not standardized measures, they may not be directly comparable to similarlytitled measures used by others.
2. Average realized silver price is prior to smelting and refining charges.
in US$000s except amounts per share and per ounce Q3 2016 Q2 2016 Q1 2016 Q4 2015 Q3 2015
Revenue $ 15,631 $ 19,596 $ 14,139 $ 13,142 $ 12,863
Mine operating earnings before non-cash before non-cash items1 $ 7,230 $ 10,087 $ 5,935 $ 3,760 $ 4,416
Net income (loss) $ 2,130 $ (1,332) $ (3,418) $ (3,725) $ (2,564)
Adjusted EBITDA1 $ 4,738 $ 7,545 $ 2,860 $ (428) $ 1,595
Earnings (loss) per share – basic $ 0.01 $ (0.01) $ (0.02) $ (0.03) $ (0.02)
Earnings (loss) per share – diluted $ 0.01 $ (0.01) $ (0.02) $ (0.03) $ (0.02)
Total cash cost per Ag oz1 $ 3.30 $ 1.72 $ 4.20 $ 8.14 $ 6.50
All-in sustaining cost per Ag oz1 $ 11.97 $ 7.19 $ 10.49 $ 15.10 $ 13.08
Average realized silver price2 $ 19.65 $ 17.82 $ 16.19 $ 13.57 $ 13.98

9
MEXICO & PERU
Top silver producing countries in Latin America
Favourable political & mining jurisdictions

10
One of Mexico’s most historic mining districts with past production of more than one billion Ag oz over 400 years
Expanding production at Guanajuato Mine Complex (GMC), developing new mines and exploring the district
Commercial production at San Ignacio commenced June 2014, lifting GMC throughput to 1,050 t/day
Excellent infrastructure means that other projects in the district have potential to be satellite operations
GUANAJUATO DISTRICT (Ag-Au)

11
GUANAJUATO MINE (Ag-Au)
Historic underground mine with two operating shafts & three ramps
Currently mining & developing to 600m depth on several zones over 4km strike length
Higher cut-off grades & improvements in grade control have lowered costs
Ag-Au concentrate shipped to smelters in Japan & Germany
* For details on Mineral Resource Estimates, refer to slide 32

12
GUANAJUATO MINE COMPLEX (Ag-Au)1
Accounted for 79% of total production in Q4 2016
Q4 2016
Metal Production (Ag eq oz2)Silver Production (Ag oz1)
702,351347,415
Recoveries Ag/Au 88.7% / 85.9%
Average Grades 149g/t Ag
2.25g/t Au
Cash Cost/Ag oz2,3,4
All-in Sustaining Cost/Ag oz2,3,4
$0.15$5.58
Ore processed (tonnes) 81,518
1. Includes all mill feed from San Ignacio.2. Silver equivalent ounces for 2016 are calculated using a 70:1 Ag:Au ratio.3. Cash cost per silver payable ounce and all-in sustaining cost per silver payable ounce (“AISC”) are non-IFRS
performance measures. Refer to the “Non-IFRS Measures” section of the Company’s MD&A for an explanation ofthese measures and reconciliation to the Company’s reported financial results in accordance with IFRS. As theseare not standardized measures, they may not be directly comparable to similarly titled measures used by others.
4. As at September 30, 2016.

13
SAN IGNACIO MINE (Ag-Au)
Significant potential for resource expansion over 4km strike length
Accounted for 59% of the overall tonnes mined from the GMC in Q4 2016
Currently producing at approximately 700 tpd
Ramp access from surface. Ore trucked 22km to Cata Plant in Guanajuato

14
TOPIA MINE (Ag-Pb-Zn-Au)
Property covers most of district – more than 6,500 hectares
Operating 9 separate mines provides flexibility
High grade, narrow vein underground mining with central plant
Expanding production at profitable mines; Can temporarily close others as needed
Lead and zinc concentrates sold to metal trader in Mexico
Plant temporarily shut down due to maintenance & new TSF construction

15
TOPIA MINE (Ag-Pb-Zn-Au)
Q4 2016
Metal Production (Ag eq oz¹)Ag Production (Ag oz)
181,421113,156
Recoveries Ag/AuPb/Zn
88.8% / 59.4% 94.6% / 96.0%
Average Grades 349g/t Ag, 0.63g/t Au2.03% Pb, 2.97% Zn
Cash Cost/Ag oz2,3
All-in Sustaining Cost/Ag oz2,3
$13.25$19.52
Ore processed (tonnes) 11,351
1. Silver equivalent ounces for 2016 are calculated using a 70:1 Ag:Au ratio, and ratios of 1:0.0504 and 1:0.054 for the price/ounce of silver to lead and zinc respectively.
2. Cash cost per silver payable ounce and all-in sustaining cost per silver payable ounce (“AISC”) are non-IFRS performance measures. Refer to the “Non-IFRS Measures” section of the Company’s MD&A for an explanation of these measures and reconciliation to the Company’s reported financial results in accordance with IFRS. As these are not standardized measures, they may not be directly comparable to similarly titled measures used by others.
3. As at September 30, 2016.
Accounted for 21% of total production in Q4 2016

16
2017 OUTLOOK
Production and cash cost guidance 2017 Guidance FY 2016 Actual
Total silver equivalent ounces 1 4,000,000 – 4,200,000 4,159,121
Cash Cost per silver payable ounce (USD) 2 $5.00 – $6.00 TBA
AISC (USD)2, $14.00 – $16.00 TBA
1. Silver equivalent ounces for 2016 and 2017 guidance have been calculated using a 70:1 Au:Ag ratio, and ratios of 1:0.05 and 1:0.056 for the US dollar price of silver ounces to the US dollar price for lead and zinc pounds, respectively. These ratios will be applied consistently for the reporting of silver equivalent ounce production for 2015. 2. “Cash cost” and “AISC” are non-IFRS measures. Refer to the “Non-IFRS measures” section of the Company’s MD&A for complete definitions and reconciliations to the company’s financial statements.

17
PROJECT PIPELINE
3.8 – 3.9 Guidance
GUANAJUATO/SAN IGNACIO
TOPIA
CORICANCHA
EL HORCON
SANTA ROSA
EARLY STAGEEXPLORATION
DEVELOPMENT PRODUCTIONADVANCED STAGE
EXPLORATION
Fully financed to bring Coricancha and El Horcon into production
Pipeline of projects at various stages of exploration & development provides growth opportunities

18
Coricancha represents a near-term (12-18 mo.) production opportunity that will provide a foundation for future growth in Peru
Production history at Coricancha indicates potential for approx. 3 million Ag eq oz per year at full capacity
Acquisition expected to close in Q1 2017, with exploration & development program to begin immediately thereafter
Significant historical reserve & resource base, to be updated in Q2 2017
PIPELINE TO PRODUCTION
Drilling at El Horcon in 2017 to better define resource & consider production decision
18

19
CORICANCHA Au-Ag-Pb-Zn-Cu MINE COMPLEX (CMC)
Underground mine placed on care & maintenance in August 2013
Operating history dating back to 1906
90km east of Lima in prolific mining district
Fully permitted & operational 600 tpd processing plant and gold bio-leaching facility
80% precious metals, 20% base metals by value
GPR to update Mineral Resource Estimate in Q2 2017 & continue drilling & mine development
20
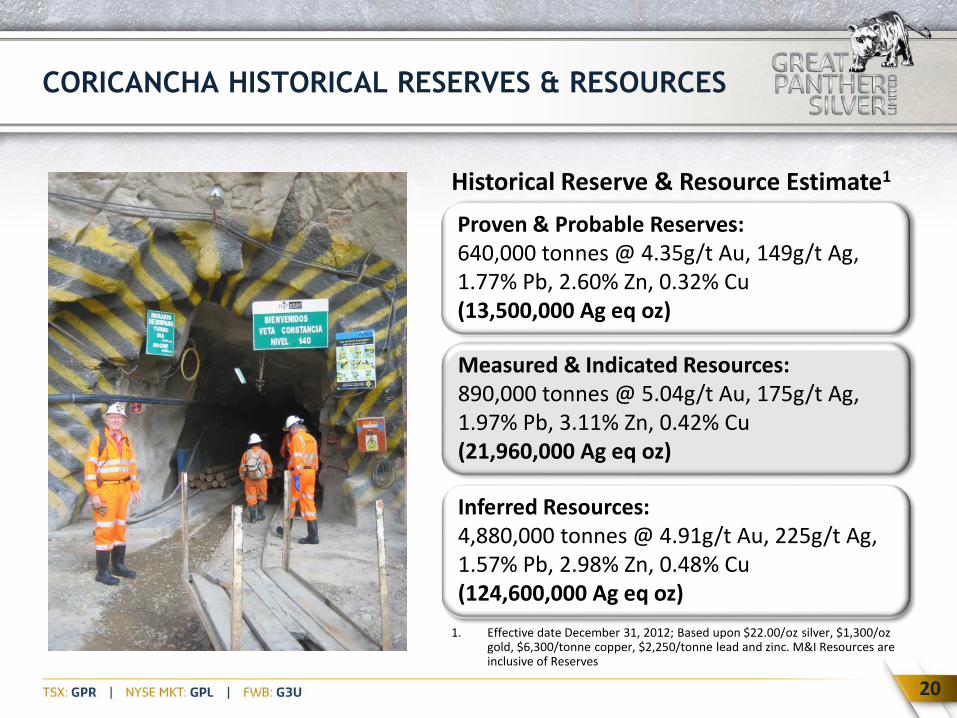
CORICANCHA HISTORICAL RESERVES & RESOURCES
1. Effective date December 31, 2012; Based upon $22.00/oz silver, $1,300/ozgold, $6,300/tonne copper, $2,250/tonne lead and zinc. M&I Resources are inclusive of Reserves
Historical Reserve & Resource Estimate1
Proven & Probable Reserves:640,000 tonnes @ 4.35g/t Au, 149g/t Ag, 1.77% Pb, 2.60% Zn, 0.32% Cu (13,500,000 Ag eq oz)
Measured & Indicated Resources:890,000 tonnes @ 5.04g/t Au, 175g/t Ag, 1.97% Pb, 3.11% Zn, 0.42% Cu (21,960,000 Ag eq oz)
Inferred Resources:4,880,000 tonnes @ 4.91g/t Au, 225g/t Ag, 1.57% Pb, 2.98% Zn, 0.48% Cu(124,600,000 Ag eq oz)

21
Share Purchase Agreement whereby Great Panther Silver Peru, will acquire Nyrstar Coricancha, the owner of a 100% interest in the CMC
Nyrstar may be paid 15% of annual free cash flow, up to US$10 million, after GPSP has recouped its investment
GPSP to pay US$100,000 cash on closing (Q1 2017)
Nyrstar will cover cost of reclamation of certain tailings facilities, up to US$20 million, and associated fines up to US$4 million
CORICANCHA ACQUISITION AGREEMENT
Nyrstar will cover US$9.7 million closure bond for 3 years
21

22
CAPITAL STRUCTURE
Shares issued1 166,435,918
Fully diluted1 186,210,684
Institutional ownership ~22%
Market capitalization CA $411M
90-day daily average trading volume ~3M shares
52-week trading range: TSXNYSE MKT
CA $0.54 - $2.82US $0.41 - $2.25
Cash position1 US $52.9M (no debt)
Net working capital1 US $68.2 M
Updated on January 10, 20161. As at September 30, 2016
Analyst Coverage: Euro Pacific Capital Inc., Rodman & Renshaw, Hallgarten & Company, Noble Financial

23
ONE YEAR STOCK PERFORMANCE

24
12 MONTH PEER COMPARISON
CHANGEAmericas Silver 4525.00%
Excellon 607.41%
Impact 468.00%
Great Panther 257.97%
Endeavour 179.79%
Fortuna 153.08%
Sierra Metals 63.71%
Avino 54.10%
Silver 18.61%
-50%
50%
150%
250%
350%
450%
550%
650%
750%
850%
950%

25
Great Panther Silver
LEVERAGED TO SILVER
-100%
100%
300%
500%
700%
900%
1100%
1300%
1500%
1700%
1900%
2009 2010 2011 2012 2013 2014 2015 2016 2017

26
WHY GREAT PANTHER SILVER?
Low cost producer with strong leverage to silver price
Strong balance sheet, no debt – seeking acquisitions
Successfully grown production while reducing unit costs
Demonstrated ability to acquire and develop assets
Excellent liquidity on NYSE MKT and TSX
27
APPENDIX

28
DIRECTORS & SENIOR MANAGEMENT TEAM
Board of DirectorsR.W. (Bob) Garnett, CPA, CA, ICD.D, Chairman; Robert Archer, P. Geo.; Ken Major, P. Eng.;
John Jennings, MBA, CFA; W. James Mullin B.Sc.; Jeffrey R. Mason, CA, ICD.D
Robert Archer, P. Geo.President & CEO
Co-founder
Jim Zadra, CPA, CA, MBAChief Financial Officer
Ali SoltaniChief Operating Officer

29
SOCIAL PRINCIPLES
We are committed to fair and equitable employment conditions for our employees
We are committed to ensuring our employees and contractors return home safely every day
We are committed to enhancing and benefiting the communities in which we live and operate
We are committed to minimizing and restoring any impact on our environment
We are committed to strong ethics and we abide by all rules and regulations that apply to our business Awarded distinction as a “Socially Responsible
Company” by CEMEFI, Centro Mexicano para la Filantropía, for a fifth consecutive year in 2015

30
OPERATIONAL SUMMARY
Consolidated Operations FY 2016 Q4 2016 Q3 2016 Q2 2016 Q1 2016
Tonnes Milled 376,739 92,869 95,282 99,905 88,683
Silver ounces 2,047,260 460,571 510,491 536,726 539,472
Gold ounces 22,238 5,206 5,423 6,010 5,599
Lead tonnes 1,034 213 248 290 282
Zinc tonnes 1,496 315 324 433 424
Silver equivalent ounces1 1,002,584 883,772 953,632 1,037,728 1,009,828
1. Silver equivalent ounces for 2016 are calculated using a 70:1 Ag:Au ratio, and a ratio of 1:0.0504 for the price/ounce of silver to lead and zinc price/pound respectively.

31
DRILLING SUMMARY
2017 drilling focused on increasing resources and exploring new zones
2012 2013 2014 2015 2016 2017
Guanajuato 29,254 m 26,237 m 13,270 m 13,025 m 9,670 m 9,025 m
Topia 8,059 m 2,162 m 1,903 m - - 2,500 m
San Ignacio 9,310 m 1,144 m 3,827 m 4,657 m 6,015 m 10,975 m
Coricancha - - - 2,323 m 3,551 m 10,000 m
Santa Rosa 1,653 m - - - - 1,000 m
El Horcon - 2,156 m - - - 1,500 m
Total 48,276 m 31,699 m 19,000 m 20,005 m 19,236 m 35,000 m

32
RESOURCES
NOTE: Mineral Resource Estimates for Guanajuato and El Horcon use an effective date of July 31, 2015 while San Ignacio uses an effective date of December 31, 2015; and allused a metal price outlook of US$15.00/oz silver and US$1,100/oz gold.| Topia, November 2014 - US$1,200/oz Au, US$17.00/oz Ag, US$0.90/lb Pb, and US$0.95/lb Zn. Silverequivalent calculations used the same metal pricing. | San Ignacio, December 2015 - US$15.00/oz Ag; US$1100/oz Au. | Silver equivalent calculations for El Horcon includelead content but not zinc, as the zinc would not be recovered in the Guanajuato plant. Robert Brown, P. Eng. is the Qualified Person under NI 43-101 for Guanajuato, Topia,San Ignacio and El Horcon.
Measured Tonnes Ag (g/t) Au (g/t) Pb (%) Zn (%) Ag (oz) Au (oz) Ag Eq Oz
San Ignacio 249,800 151 3.39 1,210,100 27,200 3,130,400
Guanajuato 90,400 285 1.81 - - 829,000 5,300 1,200,600
Topia 180,400 606 1.44 4.26 4.52 3,515,000 8,300 6,000,200
Total Measured 5,554,100 40,800 10,331,200
Indicated Tonnes Ag (g/t) Au (g/t) Pb (%) Zn (%) Ag (oz) Au (oz) Ag Eq Oz
San Ignacio 110,500 133 2.79 - - 471,900 9,900 1,170,800
Guanajuato 59,400 245 1.04 - - 467,700 2,000 607,400
Topia 165,800 644 1.17 4.75 3.82 3,433,000 6,200 5,570,000
Total Indicated 4,372,600 18,100 7,348,200
Total Measured + Indicated 9,926,700 58,900 17,679,400
Inferred Tonnes Ag (g/t) Au (g/t) Pb (%) Zn (%) Ag (oz) Au (oz) Ag Eq Oz
San Ignacio 771,000 138 2.76 - - 3,428,500 68,500 8,266,200
Guanajuato 135,600 151 2.30 - - 656,400 10,000 1,363,300
Topia 357,400 592 1.31 3.44 3.96 6,807,500 15,060 11,050,000
El Horcon 128,700 82 3.64 2.97 4.11 339,400 15,000 1,906,000
Total Inferred 11,231,800 108,560 22,585,500

33
Spiros CacosDirector, Investor RelationsD: +1 604 638 8955TF: 1 888 355 1766
Gr8_Panther
GreatPantherSilver
Great Panther Silver
Great Panther Silver Limited
SOCIAL SCENE

Corporate PresentationJanuary 11, 2017
![Untitled-2 [] · Romance Pink Avadable in Ramco PRODUCTS . An Clin Angelina Available in 5 ml ... PANTHER PANTHER PANTHER PANTHER Black Panther Available in 100 Ramco](https://img.pdfslide.net/doc/110x75/5b5319867f8b9a0d398b631e/untitled-2-romance-pink-avadable-in-ramco-products-an-clin-angelina-available.jpg)