Embed Size (px)
Citation preview
April 29, 2009
First Quarter 2009 Earnings Report
John A. Luke, Jr.Chairman and CEO
James A. BuzzardPresident
E. Mark RajkowskiSenior Vice President and CFO
Results presented on a continuing operations basis
2 First Quarter 2009 Earnings Report
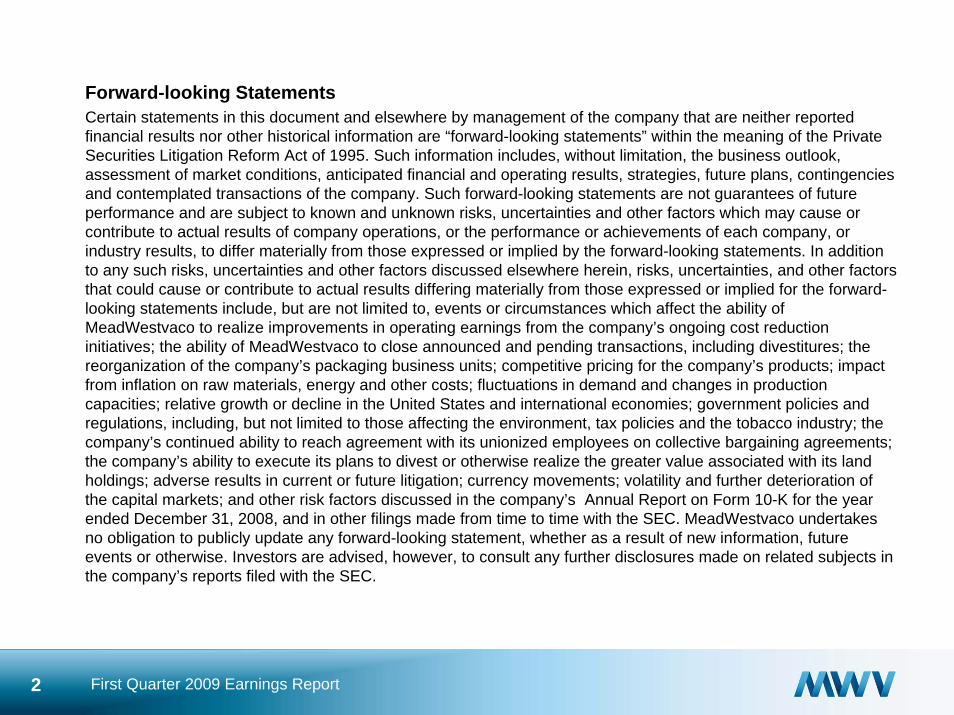
Forward-looking StatementsCertain statements in this document and elsewhere by management of the company that are neither reported financial results nor other historical information are “forward-looking statements” within the meaning of the Private Securities Litigation Reform Act of 1995. Such information includes, without limitation, the business outlook, assessment of market conditions, anticipated financial and operating results, strategies, future plans, contingencies and contemplated transactions of the company. Such forward-looking statements are not guarantees of future performance and are subject to known and unknown risks, uncertainties and other factors which may cause or contribute to actual results of company operations, or the performance or achievements of each company, or industry results, to differ materially from those expressed or implied by the forward-looking statements. In addition to any such risks, uncertainties and other factors discussed elsewhere herein, risks, uncertainties, and other factors that could cause or contribute to actual results differing materially from those expressed or implied for the forward-looking statements include, but are not limited to, events or circumstances which affect the ability of MeadWestvaco to realize improvements in operating earnings from the company’s ongoing cost reduction initiatives; the ability of MeadWestvaco to close announced and pending transactions, including divestitures; the reorganization of the company’s packaging business units; competitive pricing for the company’s products; impact from inflation on raw materials, energy and other costs; fluctuations in demand and changes in production capacities; relative growth or decline in the United States and international economies; government policies and regulations, including, but not limited to those affecting the environment, tax policies and the tobacco industry; the company’s continued ability to reach agreement with its unionized employees on collective bargaining agreements; the company’s ability to execute its plans to divest or otherwise realize the greater value associated with its land holdings; adverse results in current or future litigation; currency movements; volatility and further deterioration of the capital markets; and other risk factors discussed in the company’s Annual Report on Form 10-K for the year ended December 31, 2008, and in other filings made from time to time with the SEC. MeadWestvaco undertakes no obligation to publicly update any forward-looking statement, whether as a result of new information, future events or otherwise. Investors are advised, however, to consult any further disclosures made on related subjects in the company’s reports filed with the SEC.

3 First Quarter 2009 Earnings Report
First Quarter 2009 Key Points• Lower operating results reflect weaker demand due to the challenging
global economic environment
• Executing strategies to significantly improve MWV’s business model –expect to achieve $125 million savings goal in 2009
Eliminated over 800 FTEs through Q1 2009; expect to achieve 2009 goal of 2,000Announced 8 manufacturing actions through Q12009; expect to meet goal of 12 to 14 Achieved related savings of $14 million in Q1 2009 – savings build through 2009
• Actions helping to maximize performance and maintain financial strength in a difficult cycle
Cash from operations more than doubled to $90 million – driven by working capital improvement, overhead savings and large land transactionCash and cash equivalents remain strong at over $500 million
• Capturing growth opportunities in global packaging markets due to financial strength, geographic breadth, unique capabilities and blue-chip customer base
4 First Quarter 2009 Earnings Report
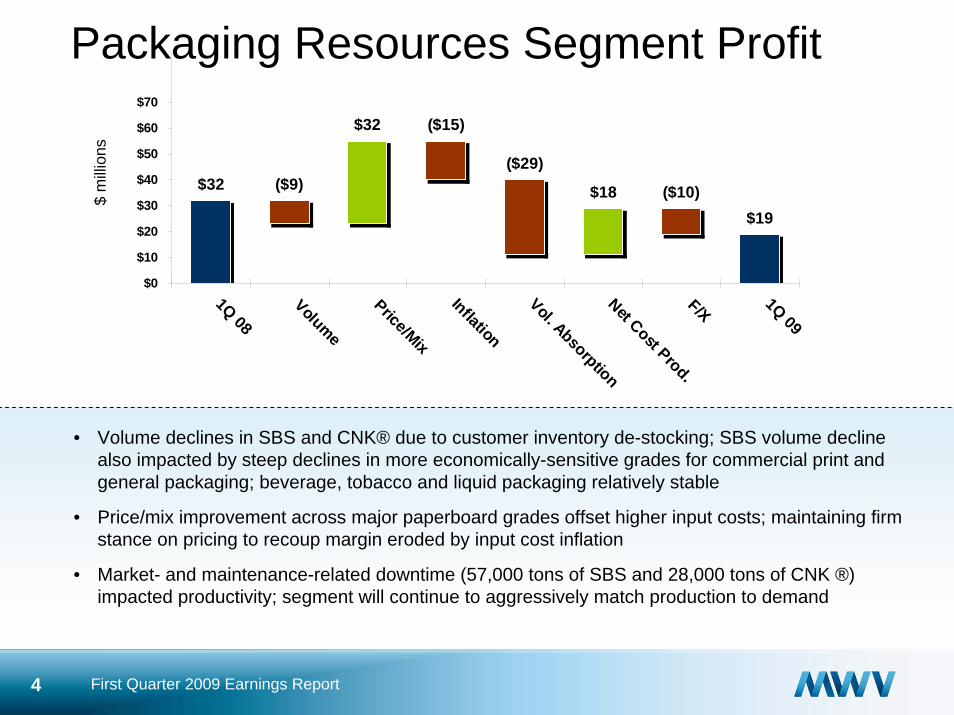
Packaging Resources Segment Profit
• Volume declines in SBS and CNK® due to customer inventory de-stocking; SBS volume decline also impacted by steep declines in more economically-sensitive grades for commercial print and general packaging; beverage, tobacco and liquid packaging relatively stable
• Price/mix improvement across major paperboard grades offset higher input costs; maintaining firm stance on pricing to recoup margin eroded by input cost inflation
• Market- and maintenance-related downtime (57,000 tons of SBS and 28,000 tons of CNK ®) impacted productivity; segment will continue to aggressively match production to demand
$ m
illion
s
$32 ($9)
$32 ($15)
($29)
$18 ($10)$19
$0
$10
$20
$30
$40
$50
$60
$70
1Q 08
Volume
Price/Mix
Inflation
Vol. AbsorptionNet Cost Prod.F/X 1Q 09
5 First Quarter 2009 Earnings Report
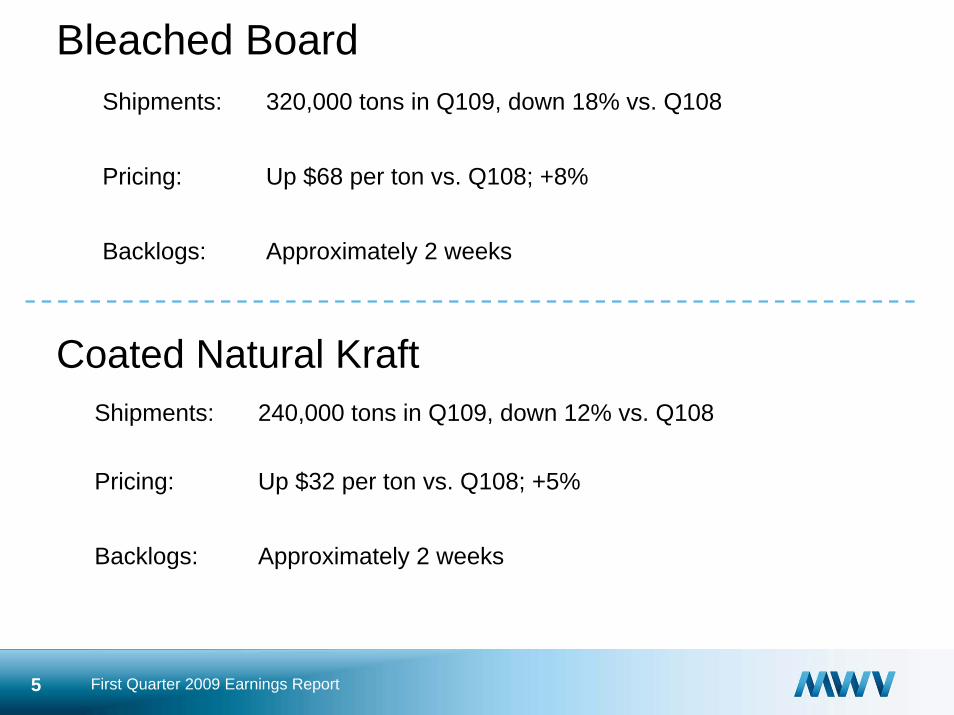
Bleached BoardShipments: 320,000 tons in Q109, down 18% vs. Q108
Pricing: Up $68 per ton vs. Q108; +8%
Backlogs: Approximately 2 weeks
Coated Natural KraftShipments: 240,000 tons in Q109, down 12% vs. Q108
Pricing: Up $32 per ton vs. Q108; +5%
Backlogs: Approximately 2 weeks
6 First Quarter 2009 Earnings Report
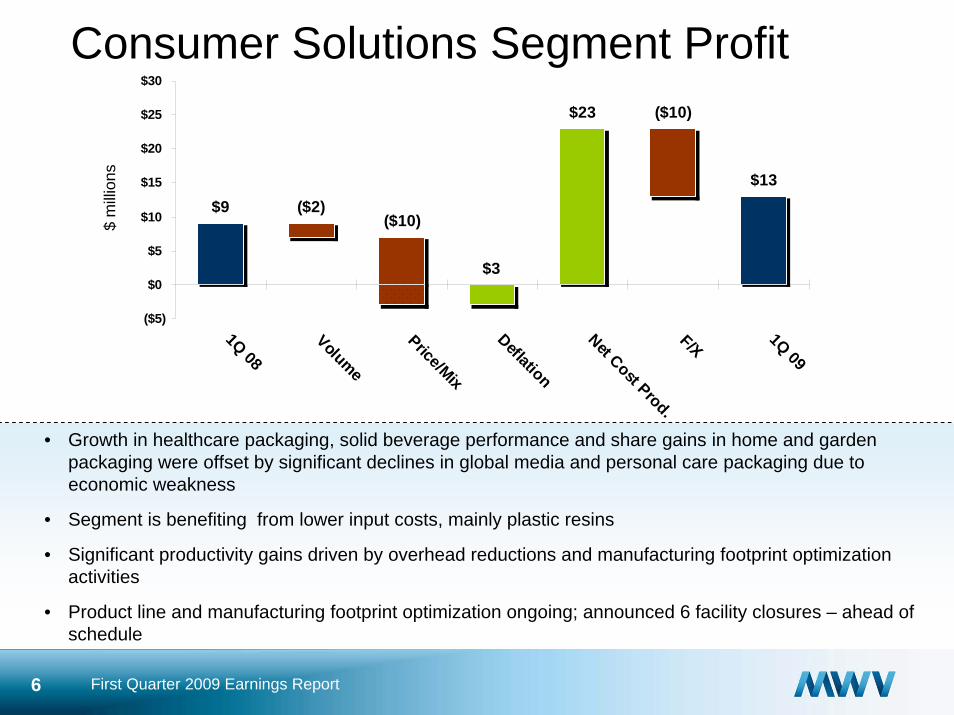
Consumer Solutions Segment Profit
• Growth in healthcare packaging, solid beverage performance and share gains in home and garden packaging were offset by significant declines in global media and personal care packaging due to economic weakness
• Segment is benefiting from lower input costs, mainly plastic resins
• Significant productivity gains driven by overhead reductions and manufacturing footprint optimization activities
• Product line and manufacturing footprint optimization ongoing; announced 6 facility closures – ahead of schedule
$ m
illion
s
$9 ($2)($10)
$3
$23 ($10)
$13
($5)
$0
$5
$10
$15
$20
$25
$30
1Q 08
Volume
Price/Mix
Deflation
Net Cost Prod.F/X 1Q 09
7 First Quarter 2009 Earnings Report
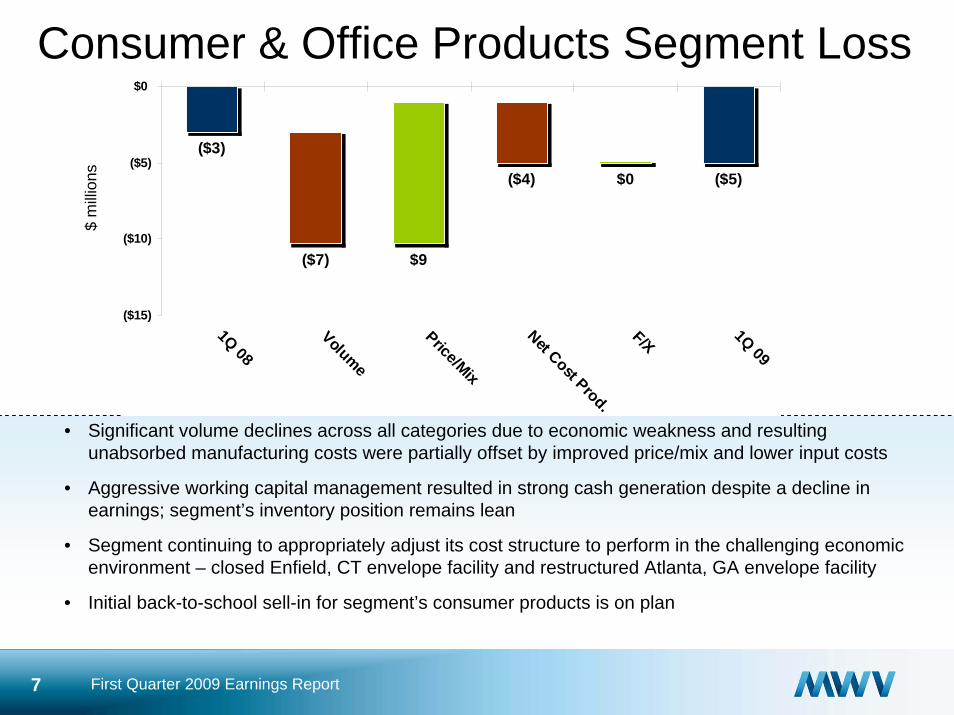
Consumer & Office Products Segment Loss
• Significant volume declines across all categories due to economic weakness and resulting unabsorbed manufacturing costs were partially offset by improved price/mix and lower input costs
• Aggressive working capital management resulted in strong cash generation despite a decline in earnings; segment’s inventory position remains lean
• Segment continuing to appropriately adjust its cost structure to perform in the challenging economic environment – closed Enfield, CT envelope facility and restructured Atlanta, GA envelope facility
• Initial back-to-school sell-in for segment’s consumer products is on plan
$ m
illion
s
($5)$0 ($4)
$9 ($7)
($3)
($15)
($10)
($5)
$0
1Q 08
Volume
Price/Mix
Net Cost Prod.
F/X 1Q 09
8 First Quarter 2009 Earnings Report
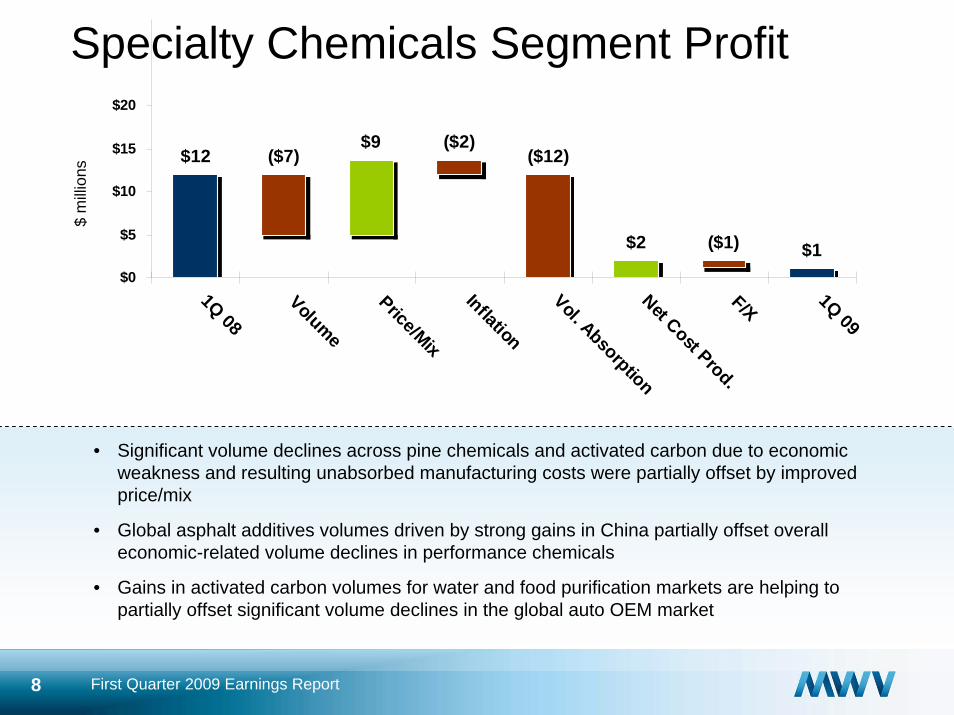
Specialty Chemicals Segment Profit
• Significant volume declines across pine chemicals and activated carbon due to economic weakness and resulting unabsorbed manufacturing costs were partially offset by improved price/mix
• Global asphalt additives volumes driven by strong gains in China partially offset overall economic-related volume declines in performance chemicals
• Gains in activated carbon volumes for water and food purification markets are helping to partially offset significant volume declines in the global auto OEM market
$ m
illion
s $12 ($7)$9 ($2)
($12)
$2 ($1) $1 $0
$5
$10
$15
$20
1Q 08
Volume
Price/Mix
Inflation
Vol. AbsorptionNet Cost Prod.F/X 1Q 09
9 First Quarter 2009 Earnings Report
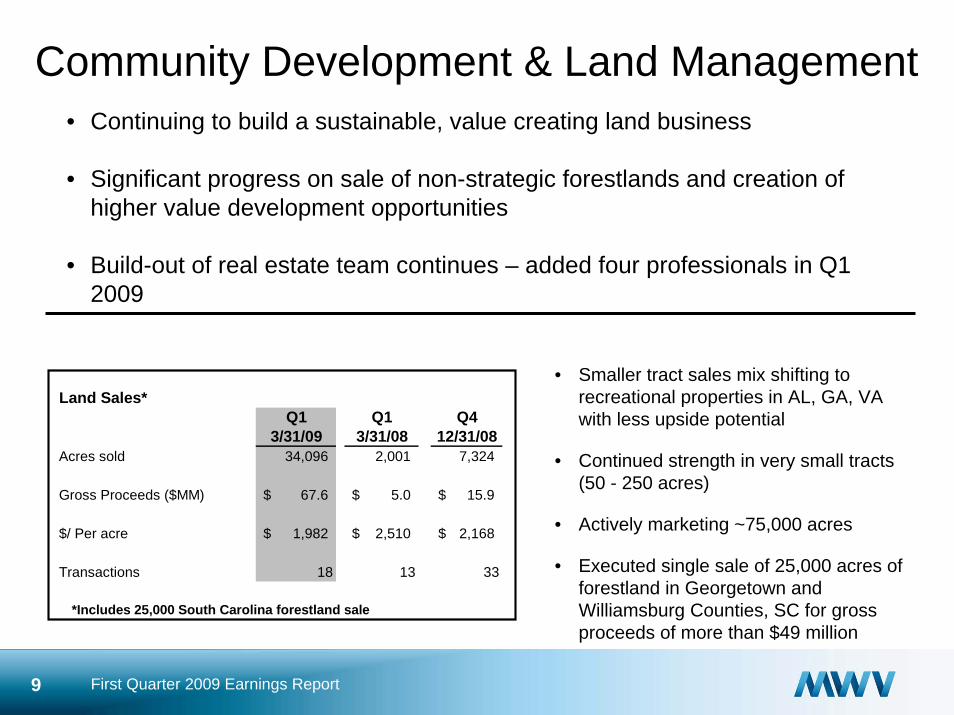
Community Development & Land Management
• Smaller tract sales mix shifting to recreational properties in AL, GA, VA with less upside potential
• Continued strength in very small tracts (50 - 250 acres)
• Actively marketing ~75,000 acres
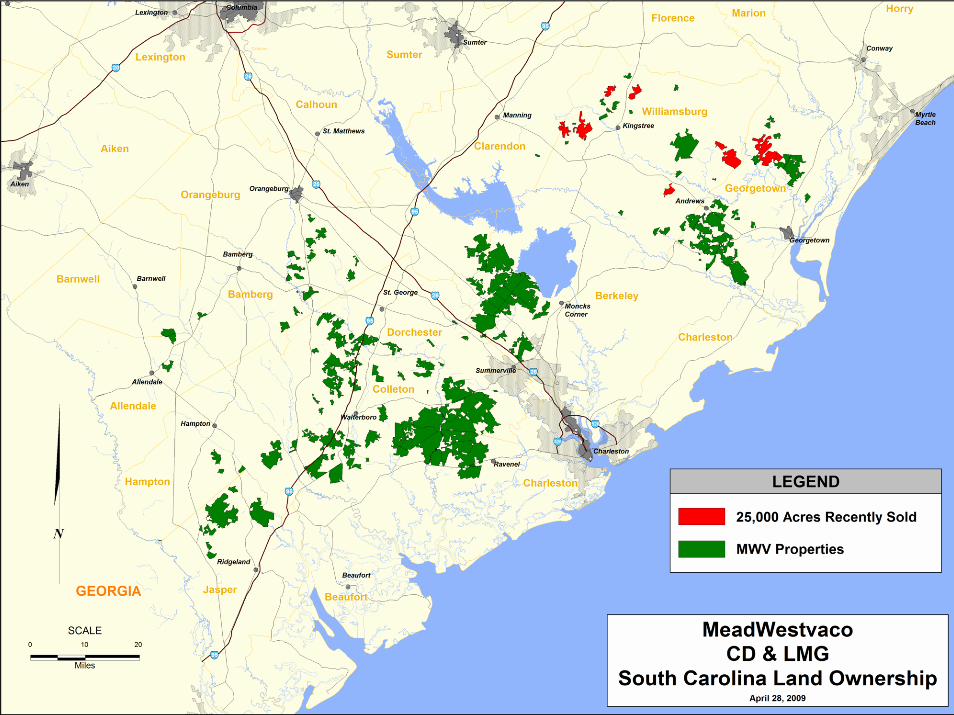
• Executed single sale of 25,000 acres of forestland in Georgetown and Williamsburg Counties, SC for gross proceeds of more than $49 million
*Includes 25,000 South Carolina forestland sale
• Continuing to build a sustainable, value creating land business
• Significant progress on sale of non-strategic forestlands and creation of higher value development opportunities
• Build-out of real estate team continues – added four professionals in Q1 2009
Land Sales*Q1 Q1 Q4
3/31/09 3/31/08 12/31/08Acres sold 34,096 2,001 7,324
Gross Proceeds ($MM) 67.6$ 5.0$ 15.9$
$/ Per acre 1,982$ 2,510$ 2,168$
Transactions 18 13 33
10 First Quarter 2009 Earnings Report
11 First Quarter 2009 Earnings Report
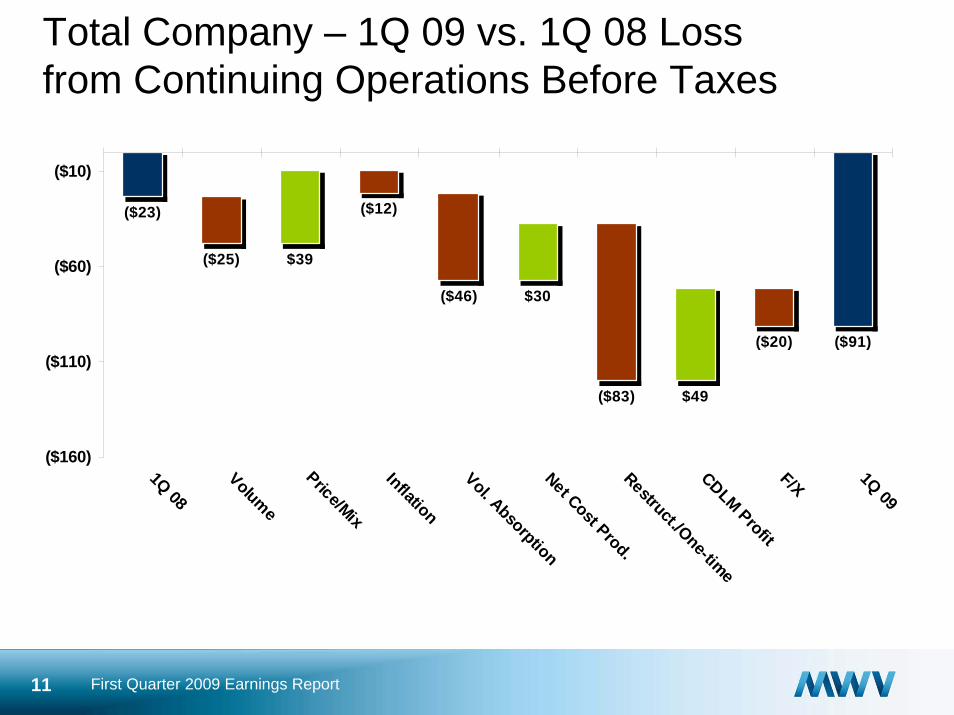
Total Company – 1Q 09 vs. 1Q 08 Lossfrom Continuing Operations Before Taxes
($23)
($25) $39
($12)
($46) $30
($83) $49
($20) ($91)
($160)
($110)
($60)
($10)
1Q 08
Volume
Price/Mix
Inflation
Vol. AbsorptionNet Cost Prod.Restruct./One-timeCDLM ProfitF/X 1Q 09
12 First Quarter 2009 Earnings Report
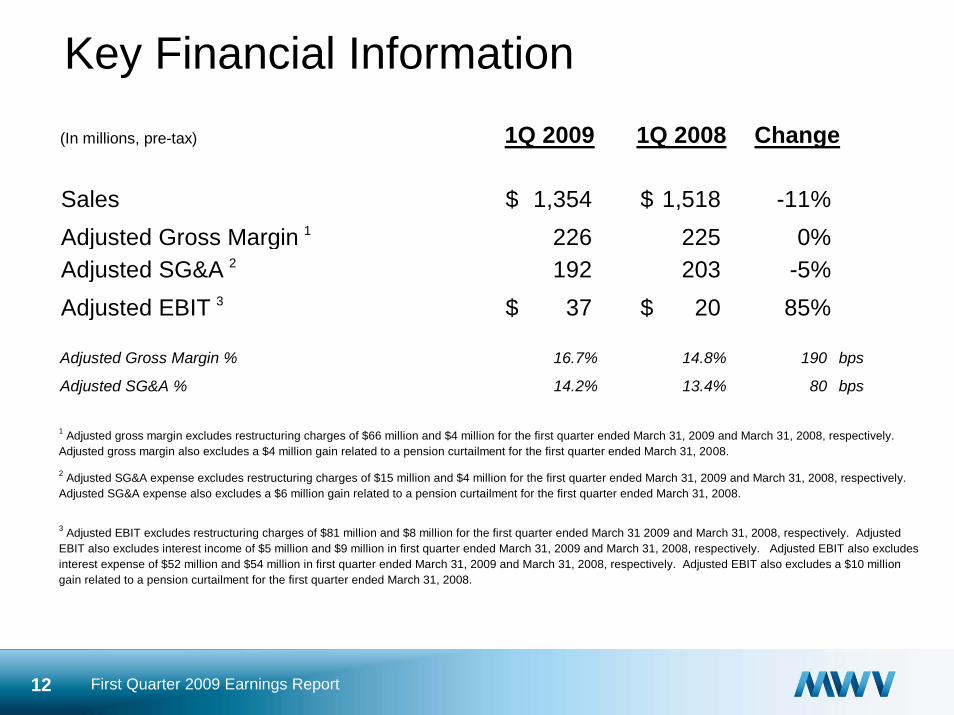
Key Financial Information(In millions, pre-tax) 1Q 2009 1Q 2008 Change
Sales 1,354$ 1,518$ -11%Adjusted Gross Margin 1 226 225 0%Adjusted SG&A 2 192 203 -5%Adjusted EBIT 3 37$ 20$ 85% Adjusted Gross Margin % 16.7% 14.8% 190 bps
Adjusted SG&A % 14.2% 13.4% 80 bps
1 Adjusted gross margin excludes restructuring charges of $66 million and $4 million for the first quarter ended March 31, 2009 and March 31, 2008, respectively. Adjusted gross margin also excludes a $4 million gain related to a pension curtailment for the first quarter ended March 31, 2008.
2 Adjusted SG&A expense excludes restructuring charges of $15 million and $4 million for the first quarter ended March 31, 2009 and March 31, 2008, respectively. Adjusted SG&A expense also excludes a $6 million gain related to a pension curtailment for the first quarter ended March 31, 2008.
3 Adjusted EBIT excludes restructuring charges of $81 million and $8 million for the first quarter ended March 31 2009 and March 31, 2008, respectively. Adjusted EBIT also excludes interest income of $5 million and $9 million in first quarter ended March 31, 2009 and March 31, 2008, respectively. Adjusted EBIT also excludes interest expense of $52 million and $54 million in first quarter ended March 31, 2009 and March 31, 2008, respectively. Adjusted EBIT also excludes a $10 million gain related to a pension curtailment for the first quarter ended March 31, 2008.
13 First Quarter 2009 Earnings Report
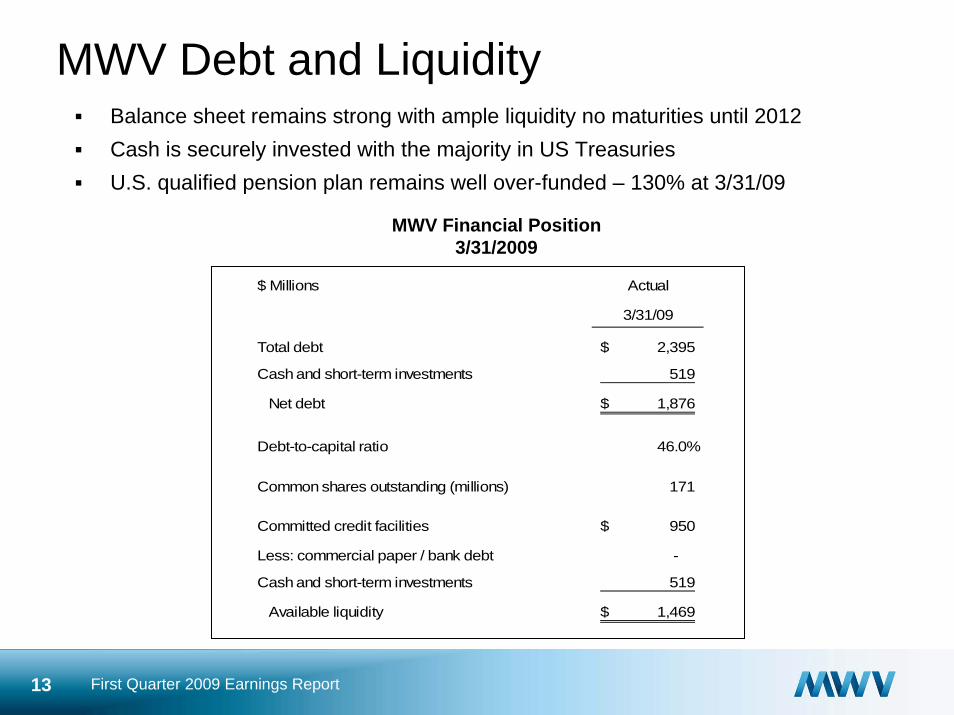
MWV Debt and Liquidity
$ Millions Actual
3/31/09
Total debt 2,395$
Cash and short-term investments 519
Net debt 1,876$
Debt-to-capital ratio 46.0%
Common shares outstanding (millions) 171
Committed credit facilities 950$
Less: commercial paper / bank debt -
Cash and short-term investments 519
Available liquidity 1,469$
Balance sheet remains strong with ample liquidity no maturities until 2012Cash is securely invested with the majority in US TreasuriesU.S. qualified pension plan remains well over-funded – 130% at 3/31/09
MWV Financial Position3/31/2009
14 First Quarter 2009 Earnings Report
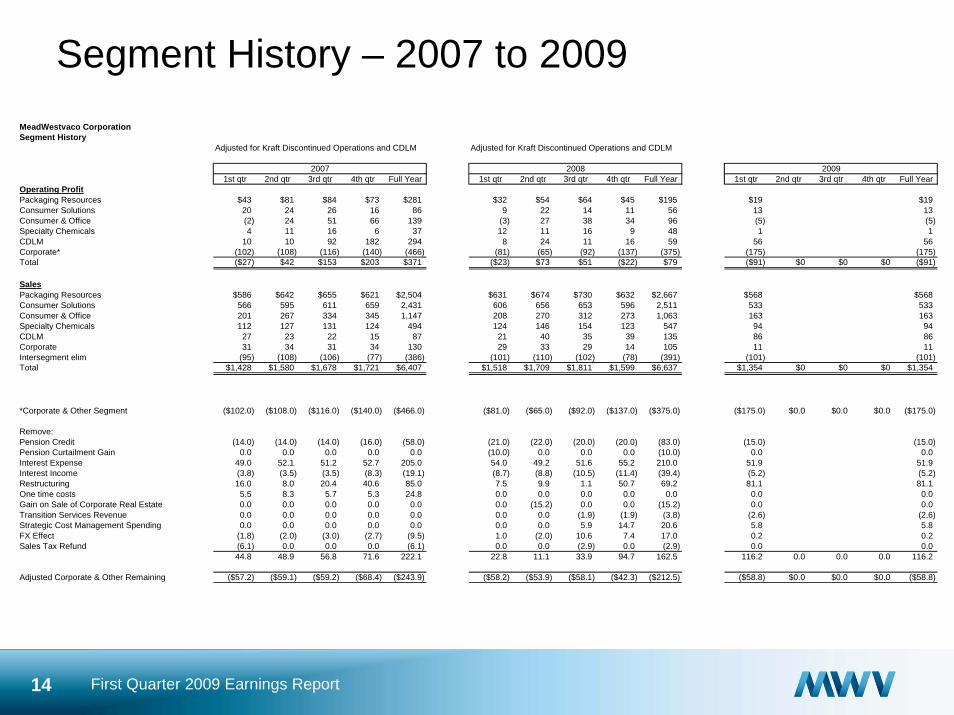
Segment History – 2007 to 2009 MeadWestvaco CorporationSegment History
Adjusted for Kraft Discontinued Operations and CDLM Adjusted for Kraft Discontinued Operations and CDLM
2007 2008 20091st qtr 2nd qtr 3rd qtr 4th qtr Full Year 1st qtr 2nd qtr 3rd qtr 4th qtr Full Year 1st qtr 2nd qtr 3rd qtr 4th qtr Full Year
Operating ProfitPackaging Resources $43 $81 $84 $73 $281 $32 $54 $64 $45 $195 $19 $19Consumer Solutions 20 24 26 16 86 9 22 14 11 56 13 13Consumer & Office (2) 24 51 66 139 (3) 27 38 34 96 (5) (5)Specialty Chemicals 4 11 16 6 37 12 11 16 9 48 1 1CDLM 10 10 92 182 294 8 24 11 16 59 56 56Corporate* (102) (108) (116) (140) (466) (81) (65) (92) (137) (375) (175) (175)Total ($27) $42 $153 $203 $371 ($23) $73 $51 ($22) $79 ($91) $0 $0 $0 ($91)
SalesPackaging Resources $586 $642 $655 $621 $2,504 $631 $674 $730 $632 $2,667 $568 $568Consumer Solutions 566 595 611 659 2,431 606 656 653 596 2,511 533 533Consumer & Office 201 267 334 345 1,147 208 270 312 273 1,063 163 163Specialty Chemicals 112 127 131 124 494 124 146 154 123 547 94 94CDLM 27 23 22 15 87 21 40 35 39 135 86 86Corporate 31 34 31 34 130 29 33 29 14 105 11 11Intersegment elim (95) (108) (106) (77) (386) (101) (110) (102) (78) (391) (101) (101)Total $1,428 $1,580 $1,678 $1,721 $6,407 $1,518 $1,709 $1,811 $1,599 $6,637 $1,354 $0 $0 $0 $1,354
*Corporate & Other Segment ($102.0) ($108.0) ($116.0) ($140.0) ($466.0) ($81.0) ($65.0) ($92.0) ($137.0) ($375.0) ($175.0) $0.0 $0.0 $0.0 ($175.0)
Remove:Pension Credit (14.0) (14.0) (14.0) (16.0) (58.0) (21.0) (22.0) (20.0) (20.0) (83.0) (15.0) (15.0)Pension Curtailment Gain 0.0 0.0 0.0 0.0 0.0 (10.0) 0.0 0.0 0.0 (10.0) 0.0 0.0Interest Expense 49.0 52.1 51.2 52.7 205.0 54.0 49.2 51.6 55.2 210.0 51.9 51.9Interest Income (3.8) (3.5) (3.5) (8.3) (19.1) (8.7) (8.8) (10.5) (11.4) (39.4) (5.2) (5.2)Restructuring 16.0 8.0 20.4 40.6 85.0 7.5 9.9 1.1 50.7 69.2 81.1 81.1One time costs 5.5 8.3 5.7 5.3 24.8 0.0 0.0 0.0 0.0 0.0 0.0 0.0Gain on Sale of Corporate Real Estate 0.0 0.0 0.0 0.0 0.0 0.0 (15.2) 0.0 0.0 (15.2) 0.0 0.0Transition Services Revenue 0.0 0.0 0.0 0.0 0.0 0.0 0.0 (1.9) (1.9) (3.8) (2.6) (2.6)Strategic Cost Management Spending 0.0 0.0 0.0 0.0 0.0 0.0 0.0 5.9 14.7 20.6 5.8 5.8FX Effect (1.8) (2.0) (3.0) (2.7) (9.5) 1.0 (2.0) 10.6 7.4 17.0 0.2 0.2Sales Tax Refund (6.1) 0.0 0.0 0.0 (6.1) 0.0 0.0 (2.9) 0.0 (2.9) 0.0 0.0
44.8 48.9 56.8 71.6 222.1 22.8 11.1 33.9 94.7 162.5 116.2 0.0 0.0 0.0 116.2
Adjusted Corporate & Other Remaining ($57.2) ($59.1) ($59.2) ($68.4) ($243.9) ($58.2) ($53.9) ($58.1) ($42.3) ($212.5) ($58.8) $0.0 $0.0 $0.0 ($58.8)
![Earning Release, Investors Presentation, Earning Con Call for Q2 FY 2015-16 [Company Update]](https://img.pdfslide.net/doc/110x75/577ca76d1a28abea748c6376/earning-release-investors-presentation-earning-con-call-for-q2-fy-2015-16.jpg)


![Earning Call Presentation [Company Update]](https://img.pdfslide.net/doc/110x75/577c7c201a28abe054996551/earning-call-presentation-company-update.jpg)


![Earning Presentation [Company Update]](https://img.pdfslide.net/doc/110x75/577c7c281a28abe0549984b1/earning-presentation-company-update.jpg)