Embed Size (px)
Citation preview
Periodical Financial Information
3M 2016RESULTS

Main messagesAgeas reports a solid start of the year
1Periodic financial Information I 3M 16 results I 19 May 2016
*Consolidated entities only
Insurance
performance
Group result
Balance sheet
Insurance net profit of EUR 201 mio (+1%)
Inflow @ 100% of EUR 11.1 bn (+11%)
Life Guaranteed margin at 103 bps (vs.91 bps)
Group combined ratio at 97.8%* (vs.96.6%)
Life Technical Liabilities at EUR 75.9 bn* (+2% vs. YE 2015)
Group net loss of EUR 633 mio
General Account net loss of EUR 834 mio as result of provision for
Fortis settlement
Shareholders’ equity at EUR 10.3 bn or EUR 49.10 per share
UG/L at EUR 2.9 bn or EUR 13.81 per share
Insurance Solvency IIageas at 182%, Group ratio at 180%
Total Liquid Assets General Account at EUR 1.2 bn (vs.EUR 1.6 bn)
2Periodic financial Information I 3M 16 results I 19 May 2016
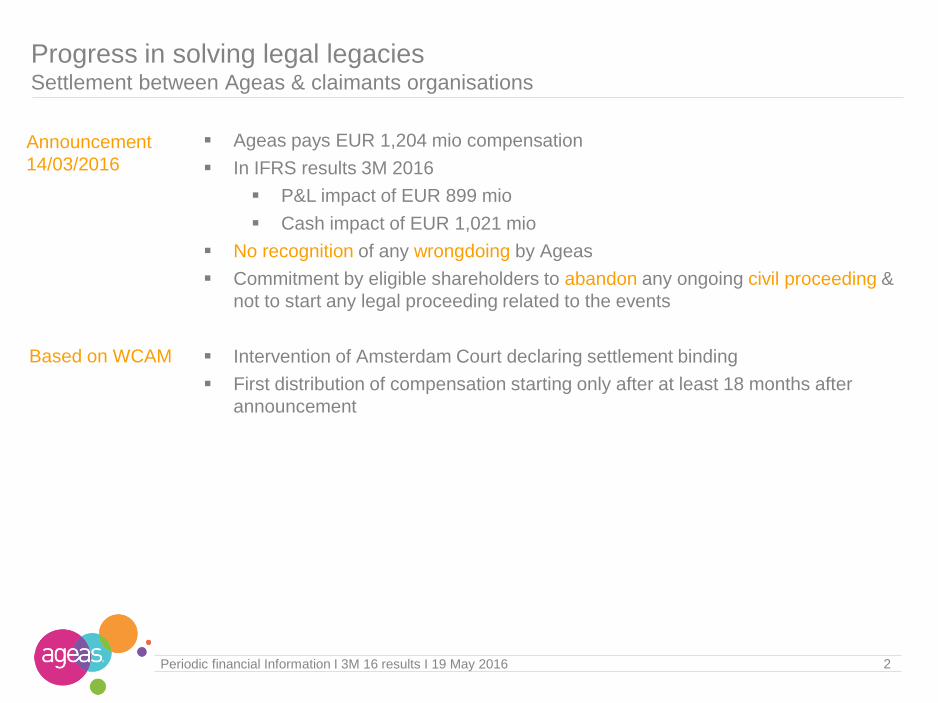
Progress in solving legal legaciesSettlement between Ageas & claimants organisations
Ageas pays EUR 1,204 mio compensation
In IFRS results 3M 2016
P&L impact of EUR 899 mio
Cash impact of EUR 1,021 mio
No recognition of any wrongdoing by Ageas
Commitment by eligible shareholders to abandon any ongoing civil proceeding &
not to start any legal proceeding related to the events
Intervention of Amsterdam Court declaring settlement binding
First distribution of compensation starting only after at least 18 months after
announcement
Announcement
14/03/2016
Based on WCAM
3Periodic financial Information I 3M 16 results I 19 May 2016
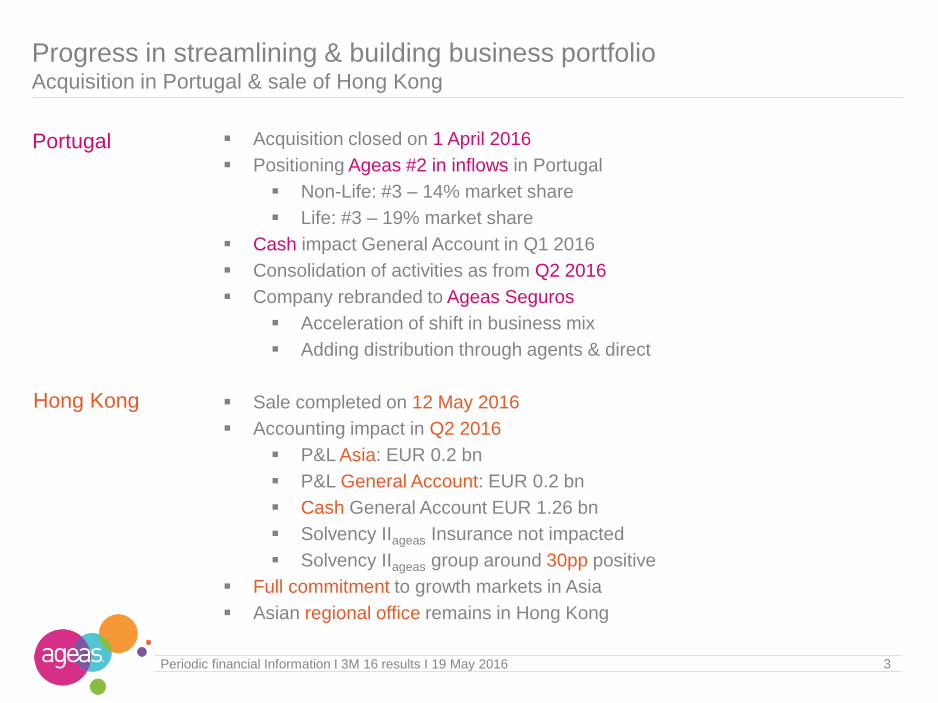
Progress in streamlining & building business portfolioAcquisition in Portugal & sale of Hong Kong
Acquisition closed on 1 April 2016
Positioning Ageas #2 in inflows in Portugal
Non-Life: #3 – 14% market share
Life: #3 – 19% market share
Cash impact General Account in Q1 2016
Consolidation of activities as from Q2 2016
Company rebranded to Ageas Seguros
Acceleration of shift in business mix
Adding distribution through agents & direct
Sale completed on 12 May 2016
Accounting impact in Q2 2016
P&L Asia: EUR 0.2 bn
P&L General Account: EUR 0.2 bn
Cash General Account EUR 1.26 bn
Solvency IIageas Insurance not impacted
Solvency IIageas group around 30pp positive
Full commitment to growth markets in Asia
Asian regional office remains in Hong Kong
Hong Kong
Portugal

Net result: Solid Non-LifeIn EUR mio In EUR bn
Non-Life combined ratio: slightly up on Brussels terrorism events (4pp)
Inflow*: strong Life growth in Asia & Belgium
In EUR bn
Total Insurance: HeadlinesInflow above EUR 11.1 bn - Strong operating performance in all segments
4Periodic financial Information I 3M 16 results I 19 May 2016
Life Technical liabilities up
Operating margin Guaranteed: cap gains on Real Estate in BE
Operating margin Unit-Linked: at break even in CEU
In % avg technical liabilities In % avg technical liabilities
* incl. non-consolidated partnerships @ 100%
In % NEP
148 143
50 58
198 201
3M 15 3M 16
Life Non-Life
8.39.4
1.7
1.710.0
11.1
3M 15 3M 16
Life Non-Life
74.1 75.9
61.1 62.6
135.2 138.5
FY 15 3M 16
conso non-conso
96.6% 97.8%
3M 15 3M 16
0.91%1.03%
3M 15 3M 16
0.39%0.25%
3M 15 3M 16
95.8%99.7%
3M 15 3M 16
5Periodic financial Information I 3M 16 results I 19 May 2016
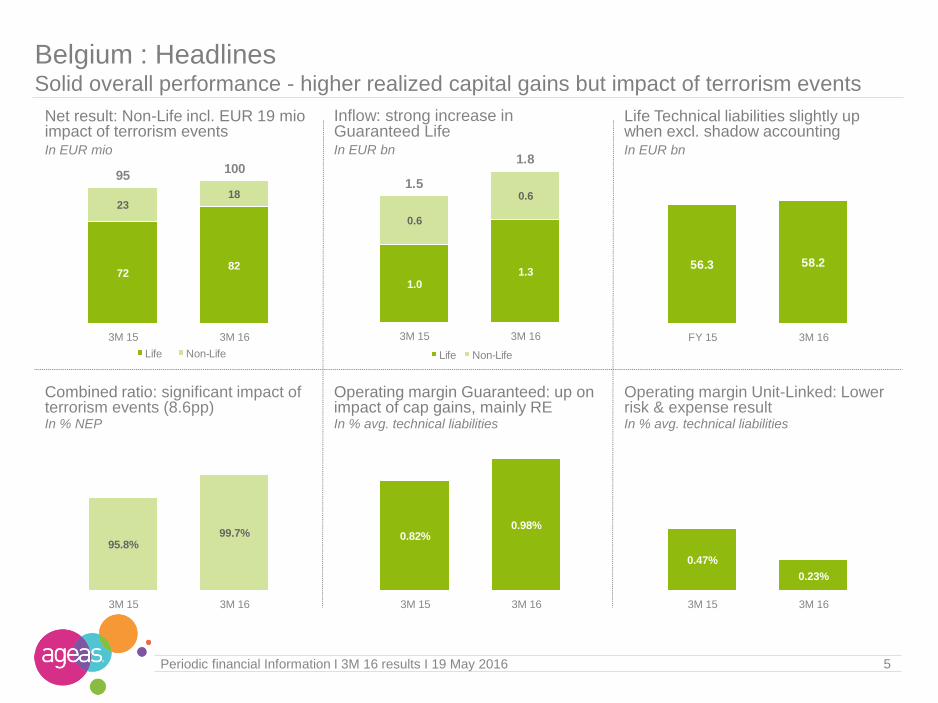
Net result: Non-Life incl. EUR 19 mioimpact of terrorism events In EUR mio In EUR bn In EUR bn
In % avg. technical liabilities In % avg. technical liabilitiesIn % NEP
7282
2318
95100
3M 15 3M 16
Life Non-Life
1.01.3
0.6
0.61.5
1.8
3M 15 3M 16
Life Non-Life
56.3 58.2
FY 15 3M 16
0.82%0.98%
3M 15 3M 16
0.47%
0.23%
3M 15 3M 16
Belgium : HeadlinesSolid overall performance - higher realized capital gains but impact of terrorism events
Inflow: strong increase in Guaranteed Life
Life Technical liabilities slightly up when excl. shadow accounting
Combined ratio: significant impact of terrorism events (8.6pp)
Operating margin Guaranteed: up on impact of cap gains, mainly RE
Operating margin Unit-Linked: Lower risk & expense result
In EUR mio
6Periodic financial Information I 3M 16 results I 19 May 2016
In % NEPIn EUR bn
* incl. non-consolidated partnerships @ 100%
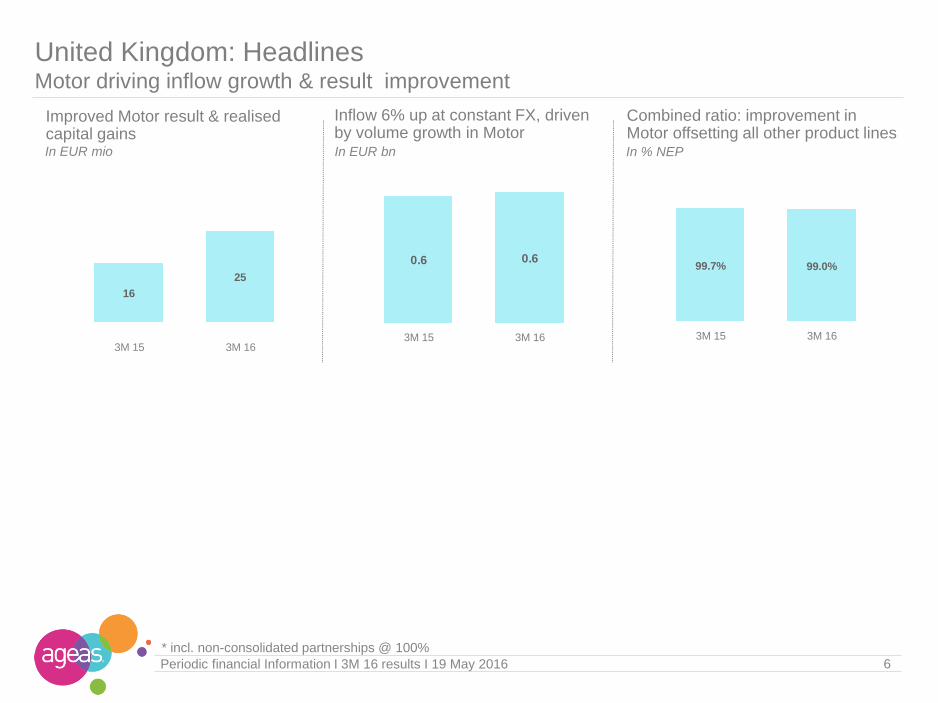
0.6 0.6
3M 15 3M 16
99.7% 99.0%
3M 15 3M 16
United Kingdom: HeadlinesMotor driving inflow growth & result improvement
Improved Motor result & realisedcapital gains
Inflow 6% up at constant FX, driven by volume growth in Motor
Combined ratio: improvement in Motor offsetting all other product lines
16
25
3M 15 3M 16
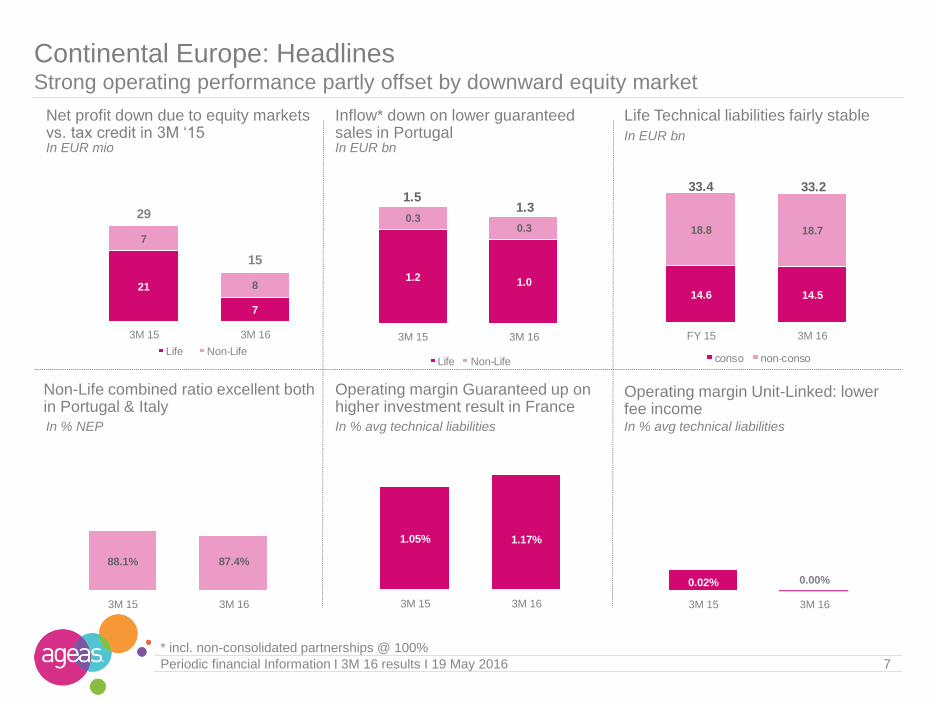
Net profit down due to equity markets vs. tax credit in 3M ‘15In EUR mio In EUR bn
Non-Life combined ratio excellent both in Portugal & Italy
Inflow* down on lower guaranteed sales in Portugal In EUR bn
Continental Europe: Headlines Strong operating performance partly offset by downward equity market
Operating margin Guaranteed up on higher investment result in France
7Periodic financial Information I 3M 16 results I 19 May 2016
Life Technical liabilities fairly stable
In % avg technical liabilities
Operating margin Unit-Linked: lower fee incomeIn % avg technical liabilitiesIn % NEP
* incl. non-consolidated partnerships @ 100%
1.2 1.0
0.30.3
1.51.3
3M 15 3M 16
Life Non-Life
21
7
7
8
29
15
3M 15 3M 16
Life Non-Life
14.6 14.5
18.8 18.7
33.4 33.2
FY 15 3M 16
conso non-conso
88.1% 87.4%
3M 15 3M 16
0.02% 0.00%
3M 15 3M 16
1.05% 1.17%
3M 15 3M 16

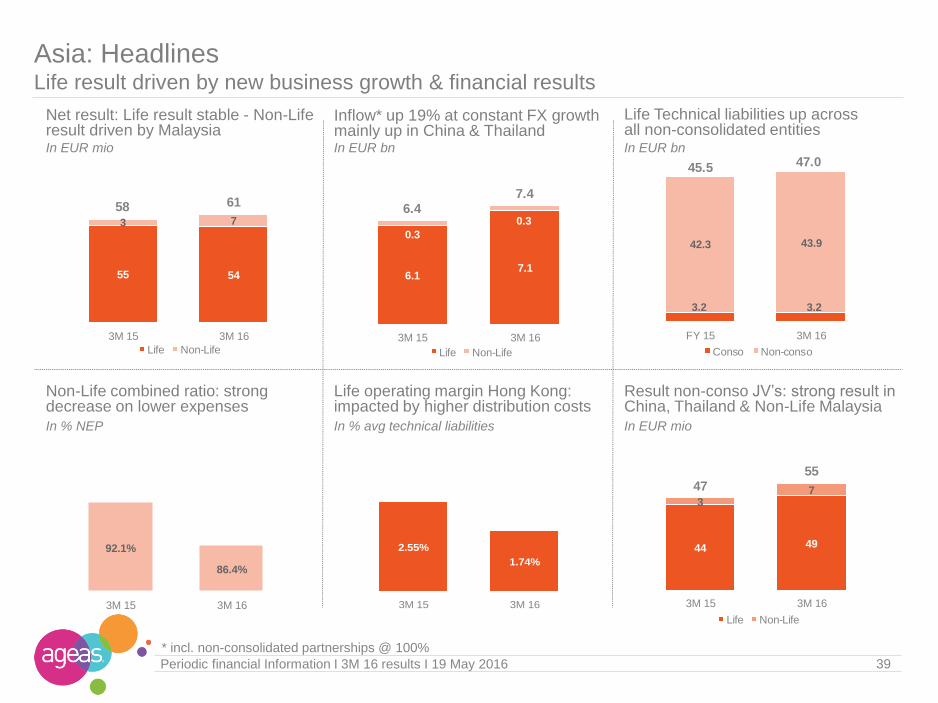
Net result: Life result stable - Non-Life result driven by MalaysiaIn EUR mio In EUR bn
Non-Life combined ratio: strong decrease on lower expenses
Inflow* up 19% at constant FX growth mainly up in China & Thailand
Life Technical liabilities up across all non-consolidated entitiesIn EUR bn
Asia: Headlines Life result driven by new business growth & financial results
8Periodic financial Information I 3M 16 results I 19 May 2016
In % avg technical liabilities In EUR mio
Life operating margin Hong Kong: impacted by higher distribution costs
Result non-conso JV’s: strong result in China, Thailand & Non-Life Malaysia
In % NEP
* incl. non-consolidated partnerships @ 100%
55 54
3 7
58 61
3M 15 3M 16
Life Non-Life
6.17.1
0.3
0.36.4
7.4
3M 15 3M 16
Life Non-Life
92.1%
86.4%
3M 15 3M 16
2.55%
1.74%
3M 15 3M 16
3.2 3.2
42.3 43.9
45.5 47.0
FY 15 3M 16
Conso Non-conso
44 49
3747
55
3M 15 3M 16
Life Non-Life
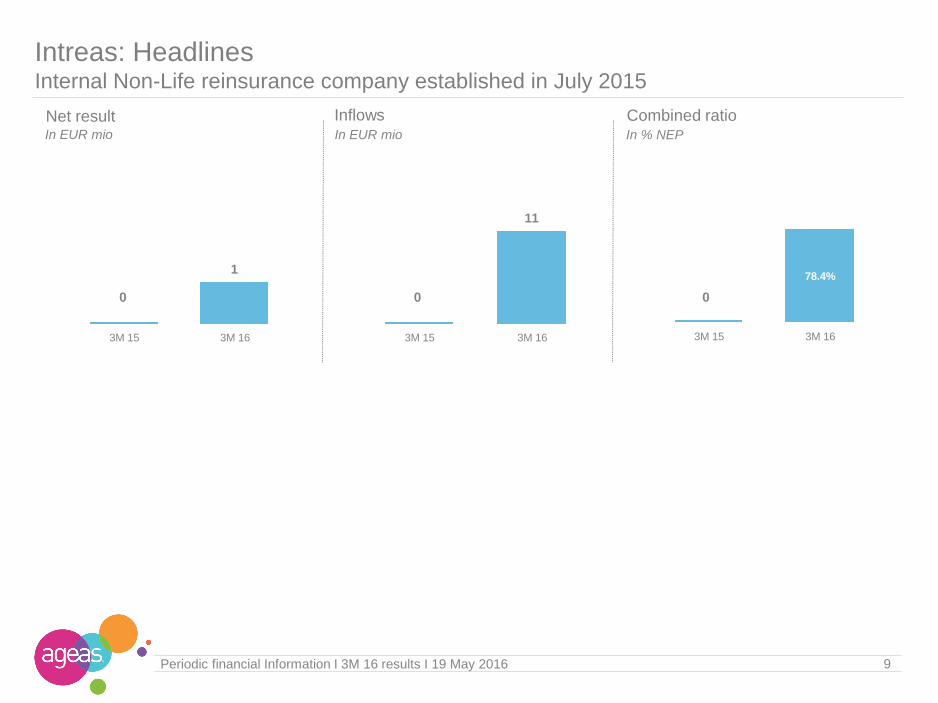
78.4%
3M 15 3M 16
In EUR mio
9Periodic financial Information I 3M 16 results I 19 May 2016
In % NEPIn EUR mio
Intreas: HeadlinesInternal Non-Life reinsurance company established in July 2015
Net result Inflows Combined ratio
1
3M 15 3M 16
11
3M 15 3M 16
0 0 0
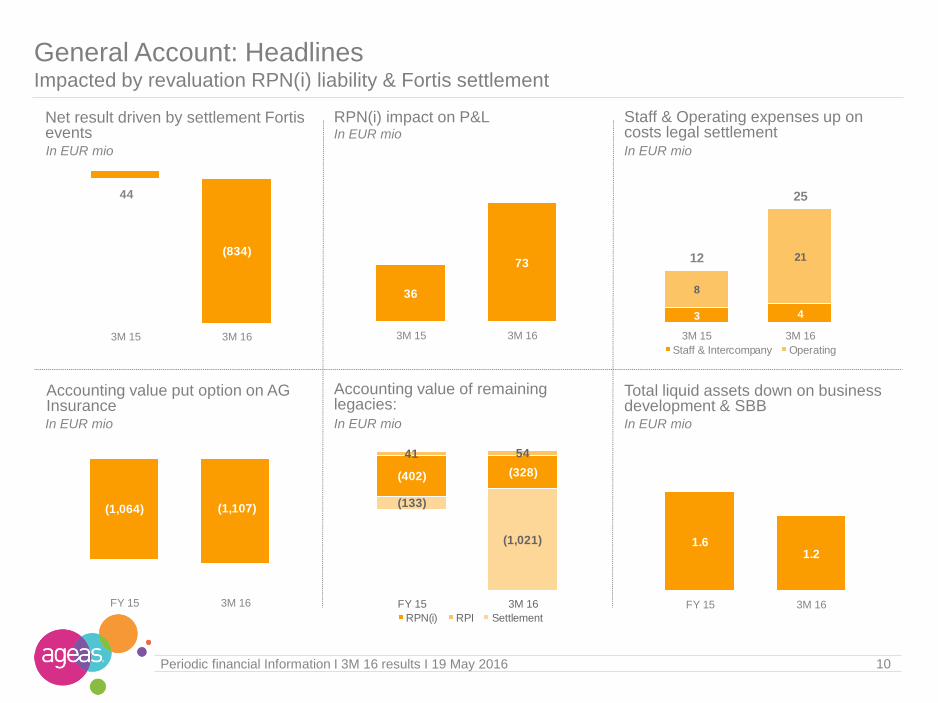
(1,064) (1,107)
FY 15 3M 16
Net result driven by settlement Fortis eventsIn EUR mio
Accounting value of remaining legacies:
General Account: Headlines Impacted by revaluation RPN(i) liability & Fortis settlement
10Periodic financial Information I 3M 16 results I 19 May 2016
Total liquid assets down on business development & SBB
In EUR mio
RPN(i) impact on P&L Staff & Operating expenses up on costs legal settlement
In EUR mio In EUR mio
In EUR mio
44
(834)
3M 15 3M 16
In EUR mio
Accounting value put option on AG Insurance
(402) (328)
41 54
(133)
(1,021)
FY 15 3M 16
RPN(i) RPI Settlement
1.61.2
FY 15 3M 16
36
73
3M 15 3M 16
3 4
8
2112
25
3M 15 3M 16
Staff & Intercompany Operating
11Periodic financial Information I 3M 16 results I 19 May 2016
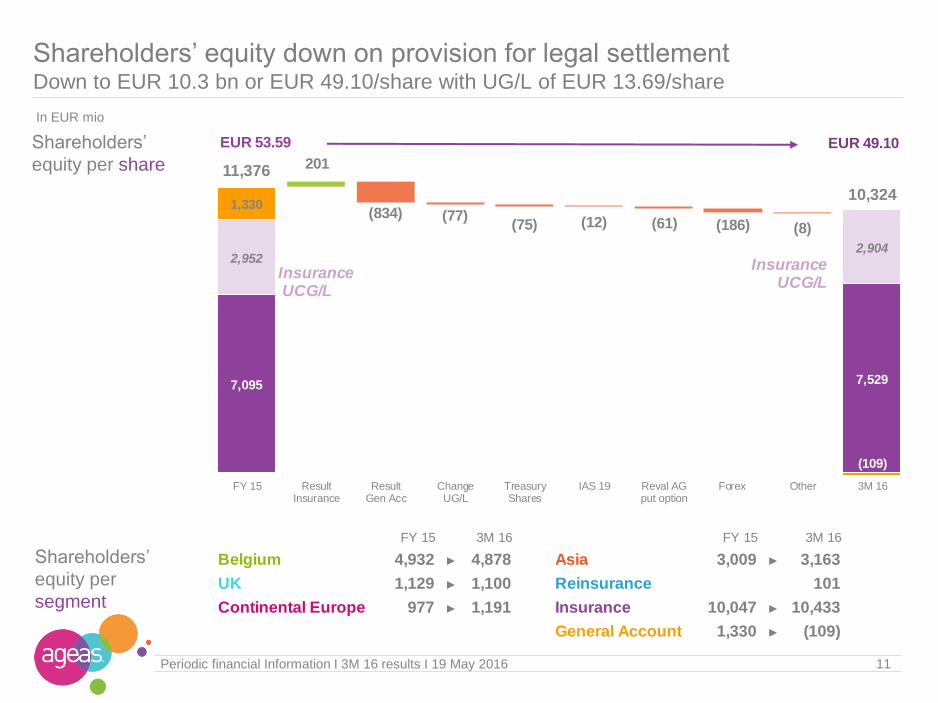
Shareholders’ equity down on provision for legal settlementDown to EUR 10.3 bn or EUR 49.10/share with UG/L of EUR 13.69/share
In EUR mio
7,095 7,529
2,9522,904
1,330
(109)
201
(834) (77)(75) (12) (61) (186) (8)
EUR 53.59 EUR 49.10
11,376
10,324
FY 15 ResultInsurance
ResultGen Acc
ChangeUG/L
TreasuryShares
IAS 19 Reval AGput option
Forex Other 3M 16
InsuranceUCG/L
InsuranceUCG/L
Shareholders’
equity per
segment
Shareholders’
equity per share
FY 15 3M 16 FY 15 3M 16
Belgium 4,932 ► 4,878 Asia 3,009 ► 3,163
UK 1,129 ► 1,100 Reinsurance 101
Continental Europe 977 ► 1,191 Insurance 10,047 ► 10,433
General Account 1,330 ► (109)
Periodic financial Information I 3M 16 results I 19 May 2016
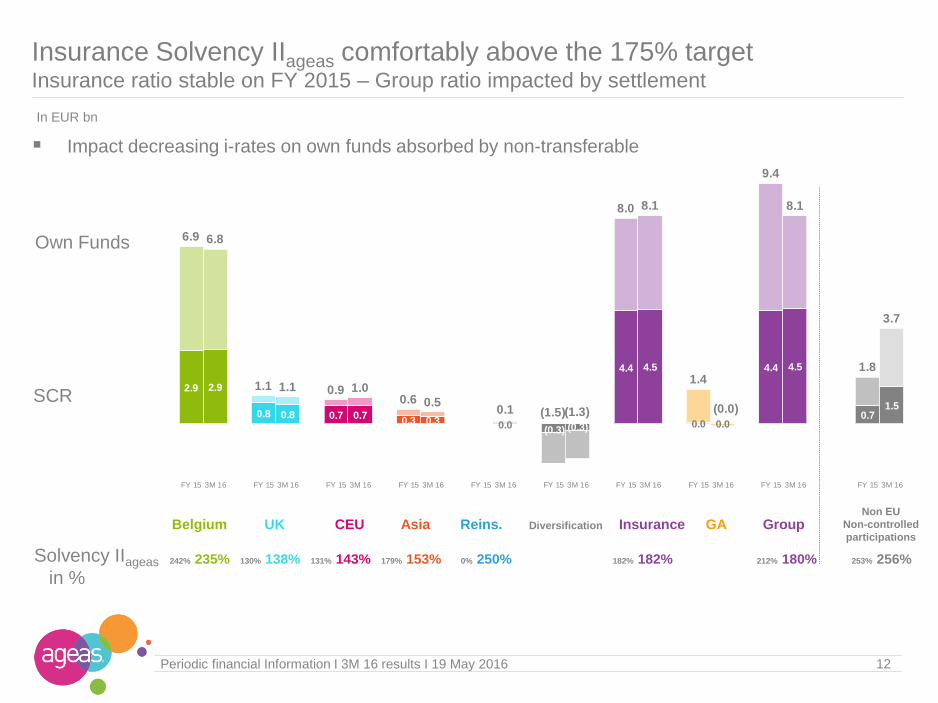
Insurance Solvency IIageas comfortably above the 175% targetInsurance ratio stable on FY 2015 – Group ratio impacted by settlement
Solvency IIageas
in %
In EUR bn
Own Funds
SCR
Non EU
Non-controlled
participationsBelgium UK CEU Asia Reins. Diversification Insurance GA Group
12
242% 235% 130% 138% 131% 143% 179% 153% 0% 250% 182% 182% 212% 180% 253% 256%
2.9 2.9
0.8 0.8 0.7 0.70.3 0.3 0.0
(0.3) (0.3)
4.4 4.5
0.0 0.0
4.4 4.5
0.71.5
6.9 6.8
1.1 1.1 0.9 1.00.6 0.5
0.1 (1.5)(1.3)
8.0 8.1
1.4
(0.0)
9.4
8.1
1.8
3.7
FY 15 3M 16 FY 15 3M 16 FY 15 3M 16 FY 15 3M 16 FY 15 3M 16 FY 15 3M 16 FY 15 3M 16 FY 15 3M 16 FY 15 3M 16 FY 15 3M 16
Impact decreasing i-rates on own funds absorbed by non-transferable

2016 started well- windfalls & setbacks levelled each
other out
Closing sale Hong Kong &
acquisition Portugal
Stable Solvency IIageas
Conclusions: 2016 started well
13Periodic financial Information I 3M 16 results I 19 May 2016
Annexes Insurance Activities
Investment portfolio
General Account
Equity / Solvency
Litigations
General Information
Periodic financial Information I 3M 16 results I 19 May 2016 15
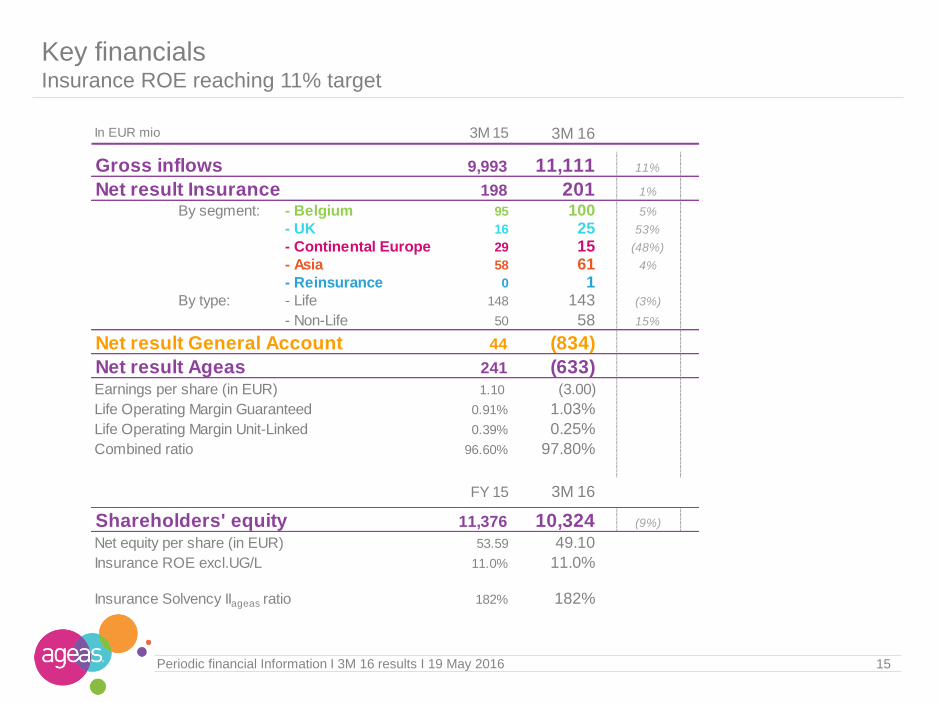
Key financials Insurance ROE reaching 11% target
In EUR mio 3M 15 3M 16
Gross inflows 9,993 11,111 11%
Net result Insurance 198 201 1%
By segment: - Belgium 95 100 5%
- UK 16 25 53%
- Continental Europe 29 15 (48%)
- Asia 58 61 4%
- Reinsurance 0 1By type: - Life 148 143 (3%)
- Non-Life 50 58 15%
Net result General Account 44 (834)
Net result Ageas 241 (633)Earnings per share (in EUR) 1.10 (3.00)
Life Operating Margin Guaranteed 0.91% 1.03%
Life Operating Margin Unit-Linked 0.39% 0.25%
Combined ratio 96.60% 97.80%
FY 15 3M 16
Shareholders' equity 11,376 10,324 (9%)
Net equity per share (in EUR) 53.59 49.10
Insurance ROE excl.UG/L 11.0% 11.0%
Insurance Solvency IIageas ratio 182% 182%

Net result: Solid Non-LifeIn EUR mio In EUR bn
Non-Life combined ratio: slightly up on Brussels terrorism events (4pp)
Inflow*: strong Life growth in Asia & Belgium
In EUR bn
Total Insurance: HeadlinesInflow above EUR 11.1 bn - Strong operating performance in all segments
16Periodic financial Information I 3M 16 results I 19 May 2016
Life Technical liabilities up
Operating margin Guaranteed: cap gains on Real Estate in BE
Operating margin Unit-Linked: at break even in CEU
In % avg technical liabilities In % avg technical liabilities
* incl. non-consolidated partnerships @ 100%
In % NEP
148 143
50 58
198 201
3M 15 3M 16
Life Non-Life
8.39.4
1.7
1.710.0
11.1
3M 15 3M 16
Life Non-Life
74.1 75.9
61.1 62.6
135.2 138.5
FY 15 3M 16
conso non-conso
96.6% 97.8%
3M 15 3M 16
0.91%1.03%
3M 15 3M 16
0.39%0.25%
3M 15 3M 16
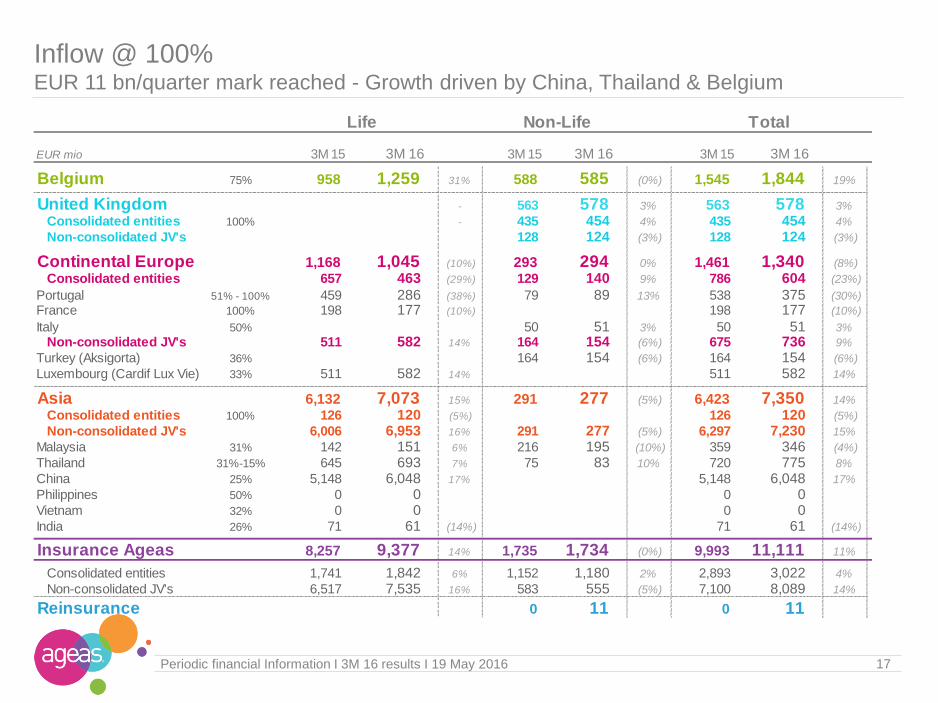
Inflow @ 100% EUR 11 bn/quarter mark reached - Growth driven by China, Thailand & Belgium
17Periodic financial Information I 3M 16 results I 19 May 2016
EUR mio 3M 15 3M 16 3M 15 3M 16 3M 15 3M 16
Belgium 75% 958 1,259 31% 588 585 (0%) 1,545 1,844 19%
United Kingdom - 563 578 3% 563 578 3%
Consolidated entities 100% - 435 454 4% 435 454 4%
Non-consolidated JV's 128 124 (3%) 128 124 (3%)0 0
Continental Europe 1,168 1,045 (10%) 293 294 0% 1,461 1,340 (8%)
Consolidated entities 657 463 (29%) 129 140 9% 786 604 (23%)
Portugal 51% - 100% 459 286 (38%) 79 89 13% 538 375 (30%)
France 100% 198 177 (10%) 198 177 (10%)
Italy 50% 50 51 3% 50 51 3%
Non-consolidated JV's 511 582 14% 164 154 (6%) 675 736 9%
Turkey (Aksigorta) 36% 164 154 (6%) 164 154 (6%)
Luxembourg (Cardif Lux Vie) 33% 511 582 14% 511 582 14%
Asia 6,132 7,073 15% 291 277 (5%) 6,423 7,350 14%
Consolidated entities 100% 126 120 (5%) 126 120 (5%)
Non-consolidated JV's 6,006 6,953 16% 291 277 (5%) 6,297 7,230 15%
Malaysia 31% 142 151 6% 216 195 (10%) 359 346 (4%)
Thailand 31%-15% 645 693 7% 75 83 10% 720 775 8%
China 25% 5,148 6,048 17% 5,148 6,048 17%
Philippines 50% 0 0 0 0 Vietnam 32% 0 0 0 0 India 26% 71 61 (14%) 71 61 (14%)
Insurance Ageas 8,257 9,377 14% 1,735 1,734 (0%) 9,993 11,111 11%#DIV/0! ###### ######
Consolidated entities 1,741 1,842 6% 1,152 1,180 2% 2,893 3,022 4%
Non-consolidated JV's 6,517 7,535 16% 583 555 (5%) 7,100 8,089 14%
Reinsurance 0 11 0 11
Life Non-Life Total
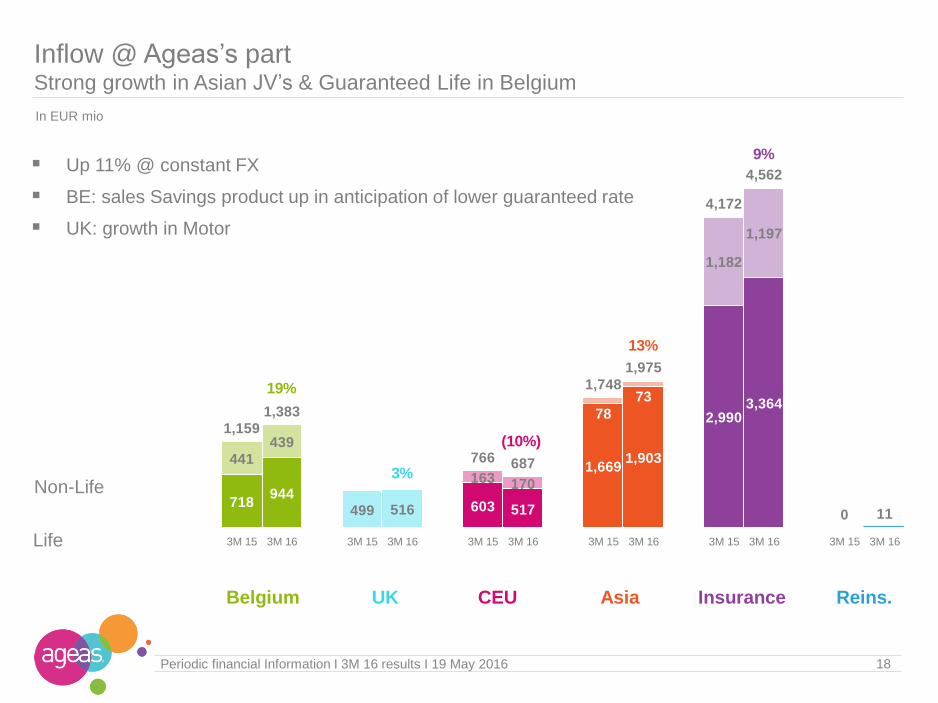
Inflow @ Ageas’s partStrong growth in Asian JV’s & Guaranteed Life in Belgium
In EUR mio
18Periodic financial Information I 3M 16 results I 19 May 2016
718 944
603 517
1,669 1,903
2,990 3,364
0
441
439
499 516
163 170
78
73
1,182
1,197
19%
3%
(10%)
13%
9%
1,159
1,383
766 687
1,748
1,975
4,172
4,562
0 11
3M 15 3M 16 3M 15 3M 16 3M 15 3M 16 3M 15 3M 16 3M 15 3M 16 3M 15 3M 16
Up 11% @ constant FX
BE: sales Savings product up in anticipation of lower guaranteed rate
UK: growth in Motor
Non-Life
Life
Belgium UK CEU Asia Insurance Reins.
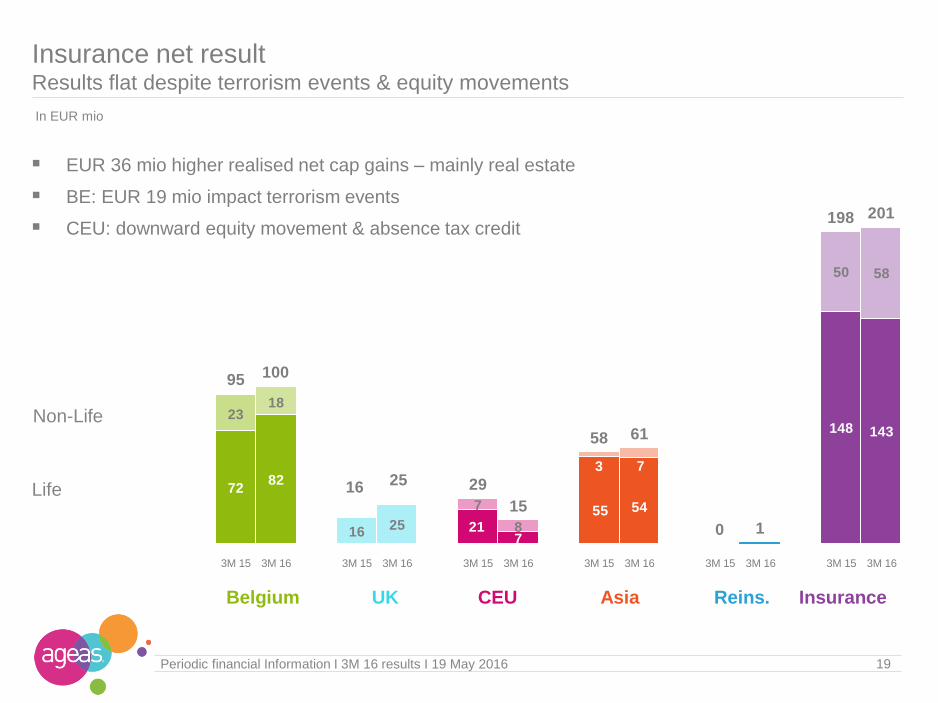
Insurance net resultResults flat despite terrorism events & equity movements
72 82
21 7
55 54
148 143
2318
1625
7
8
3 7
50 58
95 100
16 25 29
15
58 61
0 1
198 201
3M 15 3M 16 3M 15 3M 16 3M 15 3M 16 3M 15 3M 16 3M 15 3M 16 3M 15 3M 16
19Periodic financial Information I 3M 16 results I 19 May 2016
EUR 36 mio higher realised net cap gains – mainly real estate
BE: EUR 19 mio impact terrorism events
CEU: downward equity movement & absence tax credit
Non-Life
Life
Belgium UK CEU Asia Reins. Insurance
In EUR mio
10/03/2010 I page 20
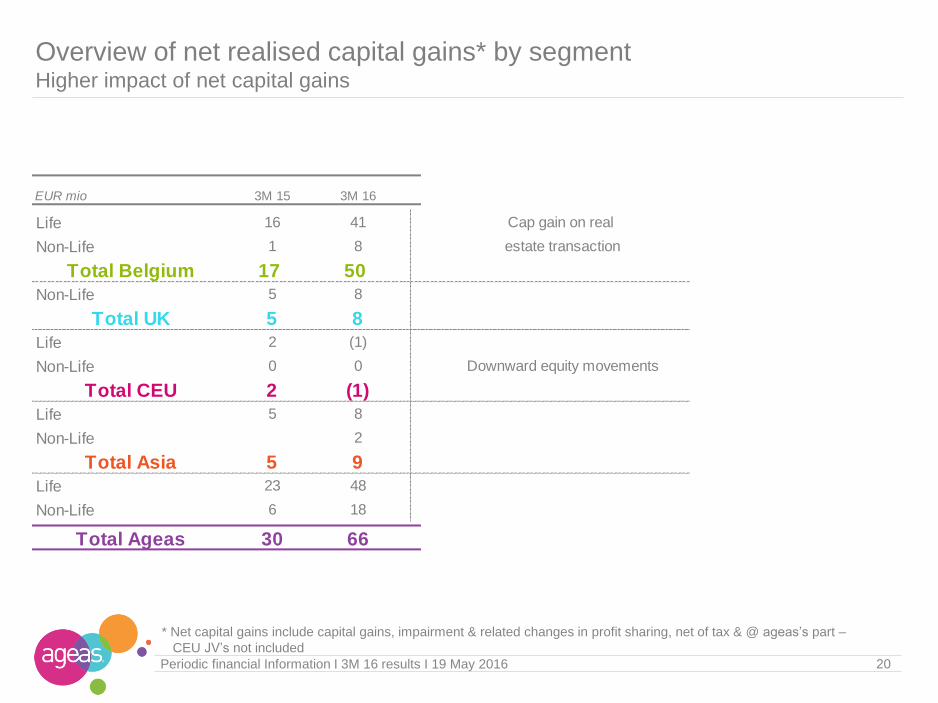
Overview of net realised capital gains* by segmentHigher impact of net capital gains
20Periodic financial Information I 3M 16 results I 19 May 2016
* Net capital gains include capital gains, impairment & related changes in profit sharing, net of tax & @ ageas’s part –
CEU JV’s not included
EUR mio 3M 15 3M 16
Life 16 41 Cap gain on real
Non-Life 1 8 estate transaction
Total Belgium 17 50
Non-Life 5 8
Total UK 5 8
Life 2 (1)
Non-Life 0 0 Downward equity movements
Total CEU 2 (1)
Life 5 8
Non-Life 2
Total Asia 5 9
Life 23 48
Non-Life 6 18
Total Ageas 30 66
21Periodic financial Information I 3M 16 results I 19 May 2016
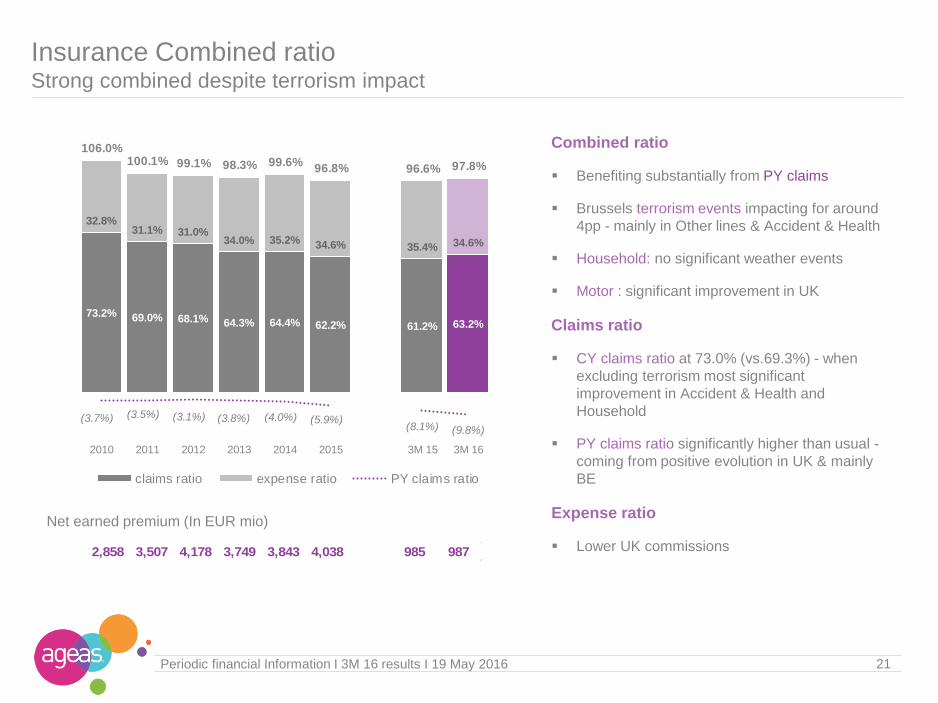
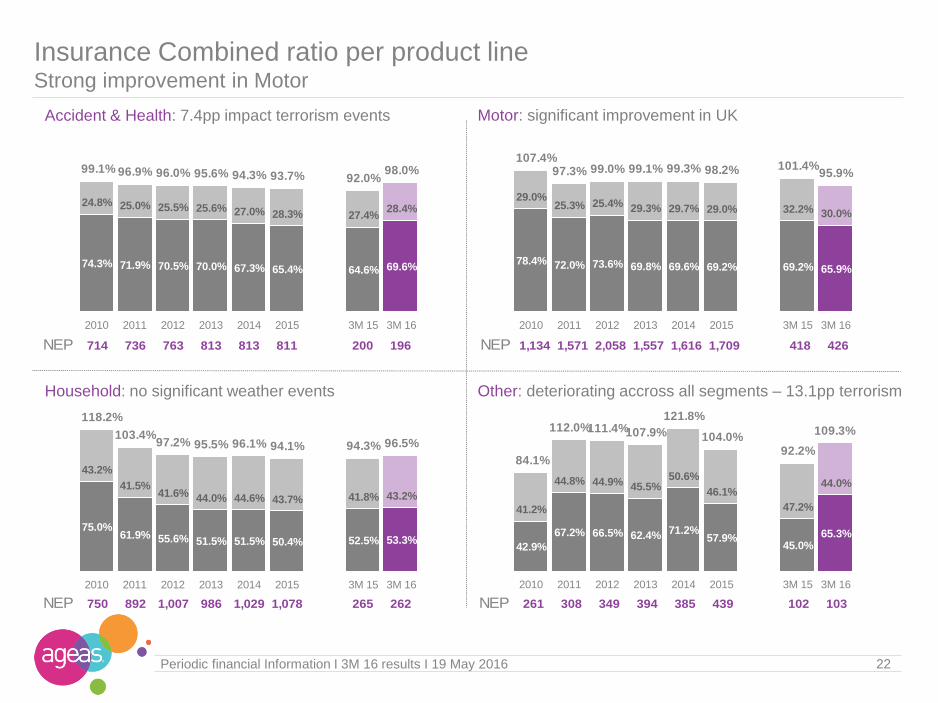
Insurance Combined ratio Strong combined despite terrorism impact
Combined ratio
Benefiting substantially from PY claims
Brussels terrorism events impacting for around
4pp - mainly in Other lines & Accident & Health
Household: no significant weather events
Motor : significant improvement in UK
Claims ratio
CY claims ratio at 73.0% (vs.69.3%) - when
excluding terrorism most significant
improvement in Accident & Health and
Household
PY claims ratio significantly higher than usual -
coming from positive evolution in UK & mainly
BE
Expense ratio
Lower UK commissions
73.2% 69.0% 68.1% 64.3% 64.4% 62.2% 61.2% 63.2%
32.8%31.1% 31.0%
34.0% 35.2% 34.6% 35.4% 34.6%
106.0%100.1% 99.1% 98.3% 99.6%
96.8% 96.6% 97.8%
(3.7%) (3.5%) (3.1%) (3.8%) (4.0%) (5.9%)(8.1%) (9.8%)
2010 2011 2012 2013 2014 2015 3M 15 3M 16
claims ratio expense ratio PY claims ratio
Net earned premium (In EUR mio)
2,858 3,507 4,178 3,749 3,843 4,038 985 987
74.3% 71.9% 70.5% 70.0% 67.3% 65.4% 64.6% 69.6%
24.8% 25.0% 25.5% 25.6% 27.0% 28.3% 27.4%28.4%
99.1% 96.9% 96.0% 95.6% 94.3% 93.7% 92.0%98.0%
2010 2011 2012 2013 2014 2015 3M 15 3M 16
78.4% 72.0% 73.6% 69.8% 69.6% 69.2% 69.2% 65.9%
29.0%25.3% 25.4% 29.3% 29.7% 29.0% 32.2% 30.0%
107.4%97.3% 99.0% 99.1% 99.3% 98.2% 101.4%
95.9%
2010 2011 2012 2013 2014 2015 3M 15 3M 16
75.0%61.9% 55.6% 51.5% 51.5% 50.4% 52.5% 53.3%
43.2%
41.5%41.6% 44.0% 44.6% 43.7% 41.8% 43.2%
118.2%
103.4%97.2% 95.5% 96.1% 94.1% 94.3% 96.5%
2010 2011 2012 2013 2014 2015 3M 15 3M 16
42.9%
67.2% 66.5% 62.4% 71.2%57.9%
45.0%65.3%
41.2%
44.8% 44.9% 45.5%50.6%
46.1%
47.2%
44.0%
84.1%
112.0%111.4%107.9%
121.8%
104.0%92.2%
109.3%
2010 2011 2012 2013 2014 2015 3M 15 3M 16
Insurance Combined ratio per product lineStrong improvement in Motor
Motor: significant improvement in UKAccident & Health: 7.4pp impact terrorism events
Other: deteriorating accross all segments – 13.1pp terrorismHousehold: no significant weather events
22Periodic financial Information I 3M 16 results I 19 May 2016
NEP 714 736 763 813 813 811 200 196 NEP 1,134 1,571 2,058 1,557 1,616 1,709 418 426
NEP 750 892 1,007 986 1,029 1,078 265 262 NEP 261 308 349 394 385 439 102 103
0.11% 0.13% 0.12%0.17% 0.19%
0.10%
0.01%
(0.02%)
0.02%
0.01% 0.02%
0.05%
0.37%
0.18%
0.06%
0.18%0.18%
0.10%
0.48%
0.28%
0.20%
0.36%0.39%
0.25%
2012 2013 2014 2015 3M 15 3M 16
Expense & other m.
Investment m.
Underwriting m.
0.44% 0.43% 0.38% 0.33% 0.37% 0.38%
0.87% 0.83% 0.90%0.80% 0.80%
0.94%
(0.33%) (0.31%)(0.39%)
(0.23%) (0.26%) (0.29%)
0.99% 0.96% 0.89%
0.90% 0.91%
1.03%
2012 2013 2014 2015 3M 15 3M 16
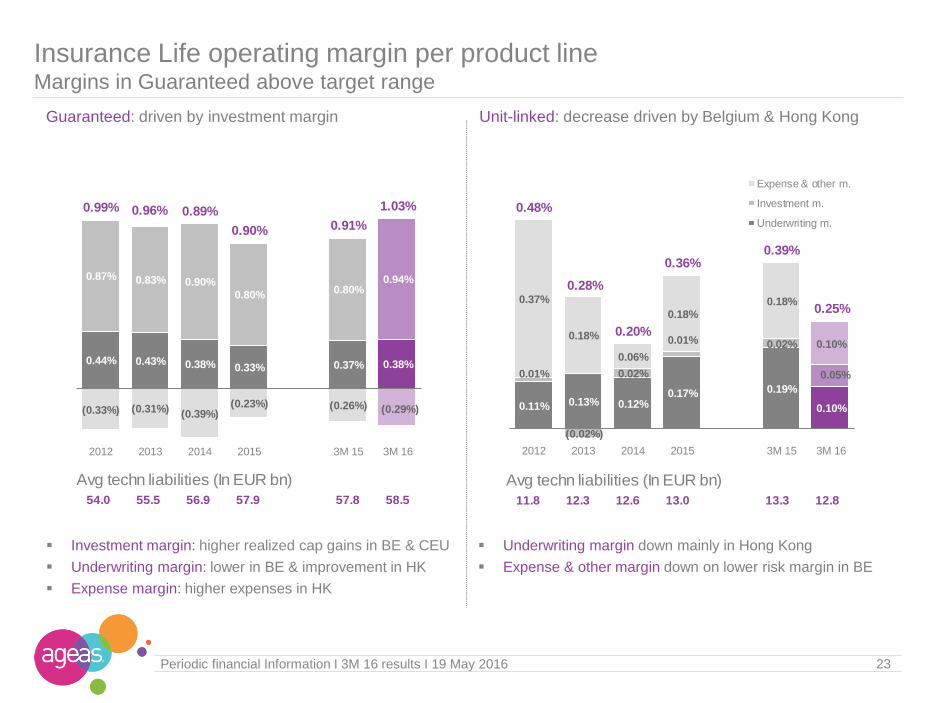
Insurance Life operating margin per product lineMargins in Guaranteed above target range
Guaranteed: driven by investment margin Unit-linked: decrease driven by Belgium & Hong Kong
Underwriting margin down mainly in Hong Kong
Expense & other margin down on lower risk margin in BE
Investment margin: higher realized cap gains in BE & CEU
Underwriting margin: lower in BE & improvement in HK
Expense margin: higher expenses in HK
23Periodic financial Information I 3M 16 results I 19 May 2016
Avg techn liabilities (In EUR bn)
54.0 55.5 56.9 57.9 57.8 58.5
Avg techn liabilities (In EUR bn)
11.8 12.3 12.6 13.0 13.3 12.8

95.8%99.7%
3M 15 3M 16
24Periodic financial Information I 3M 16 results I 19 May 2016
Net result: Non-Life incl. EUR 19 mioimpact of terrorism events In EUR mio In EUR bn In EUR bn
In % avg. technical liabilities In % avg. technical liabilitiesIn % NEP
7282
2318
95100
3M 15 3M 16
Life Non-Life
1.01.3
0.6
0.61.5
1.8
3M 15 3M 16
Life Non-Life
56.3 58.2
FY 15 3M 16
0.82%0.98%
3M 15 3M 16
0.47%
0.23%
3M 15 3M 16
Belgium : HeadlinesSolid overall performance - higher realized capital gains but impact of terrorism events
Inflow: strong increase in Guaranteed Life
Life Technical liabilities slightly up when excl. shadow accounting
Combined ratio: significant impact of terrorism events (8.6pp)
Operating margin Guaranteed: up on impact of cap gains, mainly RE
Operating margin Unit-Linked: Lower risk & expense result
168 164
170 169
187 189
63 63
588 585
3M 15 3M 16
822
1,126
136
133
958
1,259
3M 15 3M 16
+31%
Life
In EUR mio
Non-Life In EUR mio
Unit-Linked
Guaranteed
Other
Household
Accident & Health
Motor
25Periodic financial Information I 3M 16 results I 19 May 2016
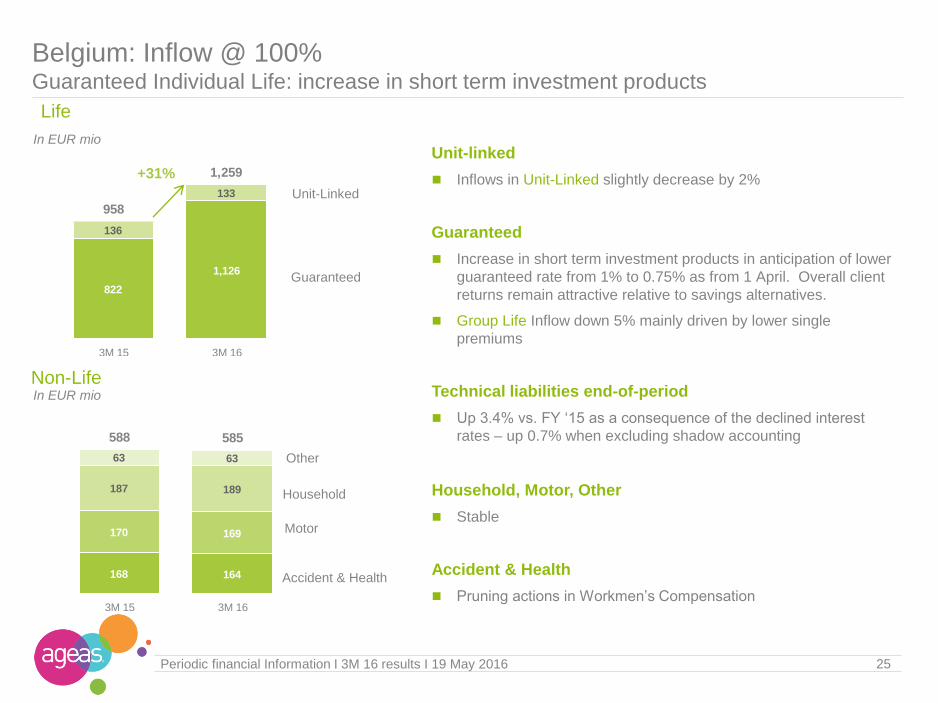
Belgium: Inflow @ 100%Guaranteed Individual Life: increase in short term investment products
Unit-linked
Inflows in Unit-Linked slightly decrease by 2%
Guaranteed
Increase in short term investment products in anticipation of lower
guaranteed rate from 1% to 0.75% as from 1 April. Overall client
returns remain attractive relative to savings alternatives.
Group Life Inflow down 5% mainly driven by lower single
premiums
Technical liabilities end-of-period
Up 3.4% vs. FY ‘15 as a consequence of the declined interest
rates – up 0.7% when excluding shadow accounting
Household, Motor, Other
Stable
Accident & Health
Pruning actions in Workmen’s Compensation

26Periodic financial Information I 3M 16 results I 19 May 2016
Net earned premium (in EUR mio)
68.7% 64.3% 62.7% 63.2% 63.5%56.9% 57.8% 61.4%
36.4%36.8% 36.8% 36.7% 37.7%
37.8% 38.0%38.3%
105.1%101.1% 99.5% 99.9% 101.2%
94.7% 95.8%99.7%
(6.6%) (7.3%) (4.5%) (3.6%) (3.4%)(7.2%)
(13.3%) (16.3%)
2010 2011 2012 2013 2014 2015 3M 15 3M 16
claims ratio expense ratio PY claims ratio
1,541 1,601 1,698 1,785 1,815 1,832 454 451
Belgium: Combined ratio Strongly affected by the Brussels terrorism events & benefiting from PY releases
Combined ratio
Negative impact of 8.6% relating to Brussels
terrorism events of 22 March 2016 partly offset
by higher prior year result
Excl. terrorism, combined ratio of 91.1%;
benefiting from strong PY releases
Claims ratio
CY ratio at 77.7% (vs. 71.1%) - impact terrorism
events mainly in Workmen’s Compensation
(Accident & Health) & Other Lines
PY ratio: strong positive results in all product
lines
Expense ratio stable
75.8% 73.8% 73.0% 73.7% 70.1% 70.4% 68.9% 74.8%
21.9% 23.8% 24.0% 23.8% 25.4% 27.6% 26.9%28.5%
97.7% 97.6% 97.0% 97.5% 95.5% 98.0% 95.8%103.3%
2010 2011 2012 2013 2014 2015 3M 15 3M 16
10.4%
58.2% 65.9% 66.1%87.5%
65.8%53.3%
75.3%
50.9%
49.5%48.1% 47.2%
47.6%
45.0%
45.7%
45.6%
61.3%
107.7%114.0%113.3%
135.1%
110.8%99.0%
120.9%
2010 2011 2012 2013 2014 2015 3M 15 3M 16
75.6%63.0%
50.5% 51.4% 51.7% 43.9%54.0% 52.8%
47.1%
46.9%
46.2% 45.6% 45.7%45.2%
45.5% 45.3%
122.7%
109.9%
96.7% 97.0% 97.4%89.1%
99.5% 98.1%
2010 2011 2012 2013 2014 2015 3M 15 3M 16
27Periodic financial Information I 3M 16 results I 19 May 2016
71.0%58.9% 64.7% 64.7% 62.6% 56.2% 53.4% 54.8%
35.7%
35.3%35.8% 36.3% 37.2%
36.4% 37.3% 36.9%
106.7%
94.2%100.5%
101.0%99.8%
92.6% 90.7% 91.7%
2010 2011 2012 2013 2014 2015 3M 15 3M 16
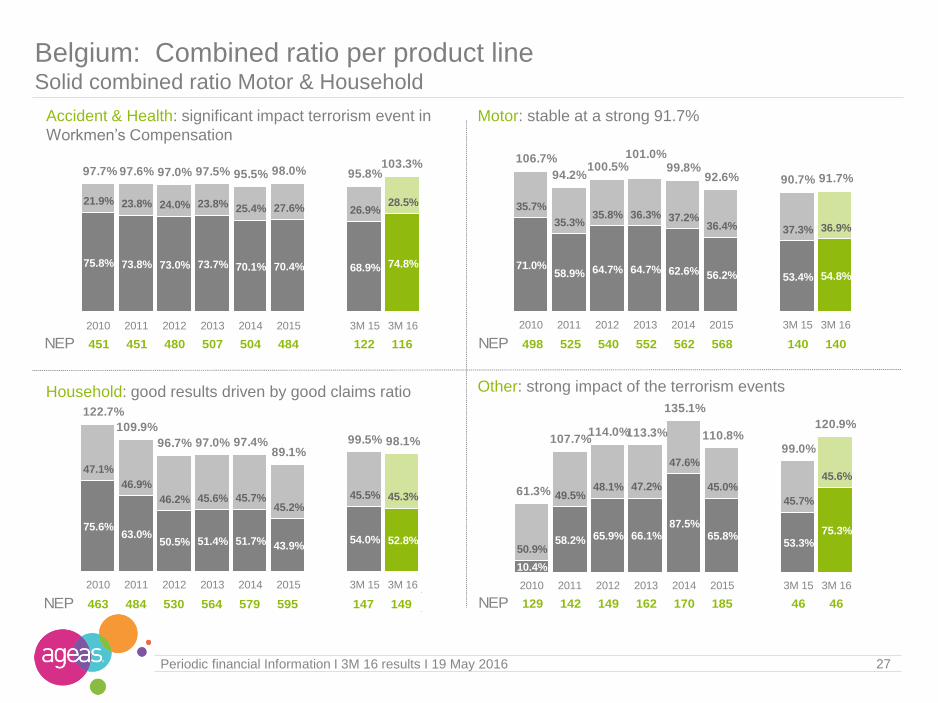
Belgium: Combined ratio per product lineSolid combined ratio Motor & Household
Accident & Health: significant impact terrorism event in
Workmen’s Compensation
Motor: stable at a strong 91.7%
Household: good results driven by good claims ratio Other: strong impact of the terrorism events
NEP 451 451 480 507 504 484 122 116 NEP 498 525 540 552 562 568 140 140
NEP 463 484 530 564 579 595 147 149 NEP 129 142 149 162 170 185 46 46
0.04%
0.04%(0.02%)
0.01%
0.05%
0.44%0.38%
0.32% 0.31%
0.42%
0.23%
0.47%0.41%
0.30% 0.32%
0.47%
0.23%
2012 2013 2014 2015 3M 15 3M 16
Investment m.
Expense & other m.
Underwriting m.
28Periodic financial Information I 3M 16 results I 19 May 2016
0.32% 0.32% 0.30% 0.25% 0.29% 0.27%
0.93% 0.88% 0.95%0.88% 0.84%
1.02%
(0.29%) (0.31%) (0.38%)(0.27%) (0.31%) (0.31%)
0.96% 0.89% 0.87%
0.86% 0.82%
0.98%
2012 2013 2014 2015 3M 15 3M 16
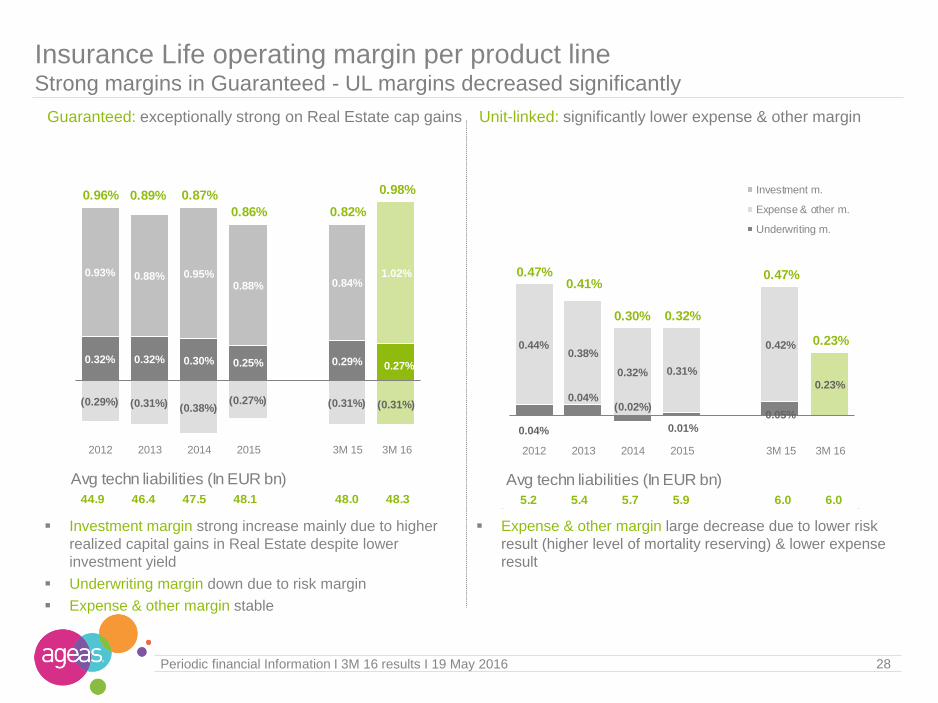
Insurance Life operating margin per product lineStrong margins in Guaranteed - UL margins decreased significantly
Guaranteed: exceptionally strong on Real Estate cap gains Unit-linked: significantly lower expense & other margin
Investment margin strong increase mainly due to higher
realized capital gains in Real Estate despite lower
investment yield
Underwriting margin down due to risk margin
Expense & other margin stable
Expense & other margin large decrease due to lower risk
result (higher level of mortality reserving) & lower expense
result
Avg techn liabilities (In EUR bn)
44.9 46.4 47.5 48.1 48.0 48.3
Avg techn liabilities (In EUR bn)
5.2 5.4 5.7 5.9 6.0 6.0
29
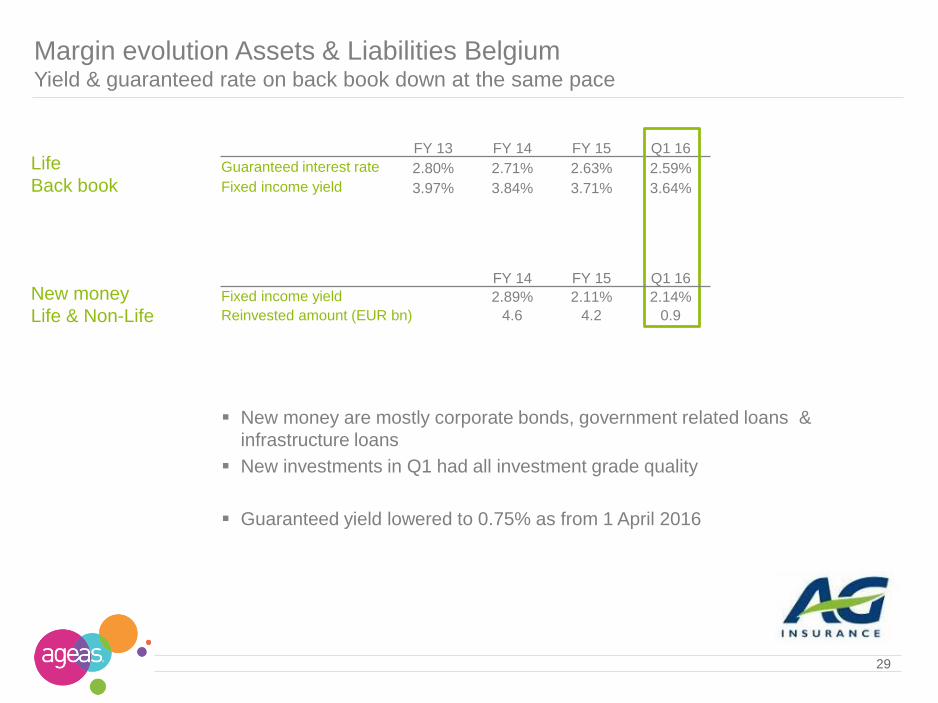
Margin evolution Assets & Liabilities BelgiumYield & guaranteed rate on back book down at the same pace
Life
Back book
FY 13 FY 14 FY 15 Q1 16
Guaranteed interest rate 2.80% 2.71% 2.63% 2.59%
Fixed income yield 3.97% 3.84% 3.71% 3.64%
FY 14 FY 15 Q1 16
Fixed income yield 2.89% 2.11% 2.14%
Reinvested amount (EUR bn) 4.6 4.2 0.9
New money are mostly corporate bonds, government related loans &
infrastructure loans
New investments in Q1 had all investment grade quality
Guaranteed yield lowered to 0.75% as from 1 April 2016
New money
Life & Non-Life
In EUR mio
30Periodic financial Information I 3M 16 results I 19 May 2016
In % NEPIn EUR bn
* incl. non-consolidated partnerships @ 100%
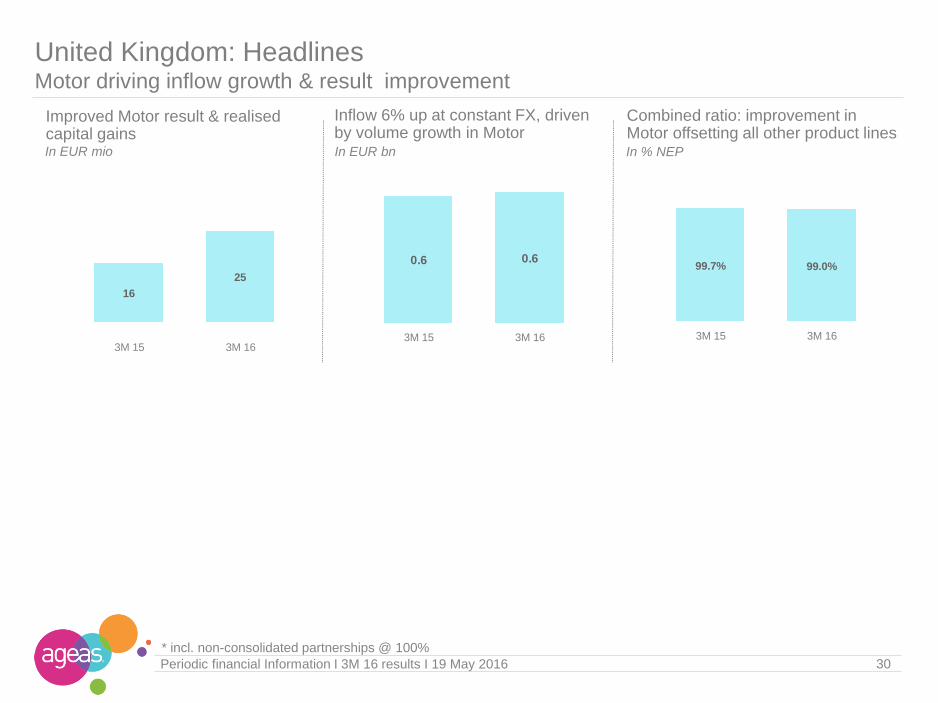
0.6 0.6
3M 15 3M 16
99.7% 99.0%
3M 15 3M 16
United Kingdom: HeadlinesMotor driving inflow growth & result improvement
Improved Motor result & realisedcapital gains
Inflow 6% up at constant FX, driven by volume growth in Motor
Combined ratio: improvement in Motor offsetting all other product lines
16
25
3M 15 3M 16
15 9
367 398
123116
59 55
563 578
3M 15 3M 16
Motor
Other
Household
Accident & Health
In EUR mio
3%
31Periodic financial Information I 3M 16 results I 19 May 2016
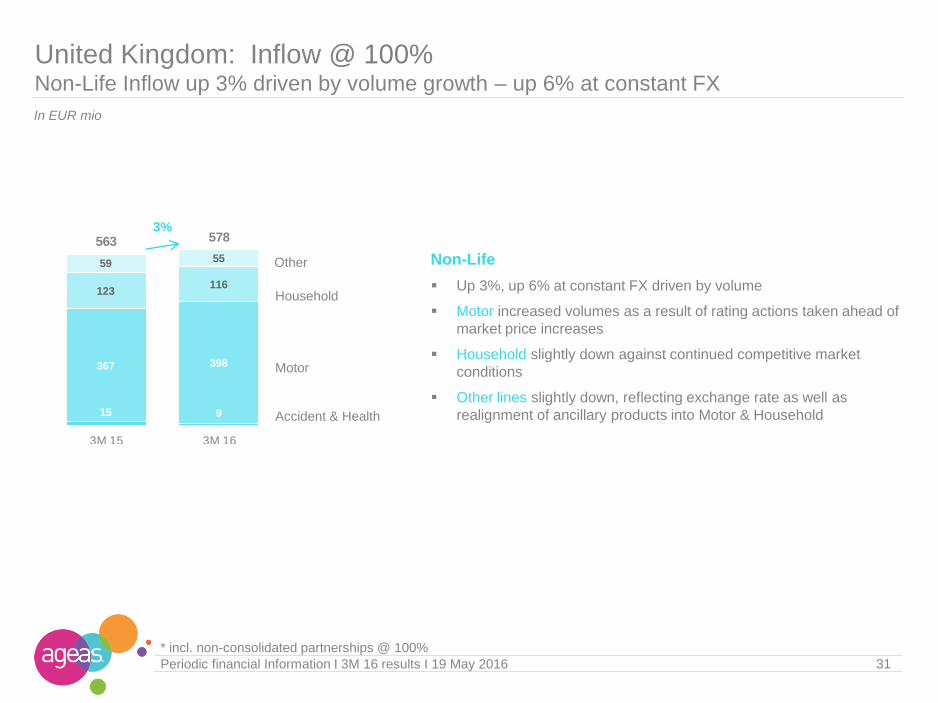
United Kingdom: Inflow @ 100%Non-Life Inflow up 3% driven by volume growth – up 6% at constant FX
Non-Life
Up 3%, up 6% at constant FX driven by volume
Motor increased volumes as a result of rating actions taken ahead of
market price increases
Household slightly down against continued competitive market
conditions
Other lines slightly down, reflecting exchange rate as well as
realignment of ancillary products into Motor & Household
* incl. non-consolidated partnerships @ 100%
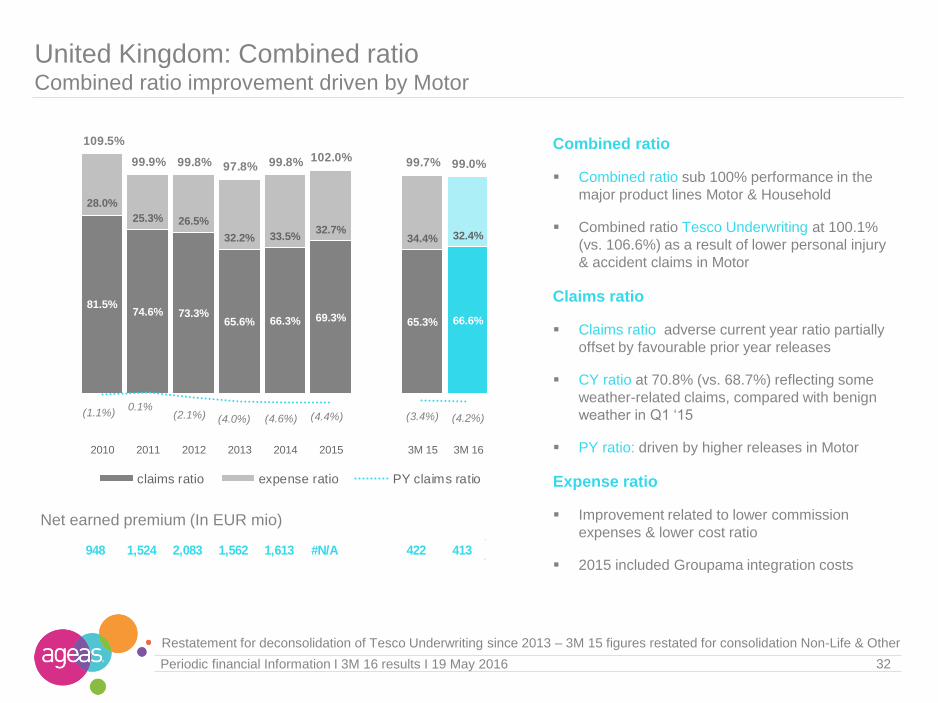
81.5%74.6% 73.3%
65.6% 66.3% 69.3% 65.3% 66.6%
28.0%
25.3% 26.5%
32.2% 33.5%32.7%
34.4% 32.4%
109.5%
99.9% 99.8% 97.8% 99.8% 102.0% 99.7% 99.0%
(1.1%)0.1%
(2.1%) (4.0%) (4.6%) (4.4%) (3.4%) (4.2%)
2010 2011 2012 2013 2014 2015 3M 15 3M 16
claims ratio expense ratio PY claims ratio
32Periodic financial Information I 3M 16 results I 19 May 2016
Net earned premium (In EUR mio)
948 1,524 2,083 1,562 1,613 #N/A 422 413
United Kingdom: Combined ratio Combined ratio improvement driven by Motor
Combined ratio
Combined ratio sub 100% performance in the
major product lines Motor & Household
Combined ratio Tesco Underwriting at 100.1%
(vs. 106.6%) as a result of lower personal injury
& accident claims in Motor
Claims ratio
Claims ratio adverse current year ratio partially
offset by favourable prior year releases
CY ratio at 70.8% (vs. 68.7%) reflecting some
weather-related claims, compared with benign
weather in Q1 ‘15
PY ratio: driven by higher releases in Motor
Expense ratio
Improvement related to lower commission
expenses & lower cost ratio
2015 included Groupama integration costs
Restatement for deconsolidation of Tesco Underwriting since 2013 – 3M 15 figures restated for consolidation Non-Life & Other

97.9%87.7%
78.1% 76.2%66.0%
55.8% 54.1% 58.5%
24.0%23.2%
28.2% 34.3%38.7%
43.6% 49.6%50.6%
121.9%110.9%
106.3%110.5%104.7%
99.4% 103.7%109.1%
2010 2011 2012 2013 2014 2015 3M 15 3M 16
82.9% 79.2% 77.2% 71.9% 74.6% 76.0% 77.1% 72.4%
23.3% 19.5% 21.3%25.0% 25.1% 24.7% 29.3%
26.3%
106.2%
98.7% 98.5% 96.9% 99.7%100.7%106.4%
98.7%
2010 2011 2012 2013 2014 2015 3M 15 3M 16
77.4%61.4% 62.3%
51.4% 51.0%62.2%
49.8% 53.3%
38.2%
35.3% 36.7%42.4% 43.3%
43.0%
37.6% 41.6%
115.6%
96.7%99.0%
93.8% 94.3%105.2%
87.4%94.9%
2010 2011 2012 2013 2014 2015 3M 15 3M 16
75.1% 71.6% 67.7% 59.8% 56.0% 55.5%40.0%
62.4%
30.4% 39.3% 42.1%44.4% 54.3% 47.8%
49.9%
44.0%
105.5%110.9%109.8%104.2%
110.3%103.3%
89.9%
106.4%
2010 2011 2012 2013 2014 2015 3M 15 3M 16
33Periodic financial Information I 3M 16 results I 19 May 2016
United Kingdom: Combined ratio per product lineImproved Motor loss ratio offsetting other product lines
Accident & Health: higher claims & lower volumes Motor: higher PY releases & lower expenses
Household: very benign Q1 ‘15 Other: lower PY releases & absence of integration costs
NEP 58 65 57 79 71 72 15 10 NEP 532 949 1,420 907 958 1,047 255 262
NEP 248 366 434 374 399 413 104 93 NEP 110 143 173 202 185 220 48 48
Restatement for deconsolidation of Tesco Underwriting since 2013 – 3M 15 figures restated for consolidation Non-Life & Other

Net profit down due to equity markets vs. tax credit in 3M ‘15In EUR mio In EUR bn
Non-Life combined ratio excellent both in Portugal & Italy
Inflow* down on lower guaranteed sales in Portugal In EUR bn
Continental Europe: Headlines Strong operating performance partly offset by downward equity market
Operating margin Guaranteed up on higher investment result in France
34Periodic financial Information I 3M 16 results I 19 May 2016
Life Technical liabilities fairly stable
In % avg technical liabilities
Operating margin Unit-Linked: lower fee incomeIn % avg technical liabilitiesIn % NEP
* incl. non-consolidated partnerships @ 100%
1.2 1.0
0.30.3
1.51.3
3M 15 3M 16
Life Non-Life
21
7
7
8
29
15
3M 15 3M 16
Life Non-Life
14.6 14.5
18.8 18.7
33.4 33.2
FY 15 3M 16
conso non-conso
88.1% 87.4%
3M 15 3M 16
0.02% 0.00%
3M 15 3M 16
1.05% 1.17%
3M 15 3M 16
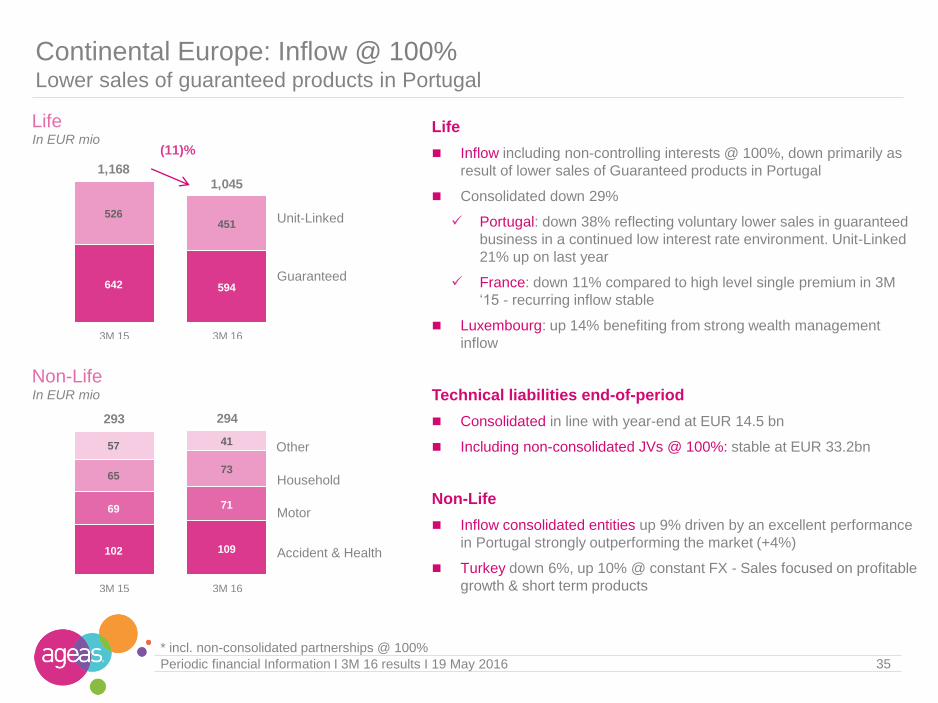
642 594
526451
1,1681,045
3M 15 3M 16
102 109
69 71
6573
57 41
293 294
3M 15 3M 16
(11)%
Life In EUR mio
Non-Life In EUR mio
Continental Europe: Inflow @ 100%Lower sales of guaranteed products in Portugal
35Periodic financial Information I 3M 16 results I 19 May 2016
Unit-Linked
Guaranteed
Other
Household
Accident & Health
Motor
Life
Inflow including non-controlling interests @ 100%, down primarily as
result of lower sales of Guaranteed products in Portugal
Consolidated down 29%
Portugal: down 38% reflecting voluntary lower sales in guaranteed
business in a continued low interest rate environment. Unit-Linked
21% up on last year
France: down 11% compared to high level single premium in 3M
‘15 - recurring inflow stable
Luxembourg: up 14% benefiting from strong wealth management
inflow
Technical liabilities end-of-period
Consolidated in line with year-end at EUR 14.5 bn
Including non-consolidated JVs @ 100%: stable at EUR 33.2bn
Non-Life
Inflow consolidated entities up 9% driven by an excellent performance
in Portugal strongly outperforming the market (+4%)
Turkey down 6%, up 10% @ constant FX - Sales focused on profitable
growth & short term products
* incl. non-consolidated partnerships @ 100%
36Periodic financial Information I 3M 16 results I 19 May 2016
Continental Europe: Combined ratio Excellent combined ratio well below group target
Net earned premium (In EUR mio)
* Scope: only consolidated companies
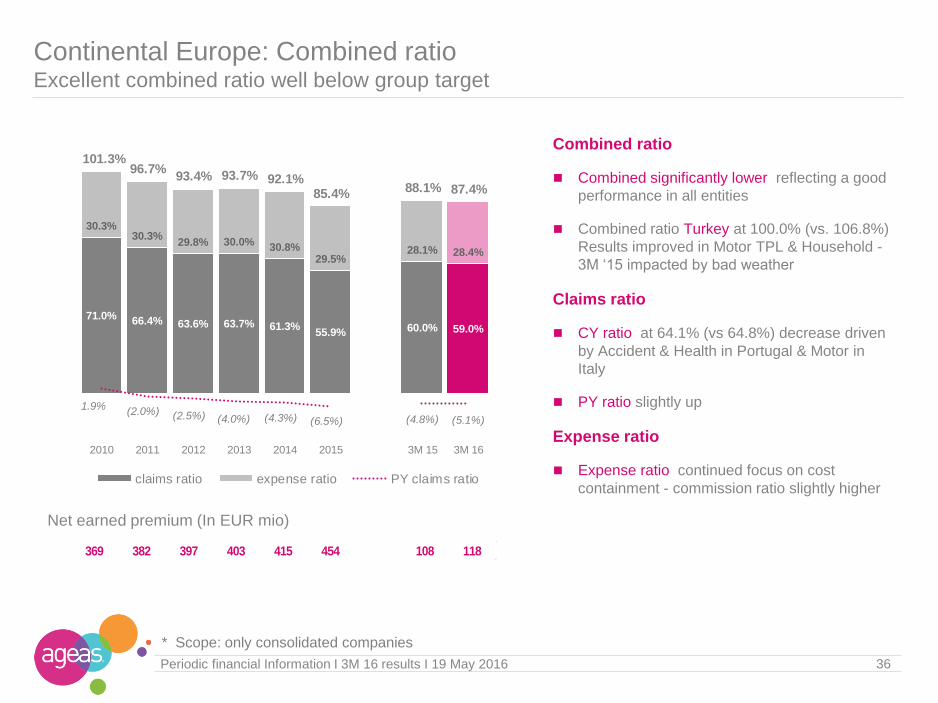
369 382 397 403 415 454 108 118
Combined ratio
Combined significantly lower reflecting a good
performance in all entities
Combined ratio Turkey at 100.0% (vs. 106.8%)
Results improved in Motor TPL & Household -
3M ‘15 impacted by bad weather
Claims ratio
CY ratio at 64.1% (vs 64.8%) decrease driven
by Accident & Health in Portugal & Motor in
Italy
PY ratio slightly up
Expense ratio
Expense ratio continued focus on cost
containment - commission ratio slightly higher
71.0% 66.4% 63.6% 63.7% 61.3%55.9% 60.0% 59.0%
30.3%30.3%
29.8% 30.0%30.8%
29.5%28.1% 28.4%
101.3%96.7%
93.4% 93.7% 92.1%85.4% 88.1% 87.4%
1.9%(2.0%) (2.5%) (4.0%) (4.3%) (6.5%) (4.8%) (5.1%)
2010 2011 2012 2013 2014 2015 3M 15 3M 16
claims ratio expense ratio PY claims ratio

64.2% 63.5% 63.3% 59.7% 61.9% 58.8% 58.7% 62.5%
31.6% 27.8% 28.2% 26.6% 26.7% 25.2% 23.1% 25.0%
95.8%91.3% 91.5%
86.3% 88.6%84.0% 81.8%
87.5%
2010 2011 2012 2013 2014 2015 3M 15 3M 16
90.5%71.8% 69.8%
79.3%60.1%
71.5% 77.1%59.1%
27.0%
29.2% 28.1%29.2%
31.6%
32.3%33.2%
30.2%
117.5%
101.0%97.9%108.5%
91.7%
103.8%110.3%
89.3%
2010 2011 2012 2013 2014 2015 3M 15 3M 16
53.5% 53.7% 51.8% 53.5% 54.0%36.1%
55.7% 55.4%
27.7% 34.2% 33.5% 38.8% 40.3%
35.9%
35.6% 33.9%
81.2%87.9% 85.3%
92.3% 94.3%
72.0%
91.3% 89.3%
2010 2011 2012 2013 2014 2015 3M 15 3M 16
73.3%94.5%
62.8% 59.6%72.3%
31.7% 27.4% 36.6%
39.0%
50.0%
43.3% 43.7%
45.1%
40.8% 39.3%40.5%
112.3%
144.5%
106.1%103.3%
117.4%
72.5%66.7%
77.1%
2010 2011 2012 2013 2014 2015 3M 15 3M 16
Continental Europe: Combined ratio per product lineFavourable claims experience
Motor: improving claims & expenses in ItalyAccident & Health: lower PY development
Household: good claims ratio in Italy partly offset by 1
large claim & storms in Portugal
Other: Release of provison on 2 old claims in Q1 ‘15
37Periodic financial Information I 3M 16 results I 19 May 2016
NEP 205 220 226 227 238 255 63 69 NEP 104 97 99 99 96 94 23 23
NEP 39 42 44 48 51 70 15 17 NEP 21 23 28 29 30 35 8 9
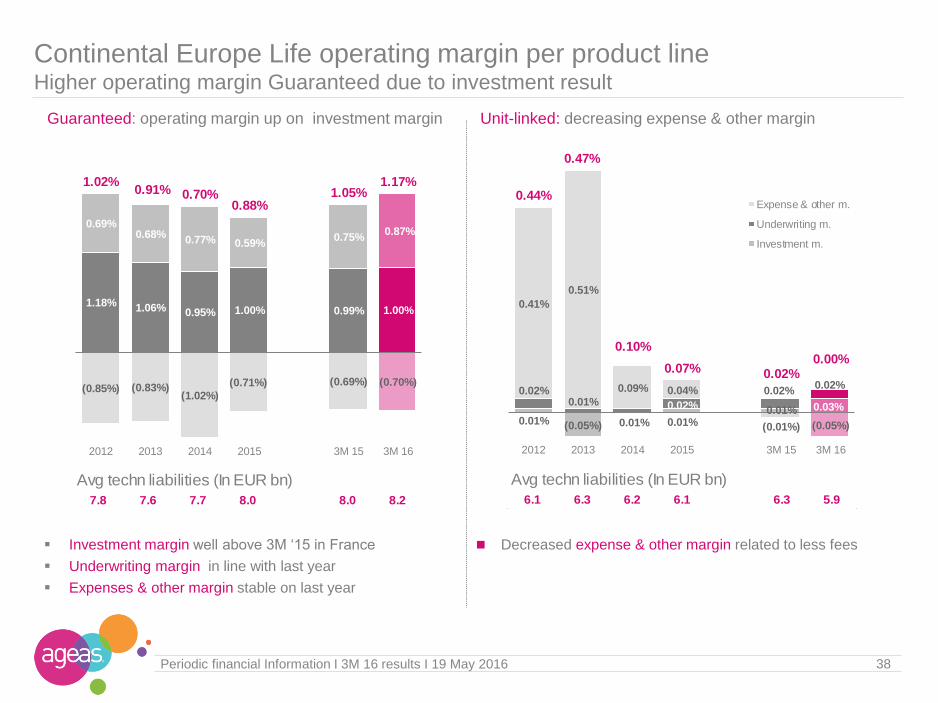
Continental Europe Life operating margin per product lineHigher operating margin Guaranteed due to investment result
Guaranteed: operating margin up on investment margin Unit-linked: decreasing expense & other margin
38Periodic financial Information I 3M 16 results I 19 May 2016
Decreased expense & other margin related to less fees Investment margin well above 3M ‘15 in France
Underwriting margin in line with last year
Expenses & other margin stable on last year
1.18% 1.06% 0.95% 1.00% 0.99% 1.00%
0.69%0.68%
0.77% 0.59%0.75%
0.87%
(0.85%) (0.83%)(1.02%)
(0.71%) (0.69%) (0.70%)
1.02%0.91% 0.70%
0.88%1.05%
1.17%
2012 2013 2014 2015 3M 15 3M 16
0.01% (0.05%) 0.01%0.01% 0.03%
0.02%0.01%
0.01%
0.02%
0.02%0.02%
0.41%
0.51%
0.09% 0.04%
(0.01%) (0.05%)
0.44%
0.47%
0.10%
0.07% 0.02%0.00%
2012 2013 2014 2015 3M 15 3M 16
Expense & other m.
Underwriting m.
Investment m.
Avg techn liabilities (In EUR bn)
7.8 7.6 7.7 8.0 8.0 8.2
Avg techn liabilities (In EUR bn)
6.1 6.3 6.2 6.1 6.3 5.9
Net result: Life result stable - Non-Life result driven by MalaysiaIn EUR mio In EUR bn
Non-Life combined ratio: strong decrease on lower expenses
Inflow* up 19% at constant FX growth mainly up in China & Thailand
Life Technical liabilities up across all non-consolidated entitiesIn EUR bn
Asia: Headlines Life result driven by new business growth & financial results
39Periodic financial Information I 3M 16 results I 19 May 2016
In % avg technical liabilities In EUR mio
Life operating margin Hong Kong: impacted by higher distribution costs
Result non-conso JV’s: strong result in China, Thailand & Non-Life Malaysia
In % NEP
* incl. non-consolidated partnerships @ 100%
55 54
3 7
58 61
3M 15 3M 16
Life Non-Life
6.17.1
0.3
0.36.4
7.4
3M 15 3M 16
Life Non-Life
92.1%
86.4%
3M 15 3M 16
2.55%
1.74%
3M 15 3M 16
3.2 3.2
42.3 43.9
45.5 47.0
FY 15 3M 16
Conso Non-conso
44 49
3747
55
3M 15 3M 16
Life Non-Life
+15%
-5%
Household
Motor
Guaranteed
Life
Non-Life In EUR mio
In EUR mio
Unit-Linked
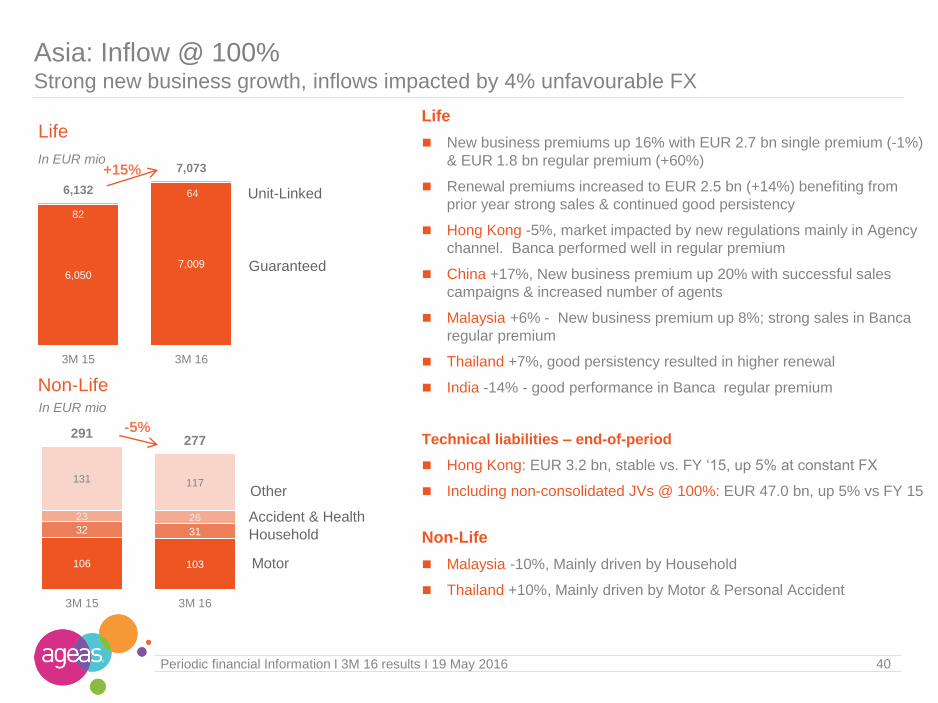
Asia: Inflow @ 100%Strong new business growth, inflows impacted by 4% unfavourable FX
Accident & Health
Other
40Periodic financial Information I 3M 16 results I 19 May 2016
6,0507,009
82
646,132
7,073
3M 15 3M 16
106 103
32 31
23 26
131 117
291277
3M 15 3M 16
Life
New business premiums up 16% with EUR 2.7 bn single premium (-1%)
& EUR 1.8 bn regular premium (+60%)
Renewal premiums increased to EUR 2.5 bn (+14%) benefiting from
prior year strong sales & continued good persistency
Hong Kong -5%, market impacted by new regulations mainly in Agency
channel. Banca performed well in regular premium
China +17%, New business premium up 20% with successful sales
campaigns & increased number of agents
Malaysia +6% - New business premium up 8%; strong sales in Banca
regular premium
Thailand +7%, good persistency resulted in higher renewal
India -14% - good performance in Banca regular premium
Technical liabilities – end-of-period
Hong Kong: EUR 3.2 bn, stable vs. FY ‘15, up 5% at constant FX
Including non-consolidated JVs @ 100%: EUR 47.0 bn, up 5% vs FY 15
Non-Life
Malaysia -10%, Mainly driven by Household
Thailand +10%, Mainly driven by Motor & Personal Accident

Hong Kong Life operating margin per product lineOperating margin affected by impairments & higher expenses
Guaranteed: impacted by equity impairments Unit-linked: lower surrender margin
41Periodic financial Information I 3M 16 results I 19 May 2016
Underwriting margin deteriorated due to lower surrender
margin
Expense & Other margin improved following shift towards
products with lower new business strain
Investment margin deteriorated due to equities impairments
Underwriting margin improved on better claims experience
(net of reinsurance) & improved surrender margin
Expense & Other margin lower due to higher expense &
distribution costs
(0.15%) (0.32%)(0.47%) (0.43%) (0.47%)
0.44%
(0.11%)
0.27%0.11%
(0.33%) (0.09%)
(0.76%)
2.52%
4.19%
3.13%
2.65%
3.28%1.93%
2.26%
4.14%
2.77%
1.89%
2.72%
1.61%
2012 2013 2014 2015 3M 15 3M 16
2.13%2.15%
2.07% 2.23% 2.15%
1.31%
(0.95%)
(5.01%)
(2.06%)
0.17%
(0.05%)
0.23%
0.20%
0.17%0.15%
0.47%
1.18% (2.86%) 0.21%
2.57%2.25% 2.01%
2012 2013 2014 2015 3M 15 3M 16
Investment m.
Expense & other m.
Underwriting m.
Avg techn liabilities (In EUR bn)
0.5 0.6 0.7 0.9 1.0 0.9
Avg techn liabilities (In EUR bn)
1.3 1.3 1.4 1.9 1.8 2.0

Annexes Insurance Activities
Investment portfolio
General Account
Equity / Solvency
Litigations
General Information
43Periodic financial Information I 3M 16 results I 19 May 2016
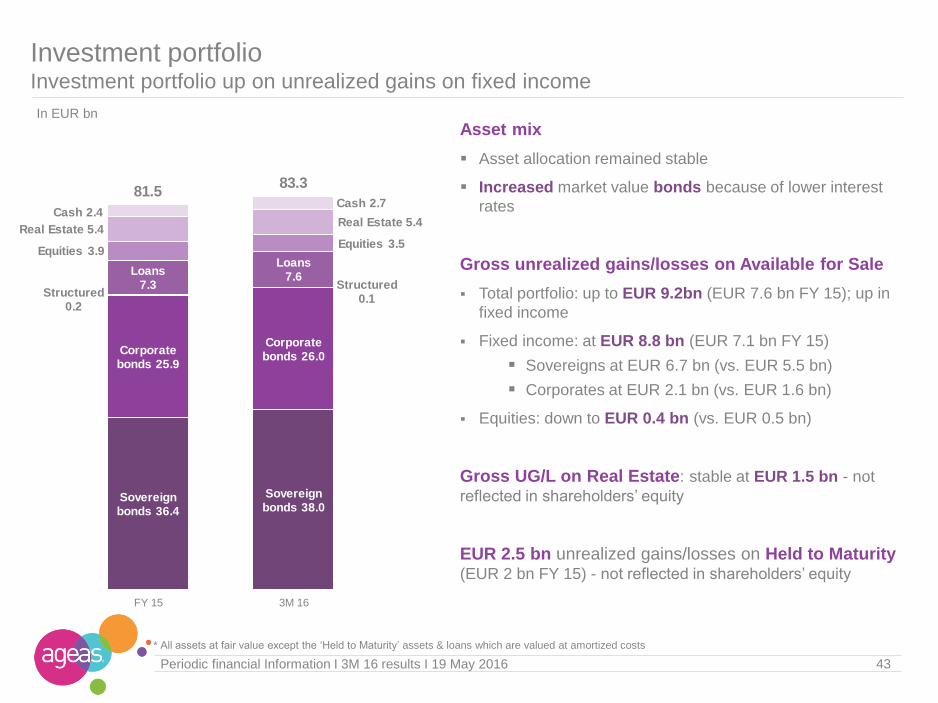
In EUR bn
* All assets at fair value except the ‘Held to Maturity’ assets & loans which are valued at amortized costs
Asset mix
Asset allocation remained stable
Increased market value bonds because of lower interest
rates
Gross unrealized gains/losses on Available for Sale
Total portfolio: up to EUR 9.2bn (EUR 7.6 bn FY 15); up in
fixed income
Fixed income: at EUR 8.8 bn (EUR 7.1 bn FY 15)
Sovereigns at EUR 6.7 bn (vs. EUR 5.5 bn)
Corporates at EUR 2.1 bn (vs. EUR 1.6 bn)
Equities: down to EUR 0.4 bn (vs. EUR 0.5 bn)
Gross UG/L on Real Estate: stable at EUR 1.5 bn - not
reflected in shareholders’ equity
EUR 2.5 bn unrealized gains/losses on Held to Maturity (EUR 2 bn FY 15) - not reflected in shareholders’ equity
Sovereign bonds 36.4
Sovereign bonds 38.0
Corporate bonds 25.9
Corporate bonds 26.0
Structured0.2
Structured0.1
Loans7.3
Loans7.6
Equities 3.9Equities 3.5
Real Estate 5.4Real Estate 5.4
Cash 2.4Cash 2.7
81.583.3
FY 15 3M 16
Investment portfolio Investment portfolio up on unrealized gains on fixed income
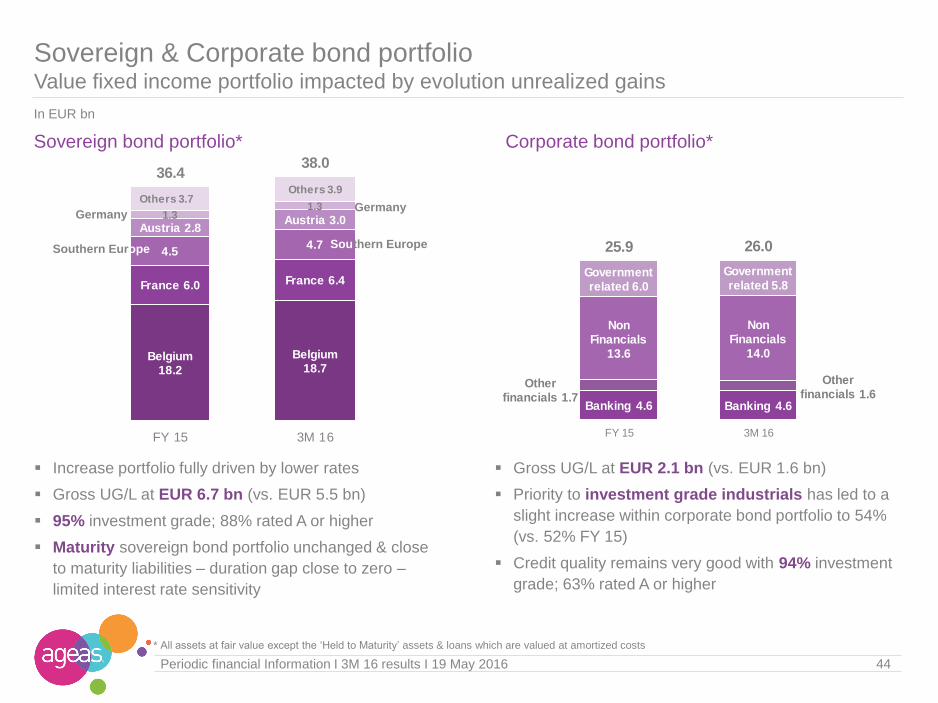
Increase portfolio fully driven by lower rates
Gross UG/L at EUR 6.7 bn (vs. EUR 5.5 bn)
95% investment grade; 88% rated A or higher
Maturity sovereign bond portfolio unchanged & close
to maturity liabilities – duration gap close to zero –
limited interest rate sensitivity
Belgium18.2
Belgium18.7
France 6.0 France 6.4
4.54.7
Austria 2.8Austria 3.01.3
1.3Others 3.7
Others 3.9
36.438.0
FY 15 3M 16
In EUR bn
Sovereign bond portfolio*
Sovereign & Corporate bond portfolioValue fixed income portfolio impacted by evolution unrealized gains
44Periodic financial Information I 3M 16 results I 19 May 2016
Gross UG/L at EUR 2.1 bn (vs. EUR 1.6 bn)
Priority to investment grade industrials has led to a
slight increase within corporate bond portfolio to 54%
(vs. 52% FY 15)
Credit quality remains very good with 94% investment
grade; 63% rated A or higher
Corporate bond portfolio*
Banking 4.6 Banking 4.6
Other financials 1.7
Other financials 1.6
Non Financials
13.6
Non Financials
14.0
Government related 6.0
Government related 5.8
25.9 26.0
FY 15 3M 16
GermanyGermany
Southern EuropeSouthern Europe
* All assets at fair value except the ‘Held to Maturity’ assets & loans which are valued at amortized costs

Loan portfolio (customers + banks)*
Loan & Equity portfolioMore loans with guarantee
Loans to banks 1.1
Loans to banks 1.1
RE 0.4 RE 0.4
Infrastructure0.3
Infrastructure0.4
Mortgages 1.3 Mortgages 1.4
Other 4.2Other 4.3
7.37.6
FY 15 3M 16
Increase in other: long term lending to social housing
agencies in Belgium, benefiting from explicit guarantee
by the region
New investments in infrastructure loans
45Periodic financial Information I 3M 16 results I 19 May 2016
Equity portfolio*
Gross UG/L down to EUR 0.4 bn
Decrease in equity portfolio supported by lower
equity markets & sales
Equities 2.3Equities 1.8
Equity funds0.3
Equity funds0.3
RE funds 0.8
RE funds 0.7
Mixed funds & others 0.6 Mixed funds
& others 0.6
3.93.5
FY 15 3M 16
In EUR bn
* All assets at fair value except the ‘Held to Maturity’ assets & loans which are valued at amortized costs
46Periodic financial Information I 3M 16 results I 19 May 2016
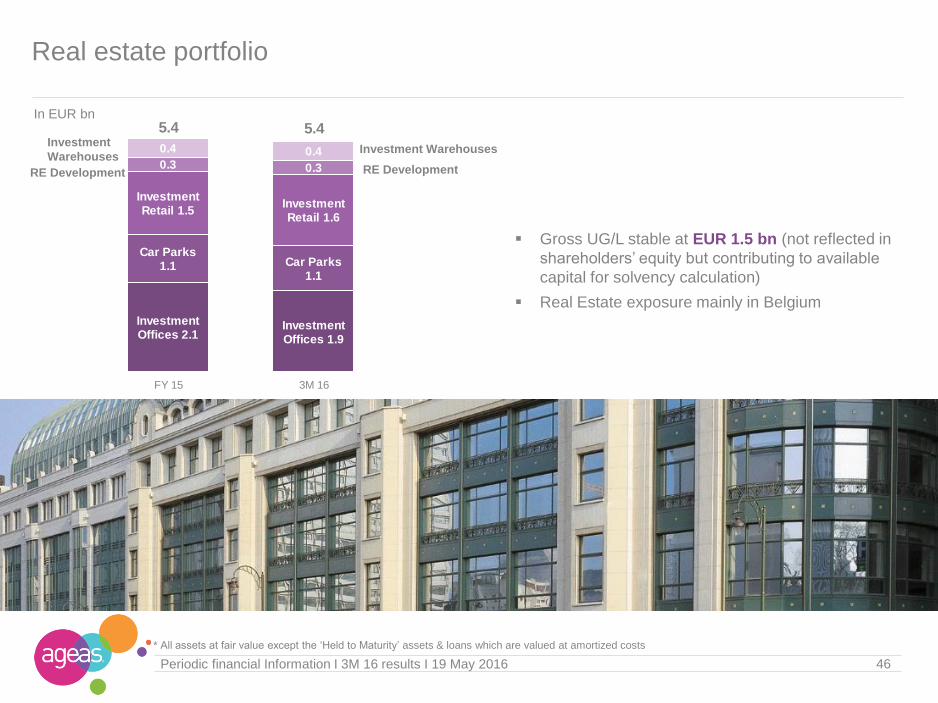
Real estate portfolio
10/03/2010
Gross UG/L stable at EUR 1.5 bn (not reflected in
shareholders’ equity but contributing to available
capital for solvency calculation)
Real Estate exposure mainly in BelgiumInvestment Offices 2.1
Investment Offices 1.9
Car Parks1.1 Car Parks
1.1
Investment Retail 1.5
Investment Retail 1.6
0.3 0.3
0.4 0.4
5.4 5.4
FY 15 3M 16
Investment Warehouses
RE Development
Investment
Warehouses
RE Development
In EUR bn
* All assets at fair value except the ‘Held to Maturity’ assets & loans which are valued at amortized costs

Annexes Equity / Solvency
Insurance Activities
Investment portfolio
General Account
Litigations
General Information

(1,064) (1,107)
FY 15 3M 16
Net result driven by settlement Fortis eventsIn EUR mio
Accounting value of remaining legacies:
General Account: Headlines Impacted by revaluation RPN(i) liability & Fortis settlement
48Periodic financial Information I 3M 16 results I 19 May 2016
Total liquid assets down on business development & SBB
In EUR mio
RPN(i) impact on P&L Staff & Operating expenses up on costs legal settlement
In EUR mio In EUR mio
In EUR mio
44
(834)
3M 15 3M 16
In EUR mio
Accounting value put option on AG Insurance
(402) (328)
41 54
(133)
(1,021)
FY 15 3M 16
RPN(i) RPI Settlement
1.61.2
FY 15 3M 16
36
73
3M 15 3M 16
3 4
8
2112
25
3M 15 3M 16
Staff & Intercompany Operating
49Periodic financial Information I 3M 16 results I 19 May 2016
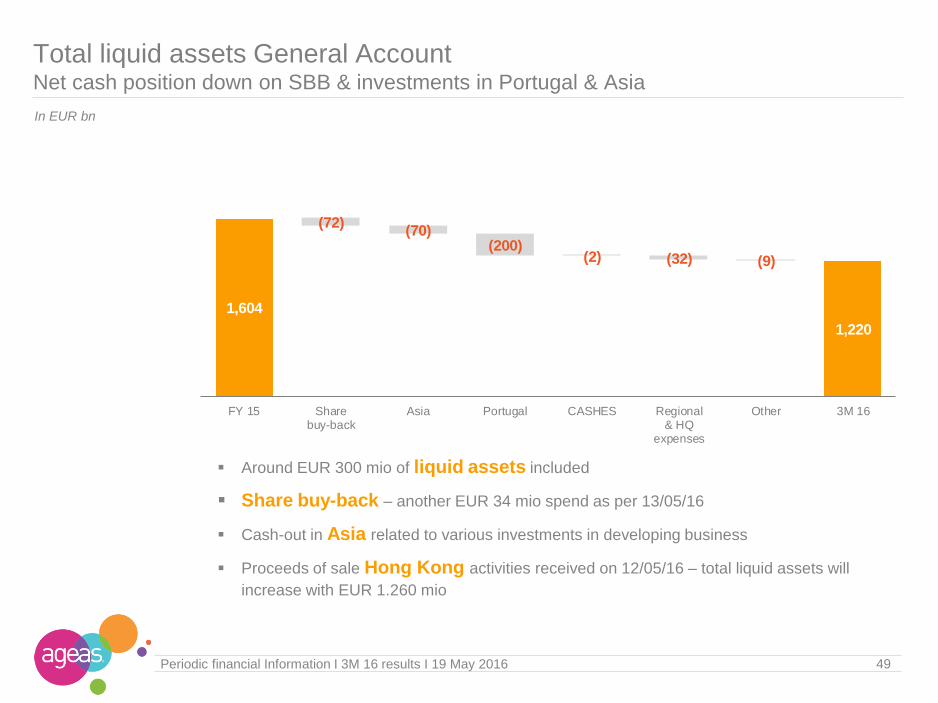
Total liquid assets General AccountNet cash position down on SBB & investments in Portugal & Asia
In EUR bn
Around EUR 300 mio of liquid assets included
Share buy-back – another EUR 34 mio spend as per 13/05/16
Cash-out in Asia related to various investments in developing business
Proceeds of sale Hong Kong activities received on 12/05/16 – total liquid assets will
increase with EUR 1.260 mio
1,604
1,220
(72)(70)
(200)(2) (32) (9)
FY 15 Sharebuy-back
Asia Portugal CASHES Regional& HQ
expenses
Other 3M 16
50Periodic financial Information I 3M 16 results I 19 May 2016
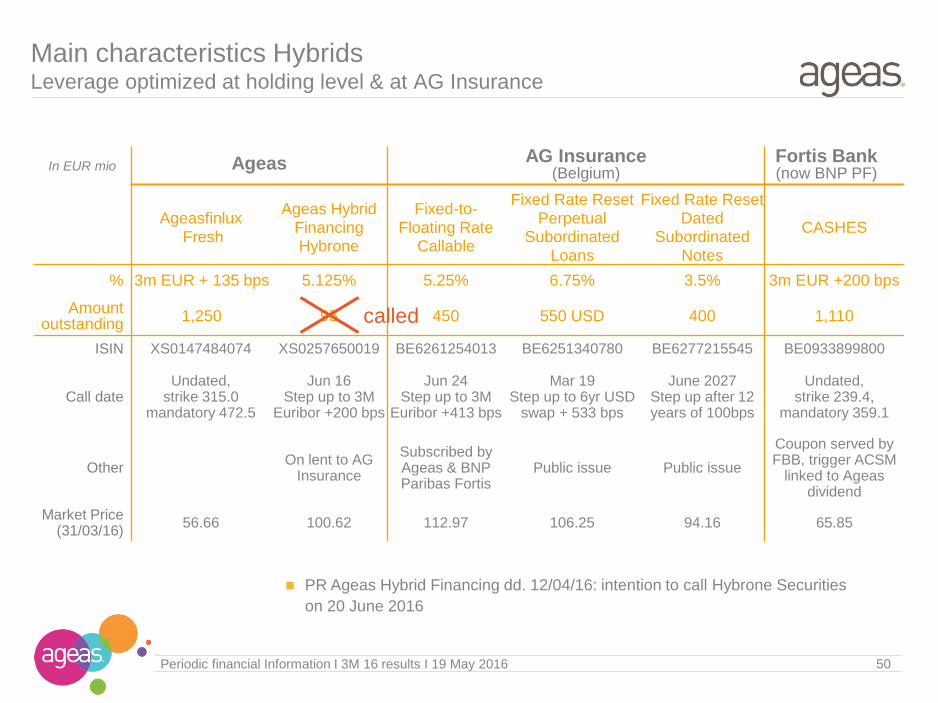
Main characteristics Hybrids Leverage optimized at holding level & at AG Insurance
In EUR mio Ageas
AgeasfinluxFresh
Ageas HybridFinancingHybrone
Fixed-to-Floating Rate
Callable
Fixed Rate Reset Perpetual
Subordinated Loans
Fixed Rate Reset Dated
Subordinated Notes
CASHES
% 3m EUR + 135 bps 5.125% 5.25% 6.75% 3.5% 3m EUR +200 bps
Amountoutstanding
1,250 95 450 550 USD 400 1,110
ISIN XS0147484074 XS0257650019 BE6261254013 BE6251340780 BE6277215545 BE0933899800
Call dateUndated,
strike 315.0 mandatory 472.5
Jun 16Step up to 3M
Euribor +200 bps
Jun 24Step up to 3M
Euribor +413 bps
Mar 19 Step up to 6yr USD
swap + 533 bps
June 2027Step up after 12 years of 100bps
Undated, strike 239.4,
mandatory 359.1
OtherOn lent to AG
Insurance
Subscribed byAgeas & BNP Paribas Fortis
Public issue Public issue
Coupon served by FBB, trigger ACSM
linked to Ageas dividend
Market Price (31/03/16)
56.66 100.62 112.97 106.25 94.16 65.85
Fortis Bank (now BNP PF)
AG Insurance (Belgium)
PR Ageas Hybrid Financing dd. 12/04/16: intention to call Hybrone Securities
on 20 June 2016
called
51Periodic financial Information I 3M 16 results I 19 May 2016
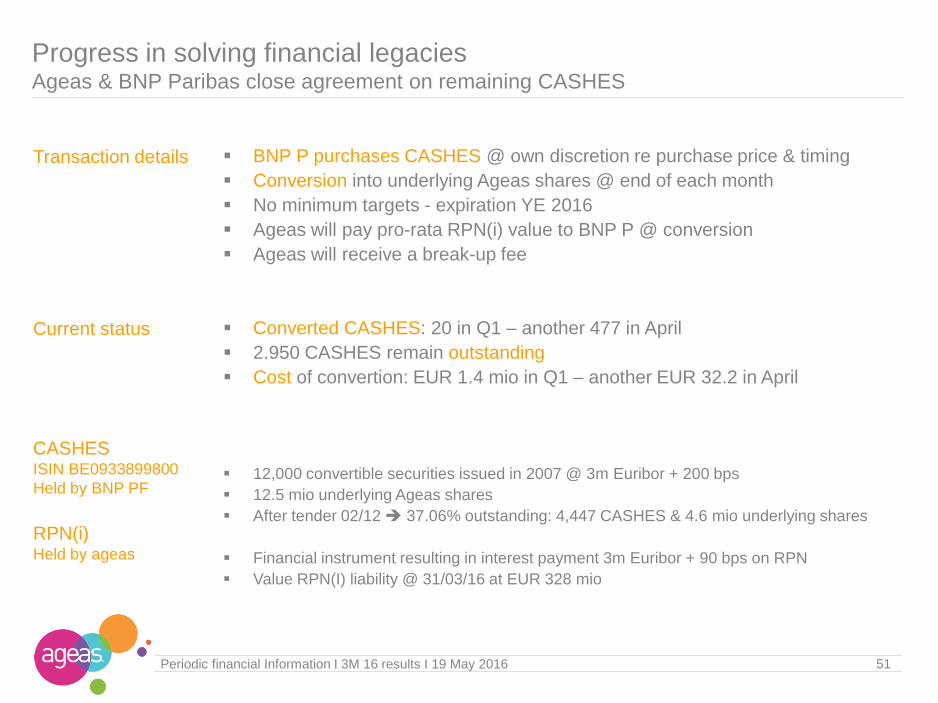
Progress in solving financial legaciesAgeas & BNP Paribas close agreement on remaining CASHES
BNP P purchases CASHES @ own discretion re purchase price & timing
Conversion into underlying Ageas shares @ end of each month
No minimum targets - expiration YE 2016
Ageas will pay pro-rata RPN(i) value to BNP P @ conversion
Ageas will receive a break-up fee
Converted CASHES: 20 in Q1 – another 477 in April
2.950 CASHES remain outstanding
Cost of convertion: EUR 1.4 mio in Q1 – another EUR 32.2 in April
12,000 convertible securities issued in 2007 @ 3m Euribor + 200 bps
12.5 mio underlying Ageas shares
After tender 02/12 37.06% outstanding: 4,447 CASHES & 4.6 mio underlying shares
Financial instrument resulting in interest payment 3m Euribor + 90 bps on RPN
Value RPN(I) liability @ 31/03/16 at EUR 328 mio
CASHESISIN BE0933899800
Held by BNP PF
Current status
Transaction details
RPN(i)Held by ageas

Annexes Insurance Activities
Investment portfolio
General Account
Equity / Solvency
Litigations
General Information

53Periodic financial Information I 3M 16 results I 19 May 2016
Shareholders’ equity down on provision for legal settlementDown to EUR 10.3 bn or EUR 49.10/share with UG/L of EUR 13.69/share
In EUR mio
7,095 7,529
2,9522,904
1,330
(109)
201
(834) (77)(75) (12) (61) (186) (8)
EUR 53.59 EUR 49.10
11,376
10,324
FY 15 ResultInsurance
ResultGen Acc
ChangeUG/L
TreasuryShares
IAS 19 Reval AGput option
Forex Other 3M 16
InsuranceUCG/L
InsuranceUCG/L
Shareholders’
equity per
segment
Shareholders’
equity per share
FY 15 3M 16 FY 15 3M 16
Belgium 4,932 ► 4,878 Asia 3,009 ► 3,163
UK 1,129 ► 1,100 Reinsurance 101
Continental Europe 977 ► 1,191 Insurance 10,047 ► 10,433
General Account 1,330 ► (109)
Periodic financial Information I 3M 16 results I 19 May 2016 54
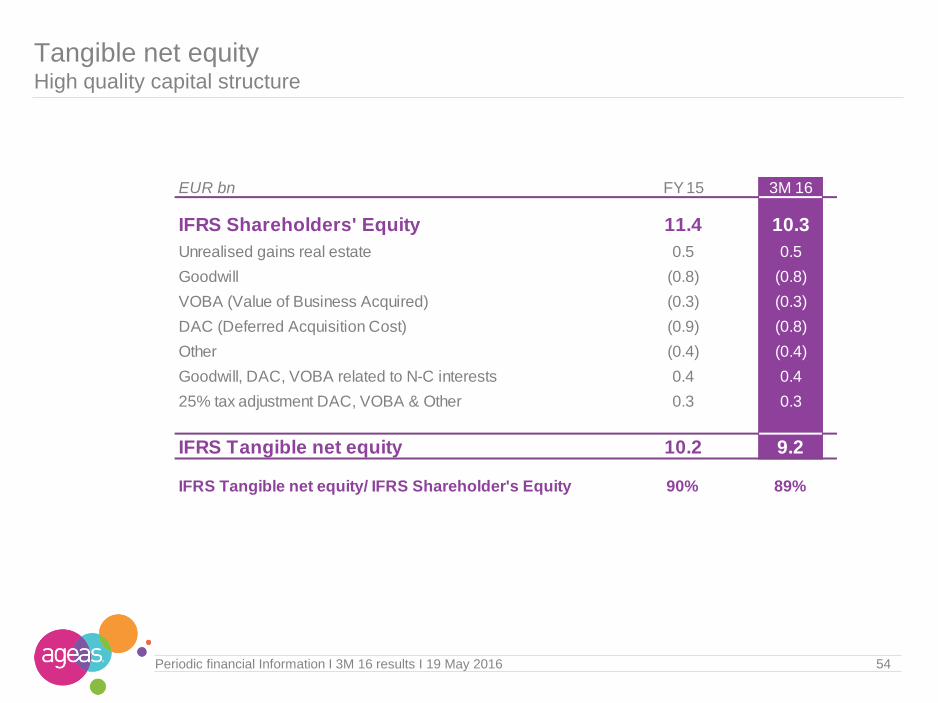
Tangible net equityHigh quality capital structure
10/03/2010 I page 54
EUR bn FY 15 3M 16
IFRS Shareholders' Equity 11.4 10.3
Unrealised gains real estate 0.5 0.5
Goodwill (0.8) (0.8)
VOBA (Value of Business Acquired) (0.3) (0.3)
DAC (Deferred Acquisition Cost) (0.9) (0.8)
Other (0.4) (0.4)
Goodwill, DAC, VOBA related to N-C interests 0.4 0.4
25% tax adjustment DAC, VOBA & Other 0.3 0.3
IFRS Tangible net equity 10.2 9.2
IFRS Tangible net equity/ IFRS Shareholder's Equity 90% 89%
Periodic financial Information I 3M 16 results I 19 May 2016
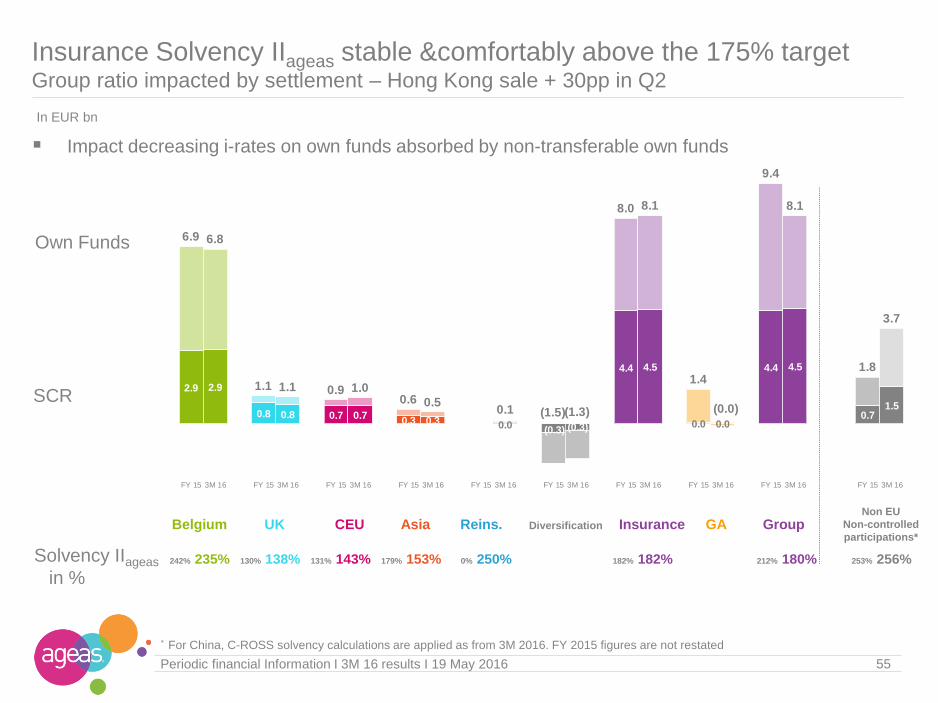
Insurance Solvency IIageas stable &comfortably above the 175% targetGroup ratio impacted by settlement – Hong Kong sale + 30pp in Q2
Solvency IIageas
in %
In EUR bn
Own Funds
SCR
Non EU
Non-controlled
participations*Belgium UK CEU Asia Reins. Diversification Insurance GA Group
55
242% 235% 130% 138% 131% 143% 179% 153% 0% 250% 182% 182% 212% 180% 253% 256%
* For China, C-ROSS solvency calculations are applied as from 3M 2016. FY 2015 figures are not restated
Impact decreasing i-rates on own funds absorbed by non-transferable own funds
2.9 2.9
0.8 0.8 0.7 0.70.3 0.3 0.0
(0.3) (0.3)
4.4 4.5
0.0 0.0
4.4 4.5
0.71.5
6.9 6.8
1.1 1.1 0.9 1.00.6 0.5
0.1 (1.5)(1.3)
8.0 8.1
1.4
(0.0)
9.4
8.1
1.8
3.7
FY 15 3M 16 FY 15 3M 16 FY 15 3M 16 FY 15 3M 16 FY 15 3M 16 FY 15 3M 16 FY 15 3M 16 FY 15 3M 16 FY 15 3M 16 FY 15 3M 16
9.311.2
8.010.0
2.2
1.6
2.5
1.8
(5.2)
(2.0)
(0.2)
(0.40)(0.8) (1.5)
3.0
9.811.6
8.1
10.4
2.2
1.5
3.4
1.8
(5.9)
(2.3)
(0.2)
(0.55) (0.8)(1.3)
2.9
Periodic financial Information I 3M 16 results I 19 May 2016
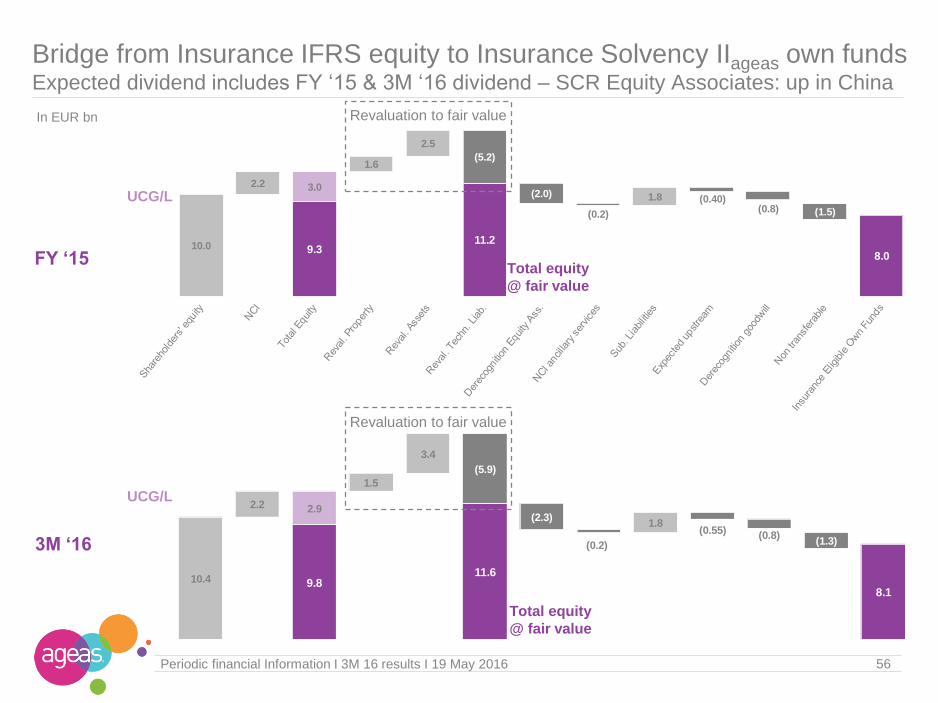
Bridge from Insurance IFRS equity to Insurance Solvency IIageas own fundsExpected dividend includes FY ‘15 & 3M ‘16 dividend – SCR Equity Associates: up in China
Revaluation to fair value
FY ‘15
56
In EUR bn
Revaluation to fair value
3M ‘16
UCG/L
UCG/L
Total equity
@ fair value
Total equity
@ fair value
Periodic financial Information I 3M 16 results I 19 May 2016
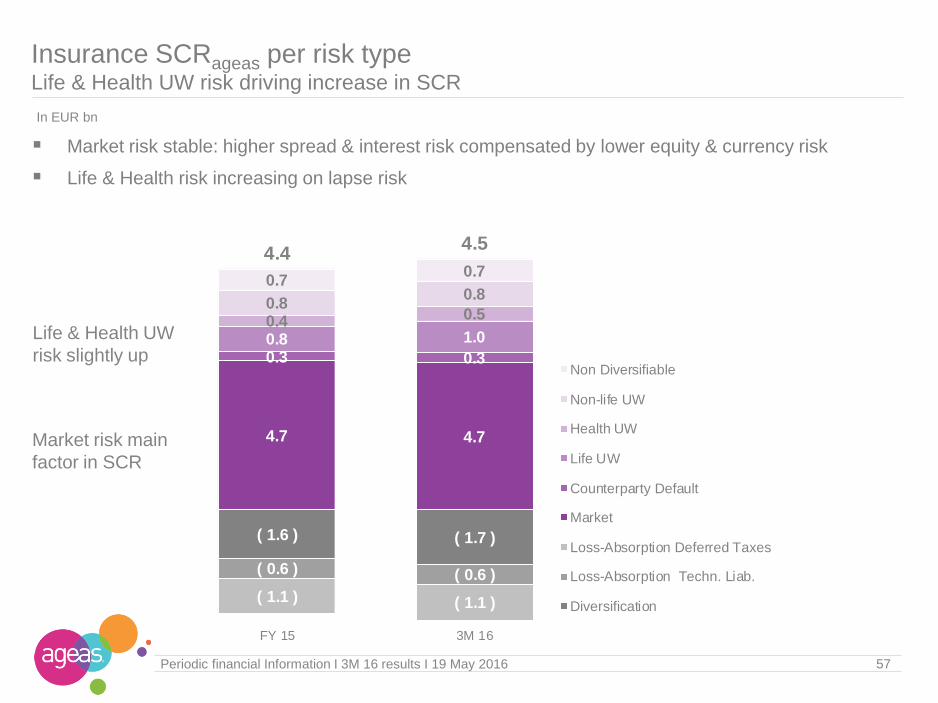
Insurance SCRageas per risk typeLife & Health UW risk driving increase in SCR
Market risk main
factor in SCR
57
In EUR bn
( 1.6 ) ( 1.7 )
( 0.6 ) ( 0.6 )
( 1.1 ) ( 1.1 )
4.7 4.7
0.3 0.3
0.8 1.0 0.4 0.5 0.8
0.8 0.7
0.7 4.4
4.5
FY 15 3M 16
Non Diversifiable
Non-life UW
Health UW
Life UW
Counterparty Default
Market
Loss-Absorption Deferred Taxes
Loss-Absorption Techn. Liab.
Diversification
Life & Health UW
risk slightly up
Market risk stable: higher spread & interest risk compensated by lower equity & currency risk
Life & Health risk increasing on lapse risk
Periodic financial Information I 3M 16 results I 19 May 2016
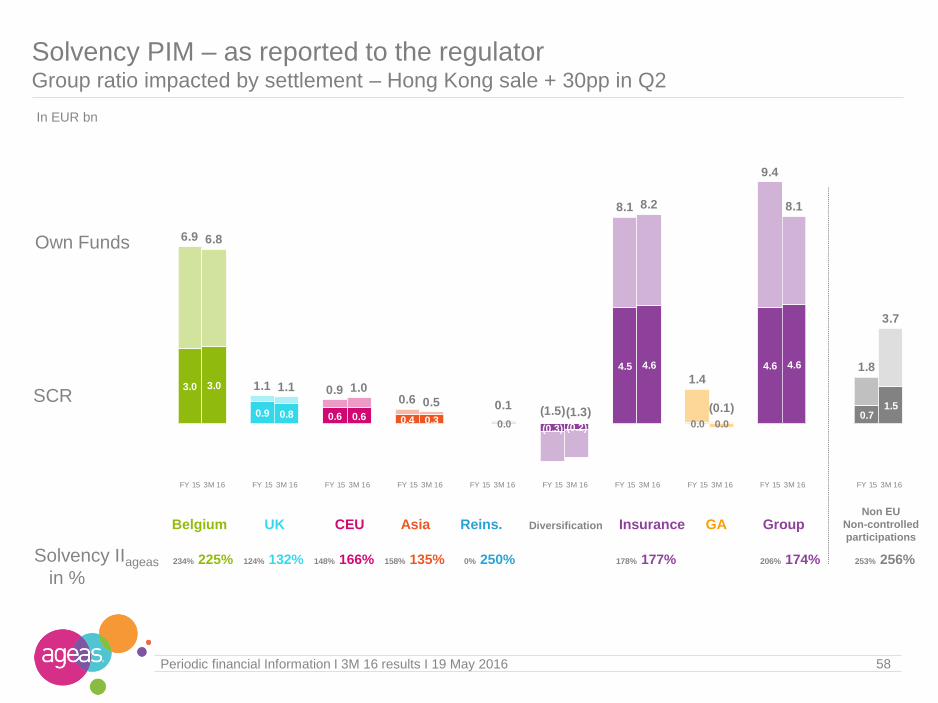
Solvency PIM – as reported to the regulatorGroup ratio impacted by settlement – Hong Kong sale + 30pp in Q2
Solvency IIageas
in %
In EUR bn
Own Funds
SCR
Non EU
Non-controlled
participationsBelgium UK CEU Asia Reins. Diversification Insurance GA Group
58
3.0 3.0
0.9 0.8 0.6 0.6 0.4 0.3 0.0 (0.3) (0.2)
4.5 4.6
0.0 0.0
4.6 4.6
0.71.5
6.9 6.8
1.1 1.1 0.9 1.00.6 0.5 0.1 (1.5)(1.3)
8.1 8.2
1.4
(0.1)
9.4
8.1
1.8
3.7
FY 15 3M 16 FY 15 3M 16 FY 15 3M 16 FY 15 3M 16 FY 15 3M 16 FY 15 3M 16 FY 15 3M 16 FY 15 3M 16 FY 15 3M 16 FY 15 3M 16
234% 225% 124% 132% 148% 166% 158% 135% 0% 250% 178% 177% 206% 174% 253% 256%
Periodic financial Information I 3M 16 results I 19 May 2016
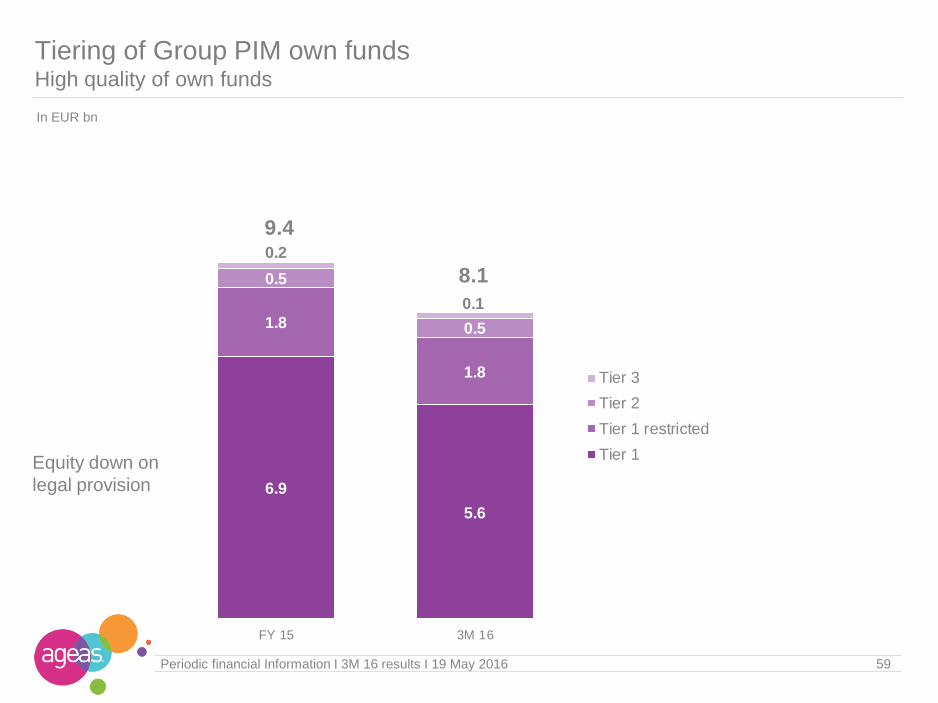
Tiering of Group PIM own funds High quality of own funds
59
Equity down on
legal provision
In EUR bn
6.9
5.6
1.8
1.8
0.5
0.5
0.2
0.1
9.4
8.1
FY 15 3M 16
Tier 3
Tier 2
Tier 1 restricted
Tier 1

Annexes Insurance Activities
Investment portfolio
General Account
Equity / Solvency
Litigations
General Information
61Periodic financial Information I 3M 16 results I 19 May 2016
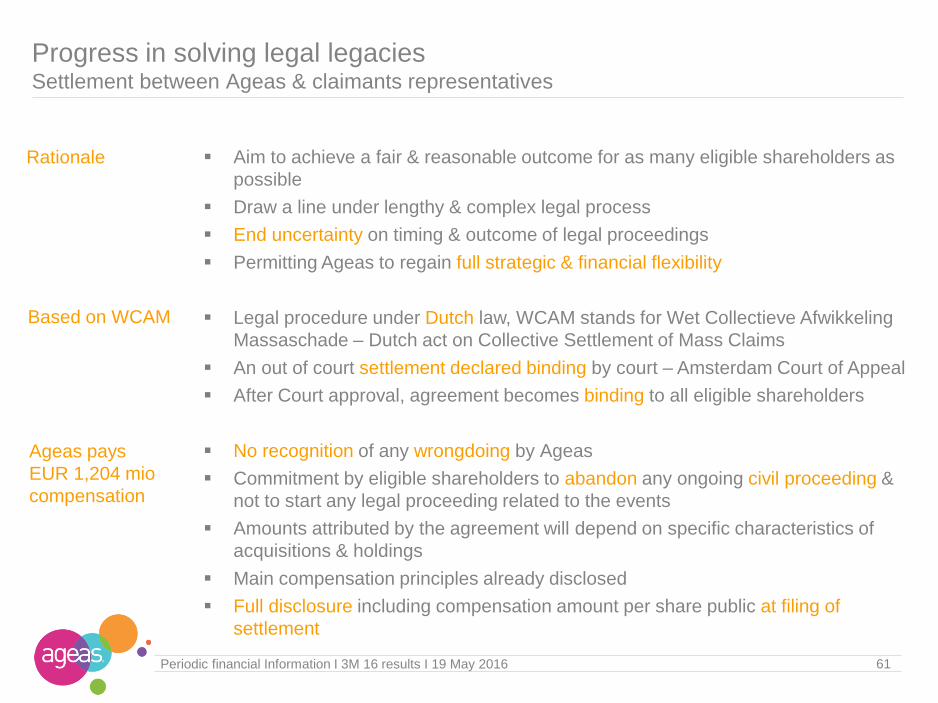
Progress in solving legal legaciesSettlement between Ageas & claimants representatives
Aim to achieve a fair & reasonable outcome for as many eligible shareholders as
possible
Draw a line under lengthy & complex legal process
End uncertainty on timing & outcome of legal proceedings
Permitting Ageas to regain full strategic & financial flexibility
Legal procedure under Dutch law, WCAM stands for Wet Collectieve Afwikkeling
Massaschade – Dutch act on Collective Settlement of Mass Claims
An out of court settlement declared binding by court – Amsterdam Court of Appeal
After Court approval, agreement becomes binding to all eligible shareholders
No recognition of any wrongdoing by Ageas
Commitment by eligible shareholders to abandon any ongoing civil proceeding &
not to start any legal proceeding related to the events
Amounts attributed by the agreement will depend on specific characteristics of
acquisitions & holdings
Main compensation principles already disclosed
Full disclosure including compensation amount per share public at filing of
settlement
Rationale
Based on WCAM
Ageas pays
EUR 1,204 mio
compensation
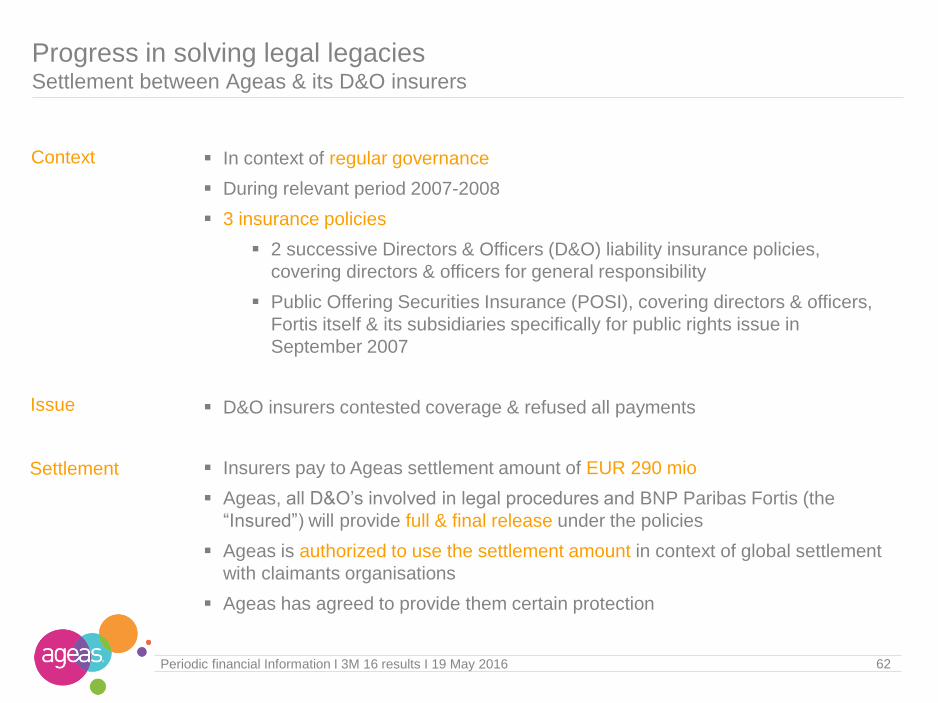
62Periodic financial Information I 3M 16 results I 19 May 2016
In context of regular governance
During relevant period 2007-2008
3 insurance policies
2 successive Directors & Officers (D&O) liability insurance policies,
covering directors & officers for general responsibility
Public Offering Securities Insurance (POSI), covering directors & officers,
Fortis itself & its subsidiaries specifically for public rights issue in
September 2007
D&O insurers contested coverage & refused all payments
Insurers pay to Ageas settlement amount of EUR 290 mio
Ageas, all D&O’s involved in legal procedures and BNP Paribas Fortis (the
“Insured”) will provide full & final release under the policies
Ageas is authorized to use the settlement amount in context of global settlement
with claimants organisations
Ageas has agreed to provide them certain protection
Context
Settlement
Issue
Progress in solving legal legaciesSettlement between Ageas & its D&O insurers
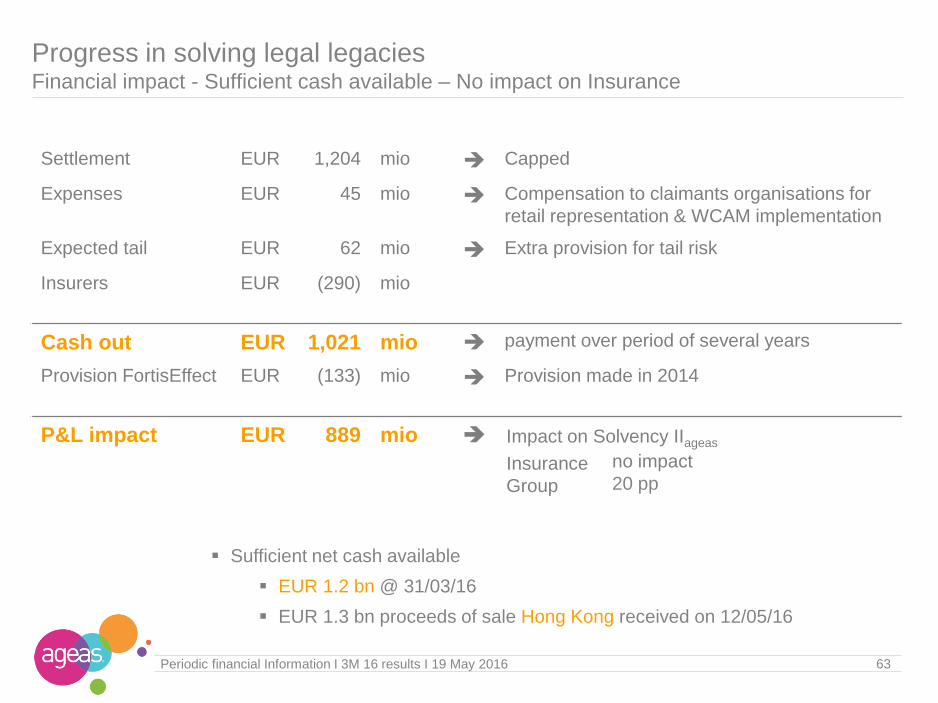
Settlement EUR 1,204 mio Capped
Expenses EUR 45 mio Compensation to claimants organisations for
retail representation & WCAM implementation
Expected tail EUR 62 mio Extra provision for tail risk
Insurers EUR (290) mio
Cash out EUR 1,021 mio payment over period of several years
Provision FortisEffect EUR (133) mio Provision made in 2014
P&L impact EUR 889 mio Impact on Solvency IIageas
Insurance no impact
Group 20 pp
63Periodic financial Information I 3M 16 results I 19 May 2016
Progress in solving legal legaciesFinancial impact - Sufficient cash available – No impact on Insurance
Sufficient net cash available
EUR 1.2 bn @ 31/03/16
EUR 1.3 bn proceeds of sale Hong Kong received on 12/05/16
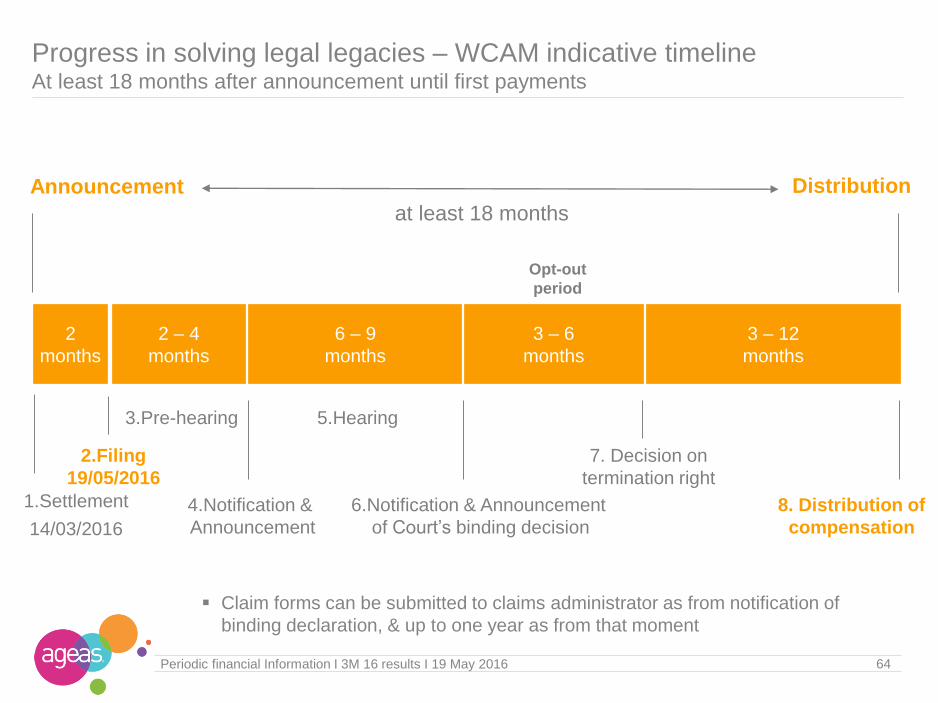
2 – 4
months
6 – 9
months
3 – 6
months
3 – 12
months
2.Filing
19/05/2016
4.Notification &
Announcement
3.Pre-hearing 5.Hearing
6.Notification & Announcement
of Court’s binding decision
Opt-out
period
2
months
1.Settlement
14/03/2016
8. Distribution of
compensation
Announcement Distribution
64Periodic financial Information I 3M 16 results I 19 May 2016
at least 18 months
7. Decision on
termination right
Progress in solving legal legacies – WCAM indicative timelineAt least 18 months after announcement until first payments
Claim forms can be submitted to claims administrator as from notification of
binding declaration, & up to one year as from that moment
65Periodic financial Information I 3M 16 results I 19 May 2016
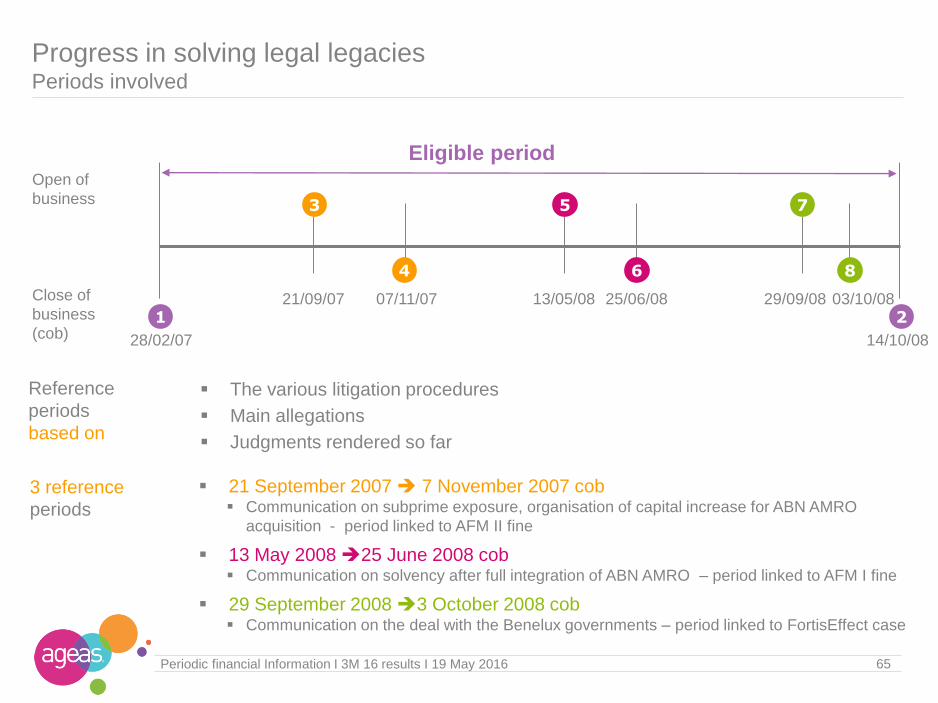
21 September 2007 7 November 2007 cob Communication on subprime exposure, organisation of capital increase for ABN AMRO
acquisition - period linked to AFM II fine
13 May 2008 25 June 2008 cob Communication on solvency after full integration of ABN AMRO – period linked to AFM I fine
29 September 2008 3 October 2008 cob Communication on the deal with the Benelux governments – period linked to FortisEffect case
The various litigation procedures
Main allegations
Judgments rendered so far
Open of
business
Close of
business
(cob) 28/02/07 14/10/08
21/09/07 07/11/07 13/05/08 25/06/08 29/09/08 03/10/081 2
3
4
5
6
7
8
Eligible period
3 reference
periods
Reference
periods
based on
Progress in solving legal legaciesPeriods involved
66Periodic financial Information I 3M 16 results I 19 May 2016
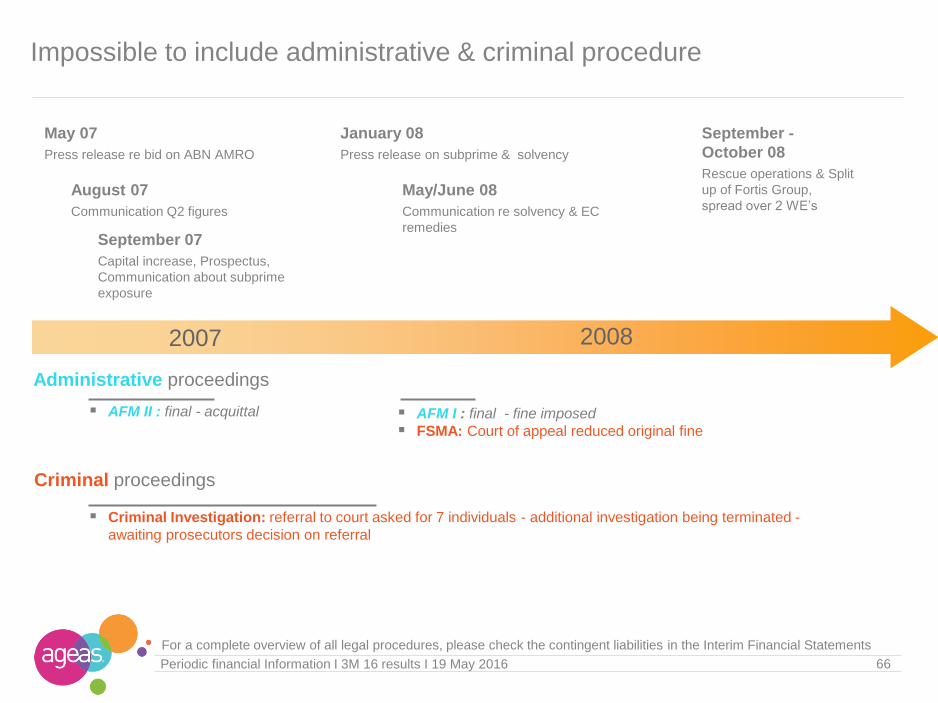
AFM I : final - fine imposed
FSMA: Court of appeal reduced original fine
20082007
May/June 08
Communication re solvency & EC
remedies
September -
October 08
Rescue operations & Split
up of Fortis Group,
spread over 2 WE’sAugust 07
Communication Q2 figures
AFM II : final - acquittal
September 07
Capital increase, Prospectus,
Communication about subprime
exposure
May 07
Press release re bid on ABN AMRO
January 08
Press release on subprime & solvency
Criminal Investigation: referral to court asked for 7 individuals - additional investigation being terminated -
awaiting prosecutors decision on referral
Administrative proceedings
Criminal proceedings
For a complete overview of all legal procedures, please check the contingent liabilities in the Interim Financial Statements
Impossible to include administrative & criminal procedure
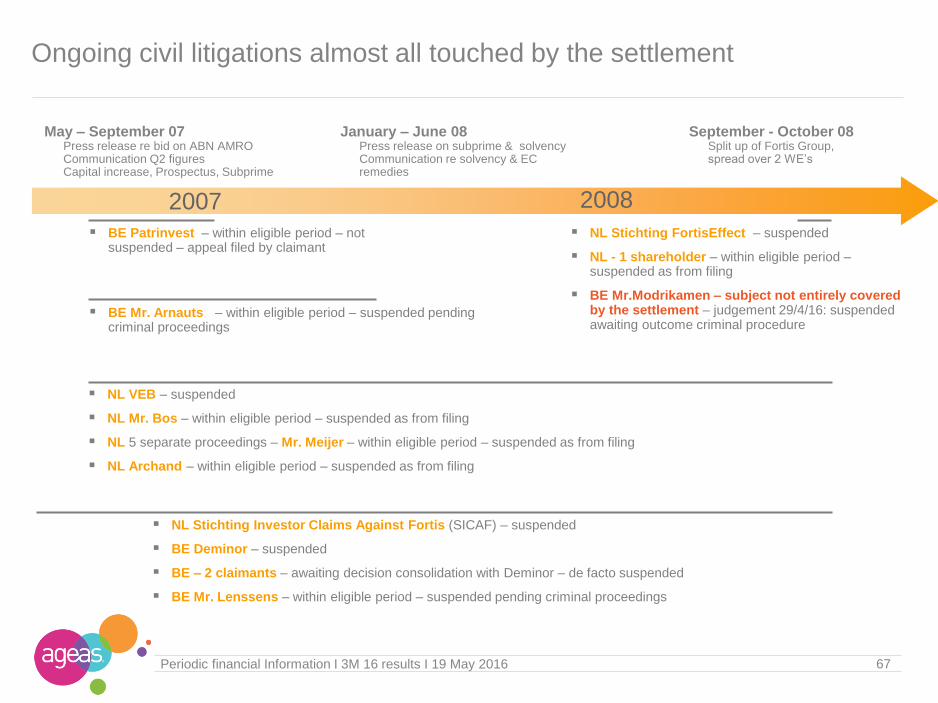
67Periodic financial Information I 3M 16 results I 19 May 2016
20082007
September - October 08Split up of Fortis Group, spread over 2 WE’s
May – September 07Press release re bid on ABN AMROCommunication Q2 figuresCapital increase, Prospectus, Subprime
January – June 08Press release on subprime & solvencyCommunication re solvency & EC remedies
NL Stichting Investor Claims Against Fortis (SICAF) – suspended
BE Deminor – suspended
BE – 2 claimants – awaiting decision consolidation with Deminor – de facto suspended
BE Mr. Lenssens – within eligible period – suspended pending criminal proceedings
NL Stichting FortisEffect – suspended
NL - 1 shareholder – within eligible period –suspended as from filing
BE Mr.Modrikamen – subject not entirely covered by the settlement – judgement 29/4/16: suspended awaiting outcome criminal procedure
BE Mr. Arnauts – within eligible period – suspended pending criminal proceedings
NL VEB – suspended
NL Mr. Bos – within eligible period – suspended as from filing
NL 5 separate proceedings – Mr. Meijer – within eligible period – suspended as from filing
NL Archand – within eligible period – suspended as from filing
BE Patrinvest – within eligible period – not suspended – appeal filed by claimant
Ongoing civil litigations almost all touched by the settlement
68Periodic financial Information I 3M 16 results I 19 May 2016
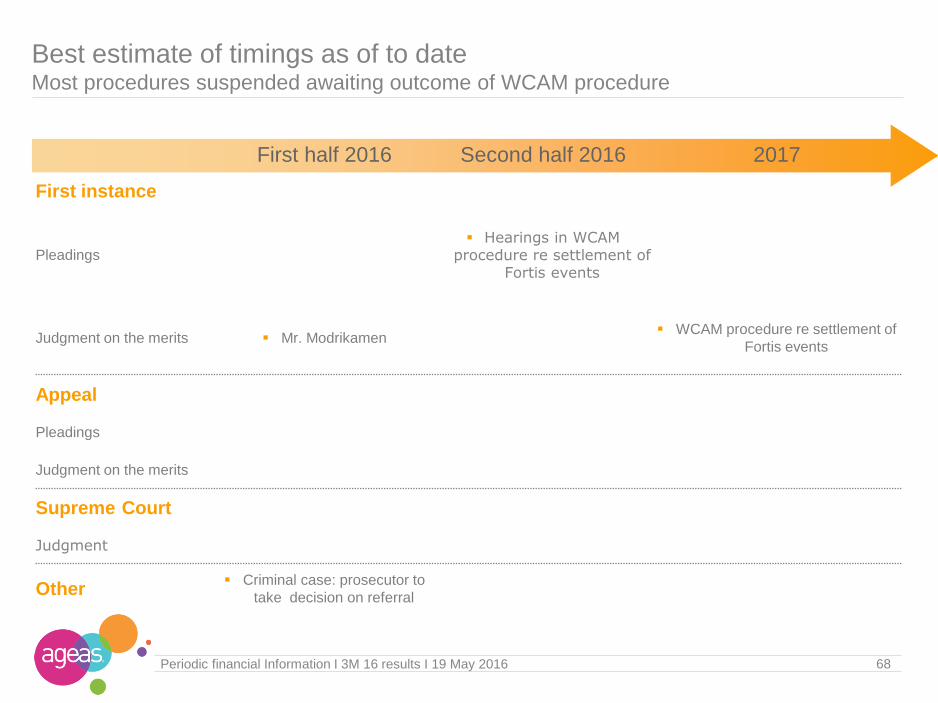
Best estimate of timings as of to dateMost procedures suspended awaiting outcome of WCAM procedure
First half 2016 Second half 2016 2017
First instance
Pleadings
Hearings in WCAM procedure re settlement of
Fortis events
Judgment on the merits Mr. Modrikamen WCAM procedure re settlement of
Fortis events
Appeal
Pleadings
Judgment on the merits
Supreme Court
Judgment
Other Criminal case: prosecutor to
take decision on referral

Annexes Insurance Activities
Investment portfolio
General Account
Equity / Solvency
Litigations
General Information

situation 31/12/2015 situation 31/03/2016 situation 13/05/2016
223,778,433 223,778,433 216,570,471
16,086,350 18,066,371 11,113,849
7,207,962 9,208,868 2,903,466
3,968,254 3,968,254 3,968,254
266,230 266,230 117,230
4,643,904 4,623,019 4,124,899
207,692,083 205,712,062 205,456,622
Cancellation
+ SBB
70Periodic financial Information I 3M 16 results I 19 May 2016
Total number of outstanding sharesAGM has approved cancellation of another 7.2 mio shares
Cancellation 7.2 mio
shares or
3% of outstandingTotal Issued Shares
Shares not entitled to dividend nore voting rights
1. TREASURY SHARES Share buy-back
FRESH
Other treasury shares
2. CASHES
Shares entitled to dividend & voting rights
CASHES deal
with BNP
71Periodic financial Information I 3M 16 results I 19 May 2016
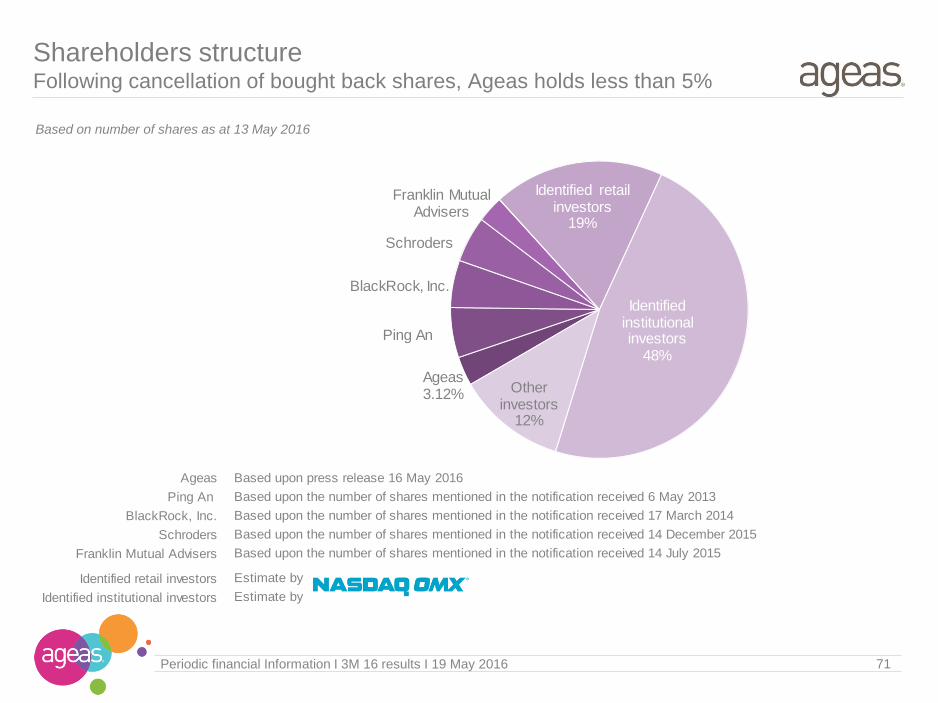
Shareholders structureFollowing cancellation of bought back shares, Ageas holds less than 5%
Based on number of shares as at 13 May 2016
Ageas3.12%
Ping An
BlackRock, Inc.
Schroders
Franklin Mutual Advisers
Identified retail investors
19%
Identified institutional investors
48%
Other investors
12%
Based upon press release 16 May 2016
Based upon the number of shares mentioned in the notification received 6 May 2013
Based upon the number of shares mentioned in the notification received 17 March 2014
Based upon the number of shares mentioned in the notification received 14 December 2015
Based upon the number of shares mentioned in the notification received 14 July 2015
Estimate by
Estimate by
Ageas
Ping An
BlackRock, Inc.
Schroders
Franklin Mutual Advisers
Identified retail investors
Identified institutional investors
72Periodic financial Information I 3M 16 results I 19 May 2016
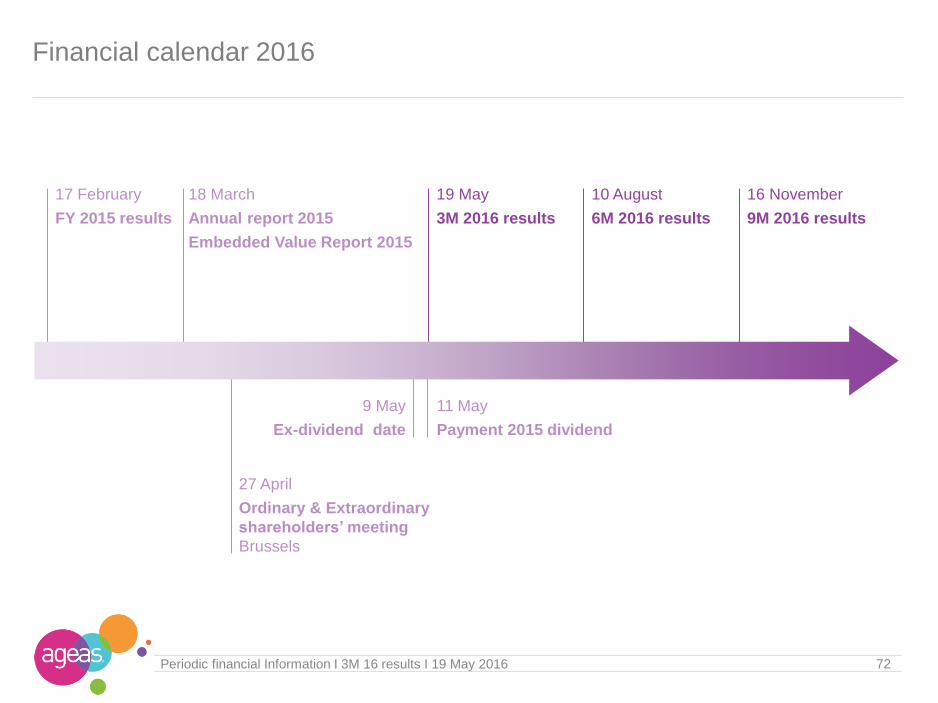
Financial calendar 2016
17 February
FY 2015 results
19 May
3M 2016 results
27 April
Ordinary & Extraordinary
shareholders’ meeting
Brussels
9 May
Ex-dividend date
18 March
Annual report 2015
Embedded Value Report 2015
11 May
Payment 2015 dividend
10 August
6M 2016 results
16 November
9M 2016 results

73Periodic financial Information I 3M 16 results I 19 May 2016
RatingImproved rating for operating entities & holding
S&P MOODY'S FITCH
Operating AG Insurance (Belgium) A / stable A2 / stable* A+ / stable
entities Last change 06/11/15 17/03/16 10/12/13
unsollicited
Ageas Insurance Limited A / stable A+ / stable
Last change 06/11/15 30/03/15
Ageas Insurance Co. (Asia) Baa1 / stable A- / stable
Last change 16/01/13 02/09/15
Muang Thai Life BBB+ / stable A- / stable
Last change 29/12/10 16/06/15
Etiqa Insurance Berhad (Malaysia) A / stable
Last change 25/09/11
Holding ageas SA/NV BBB / stable Baa3 / negative* A- / stable
Last change 15/03/16 17/03/16 15/03/16
unsollicited
* Ageas has requested in early 2009 that this rating should be withdrawn. Ageas no longer participates in Moody's credit rating process.
Ageas does not provide, for purposes of Moody's rating, access to the books, records and other relevant internal documents of these rated entities.
74Periodic financial Information I 3M 16 results I 19 May 2016
Certain of the statements contained herein are statements of
future expectations and other forward-looking statements that are based on management's current views and assumptions
and involve known and unknown risks and uncertainties that could cause actual results, performance or events to differ
materially from those expressed or implied in such statements. Future actual results, performance or events may differ
materially from those in such statements due to, without limitation, (i) general economic conditions, including in particular
economic conditions in Ageas’s core markets, (ii) performance of financial markets, (iii) the frequency and severity of
insured loss events, (iv) mortality and morbidity levels and trends, (v) persistency levels, (vi) interest rate levels, (vii)
currency exchange rates, (viii) increasing levels of competition, (ix) changes in laws and regulations, including monetary
convergence and the Economic and Monetary Union, (x) changes in the policies of central banks and/or foreign
governments and (xi) general competitive factors, in each case on a global, regional and/or national basis. In addition, the
financial information contained in this presentation, including the pro forma information contained herein, is unaudited and is
provided for illustrative purposes only. It does not purport to be indicative of what the actual results of operations or financial
condition of Ageas and its subsidiaries would have been had these events occurred or transactions been consummated on
or as of the dates indicated, nor does it purport to be indicative of the results of operations or financial condition that may be
achieved in the future.
Disclaimer
75Periodic financial Information I 3M 16 results I 19 May 2016
Tel:
E-mail:
Website:
+ 32 2 557 57 34
www.ageas.com
Investor Relations