Embed Size (px)
Citation preview

Suzlon Energy Limited
Q1 FY16 Earnings Presentation
31st July 2015
2
226
226
226
188
222
194
2
152
140
23
123
87
128
128
128
121
162
179
218
188
78
216
206
184
177
114
107
210
224
230
• This presentation and the accompanying slides (the “Presentation”), which have been prepared by Suzlon Energy Limited (the “Company”), have been prepared solely for information purposes and do not constitute any offer, recommendation or invitation to purchase or subscribe for any securities, and shall not form the basis or be relied on in connection with any contract or binding commitment whatsoever. The Presentation is not intended to form the basis of any investment decision by a prospective investor. No offering of securities of the Company will be made except by means of a statutory offering document containing detailed information about the Company.
• This Presentation has been prepared by the Company based on information and data which the Company considers reliable, but the Company makes no representation or warranty, express or implied, whatsoever, and no reliance shall be placed on, the truth, accuracy, completeness, fairness and reasonableness of the contents of this Presentation. This Presentation may not be all inclusive and may not contain all of the information that you may consider material. Any liability in respect of the contents of or any omission from, this Presentation is expressly excluded. In particular, but without prejudice to the generality of the foregoing, no representation or warranty whatsoever is given in relation to the reasonableness or achievability of the projections contained in the Presentation or in relation to the bases and assumptions underlying such projections and you must satisfy yourself in relation to the reasonableness, achievability and accuracy thereof.
• Certain matters discussed in this Presentation may contain statements regarding the Company’s market opportunity and business prospects that are individually and collectively forward-looking statements. Such forward-looking statements are not guarantees of future performance and are subject to known and unknown risks, uncertainties and assumptions that are difficult to predict. These risks and uncertainties include, but are not limited to, the performance of the Indian economy and of the economies of various international markets, the performance of the wind power industry in India and world-wide, the Company’s ability to successfully implement its strategy, the Company’s future levels of growth and expansion, technological implementation, changes and advancements, changes in revenue, income or cash flows, the Company’s market preferences and its exposure to market risks, as well as other risks. The Company’s actual results, levels of activity, performance or achievements could differ materially and adversely from results expressed in or implied by this Presentation. The Company assumes no obligation to update any forward-looking information contained in this Presentation. Any forward-looking statements and projections made by third parties included in this Presentation are not adopted by the Company and the Company is not responsible for such third party statements and projections.
• No responsibility or liability is accepted for any loss or damage howsoever arising that you may suffer as a result of this Presentation and any and all responsibility and liability is expressly disclaimed by the Management, the Shareholders and the Company or any of them or any of their respective directors, officers, affiliates, employees, advisers or agents.
• No offering of the Company’s securities will be registered under the U.S. Securities Act of 1933, as amended (the “Securities Act”). Accordingly, unless an exemption from registration under the Securities Act is available, the Company’s securities may not be offered, sold, resold, delivered or distributed, directly or indirectly, into the United States or to, or for the account or benefit of, any U.S. Person (as defined in regulation S under the Securities Act).
• The distribution of this document in certain jurisdictions may be restricted by law and persons into whose possession this presentation comes should inform themselves about and observe any such restrictions
Disclaimer

3
Contents
Industry Opportunities
Products & Technology
Quarterly Performance
Strategic Focus
Detailed Financials
4
226
226
226
188
222
194
2
152
140
23
123
87
128
128
128
121
162
179
218
188
78
216
206
184
177
114
107
210
224
230
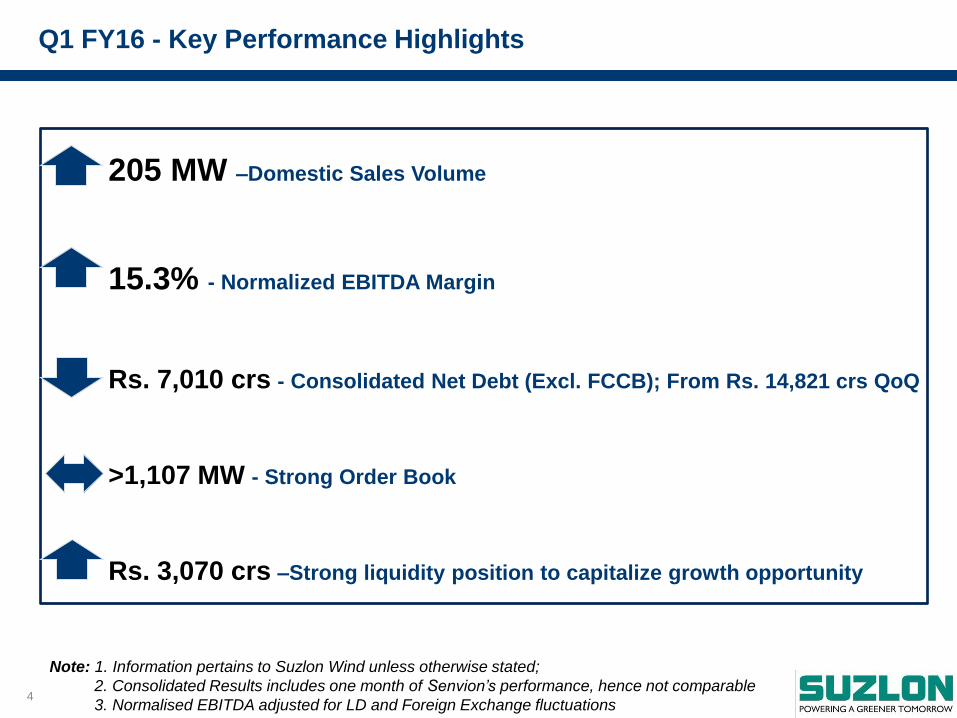
Q1 FY16 - Key Performance Highlights
205 MW –Domestic Sales Volume
15.3% - Normalized EBITDA Margin
Rs. 7,010 crs - Consolidated Net Debt (Excl. FCCB); From Rs. 14,821 crs QoQ
>1,107 MW - Strong Order Book
Rs. 3,070 crs –Strong liquidity position to capitalize growth opportunity
Note: 1. Information pertains to Suzlon Wind unless otherwise stated;
2. Consolidated Results includes one month of Senvion’s performance, hence not comparable
3. Normalised EBITDA adjusted for LD and Foreign Exchange fluctuations
5
226
226
226
188
222
194
2
152
140
23
123
87
128
128
128
121
162
179
218
188
78
216
206
184
177
114
107
210
224
230
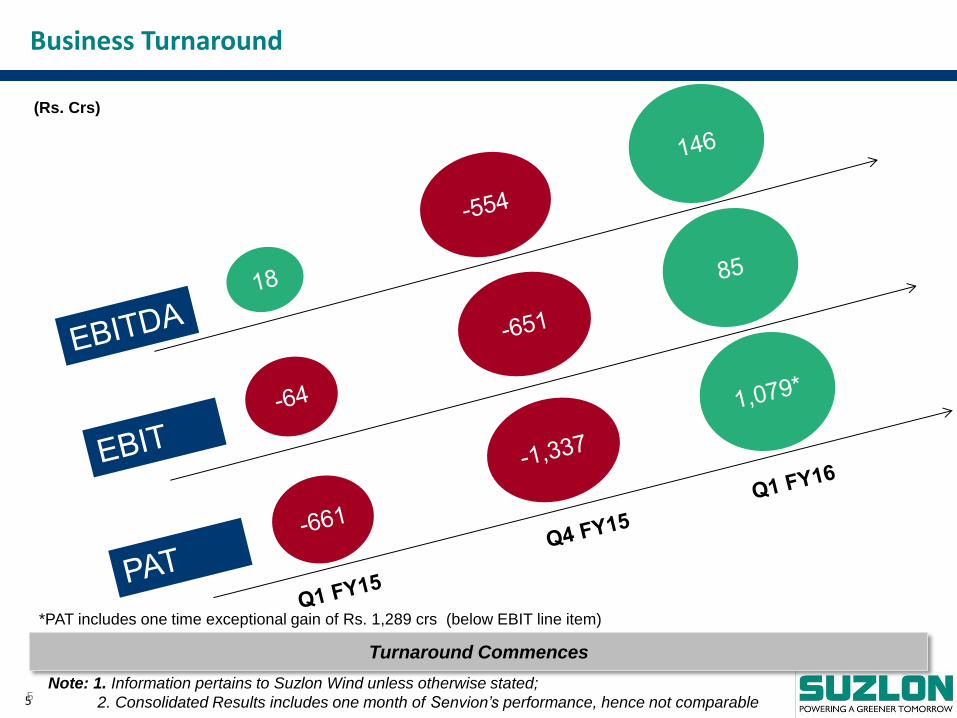
Turnaround Commences
5
Business Turnaround
Note: 1. Information pertains to Suzlon Wind unless otherwise stated;
2. Consolidated Results includes one month of Senvion’s performance, hence not comparable
*PAT includes one time exceptional gain of Rs. 1,289 crs (below EBIT line item)
(Rs. Crs)
6
226
226
226
188
222
194
2
152
140
23
123
87
128
128
128
121
162
179
218
188
78
216
206
184
177
114
107
210
224
230
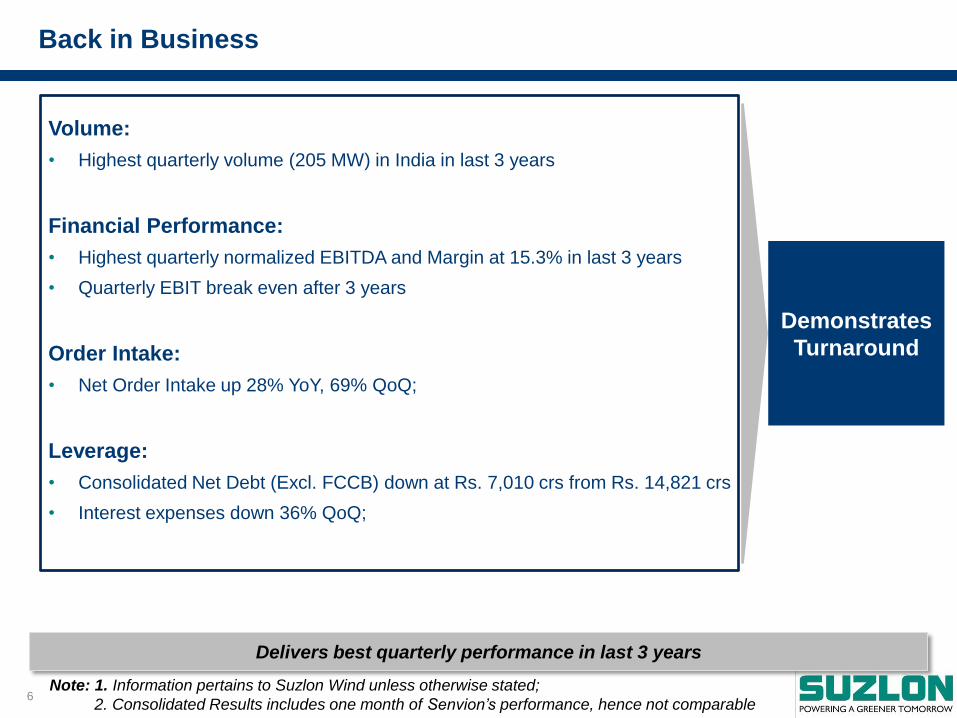
Delivers best quarterly performance in last 3 years
Back in Business
Demonstrates
Turnaround
Volume:
• Highest quarterly volume (205 MW) in India in last 3 years
Financial Performance:
• Highest quarterly normalized EBITDA and Margin at 15.3% in last 3 years
• Quarterly EBIT break even after 3 years
Order Intake:
• Net Order Intake up 28% YoY, 69% QoQ;
Leverage:
• Consolidated Net Debt (Excl. FCCB) down at Rs. 7,010 crs from Rs. 14,821 crs
• Interest expenses down 36% QoQ;
Note: 1. Information pertains to Suzlon Wind unless otherwise stated;
2. Consolidated Results includes one month of Senvion’s performance, hence not comparable
7
226
226
226
188
222
194
2
152
140
23
123
87
128
128
128
121
162
179
218
188
78
216
206
184
177
114
107
210
224
230
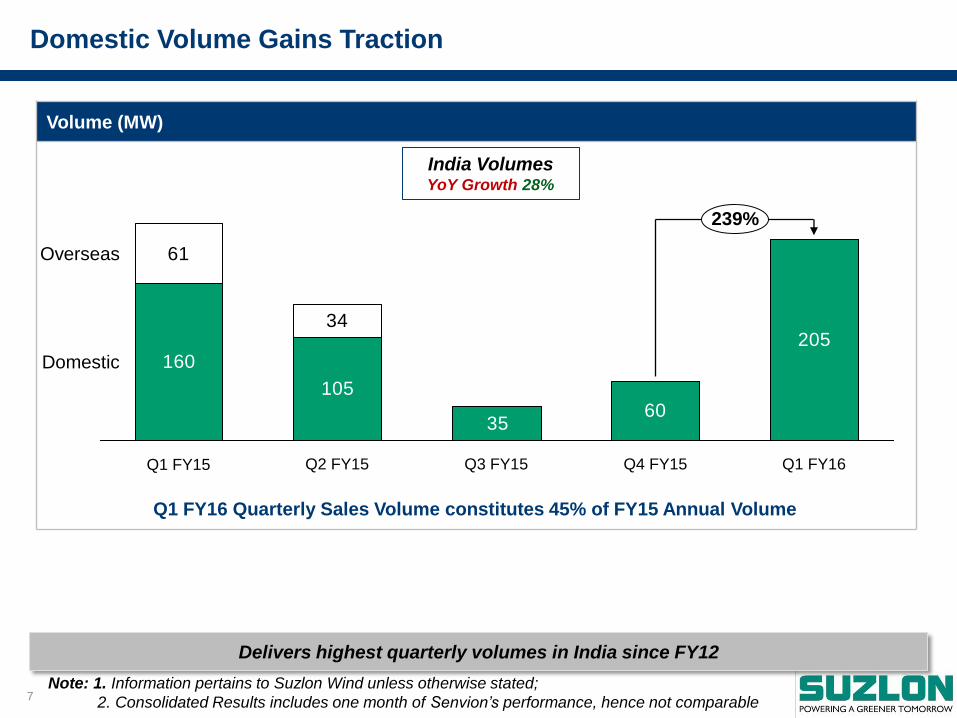
Volume (MW)
Domestic Volume Gains Traction
160
10560
205
35
34
61
Q3 FY15 Q4 FY15
Overseas
Domestic
Q1 FY16 Q2 FY15 Q1 FY15
239%
India Volumes YoY Growth 28%
Note: 1. Information pertains to Suzlon Wind unless otherwise stated;
2. Consolidated Results includes one month of Senvion’s performance, hence not comparable
Delivers highest quarterly volumes in India since FY12
Q1 FY16 Quarterly Sales Volume constitutes 45% of FY15 Annual Volume
8
226
226
226
188
222
194
2
152
140
23
123
87
128
128
128
121
162
179
218
188
78
216
206
184
177
114
107
210
224
230
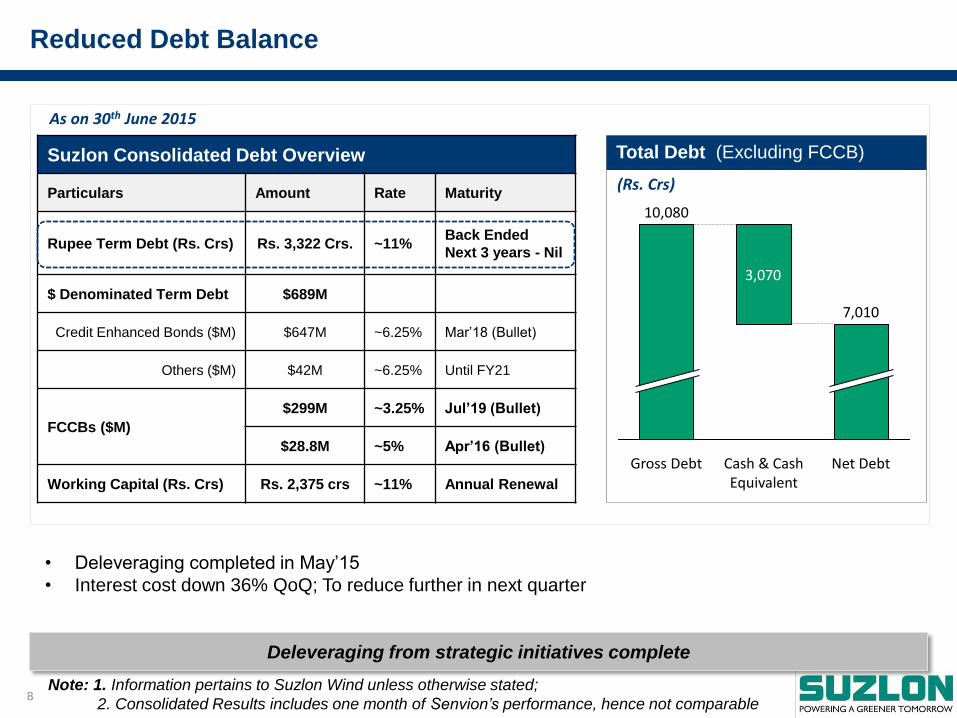
Total Debt (Excluding FCCB)
Reduced Debt Balance
As on 30th June 2015
Suzlon Consolidated Debt Overview
Particulars Amount Rate Maturity
Rupee Term Debt (Rs. Crs) Rs. 3,322 Crs. ~11% Back Ended
Next 3 years - Nil
$ Denominated Term Debt $689M
Credit Enhanced Bonds ($M) $647M ~6.25% Mar’18 (Bullet)
Others ($M) $42M ~6.25% Until FY21
FCCBs ($M)
$299M ~3.25% Jul’19 (Bullet)
$28.8M ~5% Apr’16 (Bullet)
Working Capital (Rs. Crs) Rs. 2,375 crs ~11% Annual Renewal
3,070
10,080
Gross Debt Net Debt
7,010
Cash & Cash Equivalent
(Rs. Crs)
• Deleveraging completed in May’15
• Interest cost down 36% QoQ; To reduce further in next quarter
Note: 1. Information pertains to Suzlon Wind unless otherwise stated;
2. Consolidated Results includes one month of Senvion’s performance, hence not comparable
Deleveraging from strategic initiatives complete
9
226
226
226
188
222
194
2
152
140
23
123
87
128
128
128
121
162
179
218
188
78
216
206
184
177
114
107
210
224
230
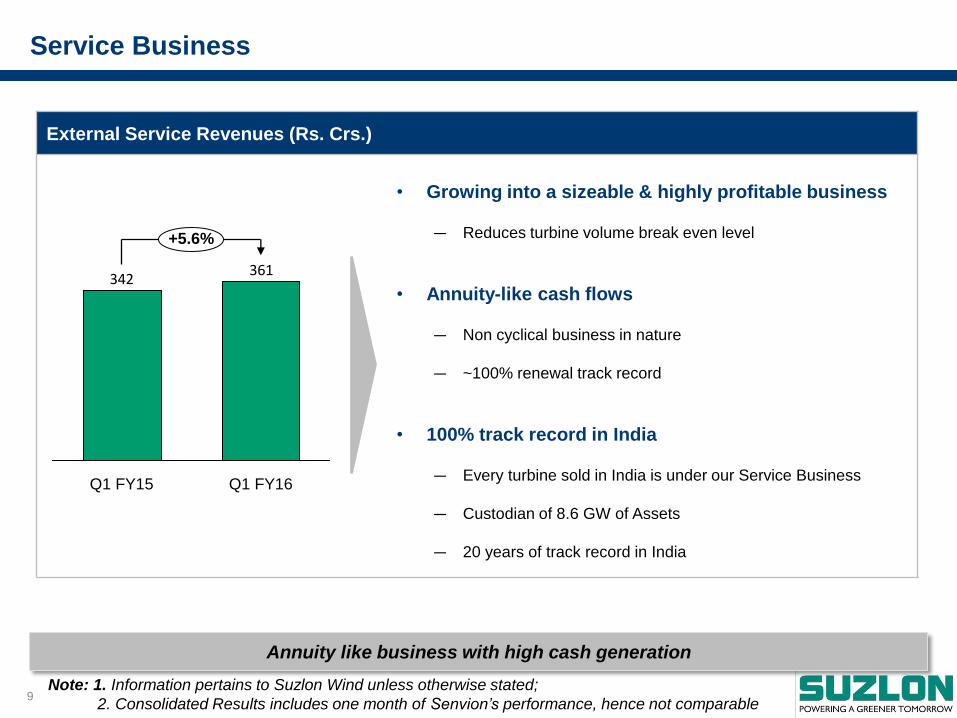
External Service Revenues (Rs. Crs.)
Service Business
361342
Q1 FY16 Q1 FY15
+5.6%
• Growing into a sizeable & highly profitable business
― Reduces turbine volume break even level
• Annuity-like cash flows
― Non cyclical business in nature
― ~100% renewal track record
• 100% track record in India
― Every turbine sold in India is under our Service Business
― Custodian of 8.6 GW of Assets
― 20 years of track record in India
Note: 1. Information pertains to Suzlon Wind unless otherwise stated;
2. Consolidated Results includes one month of Senvion’s performance, hence not comparable
Annuity like business with high cash generation

10
226
226
226
188
222
194
2
152
140
23
123
87
128
128
128
121
162
179
218
188
78
216
206
184
177
114
107
210
224
230
Result Snapshot
Q1 FY16 Q4 FY15 Q1 FY15
MW Sales 205 60 221
Revenue 1,542 926 1,698
Gross Profit 694 264 599
Gross Margin 45.0% 28.5% 35.3%
Normalized EBITDA 237 -224 57
EBITDA Margin 15.3% -24.2% 3.3%
Normalized EBIT 175 -322 -25
EBIT Margin 11.3% -34.8% -1.5%
Net Profit/Loss 1,079 -1,337 -661
Rs Crs
Note: 1. Information pertains to Suzlon Wind unless otherwise stated;
2. Consolidated Results includes one month of Senvion’s performance, hence not comparable
Gross Profit
• India volume ramp up
• Improved service profitability
• Execution of current orders
• Favorable product mix and scope
Operating Profit
• After considering provisions ~3-4%
• Operating Leverage
• Lower freight
• Fixed cost optimization
Net Profit
• Interest cost down 36% QoQ
• Nil Tax
• Special Items
― FX Loss: Rs.66 crs; LD: Rs.24 crs (Before EBITDA)
― Senvion Related Reversals (Gain): Rs.1,289 crs
11
226
226
226
188
222
194
2
152
140
23
123
87
128
128
128
121
162
179
218
188
78
216
206
184
177
114
107
210
224
230
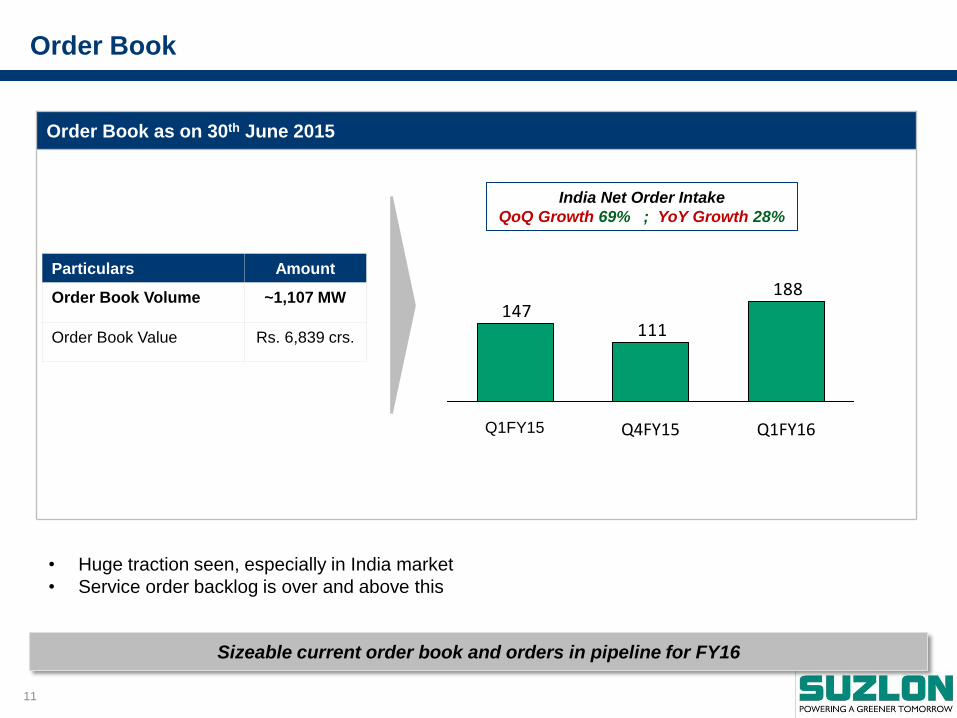
Order Book as on 30th June 2015
Order Book
Particulars Amount
Order Book Volume ~1,107 MW
Order Book Value Rs. 6,839 crs.
• Huge traction seen, especially in India market
• Service order backlog is over and above this
188
111147
Q1FY16 Q4FY15 Q1FY15
India Net Order Intake
QoQ Growth 69% ; YoY Growth 28%
Sizeable current order book and orders in pipeline for FY16
12
226
226
226
188
222
194
2
152
140
23
123
87
128
128
128
121
162
179
218
188
78
216
206
184
177
114
107
210
224
230
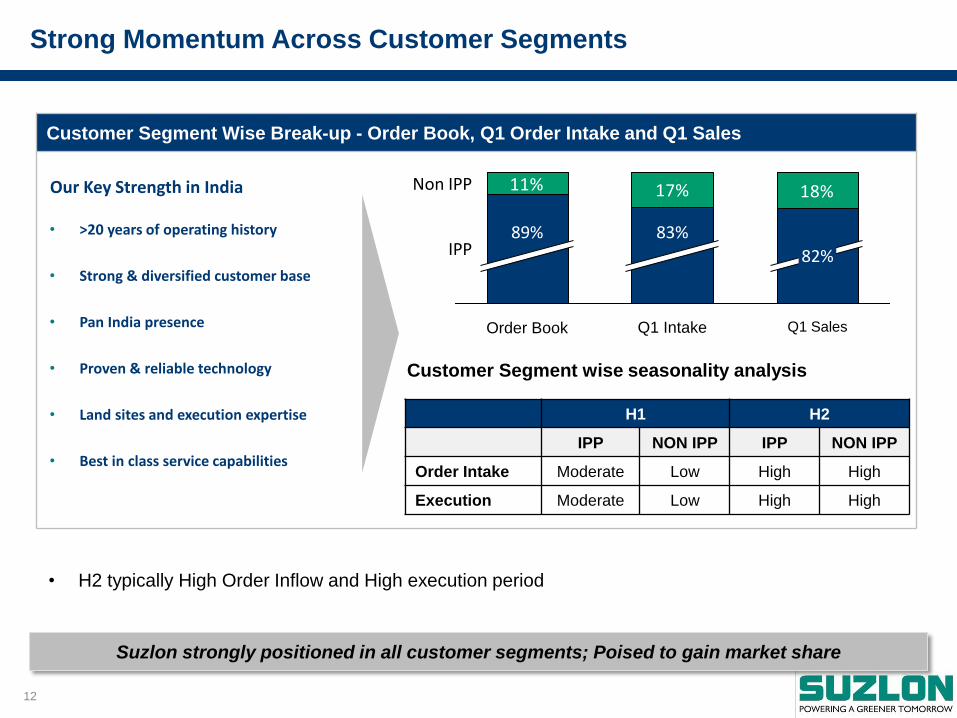
Customer Segment Wise Break-up - Order Book, Q1 Order Intake and Q1 Sales
• H2 typically High Order Inflow and High execution period
Strong Momentum Across Customer Segments
11% 17% 18%
Q1 Sales
Non IPP
IPP 82%
Q1 Intake
83%
Order Book
89%
H1 H2
IPP NON IPP IPP NON IPP
Order Intake Moderate Low High High
Execution Moderate Low High High
Our Key Strength in India
• >20 years of operating history
• Strong & diversified customer base
• Pan India presence
• Proven & reliable technology
• Land sites and execution expertise
• Best in class service capabilities
Customer Segment wise seasonality analysis
Suzlon strongly positioned in all customer segments; Poised to gain market share

13
226
226
226
188
222
194
2
152
140
23
123
87
128
128
128
121
162
179
218
188
78
216
206
184
177
114
107
210
224
230
Only Player with Pan India Presence
As on 31st Mar’ 15 States with Dominant IPP
Demand
States with Dominant Non IPP
demand
Total India
Total Installation (MW) 7,773 15,582 23,355
Suzlon Share (%) 36% 37% 37%
States with Dominant IPP demand
Key Drivers of Demand
• Remunerative FiTs • Conducive state policies
Reason for Low Non IPP Demand
• Low level of industrialization
States with Dominant Non IPP demand
Key Drivers for Non IPP Demand
• Moderate FiTs • Good Industrialization Level • Conducive Captive Policy • TN / KN (Group Captive)
Reasons for Low IPP Demand
• Low FiT in GJ / TN • Lack of conducive policy in MH
Pan India presence key to cater across customer segments
14
226
226
226
188
222
194
2
152
140
23
123
87
128
128
128
121
162
179
218
188
78
216
206
184
177
114
107
210
224
230
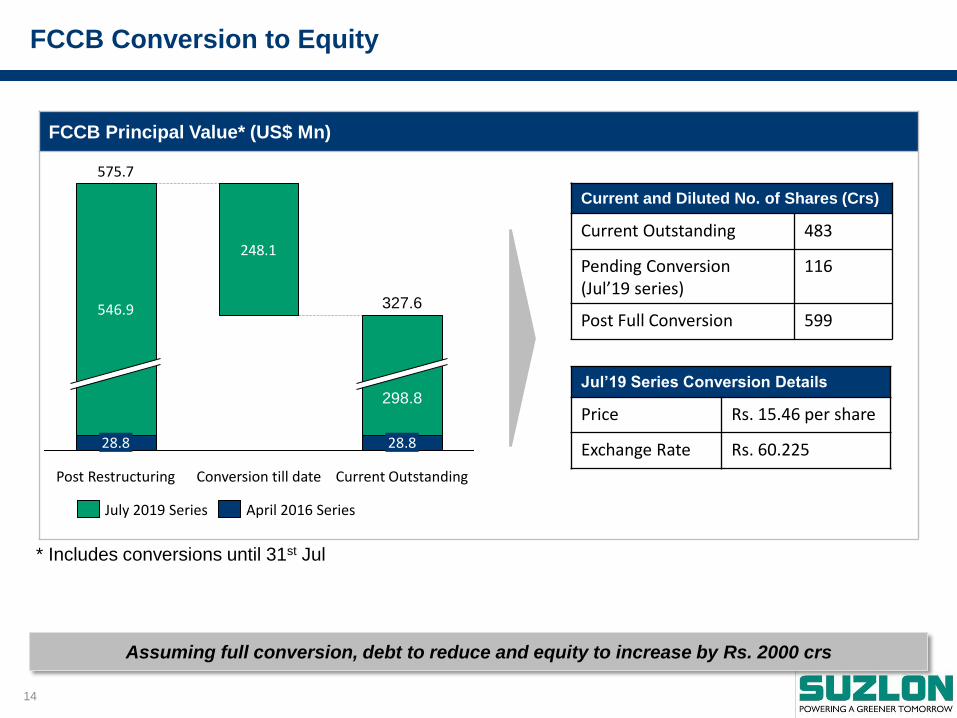
FCCB Principal Value* (US$ Mn)
248.1
Current Outstanding
327.6
28.8
298.8
Conversion till date Post Restructuring
575.7
28.8
546.9
April 2016 Series July 2019 Series
* Includes conversions until 31st Jul
FCCB Conversion to Equity
Jul’19 Series Conversion Details
Price Rs. 15.46 per share
Exchange Rate Rs. 60.225
Current and Diluted No. of Shares (Crs)
Current Outstanding 483
Pending Conversion (Jul’19 series)
116
Post Full Conversion 599
Assuming full conversion, debt to reduce and equity to increase by Rs. 2000 crs
15
226
226
226
188
222
194
2
152
140
23
123
87
128
128
128
121
162
179
218
188
78
216
206
184
177
114
107
210
224
230
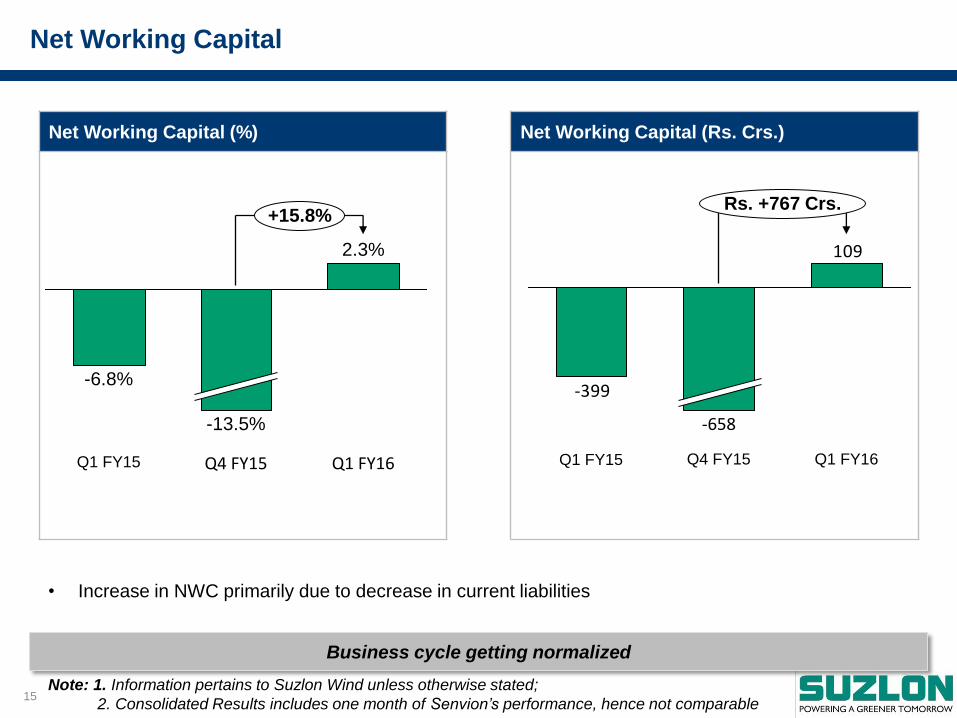
Net Working Capital (Rs. Crs.)
Net Working Capital (%)
Net Working Capital
• Increase in NWC primarily due to decrease in current liabilities
+15.8%
Q1 FY16
2.3%
Q4 FY15
-13.5%
Q1 FY15
-6.8%
109
-399
Rs. +767 Crs.
Q1 FY16 Q4 FY15
-658
Q1 FY15
Note: 1. Information pertains to Suzlon Wind unless otherwise stated;
2. Consolidated Results includes one month of Senvion’s performance, hence not comparable
Business cycle getting normalized
16
Contents
Industry Opportunities
Products & Technology
Quarterly Performance
Strategic Focus
Detailed Financials
17
226
226
226
188
222
194
2
152
140
23
123
87
128
128
128
121
162
179
218
188
78
216
206
184
177
114
107
210
224
230
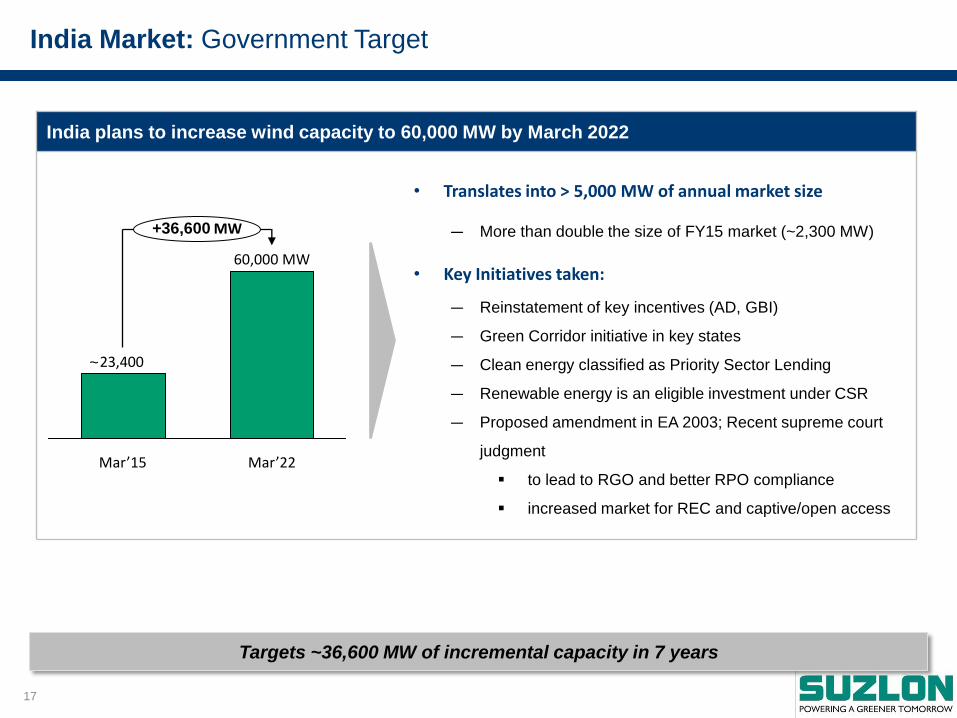
India plans to increase wind capacity to 60,000 MW by March 2022
India Market: Government Target
23,400
Mar’22
60,000 MW
+36,600 MW
Mar’15
• Translates into > 5,000 MW of annual market size
— More than double the size of FY15 market (~2,300 MW)
• Key Initiatives taken:
— Reinstatement of key incentives (AD, GBI)
— Green Corridor initiative in key states
— Clean energy classified as Priority Sector Lending
— Renewable energy is an eligible investment under CSR
— Proposed amendment in EA 2003; Recent supreme court
judgment
to lead to RGO and better RPO compliance
increased market for REC and captive/open access
~
Targets ~36,600 MW of incremental capacity in 7 years
18
226
226
226
188
222
194
2
152
140
23
123
87
128
128
128
121
162
179
218
188
78
216
206
184
177
114
107
210
224
230
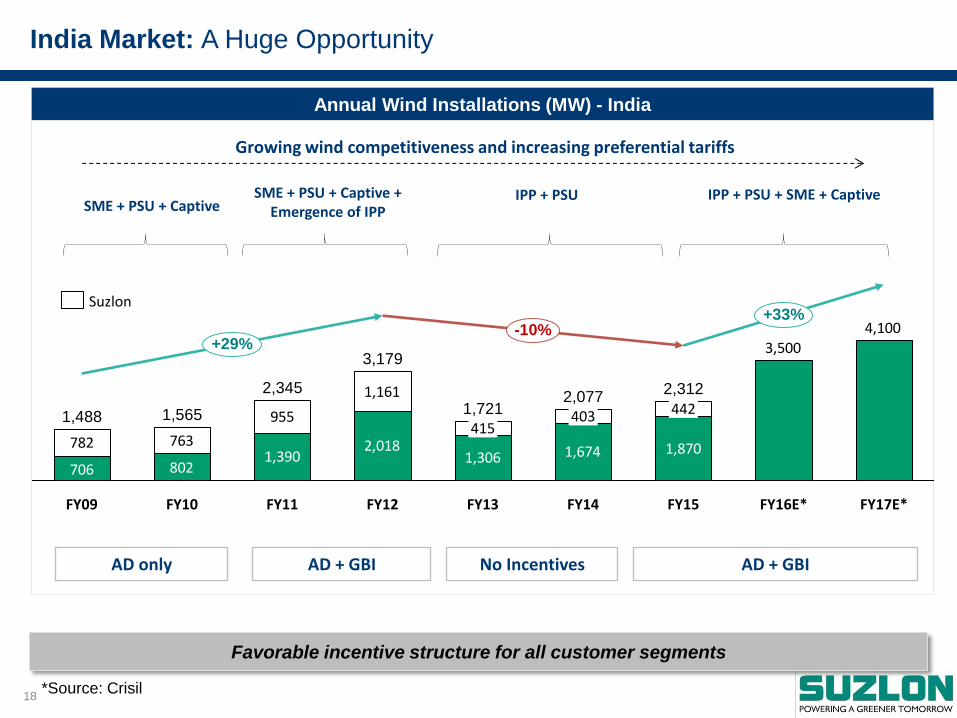
India Market: A Huge Opportunity
Annual Wind Installations (MW) - India
AD only AD + GBI No Incentives AD + GBI
Growing wind competitiveness and increasing preferential tariffs
SME + PSU + Captive SME + PSU + Captive +
Emergence of IPP IPP + PSU IPP + PSU + SME + Captive
1,3902,018
1,306 1,674 1,870782 763
955
1,161
4,1003,500
802706
-10% +33%
2,312
FY14
2,077
FY13
1,721
FY12
3,179
FY11
2,345
FY10
1,565
FY09
1,488 442 403
415
+29%
FY17E* FY16E* FY15
*Source: Crisil
Favorable incentive structure for all customer segments
Suzlon

19
226
226
226
188
222
194
2
152
140
23
123
87
128
128
128
121
162
179
218
188
78
216
206
184
177
114
107
210
224
230
Key Strengths in India: Unique Leadership Position
• In-house R&D team since 2000
• Enables to maintain competitive edge
Technology Leadership
02
• Large project pipeline across states
• Presence across customer segments
• >1,700 satisfied customer base
• High repeat business potential
Pan India Presence
01
• 18+ years of leadership in India
• Proven execution capabilities
• ~9 GW cumulative installations
Strong Track Record
05
• Custodian of 8+ GW assets
• 24X7 online tracking system
Best in Class Service
04
• One stop total solution for
customers
End-to-End Solution Provider
03
20
226
226
226
188
222
194
2
152
140
23
123
87
128
128
128
121
162
179
218
188
78
216
206
184
177
114
107
210
224
230
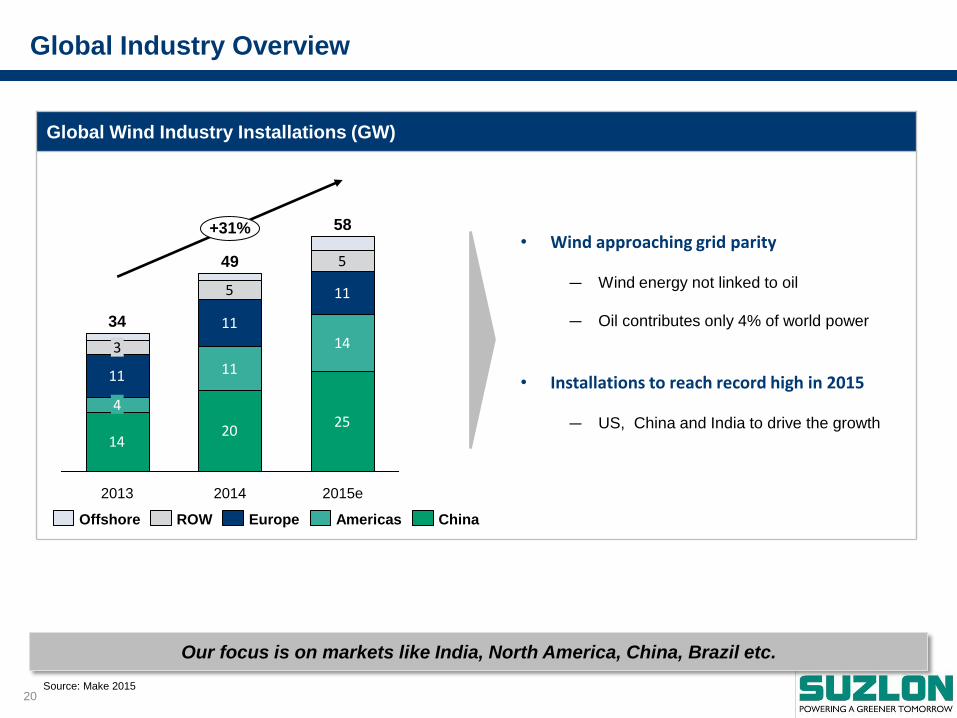
Global Wind Industry Installations (GW)
Global Industry Overview
• Wind approaching grid parity
― Wind energy not linked to oil
― Oil contributes only 4% of world power
• Installations to reach record high in 2015
― US, China and India to drive the growth 14
2025
11
14
11
11
115
5
+31%
2015e
58
2014
49
2013
34
4
3
China Europe Americas ROW Offshore
Source: Make 2015
Our focus is on markets like India, North America, China, Brazil etc.
21
Contents
Industry Opportunities
Products & Technology
Quarterly Performance
Strategic Focus
Detailed Financials

22
226
226
226
188
222
194
2
152
140
23
123
87
128
128
128
121
162
179
218
188
78
216
206
184
177
114
107
210
224
230
2MW series evolution
S111: Moving Towards Bigger Turbines and Better Yields
Higher energy yield Lower cost of energy Higher returns
Prototype Installed
>300 MW sold
~900 MW already
installed till date
Note: AEP increase are approximate and under certain conditions
Maximizes energy output for low wind sites in India and abroad
S111-120 S97-90 S97-120 S111-90
Prototype Installed
First contract concluded
Next year Launch
Targeted
33% Increase in Energy Yield
23
226
226
226
188
222
194
2
152
140
23
123
87
128
128
128
121
162
179
218
188
78
216
206
184
177
114
107
210
224
230
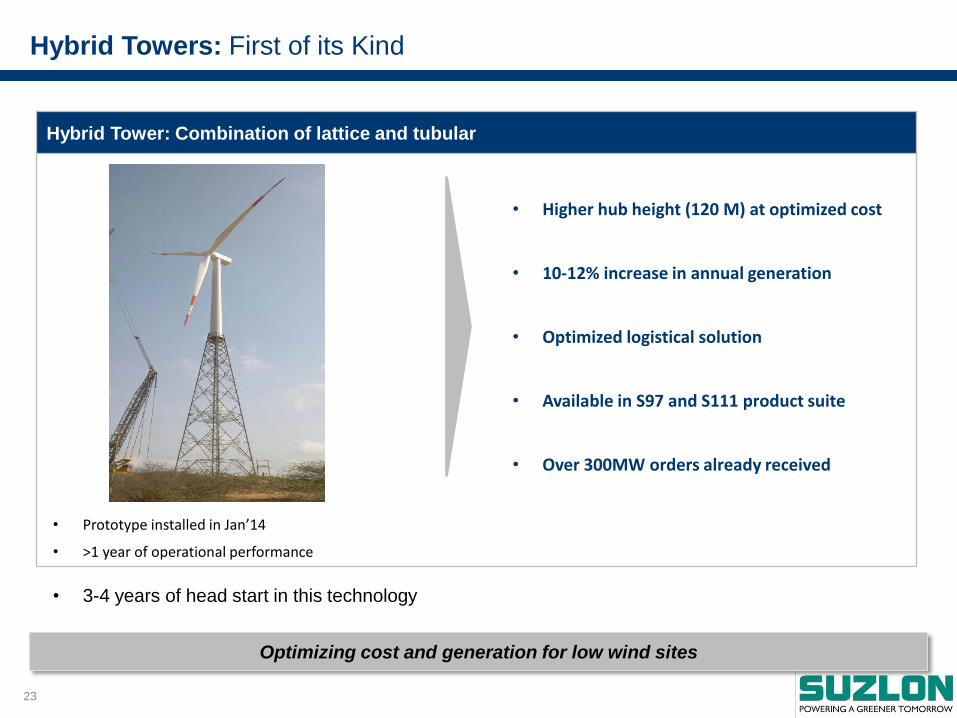
Hybrid Tower: Combination of lattice and tubular
Hybrid Towers: First of its Kind
• Higher hub height (120 M) at optimized cost
• 10-12% increase in annual generation
• Optimized logistical solution
• Available in S97 and S111 product suite
• Over 300MW orders already received
• Prototype installed in Jan’14
• >1 year of operational performance
Optimizing cost and generation for low wind sites
• 3-4 years of head start in this technology
24
Contents
Industry Opportunities
Products & Technology
Quarterly Performance
Strategic Focus
Detailed Financials
25
226
226
226
188
222
194
2
152
140
23
123
87
128
128
128
121
162
179
218
188
78
216
206
184
177
114
107
210
224
230
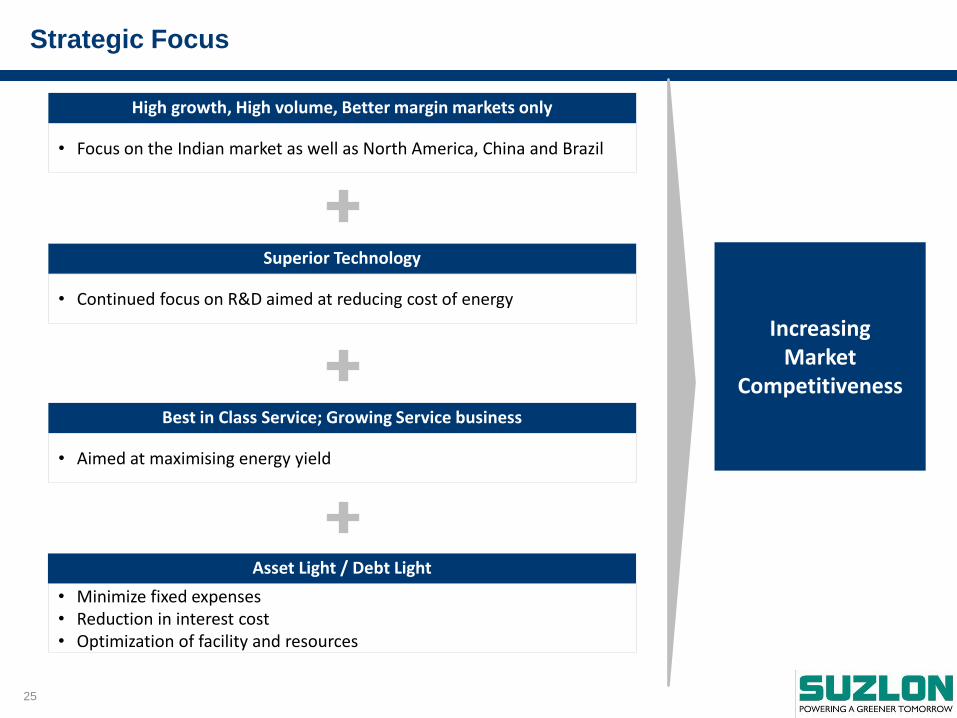
Strategic Focus
High growth, High volume, Better margin markets only
• Focus on the Indian market as well as North America, China and Brazil
Superior Technology
• Continued focus on R&D aimed at reducing cost of energy
Best in Class Service; Growing Service business
• Aimed at maximising energy yield
Increasing Market
Competitiveness
Asset Light / Debt Light
• Minimize fixed expenses • Reduction in interest cost • Optimization of facility and resources

26
Contents
Industry Opportunities
Products & Technology
Quarterly Performance
Strategic Focus
Detailed Financials
27
226
226
226
188
222
194
2
152
140
23
123
87
128
128
128
121
162
179
218
188
78
216
206
184
177
114
107
210
224
230
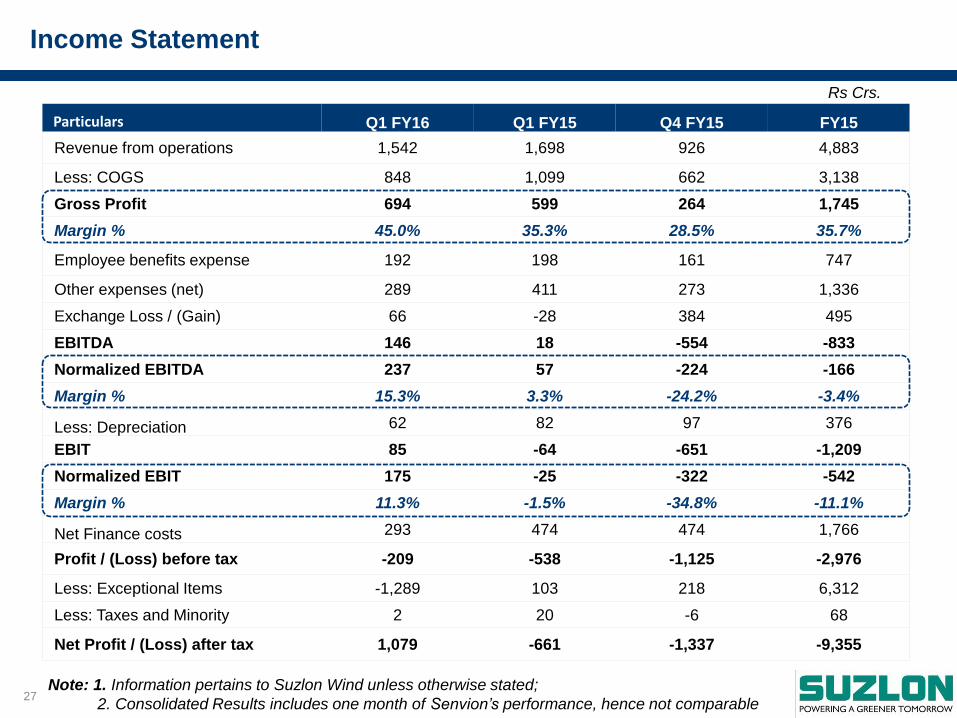
Income Statement
Rs Crs.
Particulars Q1 FY16 Q1 FY15 Q4 FY15 FY15
Revenue from operations 1,542 1,698 926 4,883
Less: COGS 848 1,099 662 3,138
Gross Profit 694 599 264 1,745
Margin % 45.0% 35.3% 28.5% 35.7%
Employee benefits expense 192 198 161 747
Other expenses (net) 289 411 273 1,336
Exchange Loss / (Gain) 66 -28 384 495
EBITDA 146 18 -554 -833
Normalized EBITDA 237 57 -224 -166
Margin % 15.3% 3.3% -24.2% -3.4%
Less: Depreciation 62 82 97 376
EBIT 85 -64 -651 -1,209
Normalized EBIT 175 -25 -322 -542
Margin % 11.3% -1.5% -34.8% -11.1%
Net Finance costs 293 474 474 1,766
Profit / (Loss) before tax -209 -538 -1,125 -2,976
Less: Exceptional Items -1,289 103 218 6,312
Less: Taxes and Minority 2 20 -6 68
Net Profit / (Loss) after tax 1,079 -661 -1,337 -9,355
Note: 1. Information pertains to Suzlon Wind unless otherwise stated;
2. Consolidated Results includes one month of Senvion’s performance, hence not comparable
28
226
226
226
188
222
194
2
152
140
23
123
87
128
128
128
121
162
179
218
188
78
216
206
184
177
114
107
210
224
230
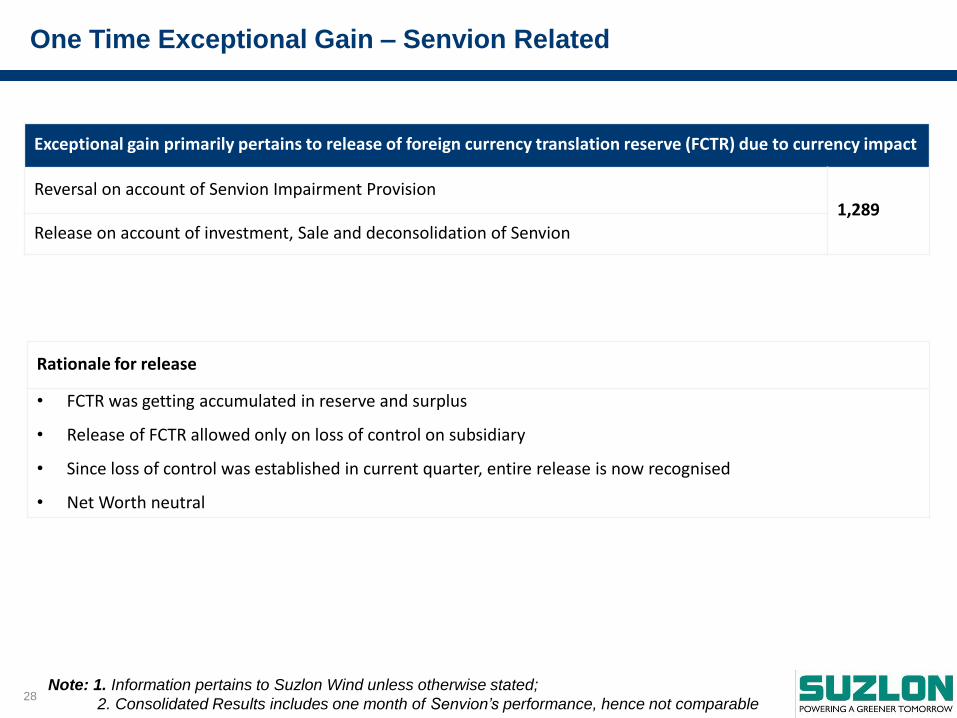
One Time Exceptional Gain – Senvion Related
Note: 1. Information pertains to Suzlon Wind unless otherwise stated;
2. Consolidated Results includes one month of Senvion’s performance, hence not comparable
Rationale for release
• FCTR was getting accumulated in reserve and surplus
• Release of FCTR allowed only on loss of control on subsidiary
• Since loss of control was established in current quarter, entire release is now recognised
• Net Worth neutral
Exceptional gain primarily pertains to release of foreign currency translation reserve (FCTR) due to currency impact
Reversal on account of Senvion Impairment Provision 1,289
Release on account of investment, Sale and deconsolidation of Senvion
29
226
226
226
188
222
194
2
152
140
23
123
87
128
128
128
121
162
179
218
188
78
216
206
184
177
114
107
210
224
230
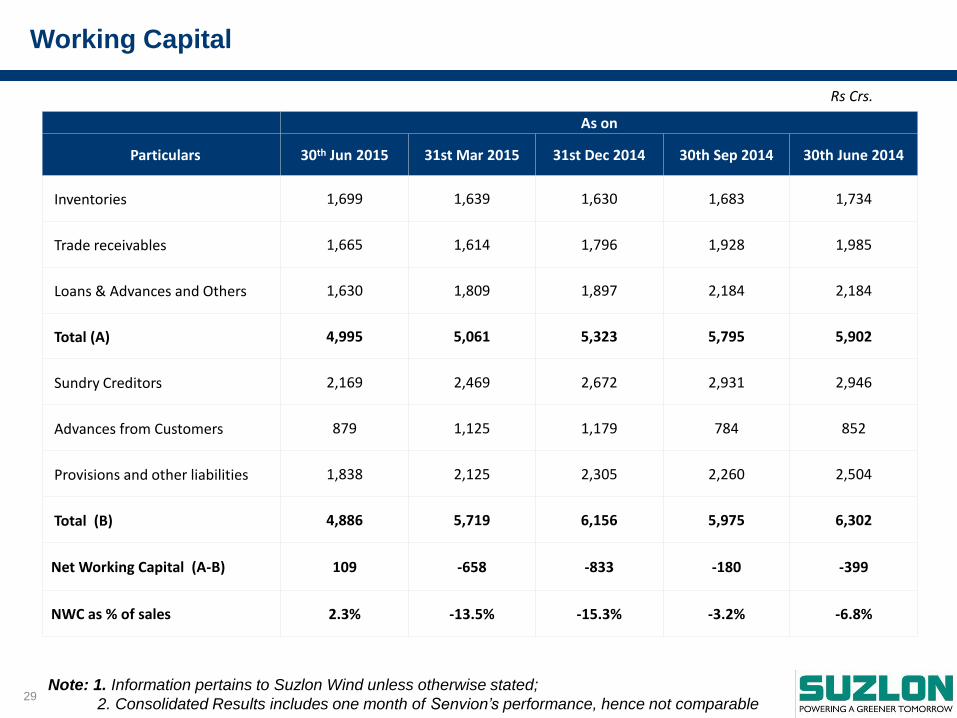
Working Capital
Rs Crs.
As on
Particulars 30th Jun 2015 31st Mar 2015 31st Dec 2014 30th Sep 2014 30th June 2014
Inventories 1,699 1,639 1,630 1,683 1,734
Trade receivables 1,665 1,614 1,796 1,928 1,985
Loans & Advances and Others 1,630 1,809 1,897 2,184 2,184
Total (A) 4,995 5,061 5,323 5,795 5,902
Sundry Creditors 2,169 2,469 2,672 2,931 2,946
Advances from Customers 879 1,125 1,179 784 852
Provisions and other liabilities 1,838 2,125 2,305 2,260 2,504
Total (B) 4,886 5,719 6,156 5,975 6,302
Net Working Capital (A-B) 109 -658 -833 -180 -399
NWC as % of sales 2.3% -13.5% -15.3% -3.2% -6.8%
Note: 1. Information pertains to Suzlon Wind unless otherwise stated;
2. Consolidated Results includes one month of Senvion’s performance, hence not comparable
30
THANK YOU
S111 Turbine, USA
S-111 I One of the largest commercially available rotor diameters in India


![Result update presentation Q2 FY16 [Company Update]](https://img.pdfslide.net/doc/110x75/577ca7c81a28abea748c8e41/result-update-presentation-q2-fy16-company-update.jpg)


![Investor and Analyst Q1 FY16 - Conference Call [Company Update]](https://img.pdfslide.net/doc/110x75/577cb29f1a28aba7118c1c65/investor-and-analyst-q1-fy16-conference-call-company-update.jpg)
![Performance Overview for Q1 FY16 [Company Update]](https://img.pdfslide.net/doc/110x75/577cb3171a28aba7118c3ca1/performance-overview-for-q1-fy16-company-update.jpg)


![Investor Update Q1 FY16 [Company Update]](https://img.pdfslide.net/doc/110x75/577cb41b1a28aba7118c4de4/investor-update-q1-fy16-company-update.jpg)