Embed Size (px)
Citation preview

Please carefully read important notices in the last pages of this report.
Korean companies strengthening global market positions
The electronic materials industry has strong growth potential, due to: ① high entry barriers, and ② robust operating leverage. While Japanese semiconductor/LCD
companies have suffered from profitability degradation since the 1980s, electronicmaterial manufacturers have displayed robust growth on exports to Korea and Taiwan. Meanwhile, domestic companies are strengthening their global market positions,backed by: ① support from domestic semiconductor and LCD producers; ②
technological progress; ③ government support; and ④ price competitiveness on yen
appreciation.
Attractive new markets
In our view, domestic companies will expand into the following markets: ① value-
added semiconductor materials market producers will require new materials when they migrate to finer processes; ② LCD materials market, namely liquid crystals and PVA film (most are currently imported); and ③ other growing markets, including
materials for active-matrix organic light emitting diode (AM OLED) and solar cells.
Top picks: LG Chem, Cheil Industries, Sodiff Advanced Materials
LG Chem (051910 KS) has room for growth, thanks to: ① strong customer base, including LG Display (LGD) and LG Electronics (LGE); ② cash inflow from petrochemical business; and ③ technological prowess. Cheil Industries (001300 KS) is
expected to benefit from process migration at Samsung Electronics (SEC). Meanwhile,Sodiff Advanced Materials (036490 KQ) is anticipated to lead the specialty gas market on cost competitiveness.
Ratings and valuations of top picks (Wbn, W, x, %) P/E P/B ROE EV/EBITDA
Code Company Rating Target
price
Closing
price on
Mar. 16
Market
cap 09P 10F 09P 10F 09P 10F 09P 10F
051910 LG Chem Buy 265,000 234,000 15,143 11.6 10.7 3.0 2.3 29.1 24.6 6.6 6.3
001300 Cheil Industries Buy 75,000 61,900 3,010 22.3 12.6 1.5 1.4 7.1 11.5 8.1 7.2
036490 Sodiff Advanced
Materials Buy 108,000 80,100 837 19.7 14.2 4.6 3.2 25.7 25.1 12.2 7.7
Source: Daewoo Securities Research
Electronic materials
Crown jewel of electronics industry
Korea Equity Research
Electronic Components
18 Mar 2010
Yeonju Park +82-2-768-3061 [email protected]
Eungju Lee +82-2-768-3857 [email protected]

Electronic Components
2
Contents
I. Industry outlook..............................................................................................................3
1. Growth potential of electronic materials industry ............................................................3
2. Strengthening global market positions of Korean companies.........................................4
3. New growth areas............................................................................................................7
II. Investment strategy and valuation ..............................................................................12
LG Chem (051910 KS)....................................................................................................13
Cheil Industries (001300 KS) ..........................................................................................15
Sodiff Advanced Materials (036490 KQ).........................................................................17
Techno Semichem (036830 KQ).....................................................................................19

Electronic Components
3
I. Industry outlook
1. Growth potential of electronic materials industry
Electronic materials are specialty chemical products that are used to manufacture high value-added electronics, such as semiconductors and LCDs. The Japanese electronic material industry has displayed robust growth since the 1990s. While the earnings of NEC, a Japanese chipmaker, have fluctuated in line with the semiconductor market, electronic material producers have maintained profitability and displayed high growth through exports to Korea and Taiwan. We recommend investors pay attention to the electronic materials industry for two reasons:
1) Companies are able to maintain earnings stability thanks to high entry barriers. It takes several years and massive capital to develop new products. In addition, it is difficult to obtain patents. Even if a company succeeds in developing new products, testing takes several months. Furthermore, it is difficult for companies to find opportunities to test products. Although electronic materials take up a small portion of production costs for end-products, end-producers might incur high costs if the materials are faulty. Thus, end-producers tend to stick with suppliers. Accordingly, electronic material producers are under less pressure to lower prices than other part manufacturers.
The global value-added electronic material market, including photoresists and liquid crystal, is dominated by a handful of companies. Merck of Germany, with 70% market share of the global liquid crystal market, is estimated to benefit from OP margin of over 50%. Hoya of Japan records OP margin of over 40% in the blank mask business. Their market shares continue to increase as production requires advanced technology.
Figure 1. OP margin of Japanese semiconductor and electronic material makers
Source: Thomson Reuters
2) Companies are able to expand sales and maintain strong profitability thanks to high operating leverage and expanding customer base. Unlike general chemical products, material costs account for just 20~30% of product prices. Accordingly, sales growth immediately leads to profitability improvement.
Japanese electronic material producers achieved sharp growth in the 2000s by exporting to Korea and Taiwan, while also supplying to the Japanese market. In addition, they enjoyed high growth and profitability by producing display materials in line with the boom in the LCD industry.
High entry barriers Earnings stability
Industry leaders enjoy oligopolistic positions
High operating leverage
-10
0
10
20
30
40
95 97 99 01 03 05 07 09
Shin-Etsu Chemical JSR SUMCO Elpida NEC
(%)

Electronic Components
4
Figure 2. Market cap. of Japanese semiconductor and electronic material makers
source: Thomson Reuters
Figure 3. Sales of Nitto Denko (polarizer maker) and global LCD panel makers
source: Thomson Reuters
2. Strengthening global market positions of Korean companies
1) Driving forces
First, leading domestic semiconductor/LCD companies, namely SEC and LGD, have expanded the use of domestic materials to prevent material shortages and reduce production costs.
Second, although Korean firms once lagged behind Japanese peers, they have developed technology through R&D investments.
Third, the Korean government funds projects and supports academic-industry research. The government is trying to improve the trade deficit, which for the most part is generated from importing electronic materials, as local semiconductor/LCD companies are still highly dependent on Japanese materials.
Fourth, the value of the yen has doubled since end-2008, driving up prices of Japanese electronic materials. To reduce production costs, Korean semiconductor/LCD companies are expanding the use of domestic products.
1) Support from downstream industry
2) Technological progress
3) Government support
4) Yen appreciation
0
1,000
2,000
3,000
4,000
95 97 99 01 03 05 07 09
0
200
400
600
800Sharp (L)
Chi Mei Optoelectronics (L)
LG Display (L)
AU Optronics (L)
Nitto Denko (R)
(JPYbn) (JPYbn)
0
2,000
4,000
6,000
8,000
10,000
95 97 99 01 03 05 07 09
NECSUMCOJSRShin-Etsu Chemical
(JPYbn) NEC's market cap has shrunk due tointensifying competition with Korean companies;Market caps of material producerssupplying to Korean companies have increased
Y

Electronic Components
5
Figure 4. Combined market share of Korean companies in the global IT market (2009)
source: IDC, Display Search, Daewoo Research
2) Domestic production of display materials
Domestic production of display materials increased in 2009, thanks to relatively low technical barriers. In addition, display makers were under pressure to reduce costs, as materials accounted for a large portion of total costs.
With LG Chem and Cheil Industries leading domestic production of polarizers, domestic polarizer makers gained additional market share (18% in 1Q07 to 31% in 4Q09). Backlight unit-use optical film makers stole market shares from global rivals. As a result, we estimate that 2009 sales at Shinwha Intertek and Mirae Nano Tech have increased 61% and 93%, respectively. Moreover, Dongjin SemichemÊs photoresist sales surged from W38.7bn in 2007 to W89.7bn in 2009, and Techno SemichemÊs etchant sales expanded 50%.
Table 1. Market share gain by Korean electronic material makers in 2009 (Wbn, %) Sales at the division
Company name Product Competitors 2008 2009P Growth
Cheil Industries Polarizer Nitto Denko, Dongwoo Fine Chem 369.5 617.1 66.9
Techno Semichem Etchant for LCD Dongwoo Fine Chem 54.4 81.8 50.4
Dongjin Semichem Photoresist for LCD JSR, Dongwoo Fine Chem 63.7 89.7 40.8
Shinhwa Intertek Optical film 3M 242.2 389.3 60.7
Mirae Nanoteck Optical film 3M 139.3 268.4 92.7
KC TECH CMP slurry Cabot, Techno Semichem 0 6.8 N.ASource: Daewoo Securities Research
Figure 5. Global polarizer market share by country
Source: Display Search
LG Chem and Cheil Industries lead domestic production of polarizers
0
20
40
60
DRAM Flash LCD Handset RechargableBattery
(%)
0
20
40
60
80
07 08 09
Korean makers
Japanese makers
(%)

Electronic Components
6
3) Domestic production of semiconductor materials
Compared to display materials, domestic production of semiconductor materials has been slow due to higher technical barriers and a smaller portion of material costs at semiconductor makers. Migration to finer processes makes it difficult for second-tier companies to catch up with top-tier companies.
Sodiff and Techno Semichem are major domestic producers of special gas and etchant, respectively. Sodiff is the largest NF3 gas producer in the domestic market, and is widening the gap with global rivals through aggressive capacity expansion. Techno Semichem is the exclusive supplier of semiconductor-use etchant to SEC and Hynix. Domestic production of CMP slurry is also increasing, thanks to slurry manufacturers such as Cheil Industries, Techno Semichem and KC Tech KC Tech started slurry production in 2009.
Sales of front-end process materials related to patterning are increasing at Cheil Industries. New markets are emerging as finer processes require new materials. We expect Cheil Industries to expand market share of front-end process materials in partnership with SEC.
Figure 6. Localization ratio of semiconductor materials
Source: KSIA
Table 2. Semiconductor materials and suppliers (2008) (Wtr, %) Market portion Market size Global suppliers Domestic suppliers
Wafer 50 13.0 MEMC, Shin-Etsu Siltron
Special gas 13 3.4 Mitsui Chemical (NF3), REC (SiH4) Sodiff Advanced Materials (NF3, SiH4, WF6)
Photo mask 13 3.4 Photronics (Photo Mask), Hoya (Blank Mask) LG Innotek (Photo Mask), S&S Tech (Blank Mask)
Photo resists 9 2.3 JSR, TOK, Shin-Etsu, Fujifilm, Sumimoto Dongjin Semichem (KrF PR)
CMP pad and slurry 4 1.0 Cabot, Hitachi, Sumitomo, Mitsui, Fuji, JSR KC Tech, Techno Semichem (Ceria Slurry),
Cheil Industries (Silika Slurry)
Processing
materials 4 1.0 Dongwoo Fine Chem, Mitsuibishi
Techno Semichem (Etchant), Nepes,
ENF Technology (Thinner)
Front end
process
Materials
Sub total 100 26.0
Printed circuit board 38 5.6 Ibiden, Nanya PCB SEC, Daeduck Electronics, Simmtek
Bonding wire 19 2.8
Lead frame 18 2.6
Epoxy molding
compound 10 1.5 Sumitomo, Hitachi, Mitsubishi, Nitto Cheil Industries
Die Attach Film 3 0.4 Hitachi, Lintek Cheil Industries
Back end
process
materials
Sub total 100 14.7 Source: Daewoo Securities Research
Sodiff and Techno Semichem increase domestic production of semiconductor materials
Cheil Industries to increase semiconductor material sales
4143
46
61
66
56
30
40
50
60
70
06 07 08
Front-end materials
Back-end materials
(%)

Electronic Components
7
3. New growth areas
1) Focus on new semiconductor materials
A. ArF photoresist
Migration to finer processes is increasing demand for ArF photoresist, a light-sensitive material used to form a patterned coating on semiconductor circuits. Fujifilm estimates that 2009 ArF resist sales increased 7.7%, even though the semiconductor material market contracted 24.2%. ArF sales should increase going forward as process migration picks up speed. Compared to existing KrF, ArF profit margin should be bigger due to high prices their market sizes are the same but in terms of quantity, ArF is only 20% of KrF.
Table 3. Market share of photoresist makers (2007) (%) JSR TOK Shin-Etsu Fujifilm Sumitomo
KrF 27 26 19 7 16
ArF 24 20 16 14 14Source: Chemical Journal
Figure 7. Technology roadmap of photoresists
Source: Fujifilm
B. High-k insulator
High-k (high-dielectric) materials are metal oxides with high dielectric constants, which are used to insulate MPU (microprocessor unit) gates or DRAM capacitors. There is an increasing need for high-k materials due to leakage current from process migration. The high-k insulator market is estimated to have increased 33.3% YoY to JPY1bn in 2009 (Fuji-Keizai). We forecast the market to reach JPY2bn by 2013, backed by an increase in migration to under 45nm process.
C. CMP slurries
Planarization of wafers is increasingly important to improve yield and reliability of memory chips due to process migration and multi-layered structures. As such, chipmakers are increasing the frequency of the chemical-mechanical polishing/planarization (CMP) process. As copper wires used to reduce resistance in fine processes are rarely etched, the CMP process removes unnecessary materials after deposition. In particular, we expect demand for ceria and copper slurries to increase rapidly. The CMP slurry market is estimated at W57.3bn (Fuji-Keizai) in 2009.
Demand for new semiconductor materials to rise
The high-k insulator market is estimated at JPY1bn in 2009 and forecast to reach JPY2bn by 2013

Electronic Components
8
Figure 8. High-k materials in semiconductor structure
Source: DNF
Figure 9. Types of slurry
Source: KC Tech
Metal
High-K Interfacial Layer
SiGe
Si
Silicon Substrate
Si or SiGe or SiGe:C
Market attractiveness
Technological Difficulty
ILD use Silica Slurry
ILD use Ceria Slurry

Electronic Components
9
D. Hardmask materials
Hardmask materials are used to narrow linewidth of memory chips. In 70nm or below processes, a thick photoresist would increase the aspect ratio of patterns, deforming patterns. However, it is impossible to form a deep pattern with a thin photoresist. Therefore, hardmasks are used to transfer mask patterns on wafers.
Hardmask is fabricated using CVD or spin-coating methodology. Although the CVD technique is used more frequently, we believe the use of spin-coating methodology will expand due to low costs. We expect the market for spin-coating hardmask materials, which was estimated at W100bn in 2009, to expand at CAGR of over 40%.
E. SOD (spin-on dielectric)
A spin-on dielectric (SOD) is a super-low dielectric insulator used in 70nm or below processes, as it is difficult to secure a gap-fill margin due to high aspect ratio. At present, SODs are mostly imported.
F. Die-bond film
Die-bond film is an adhesive film used for NAND flash stacking. The global die-bond film market, which is estimated to have reached JPY15bn in 2009, is currently dominated by three makers. As of 2008, Hitachi Chemical controls 69% of the market, and Lintec and Nitto control 11% and 17%, respectively.
Figure 10. Types of hardmasks (CVD vs. spin coating) Figure 11. Die-bond film
Source: Industry source Source: Industry source
Hardmask materials are used to narrow linewidths
SOD used as insulator in fine processes
Die-bond film is an adhesive film for NAND flash stacking
ACL+Sion
CVD+Coationg
PR
ACL
Substrate
BARC Sion
PR Patterning BARC/Sion
Etch
ACL Etch Substrate Etch
O₂Ashing
Coationg only PR Patterning Si-SOH Etch
C-SOH Etch
Substrate Etch
O₂Ashing
PR Si-SOH
c-SOH
Substrate
CVD
Hardmask
Spin Coating
Hardmask
Electronic Components
10
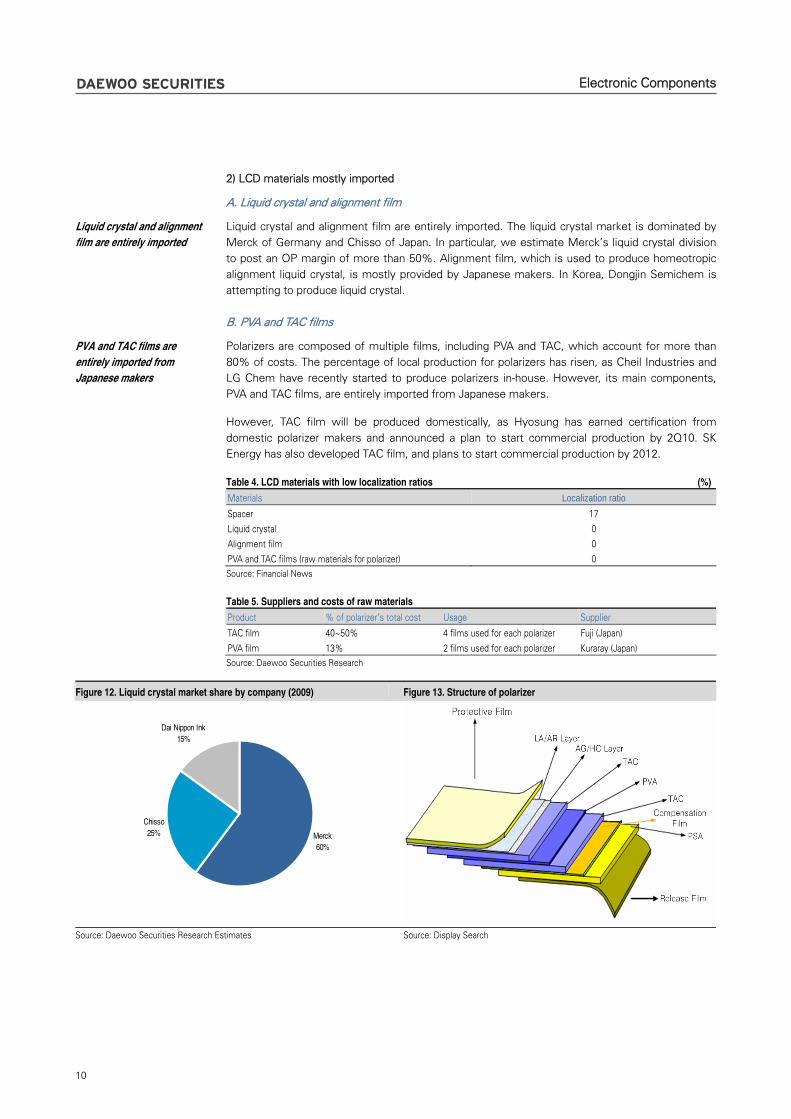
2) LCD materials mostly imported
A. Liquid crystal and alignment film
Liquid crystal and alignment film are entirely imported. The liquid crystal market is dominated by Merck of Germany and Chisso of Japan. In particular, we estimate MerckÊs liquid crystal division to post an OP margin of more than 50%. Alignment film, which is used to produce homeotropic alignment liquid crystal, is mostly provided by Japanese makers. In Korea, Dongjin Semichem is attempting to produce liquid crystal.
B. PVA and TAC films
Polarizers are composed of multiple films, including PVA and TAC, which account for more than 80% of costs. The percentage of local production for polarizers has risen, as Cheil Industries and LG Chem have recently started to produce polarizers in-house. However, its main components, PVA and TAC films, are entirely imported from Japanese makers.
However, TAC film will be produced domestically, as Hyosung has earned certification from domestic polarizer makers and announced a plan to start commercial production by 2Q10. SK Energy has also developed TAC film, and plans to start commercial production by 2012.
Table 4. LCD materials with low localization ratios (%) Materials Localization ratio Spacer 17
Liquid crystal 0
Alignment film 0
PVA and TAC films (raw materials for polarizer) 0 Source: Financial News
Table 5. Suppliers and costs of raw materials Product % of polarizerÊs total cost Usage Supplier
TAC film 40~50% 4 films used for each polarizer Fuji (Japan)
PVA film 13% 2 films used for each polarizer Kuraray (Japan) Source: Daewoo Securities Research
Figure 12. Liquid crystal market share by company (2009) Figure 13. Structure of polarizer
Source: Daewoo Securities Research Estimates Source: Display Search
Liquid crystal and alignment film are entirely imported
PVA and TAC films are entirely imported from Japanese makers
Merck60%
Chisso25%
Dai Nippon Ink15%

Electronic Components
11
3) Downstream market growth to provide boost
AM OLED market should show robust long-term growth on application diversification from high-end handsets to TVs. Application diversification requires the development of better raw materials, which are produced by LG Chem and Duksan Hi-Metal Co.
We expect the rechargeable battery market to show robust growth starting in 2012, led by electric vehicle-use batteries. Raw materials determine the quality of rechargeable batteries, including energy density, voltage, and reliability. Among raw materials, cathode and separator markets have higher technological barriers. Nevertheless, we expect many companies to enter the separator business, as few domestic companies currently produce the product. Major battery material suppliers include L&F (cathode), Ecopro (cathode), Techno Semichem (electrolyte), and SK Energy (separator).
As for the photovoltaic power generation business, price competitiveness depends on material expenses, which account for over 70% of production costs. Polysilicon spot prices surpassed US$400/kilogram due to a material supply shortage in 1H08. However, spot prices plunged to US$50/kilogram as of 1Q10, due to oversupply.
The photovoltaic power generation market has been suffering from oversupply. However, demand is recovering thanks to: ① lower unit prices, and ② international government support. In Korea,
OCI has the second-largest production capacity in the world and KCC plans to begin production.
Table 6. New applications and material makers Application Material Suppliers
AM OLED LG Chem, Ducksan Hi-metal
Anode materials L&F, Ecopro
Cathode materials Sodiff Advanced Materials, Carbonics
Electrolyte Techno Semichem, Ukseong Rechargeable battery
Separator SK Energy
Polysilicon OCI, KCC, Woongjin Polysilicon
Ingot/wafer Nexolon, Neosemitech
Cell Shinsung Holdings, Millinet Photovoltaic power generation
Paste Dupont, SSCP Source: Daewoo Securities Research
AM OLED market to grow on application diversification
Demand for photovoltaic power generation is rising

Electronic Components
12
II. Investment strategy and valuation
Top picks: LG Chem, Cheil Industries, Sodiff Advanced Materials
We maintain our Buy call on LG Chem with a target price of W265,000. LG Chem has excellent growth potential, thanks to: customer base (LGD and LGE), capital (massive cash flow from petrochemical division), and technology.
We also maintain our Buy call on Cheil Industries with a target price of W75,000. We expect the company to benefit from process migration at Samsung Electronics (SEC). Producers require new materials when they migrate to finer processes, and Cheil Industries has the potential to lead the semiconductor material market. New materials should account for 19% of operating profit in 2011 - new material sales will likely increase to W194.9bn in 2011, from W37.9bn in 2008.
As for Sodiff Advanced Materials, we maintain our Buy rating and target price of W108,000. We expect the company to strengthen its special gas market position on cost competitiveness. Within 2~3 years, sales and margins should improve thanks to new facilities. Sodiff expanded capacity of NF3 and SiH4 (monosilane) by 30% and 400%, respectively.
Figure 14. P/B and operating profits of JSR (Japanese electronic material maker)
Source: Daewoo Securities Research
Table 7. Top picks - Korean electronic materials (Wbn, W, x, %) R/B P/B ROE EV/EBITDA
Code Company name Rating Market Cap. Target priceClosing price
on Mar. 16 09P 10F 09P 10F 09P 10F 09P 10F
051910 LG Chem Buy 15,143 265,000 228,500 11.6 10.7 3.0 2.3 29.1 24.6 6.6 6.3
001300 Cheil Industries Buy 3,010 75,000 60,200 22.3 12.6 1.5 1.4 7.1 11.5 8.1 7.2
036490 Sodiff Advanced Materials Buy 837 108,000 79,400 19.7 14.2 4.6 3.2 25.7 25.1 12.2 7.7Source: Daewoo Securities Research
LG Chem: Buy with target price of W265,000
Cheil Industries: Buy with target price of W75,000
Sodiff: Buy with target price of W108,000
0
1
2
3
4
5
97 98 99 00 01 02 03 04 05 06 07
0
20
40
60
80화학 영업이익(우)전자재료 영업이익(우)JSR PBR (L)
(x) (Wbn)
Valuation Re-rating
OP from chemical division (R)OP from electronic material division (R)JSR P/B (L)

Electronic Components
13
LG Chem (051910 KS)
Evolving into global player
We maintain our Buy recommendation on LG Chem and target price of W265,000, which corresponds to 2010F P/E of 14x and P/B of 2.9x. Our target price is derived using sum-of-the-parts methodology.
The company has excellent growth potential, thanks to: ① strong customer base, including LG Display (LGD) and LG Electronics (LGE); ② cash inflow from petrochemical business; and ③
technological prowess.
Our forecast is based on the following:
1) LCD materials: The LCD material business is growing quickly thanks to LGD. LG Chem claimed the largest market share of the global polarizer market in 2009. Growth potential and profitability should improve, thanks to: ① expansion of 8th generation line at LGD; ② operation of wide polarizer production lines; and ③ domestic production of TAC film, one of the major materials for
polarizers.
In addition, the company plans to commercially produce LCD glass in 2H11, which should improve earnings. LGD purchases LCD glass worth W3tr annually, and OP margin exceeds 40~50%.
2) OLED materials: Since 2004, LG Chem has produced OLED materials, including hole injection layers (HIL) and electron transporting layers (ETL). The business is expected to drive growth, in line with market expansion. In January 2010, LG Group acquired Eastman KodakÊs OLED unit, which holds OLED-related patents. This should help LG Chem strengthen its market position.
3) Rechargeable battery: As of end-2009, LG Chem was the third largest small-size rechargeable battery manufacturer in the world. The company will benefit from solid relationships with major customers, such as Nokia. Meanwhile, the mid- to large-size rechargeable battery business has even greater growth potential. Currently, the company is leading the global electronic vehicle (EV) battery market by clinching supply deals with GM and Hyundai-Kia Automotive Group. As many countries plan to support the ÂgreenÊ car industry, the mid- to large-size rechargeable battery market should exceed the small-size battery market in terms of value after 2013.
Eungju Lee +82-2-768-3857
Buy Bloomberg: 051910 KS
Target Price (12M, W): 265,000
Share Price (03/16/10, W): 228,500
Expected Return (%): 16.0
Sector: Chemicals
Sector Rating: Overweight
EPS Growth (10F, %): -0.3
Market EPS Growth (10F, %): 45.5
P/E (X): 11.6
Market P/E (03/16/10F, x): 10.1
Market Cap (Wbn): 15,143
Shares Outstanding (mn): 74
Avg Trading Volume (60D, '000): 351
Avg Trading Value (60D, Wbn): 77
Margin Balance ('000 sh): 274
Dividend Yield (10F, %): 1.5
Free Float (%): 65.9
52-Week Low/High: 83,000/253,000
Beta (12M, Daily Rate of Return): 1.0
Price Return Volatility (12M Daily,%,SD): 3.8
Foreign Ownership (%): 24.8
Major Shareholder(s):
LG et al. (33.55%)
Mirae Asset Investments et al. (11.31%)
National Pension Service (5.67%)
Price Performance
(%) 1M 6M 12M
Absolute 8.3 -1.9 166.5
Relative 5.4 0.2 120.1
20
70
120
170
220
270
320
3/09 7/09 11/09 3/10
Share price KOSPI
FY Sales OP OP Margin NP EPS EBITDA FCF ROE P/E P/B EV/EBITDA
(Wbn) (Wbn) (%) (Wbn) (W) (Wbn) (Wbn) (%) (x) (x) (x)
12/07 10,795 764 7.1 686 9,166 1,227 570 21.1 9.6 1.8 6.4
12/08 12,645 1,344 10.6 1,003 11,950 1,768 224 22.9 5.9 1.2 3.7
12/09 13,695 1,945 14.2 1,507 19,729 2,379 1,178 29.1 11.6 3.0 6.6
12/10F 15,450 1,886 12.2 1,503 19,680 2,297 620 24.6 11.6 2.5 6.9
12/11F 18,962 2,040 10.8 1,599 20,931 2,498 567 21.6 10.9 2.1 6.2
Source: Company data, Daewoo Securities Research estimates

Electronic Components
14
Financial Statement
Income Statement (Summarized) Balance Sheet (Summarized) (Wbn) 12/08 12/09 12/10F 12/11F (Wbn) 12/08 12/09 12/10F 12/11FSales 12,645 13,695 15,450 18,962 Current Assets 3,317 3,657 4,054 4,710
Cost of Goods Sold 10,506 10,876 12,693 15,967 Cash and Cash Equivalents 373 863 837 519
Gross Profit 2,139 2,819 2,758 2,995 Accounts Receivable 1,123 1,228 1,532 1,896
SG&A 795 874 872 955 Inventories 1,509 1,341 1,532 1,896
Operating Profit 1,344 1,945 1,886 2,040 Other Current Assets 311 226 153 398
Non-Operating Income -99 40 97 70 Non-Current Assets 4,720 4,702 5,634 6,531
Interest Income/Expense -35 -8 -11 0 Investment Assets 965 939 1,189 1,457
F/X-Related Gain/Loss -180 39 2 -58 Property, Plant and Equipment 3,868 3,860 4,511 5,126
Equity Method Gain/Loss -16 138 148 166 Intangible Assets -113 -97 -66 -53
Asset Disposal Gain/Loss -6 -25 0 0 Total Assets 8,036 8,359 9,688 11,240
Other Non-Operating Profit/Loss 138 -104 -42 -38 Current Liabilities 2,162 2,265 2,462 2,776
Pretax Profit 1,245 1,984 1,983 2,110 Accounts Payable 527 868 919 1,138
Tax 300 445 480 511 Short-Term Debt 0 0 0 0
Profit from Continuing Operation 946 1,540 1,503 1,599 Current Long-Term Debt 575 455 548 405
Profit from Discontinued Operation 57 -33 0 0 Other Current Liabilities 1,060 942 996 1,233
Tax Effect 22 0 0 0 Non-Current Liabilities 984 609 487 385
Net Profit 1,003 1,507 1,503 1,599 Bonds 361 275 204 119
Residual Income 1,003 1,507 1,503 1,599 Long-Term Debt 459 129 90 45
EBITDA 1,768 2,379 2,297 2,498 Other Non-Current Liabilities 164 205 194 221
Free Cash Flow 224 1,178 620 567 Total Liabilities 3,147 2,874 2,950 3,161
Gross Profit Margin (%) 16.9 20.6 17.9 15.8 Paid-In Capital 420 370 370 370
EBITDA Margin (%) 14.0 17.4 14.9 13.2 Capital Surplus 1,315 1,187 1,187 1,187
Operating Margin (%) 10.6 14.2 12.2 10.8 Retained Earnings 3,037 4,335 5,580 6,922
Net Margin (%) 7.9 11.0 9.7 8.4 Stockholders' Equity 4,890 5,484 6,738 8,079
Cash Flow (Summarized) Forecasts/Valuations (Summarized)
(Wbn) 12/08 12/09 12/10F 12/11F 12/08 12/09 12/10F 12/11FCash Flow from Operating Activities 969 2,109 1,660 1,621 P/E (x) 5.9 11.6 11.6 10.9
Net Profit 1,003 1,507 1,503 1,599 P/CF (x) 4.2 9.1 8.5 7.9
Non-Cash Income and Expense 586 436 261 351 P/B (x) 1.2 3.0 2.5 2.1
Tangible Assets Depreciation 402 415 392 438 EV/EBITDA (x) 3.7 6.6 6.9 6.2
Intangible Assets Depreciation 21 19 19 20 EPS (W) 11,950 19,729 19,680 20,931
Others 163 2 -150 -108 CFPS (W) 16,741 25,156 24,807 26,670
Chg in Working Capital -620 166 -105 -329 BPS (W) 59,625 75,529 92,067 110,041
Chg in Accounts Receivable -212 -394 -107 -365 DPS (W) 2,500 3,500 3,500 3,600
Chg in Inventories -348 91 -107 -364 Payout Ratio (%) 20.9 17.1 17.1 16.6
Chg in Accounts Payable -211 471 64 219 Dividend Yield (%) 3.5 1.5 1.5 1.6
Others 151 -3 45 181 Sales Growth (%) 17.1 8.3 12.8 22.7
Cash Flow from Investment Activities -786 -930 -1,162 -1,426 EBITDA Growth (%) 44.0 34.6 -3.0 8.8
Chg in Tangible Assets -745 -931 -1,040 -1,054 Operating Profit Growth (%) 76.1 44.7 -3.1 8.2
Chg in Intangible Assets -42 -16 -41 -33 EPS Growth (%) 30.4 65.1 -0.3 6.4
Chg in Investment Assets 43 -31 -78 -102 Accounts Receivable Turnover (x) 12.0 11.7 10.5 11.1
Others -42 48 -4 -238 Inventory Turnover (x) 9.5 9.6 10.5 11.1
Cash Flow from Financing Activities -276 -476 -368 -512 Accounts Payable Turnover (x) 19.8 19.6 17.4 18.4
Chg in Borrowings -131 -264 -117 -244 ROA (%) 13.3 18.4 16.6 15.3
Chg in Equity -145 -211 -258 -258 ROE (%) 22.9 29.1 24.6 21.6
Dividends -167 -209 -258 -258 ROIC (%) 21.7 29.7 28.6 26.5
Others 0 0 6 -10 Liability to Equity Ratio (%) 64.4 52.4 43.8 39.1
Chg in Cash -93 489 129 -318 Current Ratio (%) 153.4 161.5 164.6 169.7
Beginning Cash Balance 466 373 707 837 Net Debt to Equity Ratio (%) 17.9 -1.9 0.1 -1.7
Ending Cash Balance 373 863 836 519 Interest Coverage Ratio (x) 34.3 59.5 52.0 57.9Source: Company data, Daewoo Securities Research estimates

Electronic Components
15
Cheil Industries (001300 KS)
Different shade of competitiveness
We maintain our Buy call on Cheil Industries and a target price of W75,000. We apply the sum-of-the-parts valuation method to calculate the target price, which corresponds to 2010F P/E of 16x and P/B of 1.8x. A valuation re-rating is likely in the mid- to long-term as the electronic materials division is set to lead the companyÊs growth. The divisionÊs sales and operating profit should show a CAGR of 30% and 35% until 2011, respectively. The Japanese chemical company JSR saw its P/B multiple double to 4x after its electronic materials business started to make meaningful contributions to earnings in 2003.
Technological advancement at the electronic materials division is strengthening synergies with its captive customer, Samsung Electronics (SEC). In cooperation with SEC, Cheil has developed patterning material, a key material used in front-end process of semiconductor production, and now supplies more than 50% of the global demand. This indicates CheilÊs position as an SEC vendor has strengthened and synergies between the two companies will improve going forward. The high composition of low-end products in its product portfolio had been a drag on CheilÊs sales growth and margin improvement, and led the company to underutilize SEC as its captive customer.
Cheil has a host of other electronic materials for semiconductors in the pipeline and expects to see new materials, including patterning material, make up 10% and 34% of the divisionÊs sales and operating profit in 2011, respectively. The electronic materials division should account for 37% of CheilÊs sales (up from 28% in 2009) and 47% of operating profit (up from 36%) in 2011. The division generated W94.6bn in operating profit in 2009 on sales of W120.9bn.
CheilÊs 1Q10 operating profit should jump 41% YoY to W64.3bn on sales of W1.13tr, up 22%, in line with consensus estimates. Electronic materials sales should hum along, defying weak seasonality, given high capacity utilization in downstream industries. Polarizer sales should also rise QoQ as subsidiary Ace Digitech expanded capacity in March. The petrochemical divisionÊs sales are also projected to increase in light of strong demand in China and product price hikes. The apparel divisionÊs sales are to display double-digit growth YoY, underpinned by the economic recovery.
Yeonju Park +82-2-768-3061
Buy Bloomberg: 001300 KS
Target Price (12M, W): 75,000
Share Price (03/16/10, W): 60,200
Expected Return (%): 24.6
Sector: Electronic Equipment Instruments
Sector Rating: Overweight
EPS Growth (10F, %): 88.1
Market EPS Growth (10F, %): 45.5
P/E (X): 12.6
Market P/E (03/16/10F, x): 10.1
Market Cap (Wbn): 3,010
Shares Outstanding (mn): 50
Avg Trading Volume (60D, '000): 319
Avg Trading Value (60D, Wbn): 19
Margin Balance ('000 sh): 388
Dividend Yield (10F, %): 2.5
Free Float (%): 86.6
52-Week Low/High: 37,200/64,000
Beta (12M, Daily Rate of Return): 0.8
Price Return Volatility (12M Daily,%,SD): 2.0
Foreign Ownership (%): 23.7
Major Shareholder(s):
Korea Investment Trust (9.1%)
Samsung Card et. al (7.78%)
National Pension Service (6.86%)
Price Performance
(%) 1M 6M 12M
Absolute 3.1 14.0 61.8
Relative 0.1 16.1 15.4
20
70
120
170
220
3/09 7/09 11/09 3/10
Share price KOSPI
FY Sales OP OP Margin NP EPS EBITDA FCF ROE P/E P/B EV/EBITDA
(Wbn) (Wbn) (%) (Wbn) (W) (Wbn) (Wbn) (%) (x) (x) (x)
12/07 3,112 224 7.2 151 3,025 314 18 9.8 17.3 1.7 9.8
12/08 3,728 240 6.4 157 3,149 353 -43 9.5 12.8 1.4 7.6
12/09 4,261 264 6.2 127 2,540 395 340 7.1 22.2 1.5 8.1
12/10F 4,956 329 6.6 239 4,777 464 82 11.5 12.6 1.4 7.2
12/11F 5,503 370 6.7 280 5,595 511 160 12.2 10.8 1.3 6.3
Source: Company data, Daewoo Securities Research estimates

Electronic Components
16
Financial Statement
Income Statement (Summarized) Balance Sheet (Summarized) (Wbn) 12/08 12/09 12/10F 12/11F (Wbn) 12/08 12/09 12/10F 12/11FSales 3,728 4,261 4,956 5,503 Current Assets 1,058 1,146 1,257 1,347
Cost of Goods Sold 2,610 3,018 3,574 4,060 Cash and Cash Equivalents 16 80 57 59
Gross Profit 1,118 1,244 1,382 1,443 Accounts Receivable 358 444 531 588
SG&A 878 980 1,054 1,073 Inventories 534 488 531 559
Operating Profit 240 264 329 370 Other Current Assets 151 135 137 141
Non-Operating Income -49 -108 -37 -29 Non-Current Assets 1,685 1,972 2,063 2,153
Interest Income/Expense -32 -35 -25 -20 Investment Assets 558 923 934 949
F/X-Related Gain/Loss -16 -3 -2 -2 Property, Plant and Equipment 990 988 1,066 1,140
Equity Method Gain/Loss -22 9 10 13 Intangible Assets 138 61 62 65
Asset Disposal Gain/Loss -1 -6 0 0 Total Assets 2,744 3,119 3,320 3,500
Other Non-Operating Profit/Loss 22 -73 -20 -20 Current Liabilities 691 607 655 692
Pretax Profit 191 155 291 341 Accounts Payable 167 292 340 377
Tax 34 28 52 61 Short-Term Debt 211 0 0 0
Profit from Continuing Operation 157 127 239 280 Current Long-Term Debt 130 62 62 62
Profit from Discontinued Operation 0 0 0 0 Other Current Liabilities 184 253 253 253
Tax Effect 0 0 0 0 Non-Current Liabilities 447 542 492 392
Net Profit 157 127 239 280 Bonds 249 292 242 142
Residual Income 157 127 42 63 Long-Term Debt 100 90 90 90
EBITDA 353 395 464 511 Other Non-Current Liabilities 98 160 160 160
Free Cash Flow -43 340 82 160 Total Liabilities 1,138 1,149 1,147 1,084
Gross Profit Margin (%) 30.0 29.2 27.9 26.2 Paid-In Capital 250 250 250 250
EBITDA Margin (%) 9.5 9.3 9.4 9.3 Capital Surplus 432 431 431 431
Operating Margin (%) 6.4 6.2 6.6 6.7 Retained Earnings 835 926 1,129 1,373
Net Margin (%) 4.2 3.0 4.8 5.1 Stockholders' Equity 1,606 1,970 2,172 2,416
Cash Flow (Summarized) Forecasts/Valuations (Summarized)
(Wbn) 12/08 12/09 12/10F 12/11F 12/08 12/09 12/10F 12/11FCash Flow from Operating Activities 109 457 282 360 P/E (x) 12.8 22.2 12.6 10.8
Net Profit 157 127 239 280 P/CF (x) 8.0 11.8 8.4 7.4
Non-Cash Income and Expense 192 258 127 129 P/B (x) 1.4 1.5 1.4 1.3
Tangible Assets Depreciation 95 112 121 127 EV/EBITDA (x) 7.6 8.1 7.2 6.3
Intangible Assets Depreciation 18 19 13 14 EPS (W) 3,149 2,540 4,777 5,595
Others 79 127 -8 -11 CFPS (W) 5,049 4,787 7,205 8,129
Chg in Working Capital -241 72 -84 -49 BPS (W) 29,354 38,168 42,200 47,028
Chg in Accounts Receivable 19 -95 -87 -57 DPS (W) 750 750 1,500 750
Chg in Inventories -131 46 -43 -28 Payout Ratio (%) 22.8 28.3 30.1 12.8
Chg in Accounts Payable -44 127 48 37 Dividend Yield (%) 1.9 1.2 2.5 1.2
Others -85 -6 -2 -1 Sales Growth (%) 19.8 14.3 16.3 11.0
Cash Flow from Investment Activities -222 -170 -218 -222 EBITDA Growth (%) 12.6 11.7 17.4 10.1
Chg in Tangible Assets -152 -117 -200 -200 Operating Profit Growth (%) 7.2 9.9 24.6 12.5
Chg in Intangible Assets -45 -31 -15 -17 EPS Growth (%) 4.1 -19.4 88.1 17.1
Chg in Investment Assets -27 -14 -1 -2 Accounts Receivable Turnover (x) 10.1 10.6 10.2 9.8
Others 1 -8 -3 -4 Inventory Turnover (x) 7.9 8.3 9.7 10.1
Cash Flow from Financing Activities 120 -224 -86 -136 Accounts Payable Turnover (x) 19.8 18.6 15.7 15.4
Chg in Borrowings 205 -239 -50 -100 ROA (%) 5.7 4.3 7.4 8.2
Chg in Equity -86 -36 -36 -36 ROE (%) 9.5 7.1 11.5 12.2
Dividends -36 -36 -36 -36 ROIC (%) 10.7 11.4 16.4 17.0
Others 1 51 0 0 Liability to Equity Ratio (%) 70.9 58.4 52.8 44.9
Chg in Cash 7 64 -22 1 Current Ratio (%) 153.1 188.9 191.9 194.7
Beginning Cash Balance 9 16 80 57 Net Debt to Equity Ratio (%) 41.7 18.0 15.0 9.2
Ending Cash Balance 16 80 57 59 Interest Coverage Ratio (x) 6.4 6.4 10.9 14.4Source: Company data, Daewoo Securities Research estimates

Electronic Components
17
Sodiff Advanced Materials (036490 KQ)
Cost competitiveness to drive growth
We maintain our Buy recommendation on Sodiff Advanced Materials with a target price of W108,000 (2010 P/E of 18x, target P/B of 4.2x). Valuation is attractive, as the current stock price corresponds to 2010F P/E of 14x and 2011F of 10x.
Sodiff became the largest manufacturer of NF3, five years after market entry, thanks to strong cost competitiveness and aggressive facility investment. Despite weak NF3 prices, profitability remains much higher than competitors, as the company lowered investment costs. Sodiff also plans to expand its market share of SiH4 (monosilane) from 2010.
Earnings are forecast to expand rapidly until 2011, thanks to aggressive capacity expansion completed in 2009 NF3 production capacity increased from 2,500 tonnes to 3,500 tonnes and monosilane production capacity jumped from 450 tonnes to 2,450 tonnes. We expect new production facilities to improve profit margins and sales due to enhanced cost competitiveness.
NF3 price decline will be limited due to tight supply. NF3 manufacturers were reluctant to expand capacity in 2009 as prices fell 50% below 2006 levels, and total production capacity fell 8% due to Mitsui ChemicalsÊ gas plant explosion at end-2009. Meanwhile, demand will likely increase in 2010 as LCD panel makers increased capacity.
We also expect monosilane prices to decrease due to capacity expansion, but only slightly. Demand is projected to rise 20% per year thanks to capacity expansion at LCD panel makers and semiconductor manufacturers, as well as thin-film solar cell market expansion.
1Q10 Earnings will likely come in higher than expected we forecast operating profit of W14.3bn, on sales of W48.3. Although the first quarter is traditionally low-demand season, NF3 shipments remain strong thanks to brisk semiconductor and LCD businesses, in our view.
Yeonju Park +82-2-768-3061
Buy Bloomberg: 036490 KQ
Target Price (12M, W): 108,000
Share Price (03/16/10, W): 79,400
Expected Return (%): 36.0
Sector: Displays
Sector Rating: Overweight
EPS Growth (10F, %): 32.5
Market EPS Growth (10F, %): 45.5
P/E (X): 13.5
Market P/E (03/16/10F, x): 10.1
Market Cap (Wbn): 837
Shares Outstanding (mn): 11
Avg Trading Volume (60D, '000): 53
Avg Trading Value (60D, Wbn): 5
Margin Balance ('000 sh): 134
Dividend Yield (10F, %): .3
Free Float (%): 50.9
52-Week Low/High: 58,200/99,700
Beta (12M, Daily Rate of Return): 0.8
Price Return Volatility (12M Daily,%,SD): 2.9
Foreign Ownership (%): 13.6
Major Shareholder(s)
OCI et al (49.1%)
Mirea Asset Investment Mgt et al (11.45%)
Price Performance
(%) 1M 6M 12M
Absolute -2.0 -5.8 39.3
Relative -4.3 -3.8 5.0
20406080
100120140160180
3/09 7/09 11/09 3/10
Share price KOSDAQ
FY Sales OP OP Margin NP EPS EBITDA FCF ROE P/E P/B EV/EBITDA
(Wbn) (Wbn) (%) (Wbn) (W) (Wbn) (Wbn) (%) (x) (x) (x)
12/07 98 24 24.7 16 1,821 48 -41 16.8 33.7 5.5 14.6
12/08 156 60 38.7 37 3,551 93 -29 26.7 15.2 3.4 7.7
12/09 180 61 33.9 51 4,798 95 -18 25.7 19.7 4.6 12.2
12/10F 235 78 33.1 62 5,865 136 -6 25.1 13.5 3.1 7.4
12/11F 292 108 37.0 87 8,251 170 61 27.3 9.6 2.3 5.6
Source: Company data, Daewoo Securities Research estimates
Electronic Components
18
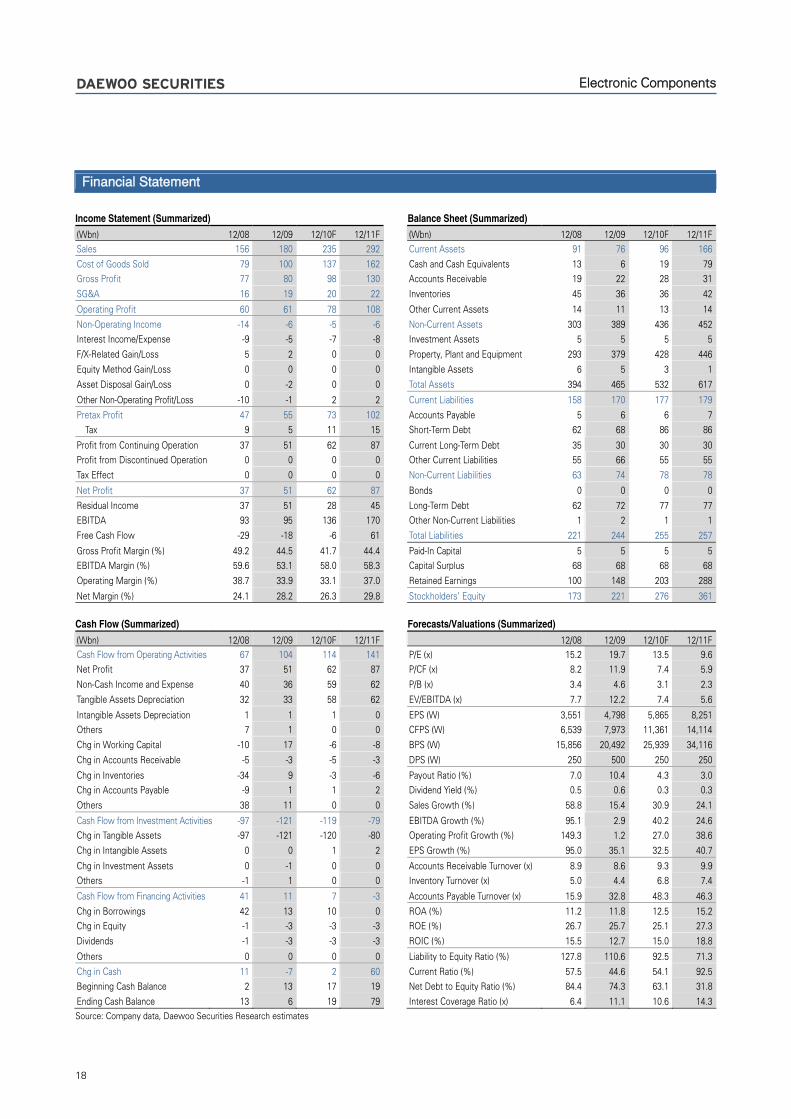
Financial Statement
Income Statement (Summarized) Balance Sheet (Summarized) (Wbn) 12/08 12/09 12/10F 12/11F (Wbn) 12/08 12/09 12/10F 12/11FSales 156 180 235 292 Current Assets 91 76 96 166
Cost of Goods Sold 79 100 137 162 Cash and Cash Equivalents 13 6 19 79
Gross Profit 77 80 98 130 Accounts Receivable 19 22 28 31
SG&A 16 19 20 22 Inventories 45 36 36 42
Operating Profit 60 61 78 108 Other Current Assets 14 11 13 14
Non-Operating Income -14 -6 -5 -6 Non-Current Assets 303 389 436 452
Interest Income/Expense -9 -5 -7 -8 Investment Assets 5 5 5 5
F/X-Related Gain/Loss 5 2 0 0 Property, Plant and Equipment 293 379 428 446
Equity Method Gain/Loss 0 0 0 0 Intangible Assets 6 5 3 1
Asset Disposal Gain/Loss 0 -2 0 0 Total Assets 394 465 532 617
Other Non-Operating Profit/Loss -10 -1 2 2 Current Liabilities 158 170 177 179
Pretax Profit 47 55 73 102 Accounts Payable 5 6 6 7
Tax 9 5 11 15 Short-Term Debt 62 68 86 86
Profit from Continuing Operation 37 51 62 87 Current Long-Term Debt 35 30 30 30
Profit from Discontinued Operation 0 0 0 0 Other Current Liabilities 55 66 55 55
Tax Effect 0 0 0 0 Non-Current Liabilities 63 74 78 78
Net Profit 37 51 62 87 Bonds 0 0 0 0
Residual Income 37 51 28 45 Long-Term Debt 62 72 77 77
EBITDA 93 95 136 170 Other Non-Current Liabilities 1 2 1 1
Free Cash Flow -29 -18 -6 61 Total Liabilities 221 244 255 257
Gross Profit Margin (%) 49.2 44.5 41.7 44.4 Paid-In Capital 5 5 5 5
EBITDA Margin (%) 59.6 53.1 58.0 58.3 Capital Surplus 68 68 68 68
Operating Margin (%) 38.7 33.9 33.1 37.0 Retained Earnings 100 148 203 288
Net Margin (%) 24.1 28.2 26.3 29.8 Stockholders' Equity 173 221 276 361
Cash Flow (Summarized) Forecasts/Valuations (Summarized)
(Wbn) 12/08 12/09 12/10F 12/11F 12/08 12/09 12/10F 12/11FCash Flow from Operating Activities 67 104 114 141 P/E (x) 15.2 19.7 13.5 9.6
Net Profit 37 51 62 87 P/CF (x) 8.2 11.9 7.4 5.9
Non-Cash Income and Expense 40 36 59 62 P/B (x) 3.4 4.6 3.1 2.3
Tangible Assets Depreciation 32 33 58 62 EV/EBITDA (x) 7.7 12.2 7.4 5.6
Intangible Assets Depreciation 1 1 1 0 EPS (W) 3,551 4,798 5,865 8,251
Others 7 1 0 0 CFPS (W) 6,539 7,973 11,361 14,114
Chg in Working Capital -10 17 -6 -8 BPS (W) 15,856 20,492 25,939 34,116
Chg in Accounts Receivable -5 -3 -5 -3 DPS (W) 250 500 250 250
Chg in Inventories -34 9 -3 -6 Payout Ratio (%) 7.0 10.4 4.3 3.0
Chg in Accounts Payable -9 1 1 2 Dividend Yield (%) 0.5 0.6 0.3 0.3
Others 38 11 0 0 Sales Growth (%) 58.8 15.4 30.9 24.1
Cash Flow from Investment Activities -97 -121 -119 -79 EBITDA Growth (%) 95.1 2.9 40.2 24.6
Chg in Tangible Assets -97 -121 -120 -80 Operating Profit Growth (%) 149.3 1.2 27.0 38.6
Chg in Intangible Assets 0 0 1 2 EPS Growth (%) 95.0 35.1 32.5 40.7
Chg in Investment Assets 0 -1 0 0 Accounts Receivable Turnover (x) 8.9 8.6 9.3 9.9
Others -1 1 0 0 Inventory Turnover (x) 5.0 4.4 6.8 7.4
Cash Flow from Financing Activities 41 11 7 -3 Accounts Payable Turnover (x) 15.9 32.8 48.3 46.3
Chg in Borrowings 42 13 10 0 ROA (%) 11.2 11.8 12.5 15.2
Chg in Equity -1 -3 -3 -3 ROE (%) 26.7 25.7 25.1 27.3
Dividends -1 -3 -3 -3 ROIC (%) 15.5 12.7 15.0 18.8
Others 0 0 0 0 Liability to Equity Ratio (%) 127.8 110.6 92.5 71.3
Chg in Cash 11 -7 2 60 Current Ratio (%) 57.5 44.6 54.1 92.5
Beginning Cash Balance 2 13 17 19 Net Debt to Equity Ratio (%) 84.4 74.3 63.1 31.8
Ending Cash Balance 13 6 19 79 Interest Coverage Ratio (x) 6.4 11.1 10.6 14.3Source: Company data, Daewoo Securities Research estimates

Electronic Components
19
Techno Semichem (036830 KQ)
Outstanding earnings stability
We maintain our Buy call on Techno Semichem and target price of W26,000, based on 2010F P/E of 12x and P/B of 1.8x.
Techno Semichem is an electronic material maker established in 1986. The companyÊs flagship products include: ① semiconductor materials (etchants and CVD precursors; accounting for 43% of total sales in 2009), ② display materials (etchants, thin glass, and organic materials; 41% of total sales), and ③ electrolytes used in rechargeable batteries.
Techno Semichem is the exclusive supplier of semiconductor etchants in the domestic market, with LCD etchant market share of 40~60%. Major competitors include Dongwoo Fine-Chem and Dongjin Semichem. The company meets 40~50% of Samsung SDIÊs electrolyte needs, and it established a wholly owned subsidiary to supply electrolytes to a US rechargeable battery maker in early 2010.
Our investment recommendation is premised on the following:
1) The company is expected to benefit from capacity expansion at semiconductor and LCD manufacturers, as it is dominant in the respective markets. The semiconductor and LCD material divisions (including etchants) boast outstanding earnings stability thanks to high technological barriers.
2) The organic materials and electrolytes divisions will likely drive growth going forward. Sales of organic materials soared from W5.3bn in 2008 to W19.6bn in 2009, and they are expected to increase to W33.2bn in 2010. In addition, we project equity-method gains from the US electrolyte subsidiary to expand after 2012, aided by rechargeable battery market growth.
We expect 1Q10 earnings to meet our projections, backed by robust downstream industries. We forecast sales and operating profit to inch down QoQ to W75bn and W9.2bn, respectively. Meanwhile, OP margin is expected to remain solid at 12% despite low-demand season. We project net profit to climb 21% QoQ, as equity-method losses from TSC Memsys should shrink.
Yeonju Park +82-2-768-3061
Buy Bloomberg: 036830 KQ
Target Price (12M, W): 26,000
Share Price (03/16/10, W): 20,000
Expected Return (%): 30.0
Sector: Displays
Sector Rating: Overweight
EPS Growth (10F, %): 24.4
Market EPS Growth (10F, %): 45.5
P/E (X): 9.7
Market P/E (03/16/10F, x): 10.1
Market Cap (Wbn): 294
Shares Outstanding (mn): 15
Avg Trading Volume (60D, '000): 93
Avg Trading Value (60D, Wbn): 2
Margin Balance ('000 sh): 287
Dividend Yield (10F, %): 1.0
Free Float (%): 46.5
52-Week Low/High: 10,900/22,650
Beta (12M, Daily Rate of Return): 1.0
Price Return Volatility (12M Daily,%,SD): 3.1
Foreign Ownership (%): 10.9
Major Shareholder(s):
J W Chung et al (52.32%)
Allianz Global Investors Asset Mgt (7.02%)
Price Performance
(%) 1M 6M 12M
Absolute 6.4 -4.1 90.5
Relative 4.0 -2.1 56.1
20
70
120
170
220
3/09 7/09 11/09 3/10
Share price KOSDAQ
FY Sales OP OP Margin NP EPS EBITDA FCF ROE P/E P/B EV/EBITDA
(Wbn) (Wbn) (%) (Wbn) (W) (Wbn) (Wbn) (%) (x) (x) (x)
12/07 167 29 17.7 26 1,793 39 -3 20.0 13.8 2.6 9.5
12/08 224 30 13.6 19 1,272 43 5 12.5 7.6 0.9 3.5
12/09 290 36 12.3 24 1,650 49 22 14.4 13.2 1.8 7.1
12/10F 329 43 13.0 30 2,053 55 17 15.6 9.7 1.4 5.7
12/11F 378 48 12.7 36 2,466 61 18 16.2 8.1 1.2 5.0
Source: Company data, Daewoo Securities Research estimates

Electronic Components
20
Financial Statement
Income Statement (Summarized) Balance Sheet (Summarized) (Wbn) 12/08 12/09F 12/10F 12/11F (Wbn) 12/08 12/09F 12/10F 12/11FSales 224 290 329 378 Current Assets 69 79 89 109
Cost of Goods Sold 174 232 263 298 Cash and Cash Equivalents 11 25 28 38
Gross Profit 50 58 66 79 Accounts Receivable 17 27 29 35
SG&A 19 22 24 31 Inventories 25 22 24 28
Operating Profit 30 36 43 48 Other Current Assets 16 6 8 8
Non-Operating Income -4 -2 -1 3 Non-Current Assets 144 180 199 215
Interest Income/Expense -1 -1 -2 -2 Investment Assets 57 92 103 112
F/X-Related Gain/Loss 3 0 0 0 Property, Plant and Equipment 87 88 95 102
Equity Method Gain/Loss -6 -1 1 4 Intangible Assets 1 1 0 0
Asset Disposal Gain/Loss -2 0 0 0 Total Assets 213 259 288 324
Other Non-Operating Profit/Loss 3 0 1 1 Current Liabilities 44 65 66 69
Pretax Profit 27 34 42 51 Accounts Payable 13 16 17 20
Tax 8 10 12 15 Short-Term Debt 15 24 24 24
Profit from Continuing Operation 19 24 30 36 Current Long-Term Debt 5 13 13 13
Profit from Discontinued Operation 0 0 0 0 Other Current Liabilities 12 12 12 12
Tax Effect 0 0 0 0 Non-Current Liabilities 12 14 14 14
Net Profit 19 24 30 36 Bonds 6 0 0 0
Residual Income 19 24 30 36 Long-Term Debt 4 12 12 12
EBITDA 43 49 55 61 Other Non-Current Liabilities 2 2 2 2
Free Cash Flow 5 22 17 18 Total Liabilities 57 79 80 83
Gross Profit Margin (%) 22.3 19.9 20.2 21.0 Paid-In Capital 7 7 7 7
EBITDA Margin (%) 19.1 16.7 16.8 16.2 Capital Surplus 19 19 19 19
Operating Margin (%) 13.6 12.3 13.0 12.7 Retained Earnings 135 156 183 217
Net Margin (%) 8.4 8.4 9.2 9.6 Stockholders' Equity 157 180 207 241
Cash Flow (Summarized) Forecasts/Valuations (Summarized)
(Wbn) 12/08 12/09F 12/10F 12/11F 12/08 12/09F 12/10F 12/11FCash Flow from Operating Activities 28 35 37 38 P/E (x) 7.6 13.2 9.7 8.1
Net Profit 19 24 30 36 P/CF (x) 4.6 8.7 6.6 5.7
Non-Cash Income and Expense 20 15 12 9 P/B (x) 0.9 1.8 1.4 1.2
Tangible Assets Depreciation 12 12 12 13 EV/EBITDA (x) 3.5 7.1 5.7 5.0
Intangible Assets Depreciation 0 0 0 0 EPS (W) 1,272 1,650 2,053 2,466
Others 8 2 0 -4 CFPS (W) 2,091 2,499 2,892 3,352
Chg in Working Capital -11 -4 -6 -8 BPS (W) 10,607 12,227 14,095 16,371
Chg in Accounts Receivable -1 -10 -2 -6 DPS (W) 200 200 200 200
Chg in Inventories -13 3 -3 -4 Payout Ratio (%) 15.5 12.0 9.6 8.0
Chg in Accounts Payable 2 3 1 3 Dividend Yield (%) 2.1 1.0 1.0 1.0
Others 1 0 -2 -1 Sales Growth (%) 34.4 29.6 13.4 14.8
Cash Flow from Investment Activities -18 -38 -31 -25 EBITDA Growth (%) 9.3 13.5 14.1 10.6
Chg in Tangible Assets -24 -14 -20 -20 Operating Profit Growth (%) 3.4 17.5 20.0 12.3
Chg in Intangible Assets 0 0 0 0 EPS Growth (%) -29.0 29.7 24.4 20.1
Chg in Investment Assets -1 -34 -11 -5 Accounts Receivable Turnover (x) 13.9 13.4 11.9 11.8
Others 6 9 0 0 Inventory Turnover (x) 12.0 12.4 14.4 14.6
Cash Flow from Financing Activities -1 15 -3 -3 Accounts Payable Turnover (x) 19.2 20.4 19.9 20.4
Chg in Borrowings 3 18 0 0 ROA (%) 9.2 10.3 11.0 11.9
Chg in Equity -4 -3 -3 -3 ROE (%) 12.5 14.4 15.6 16.2
Dividends -3 -3 -3 -3 ROIC (%) 21.9 24.2 27.9 28.2
Others 0 0 0 0 Liability to Equity Ratio (%) 36.3 43.8 38.8 34.5
Chg in Cash 9 13 3 10 Current Ratio (%) 155.9 121.9 134.4 158.8
Beginning Cash Balance 4 12 25 28 Net Debt to Equity Ratio (%) 5.8 13.6 10.3 4.7
Ending Cash Balance 12 25 28 38 Interest Coverage Ratio (x) 18.7 19.4 18.8 21.1Source: Company data, Daewoo Securities Research estimates

21
Important Notices Equity Research for International Investors (ERII)
Ratings Distribution Analyst Industry Ratings of Daewoo Securities Buy Relative Performance of +20% or greater Overweight Industry fundamentals are favorable or improving
Trading Buy Relative Performance of +10% or greater, but with variability/volatility Neutral Industry fundamentals are steady without any material changes
Hold Relative Performance of -10% and +10% Underweight Industry fundamentals are unfavorable or worsening
Sell Relative Performance of -10% Note: 1) Our investment rating is a guide to the relative return of the stock versus the market over the next 12 months. 2) Although it is not part of the official ratings at Daewoo Securities, we may call a trading opportunity in case there is a technical or short-term material development. Source: Daewoo Securities
Ratings and Target Price History (Share price (----), Target price (----), Not covered (■), Buy (▲), Trading Buy (■), Hold (●), Sell (◆))
This report has been provided by the research division of Daewoo Securities Co., Ltd. The stock ratings, target prices, estimates and overall viewpoints are from the research division of Daewoo Securities. Investors can access Daewoo SecuritiesÊ research through Daewoo research direct (www.bestez.com), FirstCall Research, Reuters, FnGuide, WiseFn, FactSet, and Bloomberg (DWIR).
This document was prepared by Daewoo Securities Co., Ltd. („Daewoo‰). Information and opinions contained herein have been compiled from sources believed to be reliable and in good faith. The information has not been independently verified. Daewoo makes no guarantee, representation or warranty, express or implied, as to the fairness, accuracy or completeness of the information and opinions contained in this document. Daewoo accepts no responsibility or liability whatsoever for any loss arising from the use of this document or its contents or otherwise arising in connection therewith. Information and opinions contained herein are subject to change without notice. This document is for information purposes only. It is not and should not be construed as an offer or solicitation of an offer to purchase or sell any securities or other financial instruments. This document may not be reproduced, further distributed or published in whole or in part for any purpose.
Daewoo and/or other affiliate companies, their directors, representatives, or employees may have long or short positions in any of the securities or other financial instruments mentioned in this document or of issuers described herein and may purchase and/or sale, or offer to purchase and/or sale, at any time, such securities or other financial instruments in the open market or otherwise, as either a principal or agent. This document is for distribution within the United Kingdom to persons authorized under the Financial Services Act 1986.
Daewoo Securities is the sole provider of information contained in this document. DaewooÊs U.S. affiliate, Daewoo Securities (America) Inc., a member of FINRA/SIPC, is the sole distributor of this document within the U.S. This document may be distributed in the U.S. only to major U.S. institutional investors as defined in Rule 15a-6 of the U.S. Securities Exchange Act of 1934. Any U.S. recipient of this document wishing to effect any transactions in any securities discussed herein should contact and place orders with Daewoo Securities (America) Inc.
As of the publication date, Daewoo Securities Co., Ltd. issued equity-linked warrants with LG Chem and Cheil Industries as an underlying asset, and other than this, Daewoo Securities has no other special interests in the covered companies.
As of the publication date, Daewoo Securities Co., Ltd. has acted as a liquidity provider for equity-linked warrants backed by shares of LG Chem and Cheil Industries as an underlying asset, and other than this, Daewoo Securities has no other special interests in the covered companies.
This report is a translation excerpt of the Korean version publicly released on March 17, 2010.
Analyst of the subject company or member of the analyst's household does not have any financial interest in the securities of the subject company and the nature ofthe financial interest (including without limitation, whether it consists of any option, right, warrant, future, long or short position).
This report reflects the sole opinion of the analyst without any external influences by third parties.
LGCHEM[Buy /W265,000]
0
50,000
100,000
150,000
200,000
250,000
300,000
3/08 6/08 9/08 12/08 3/09 6/09 9/09 12/09 3/10
(W) CheilInd[Buy /W75,000]
0
10,000
20,000
30,000
40,000
50,000
60,000
70,000
80,000
3/08 6/08 9/08 12/08 3/09 6/09 9/09 12/09 3/10
(W)
SODIFF[Buy /W108,000]
0
20,000
40,000
60,000
80,000
100,000
120,000
3/08 6/08 9/08 12/08 3/09 6/09 9/09 12/09 3/10
(W) TECHNOSEMI[Buy /W26,000]
0
5,000
10,000
15,000
20,000
25,000
30,000
35,000
3/08 6/08 9/08 12/08 3/09 6/09 9/09 12/09 3/10
(W)