Embed Size (px)
Citation preview
An investigation into the instance of fraud in in-app transactions and app installs
The ApsalarApp Install
and TransactionFRAUD INDEX
JULY 2015

INTRODUCTION
Digital marketing has lately focused significant attention on the issue of mobile fraud, and its consequences to the health and vitality of our industry.
There have been a variety of studies focused on impression fraud metrics. These are important issues that we must address to drive the best results for our businesses. But while impression fraud is clearly a major issue, the Apsalar Fraud Index examines metrics closer to the true KPIs of most app publishers – download marketing efficiency and in-app transactions.
We created the Apsalar Fraud Index to provide an accurate view of these issues on both a global and a country-by-country basis.
3
1
2
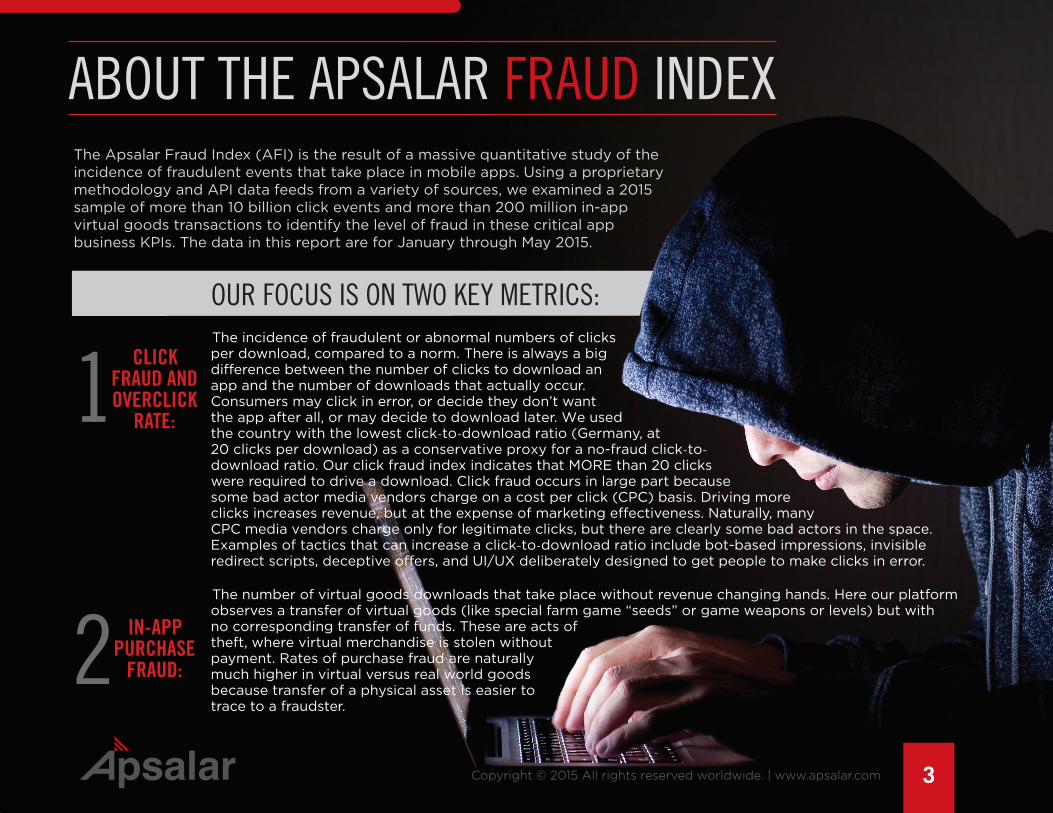
ABOUT THE APSALAR FRAUD INDEXThe Apsalar Fraud Index (AFI) is the result of a massive quantitative study of the incidence of fraudulent events that take place in mobile apps. Using a proprietary methodology and API data feeds from a variety of sources, we examined a 2015 sample of more than 10 billion click events and more than 200 million in-app virtual goods transactions to identify the level of fraud in these critical app business KPIs. The data in this report are for January through May 2015.
CLICK FRAUD AND OVERCLICK
RATE:
IN-APP PURCHASE
FRAUD:
OUR FOCUS IS ON TWO KEY METRICS:The incidence of fraudulent or abnormal numbers of clicks per download, compared to a norm. There is always a big difference between the number of clicks to download an app and the number of downloads that actually occur. Consumers may click in error, or decide they don’t want the app after all, or may decide to download later. We used the country with the lowest click-to-download ratio (Germany, at 20 clicks per download) as a conservative proxy for a no-fraud click-to-download ratio. Our click fraud index indicates that MORE than 20 clicks were required to drive a download. Click fraud occurs in large part because some bad actor media vendors charge on a cost per click (CPC) basis. Driving more clicks increases revenue, but at the expense of marketing effectiveness. Naturally, many CPC media vendors charge only for legitimate clicks, but there are clearly some bad actors in the space. Examples of tactics that can increase a click-to-download ratio include bot-based impressions, invisible redirect scripts, deceptive offers, and UI/UX deliberately designed to get people to make clicks in error.
The number of virtual goods downloads that take place without revenue changing hands. Here our platform observes a transfer of virtual goods (like special farm game “seeds” or game weapons or levels) but with no corresponding transfer of funds. These are acts of theft, where virtual merchandise is stolen without payment. Rates of purchase fraud are naturally much higher in virtual versus real world goods because transfer of a physical asset is easier to trace to a fraudster.
4Copyright © 2015 All rights reserved worldwide. | www.apsalar.com
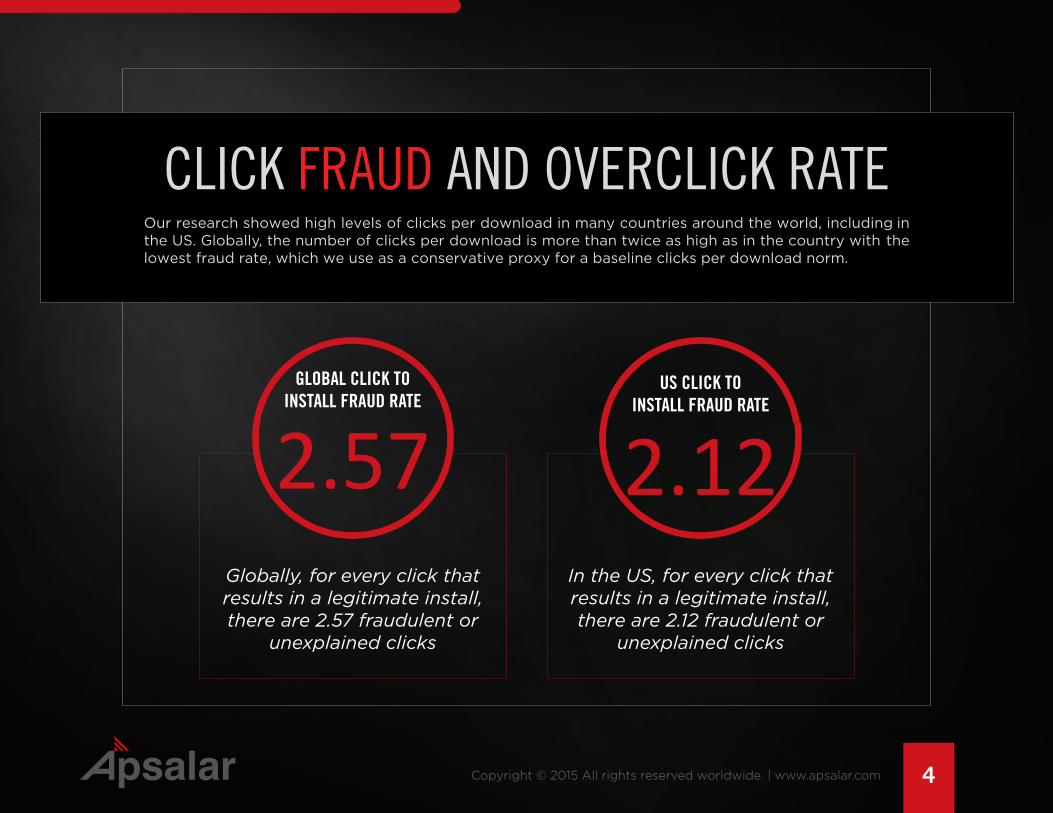
CLICK FRAUD AND OVERCLICK RATEOur research showed high levels of clicks per download in many countries around the world, including in the US. Globally, the number of clicks per download is more than twice as high as in the country with the lowest fraud rate, which we use as a conservative proxy for a baseline clicks per download norm.
GLOBAL CLICK TO INSTALL FRAUD RATE
2.57Globally, for every click that results in a legitimate install, there are 2.57 fraudulent or
unexplained clicks
In the US, for every click that results in a legitimate install, there are 2.12 fraudulent or
unexplained clicks
US CLICK TO INSTALL FRAUD RATE
2.12

5Copyright © 2015 All rights reserved worldwide. | www.apsalar.com
HONG KONG 318INDIA 282INDONESIA 225BAHRAIN 222TURKEY 185KUWAIT 162MALAYSIA 153 VIETNAM 144SAUDI ARABIA 144SINGAPORE 141
HIGHEST FRAUD REGIONS INDEX
LOWEST FRAUD REGIONS INDEX
GERMANY 29 FRANCE 33ITALY 38PHILLIPINES 41MEXICO 42JAPAN 43SPAIN 44COLOMBIA 46NEW ZEALAND 53 NORWAY 59
CLICK FRAUD RATE INDEX BY COUNTRY
Index reflects the rate of clicks per download versus the global average.
6Copyright © 2015 All rights reserved worldwide. | www.apsalar.com
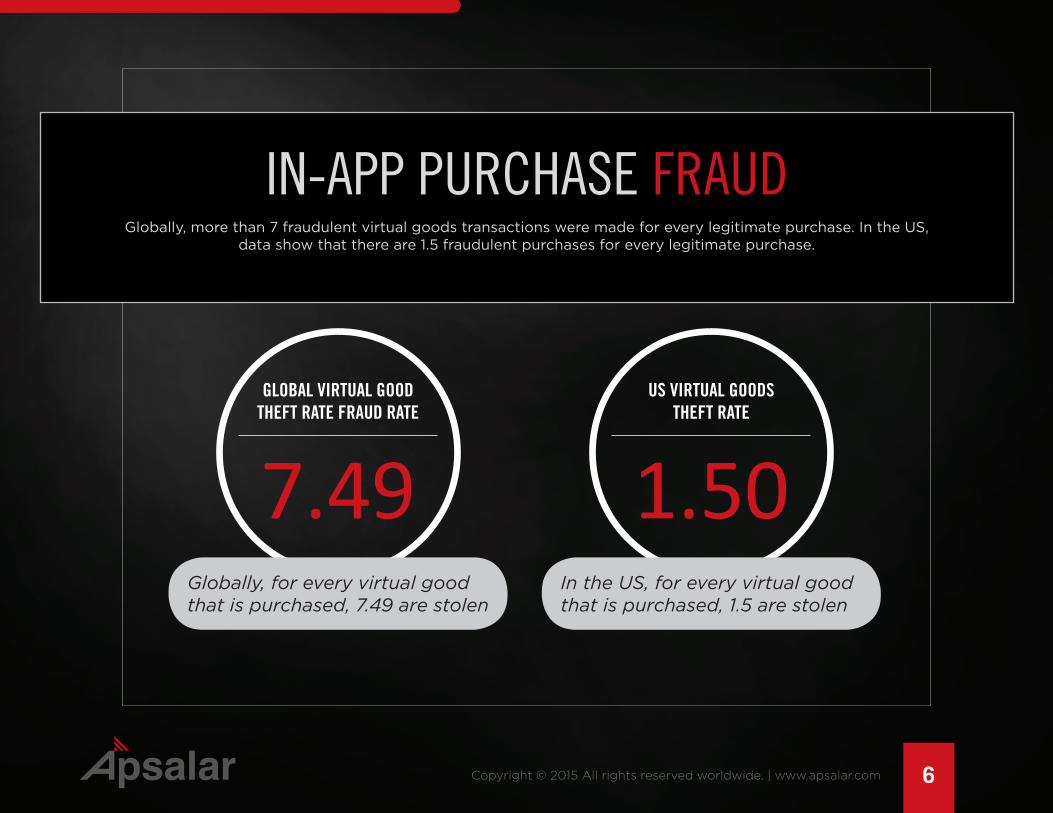
IN-APP PURCHASE FRAUD Globally, more than 7 fraudulent virtual goods transactions were made for every legitimate purchase. In the US,
data show that there are 1.5 fraudulent purchases for every legitimate purchase.
GLOBAL VIRTUAL GOOD THEFT RATE FRAUD RATE
US VIRTUAL GOODS THEFT RATE
7.49 1.50Globally, for every virtual good that is purchased, 7.49 are stolen
In the US, for every virtual good that is purchased, 1.5 are stolen
Number of goods stolen per legitimate purchase
7Copyright © 2015 All rights reserved worldwide. | www.apsalar.com
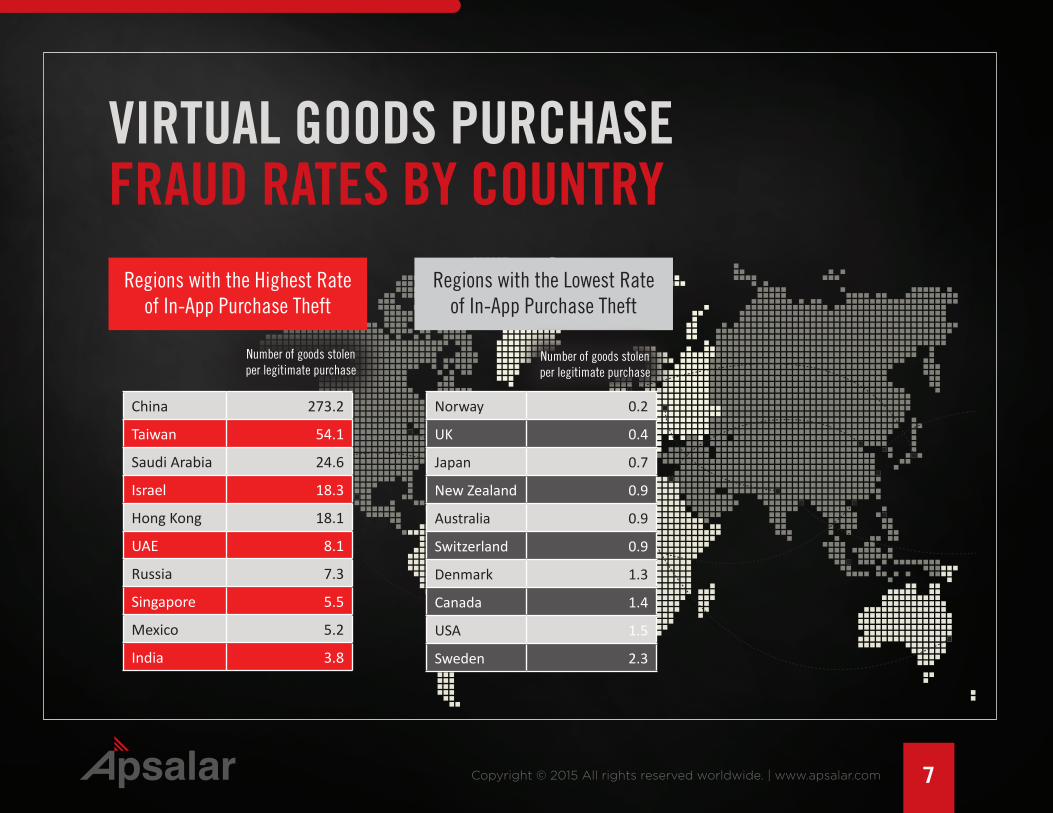
VIRTUAL GOODS PURCHASE FRAUD RATES BY COUNTRY
Regions with the Highest Rate of In-App Purchase Theft
China 273.2
Taiwan 54.1
Saudi Arabia 24.6
Israel 18.3
Hong Kong 18.1
UAE 8.1
Russia 7.3
Singapore 5.5
Mexico 5.2
India 3.8
Regions with the Lowest Rate of In-App Purchase Theft
Number of goods stolen per legitimate purchase
Norway 0.2
UK 0.4
Japan 0.7
New Zealand 0.9
Australia 0.9
Switzerland 0.9
Denmark 1.3
Canada 1.4
USA 1.5
Sweden 2.3
8Copyright © 2015 All rights reserved worldwide. | www.apsalar.com
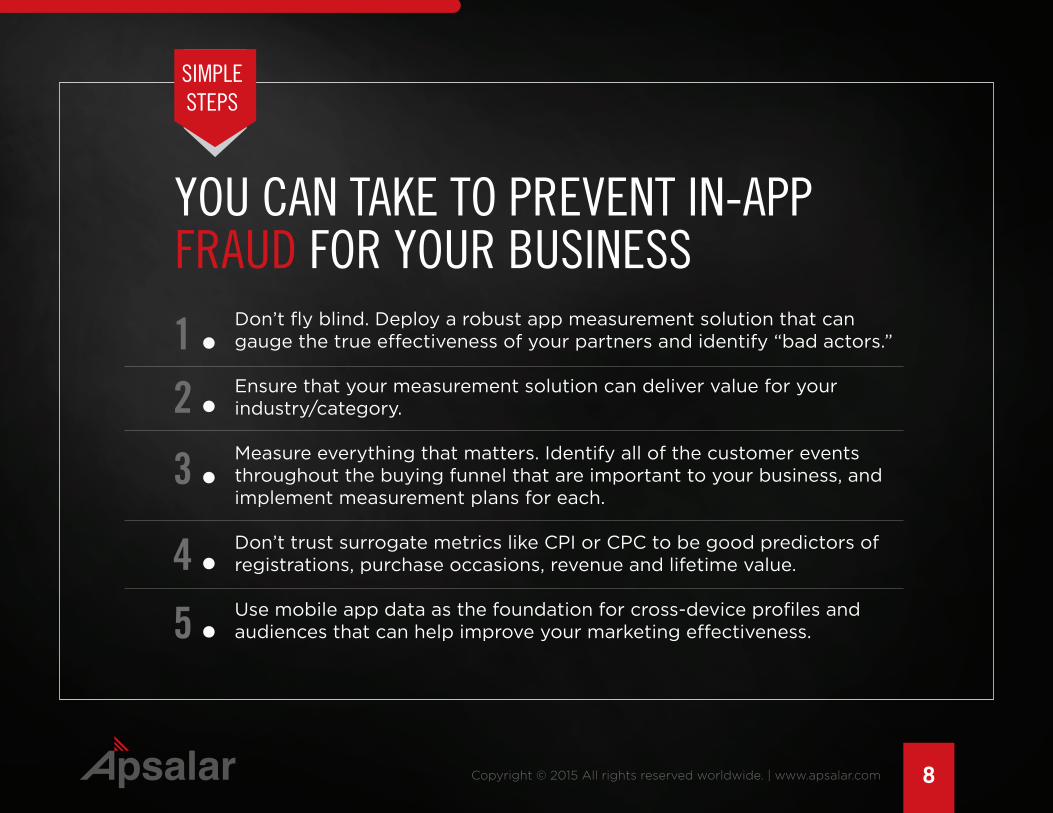
Don’t fly blind. Deploy a robust app measurement solution that can gauge the true effectiveness of your partners and identify “bad actors.”
Ensure that your measurement solution can deliver value for your industry/category.
Measure everything that matters. Identify all of the customer events throughout the buying funnel that are important to your business, and implement measurement plans for each.
Don’t trust surrogate metrics like CPI or CPC to be good predictors of registrations, purchase occasions, revenue and lifetime value.
Use mobile app data as the foundation for cross-device profiles and audiences that can help improve your marketing effectiveness.
1 2
3
4
5
YOU CAN TAKE TO PREVENT IN-APP FRAUD FOR YOUR BUSINESS
SIMPLE STEPS
9Copyright © 2015 All rights reserved worldwide. | www.apsalar.com
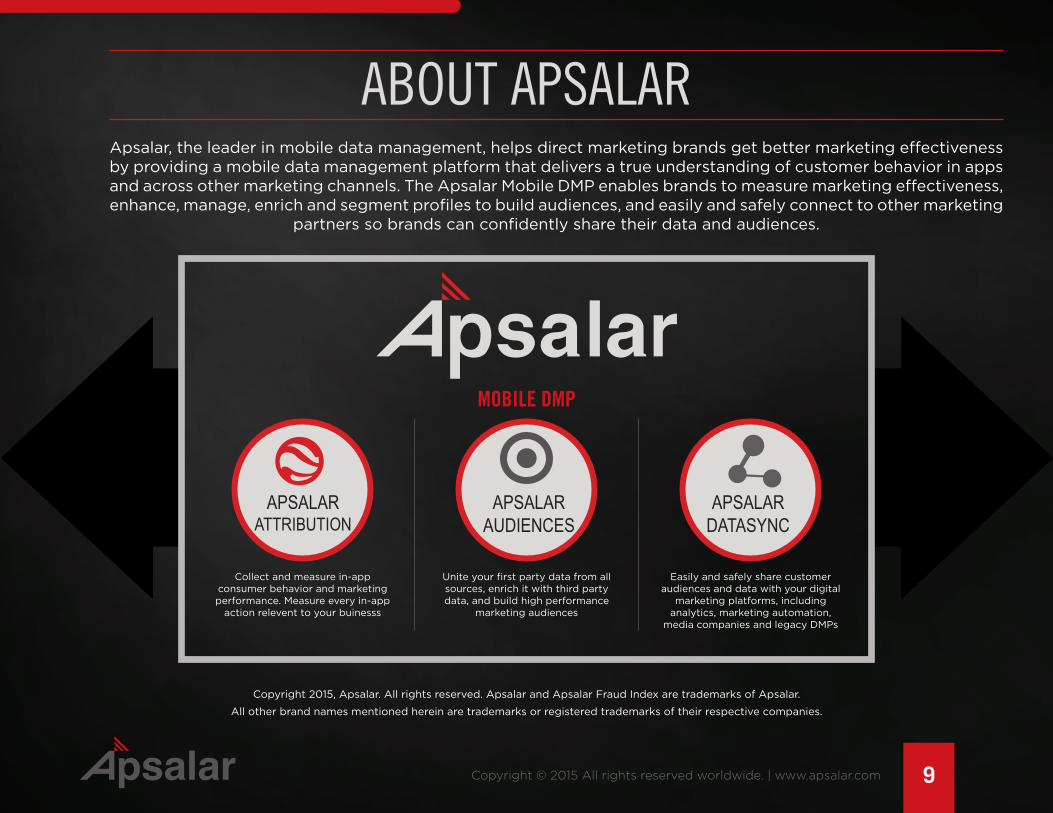
ABOUT APSALARApsalar, the leader in mobile data management, helps direct marketing brands get better marketing effectiveness by providing a mobile data management platform that delivers a true understanding of customer behavior in apps and across other marketing channels. The Apsalar Mobile DMP enables brands to measure marketing effectiveness, enhance, manage, enrich and segment profiles to build audiences, and easily and safely connect to other marketing
partners so brands can confidently share their data and audiences.
MOBILE DMP
APSALAR ATTRIBUTION
Collect and measure in-app consumer behavior and marketing performance. Measure every in-app
action relevent to your buinesss
APSALAR AUDIENCES
Unite your first party data from all sources, enrich it with third party data, and build high performance
marketing audiences
APSALAR DATASYNC
Easily and safely share customer audiences and data with your digital
marketing platforms, including analytics, marketing automation,
media companies and legacy DMPs
Copyright 2015, Apsalar. All rights reserved. Apsalar and Apsalar Fraud Index are trademarks of Apsalar.
All other brand names mentioned herein are trademarks or registered trademarks of their respective companies.