Embed Size (px)
Citation preview

WHAT THE TOP 50 APPS DO WITH IAP THAT THE REST OF US DON’T
Reach Engage Earn
MARIO VIVIANITECHNOLOGY EVANGELIST, AMAZON
@Mariuxtheone MarioViviani

Take Care of Your Best
Customers

Casinos Defined
Common Terms
Whales, Dolphins, Minnows
Monetization strategy is segmented,
based on different customer experiences
at different price points.
F2P:• Minnows = 90-98% of users
• Dolphins = 50% of revenue
• Whales = 3-4% of paying users
(<0.1% total)
Source: GGV Capital, Feb. 2013 — http://bit.ly/1Ldu5Fu

Power-Users Are
Not New
Well-Known across Industries
Mobile isn't the first industry to recognize
the importance of highly engaged
customers.

They Spend on the
Things They Love
Substantial Spenders
When it comes to their passion
(whatever it may be), power-users
spend more money than the average
fan.

What Do They Look Like
to Us?
Amazon Appstore Power-Users
• Spend $50/month or more
• On average, spend >$200/month
• Are concentrated in US, Japan, UK, and
Germany
Source: Amazon Appstore
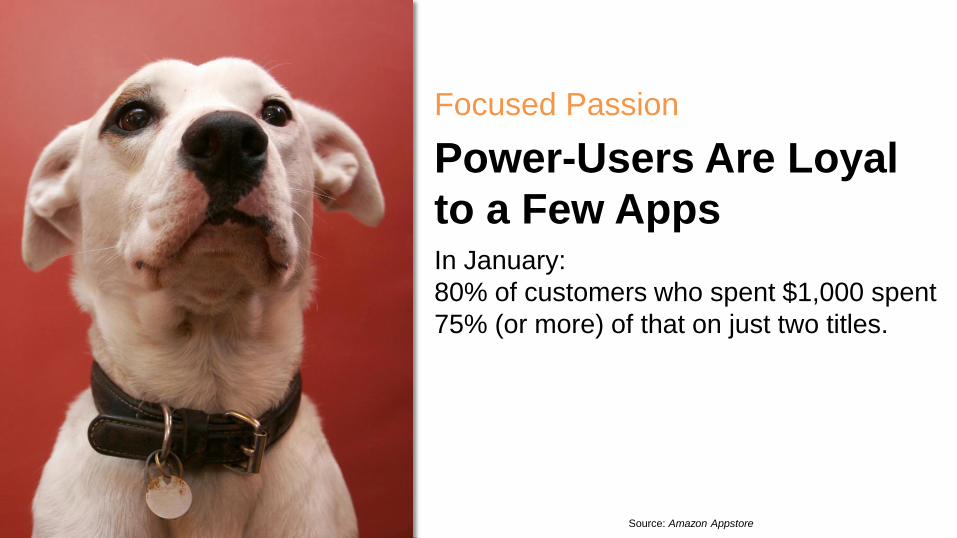
Power-Users Are Loyal
to a Few Apps
Focused Passion
In January:
80% of customers who spent $1,000 spent
75% (or more) of that on just two titles.
Source: Amazon Appstore

Offer Specials and VIP
Exclusives
Reward that Loyalty
Give your most dedicated customers
something extra, whether it be a special
discount, early access, or maybe
exclusive content.

Understand the
Connection
Emotion & Spending
Knowing why they buy is critical to making
your app attractive to power-users—and
more importantly, worthy of them.

Connect with Who or
What You Admire
Stand Out, or Fit In?
Go big: Identify with someone, a broader
community, or something that inspires you.
Go small: Establish yourself as part of an
elite tribe.

iPHONEiPADGOOGLE
PLAYAMAZON
47.7%57.1% 36.5%64.2%
66.0%
26.3%
7.7%
SHARE OF
MOBILE GAME
SPENDERS PER
APPSTOREUS, UK, GER, FR
2014
LEVEL OF
SPENDING
AMONGST ALL
MOBILE GAME
SPENDERS PER
APPSTOREUS, UK, GER, FR
2014
56.3%
34.9%
8.7%
64.9%
28.2%
7.0%
58.1%
33.1%
8.1% % Minor Spenders
% Average Spenders
% Big Spenders
© 2014 Newzoo | Source: Newzoo Data Explorer
Source: Newzoo Trend Report Spotting The Mobile Spenders
A M A Z O N R E A C H E S ( B I G ) S P E N D E R S B E S T

TAKE CARE OF YOUR BEST CUSTOMERSStrategy #1
• Recognize the importance of the "vital few"
• Reward loyal customers as VIPs
• Satisfy their emotional desires

Make It Easy to Buy

0 24 48 72 96 120 144 168 192 216 240 264 288 312
EARLY ENGAGEMENT IS CRITICALIn-App Purchasing by Hour
Source: Amazon Appstore
Hours since download
18%
Total customer value

KEEP CUSTOMERS ENGAGEDIn-App Purchasing Adds Up over Time
Source: Amazon Appstore
Engage customers early 37% of customers who will
purchase, do so on day 0
Keep them in the app 48%of repeat purchases happen
within one hour of a previous
purchase
Give them a reason to come back 64%
of revenue comes
from 3rd order +
74%
of revenue occurs
after the first 7 days
56%
of revenue occurs
after the first 30 days

69%
100%
145%
0%
20%
40%
60%
80%
100%
120%
140%
160%
1-5 Items 6-10 Items 11-15 Items
SELECTION DRIVES REPEAT ORDERSMore Is Better
Source: Amazon Appstore
# of In-App Items for Sale
ARPPU
INDEX: Average = 100% 1.14%
of customers generate
30% of sales

0%
20%
40%
60%
80%
100%
120%
140%
160%
180%
1 4 7 10 13 16 19 22 25 28
Source: Amazon Appstore
Days Owned
+60%
average
selling price
REGULARS SPEND MOREPrice Sensitivity Declines over Time

Conversion Rate
INDEX: Average = 100%
147%
100%
52%
0%
50%
100%
150%
200%
1-5 6-10 11-15Price Points
MANY PRICE POINTS MAY BE CONFUSINGOffer Price Variety, but Not Too Much
Source: Amazon Appstore

What are the top-grossing
developers doing
differently?

COHORT ANALYSISDifficult to Compare Apps Directly
• Based on Behavioral Analytics
• Shared experience
• Usually limited to a specific time period
• Related individuals form "cohorts"
• People who had measles at age 9
• Tall pilots who flew for United in March
• Customers who purchased within one week
of download
Examples

COHORT ANALYSISTop Earners vs. Everyone Else
Looking at all customers who installed
a Freemium app on a specific date.
Split into to two populations (cohorts):
Cohort 1: Top 50
App or game was one of the
Top 50 Highest-Grossing titles
Cohort 2: The RestApp or game was NOT one of
the Top 50 Highest-Grossing
titles

Top 50
The Rest
0%
20%
40%
60%
80%
100%
120%
140%
160%
0 1 3 7 14 30
Days Since Installation
Re
lative
Pe
rfo
rma
nce
SALES & REVENUEPurchase Count x Average Transaction Amount
Source: Amazon Appstore

Does item quality alone
account for the difference in
average IAP transaction
amount?

ASSORTMENT BY PRICE POINTTotal Marketplace
31%29%
7%
12% 11%
5%3%
1%
14%11%
6%3%
16% 16%
11%9%
0%
5%
10%
15%
20%
25%
30%
35%
$0.99 $1.99 $2.99 $4.99 $9.99 $19.99 $49.99 $99.99
% of Assortment % of Sales
Source: Amazon Appstore

ASSORTMENT BY PRICE POINTTop 50 Only
28%
15%
10%13%
11%9% 9%
5%
32%
19%
7%4%
10%12%
5% 4%
0%
5%
10%
15%
20%
25%
30%
35%
$0.99 $1.99 $2.99 $4.99 $9.99 $19.99 $49.99 $99.99
% of Assortment % of Sales
Source: Amazon Appstore

MAKE IT EASY TO BUYStrategy #2
• Keep customers engaged
• Maintain a healthy selection
• Limit number of price points
• Offer higher-value items

Optimize the Experience

REDUCE USAGE BARRIERSDon't Inhibit Frequent Use

Encourage Longer
Sessions
Tune Usability / Difficulty
Too hard, and users will abandon. Too
easy, they may get bored.
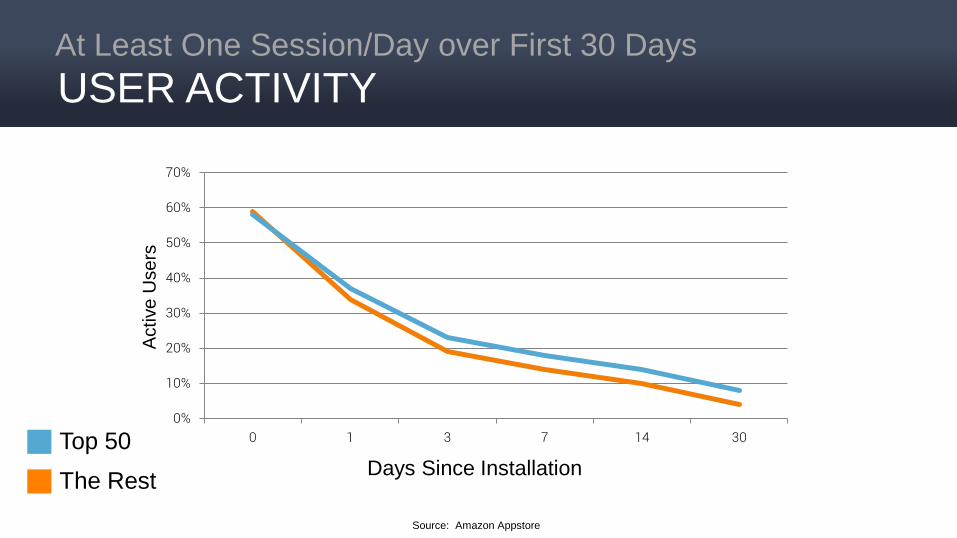
Top 50
The Rest
0%
10%
20%
30%
40%
50%
60%
70%
0 1 3 7 14 30
Days Since Installation
Active
Use
rs
Source: Amazon Appstore
USER ACTIVITYAt Least One Session/Day over First 30 Days

Top 50
The Rest
0
5
10
15
20
25
30
0 1 3 7 14 30
Days Since Installation
To
tal M
inu
tes
Source: Amazon Appstore
TOTAL TIME IN-APPSessions/Day x Average Session Length

Show Clear Value &
Bonus Savings
Simplicity Sells
Use tabs and tiles to allow users to shop
by item type, function, and price. Show
“extra” value of more expensive items.
Catalogs following this format raised
ARPPU 75% over the store average.
Source: Amazon Appstore

Explain How to Purchase
Items in Your App
Tutorials Really Help
The best tutorials show features and
benefits of each items so the customer
can gauge value, boosting conversion by
up to 150%.
Source: Amazon Appstore

Show Customers How to
Apply Their Purchases
Tutorials Really Help
Good post-purchase tutorials can have a
dramatic impact on repeat sales. The
best ones we saw showed 65% more
repeat purchases.
Source: Amazon Appstore

OPTIMIZE THE EXPERIENCEStrategy #3
• Reduce usage barriers
• Tune usability / difficulty
• Simplify purchasing choices
• Explain how to buy items
• Explain how to use purchased items

Support Social Engagement
Let Them Tell the World
Why They're Great
Enable Status Updates
Users like to highlight in-app
accomplishments and ascribe social
status to the reactions they get from
friends and followers.

Achievements and
Leaderboards
The Lowest Bar for Social
A little friendly competition can be a
powerful motivator to play longer and
remain engaged.
SUPPORT SOCIAL ENGAGEMENTStrategy #4
• Let users share their activity
• Include achievements and leaderboards (games)

Encourage Advocacy

Let Them in on Your
Cool Plans and Updates
Communicate with Your Users
The right message at the right time can
help you build a connection beyond a
single app or transaction.

A Fan base helps you:
• Reach new customers
• Retain existing customers
• New revenue opportunities
The top developers
CULTIVATE A FAN BASE

ENCOURAGE ADVOCACYStrategy #5
Learn details on how to build a fan base at 2:00pm
Monetizing When Your App Isn’t Even Open

Quick Recap

5 STRATEGIES OF TOP EARNERS
1. TAKE CARE OF YOUR BEST CUSTOMERS
2. MAKE IT EASY TO BUY
3. OPTIMIZE THE EXPERIENCE
4. SUPPORT SOCIAL ENGAGEMENT
5. ENCOURAGE ADVOCACY

WHAT TO DO NOW?
Have more content to differentiate and keep your catalog fresh
ADD IAP CONTENT
Make sure your IAP catalogs are
CLEAR ABOUT VALUE
Sell what your player needs, when they need it
MAKE IAP CONTENT EASY TO BUY
How did we do? http://bit.ly/devdaysurvey
Learn more: http://bit.ly/Top50IAP
http://developer.amazon.com/underground
Follow us:@Mariuxtheone
developer.amazon.com/blog