Embed Size (px)
Citation preview
1| F N B E 0 4 1 4 | B a s i c A c c o u n t i n g | F i n a n c i a l R a t i o A n a l y s i s
FOUNDATION IN NATURAL AND BUILT ENVIRONMENT
BASIC ACCOUNTING ACC 30205
ASSINGMENT 1 FINANCIAL REPORT
GROUP MEMBERS:
1. Yong Sing Yew 0318766
2. Kong Zhen Chung 0319528
3. Welson Lum Wei Jiunn 0319514
COMPANY: Nike’s Company
LECTURER: Mr. Chang Jau Ho
SUBMISSION DATE: 16 January 2015
2| F N B E 0 4 1 4 | B a s i c A c c o u n t i n g | F i n a n c i a l R a t i o A n a l y s i s
TABLE CONTENTS
1.
HISTORY AND BACKGROUND
3
2.
RECENT DEVELOPMENT OF NIKE COMPANY
4
3.
PROFITABILITY RATIOS
5 - 6
4.
STABILITY RATIOS
7 - 8
5.
PRICE / EARNING RATIOS
9
6.
INVESTMENT RECOMMENDATION
10
7.
APPENDIX
11 - 15
8.
REFERENCES
16
3| F N B E 0 4 1 4 | B a s i c A c c o u n t i n g | F i n a n c i a l R a t i o A n a l y s i s
History & Background of Nike
Nike is the world leader in athletic shoes. The company rose quickly from small-time sales at
track meets to a major publicly-traded Fortune 500 company. Throughout its history and
background, Nike has utilized strong advertising campaigns to separate itself from its
competition. Two of the most memorable marketing campaigns, "Just Do It" and the Air Jordan
brand, cemented Nike as one of the most popular shoe brands in the world.
Nike began its history as Blue Ribbon Sports in 1964 at the University of Oregon. Track star
Philip Knight and his coach Bill Bowerman distributed Japanese Onitsuka Tiger shoes at track
meets. The first retail location for the company opened in 1966 in Santa Monica, California. As
the relationship between Blue Ribbon Sports and Onitsuka Tiger ended in 1971, the company
launched its own line known simply as "Nike."
Nike successfully garnered 50 percent of the market share within the United States by 1980, the
same year the company went public. The advertising firm in charge of Nike, Wieden+Kennedy,
coined one of the most famous phrases in marketing history in 1988. The "Just Do It" was named
one of the top five slogans of all time by a 1999 article in "Advertising Age."
In 1984, Nike's sales were in decline. In response, the company hired rookie basketball player
Michael Jordan to be the company spokesman. The $2.5 million deal for five years resulted in
the creation of one of the most popular lines of shoes ever made.
4| F N B E 0 4 1 4 | B a s i c A c c o u n t i n g | F i n a n c i a l R a t i o A n a l y s i s
RECENT DEVELOPMENT OF NIKE
Nike’s company has been 51 years since 1964 as a Blue Ribbons Sports. It already
expanding its franchise around the world. After Nike entering the International market, it starting
to sell different sports equipment likes soccer, basketball, running, golf, combat sports, tennis,
baseball, cycling, volleyball, auto racing, aquatic activities and recreational uses. Currently,
Nike’s company has 756 retail stores throughout the entire world. Nike also pay top athletes
which from different sports to use their products as a way to promote their equipment’s
technology and design. The example of top athletes that sponsor by Nike are Cristiano Ronaldo,
Wayne Rooney and Neymar who professional in soccer and Michael Jordan, Kobe Bryant and
Lebron James who professional in basketball. The most interesting part about Nike is it has run a
program which is NikeID. NikeID is a service provided to allow the customers to personalize or
design their own Nike merchandise. Nike + also one of the Nike’s successful business product.
Nike + is an activity tracker device that attached to the Nike’s shoes that can communicates with
the Nike +sport band, iPod and iPhone. The purpose of Nike + is help to identify the time of
workout, the distance traveled, calories burned and heartbeat rate.
5| F N B E 0 4 1 4 | B a s i c A c c o u n t i n g | F i n a n c i a l R a t i o A n a l y s i s
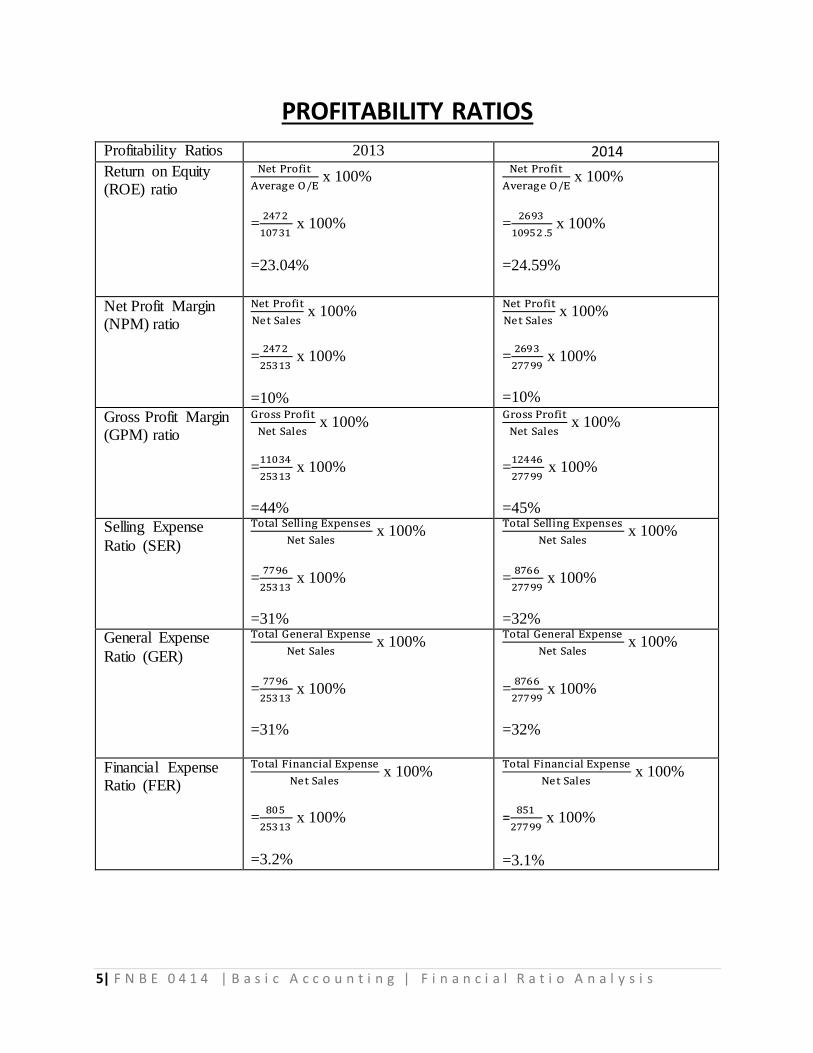
PROFITABILITY RATIOS
Profitability Ratios 2013 2014
Return on Equity (ROE) ratio
Net Profit
Average O/E x 100%
=2472
10731 x 100%
=23.04%
Net Profit
Average O/E x 100%
=2693
10952 .5 x 100%
=24.59%
Net Profit Margin (NPM) ratio
Net Profit
Net Sales x 100%
=2472
25313 x 100%
=10%
Net Profit
Net Sales x 100%
=2693
27799 x 100%
=10%
Gross Profit Margin (GPM) ratio
Gross Profit
Net Sales x 100%
=11034
25313 x 100%
=44%
Gross Profit
Net Sales x 100%
=12446
27799 x 100%
=45%
Selling Expense
Ratio (SER)
Total Selling Expenses
Net Sales x 100%
=7796
25313 x 100%
=31%
Total Selling Expenses
Net Sales x 100%
=8766
27799 x 100%
=32%
General Expense
Ratio (GER)
Total General Expense
Net Sales x 100%
=7796
25313 x 100%
=31%
Total General Expense
Net Sales x 100%
=8766
27799 x 100%
=32%
Financial Expense Ratio (FER)
Total Financial Expense
Net Sales x 100%
=805
25313 x 100%
=3.2%
Total Financial Expense
Net Sales x 100%
=851
27799 x 100%
=3.1%
6| F N B E 0 4 1 4 | B a s i c A c c o u n t i n g | F i n a n c i a l R a t i o A n a l y s i s
PROFITABILITY RATIOS INTERPRETATION
Return on Equity (ROE)
During the 2013-2014 period, the business Return on Equity (ROE) increased from 23.04% to
24.59%. This means the Nike’s company is getting more return from its capital.
Net Profit Margin (NPM)
During the 2013-2014 period, the business Net Profit Margin (NPM) remain constant with 10%.
This means that the Nike’s company is maintaining their expenses.
Gross Profit Margin (GPM)
During 2013-2014 period, the business Gross Profit Margin (GPM) has increased from 44% to
45%. This means the Nike’s company is getting better in Cost of goods sold (COGS) expenses.
Selling Expenses (SER)
During 213-2014 period, the business Selling Expenses (SER) has decreased from 31% to 32%.
This means the Nike’s company is getting worse at controlling their selling expenses.
General Expenses (GER)
During 2013-2014 period, the business General Expenses (GER) has decreased from 31% to
32%. This means the Nike’s company is getting worse at controlling general expenses.
Financial Expenses Ratio (FER)
During 2013-2014 period, the business Financial Expenses Ratio (FER) has decreased from
3.2% to 3.1%. This means the business is getting better in controlling their financial expenses.
7| F N B E 0 4 1 4 | B a s i c A c c o u n t i n g | F i n a n c i a l R a t i o A n a l y s i s
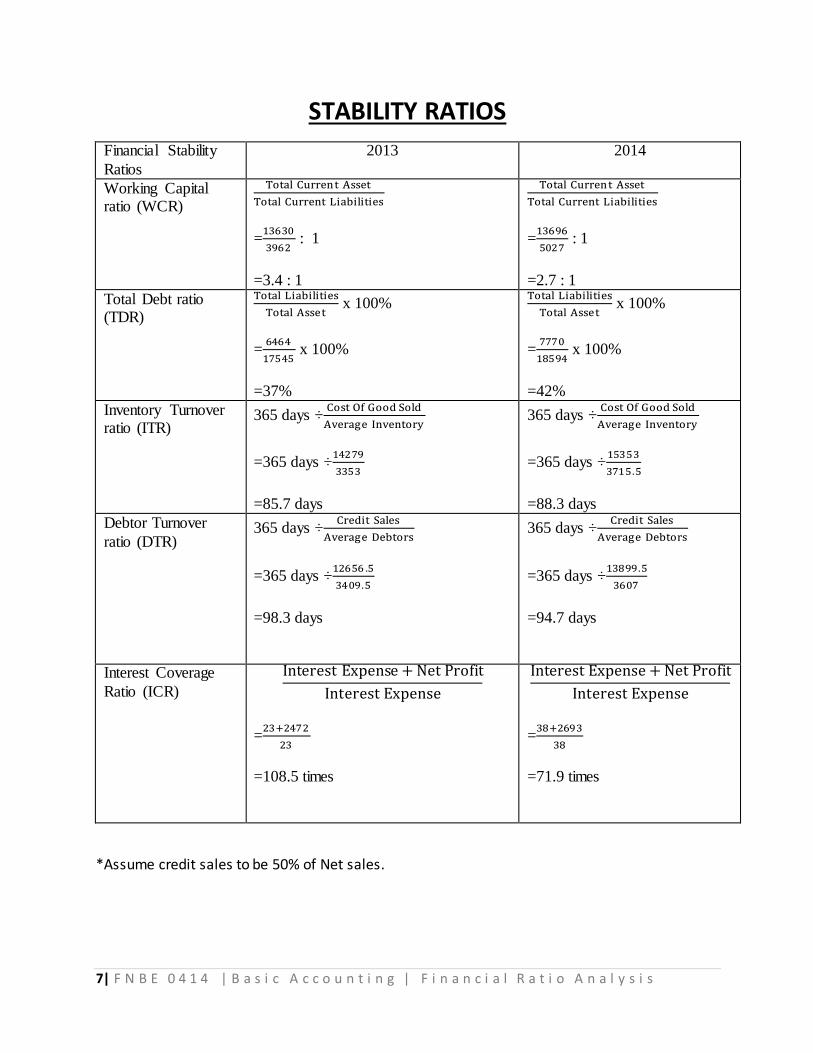
STABILITY RATIOS
Financial Stability
Ratios
2013 2014
Working Capital ratio (WCR)
Total Current Asset
Total Current Liabilities
=13630
3962 : 1
=3.4 : 1
Total Current Asset
Total Current Liabilities
=13696
5027 : 1
=2.7 : 1
Total Debt ratio (TDR)
Total Liabilities
Total Asset x 100%
=6464
17545 x 100%
=37%
Total Liabilities
Total Asset x 100%
=7770
18594 x 100%
=42%
Inventory Turnover ratio (ITR)
365 days ÷Cost Of Good Sold
Average Inventory
=365 days ÷14279
3353
=85.7 days
365 days ÷Cost Of Good Sold
Average Inventory
=365 days ÷15353
3715.5
=88.3 days
Debtor Turnover
ratio (DTR) 365 days ÷
Credit Sales
Average Debtors
=365 days ÷12656 .5
3409.5
=98.3 days
365 days ÷Credit Sales
Average Debtors
=365 days ÷13899.5
3607
=94.7 days
Interest Coverage
Ratio (ICR)
Interest Expense + Net Profit
Interest Expense
=23+2472
23
=108.5 times
Interest Expense + Net Profit
Interest Expense
=38+2693
38
=71.9 times
*Assume credit sales to be 50% of Net sales.
8| F N B E 0 4 1 4 | B a s i c A c c o u n t i n g | F i n a n c i a l R a t i o A n a l y s i s
FINANCIAL STABILIT RATIOS INTERPRETATION
Working Capital (WCR)
During the 2013-2014 period, the business Working Capital (WCR) has decreased from 3.4 : 1 to
2.7 : 1. This mean the Nike’s company ability to pay its current liabilities is getting worse. In
additional, it still satisfied the minimum requirement of 2 : 1.
Total Debt (TDR)
During the 2013-2014 period, the business Total Debt (TDR) has increased from 37% to 42%.
This means the Nike’s company total debt has increased. In additional, the business do not
exceed the maximum limit of 50%.
Inventory Turnover (ITR)
During the 2013-2014 period, the business Inventory Turnover (ITR) has increased from 85.7
days to 88.3 days. This mean the Nike’s Company is getting slower at selling their products.
Debtor Turnover (DTR)
During the 2013-2014 period, the business Debtor Turnover (DTR) has decreased from 98.3
days to 94.7 days. This mean the Nike’s company is getting faster at collecting its debt.
Interest Coverage (ICR)
During the 2013-2014 period, the business Interest Coverage (ICR) has decreased from 108.5
times to 71.9 times. This means the Nike’s company ability to pay the interest is getting worse.
In additional, it satisfied the minimum requirement of 5 times.
9| F N B E 0 4 1 4 | B a s i c A c c o u n t i n g | F i n a n c i a l R a t i o A n a l y s i s
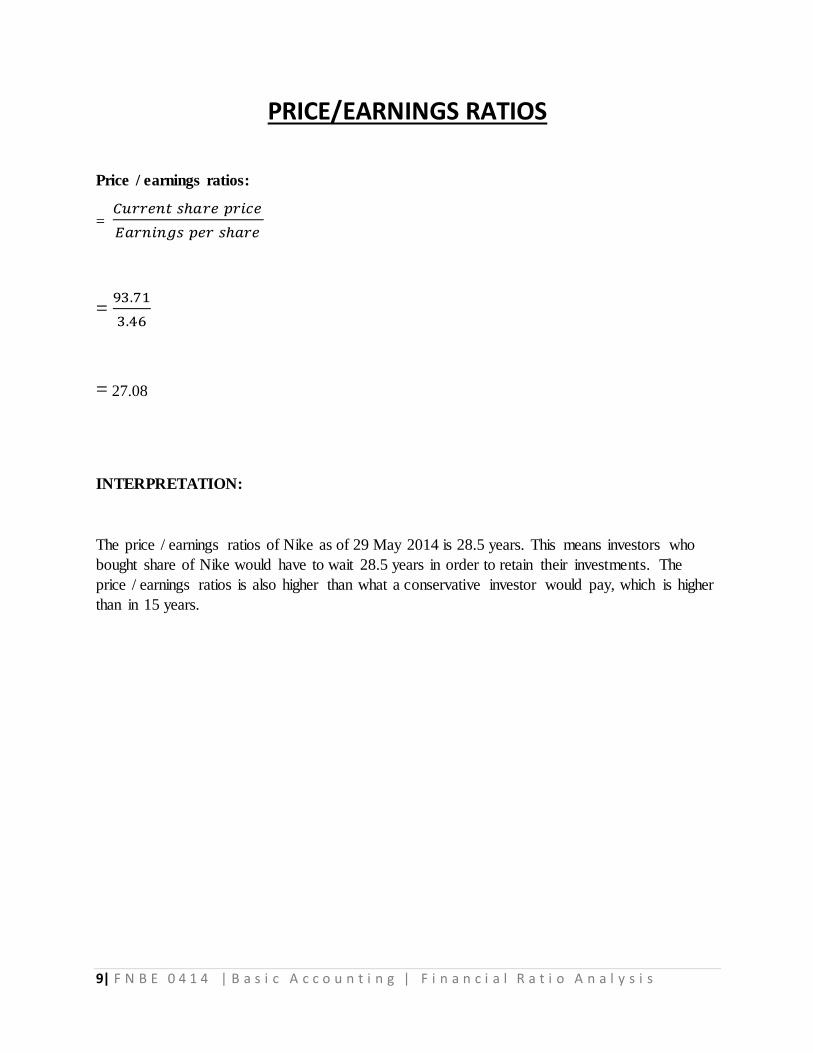
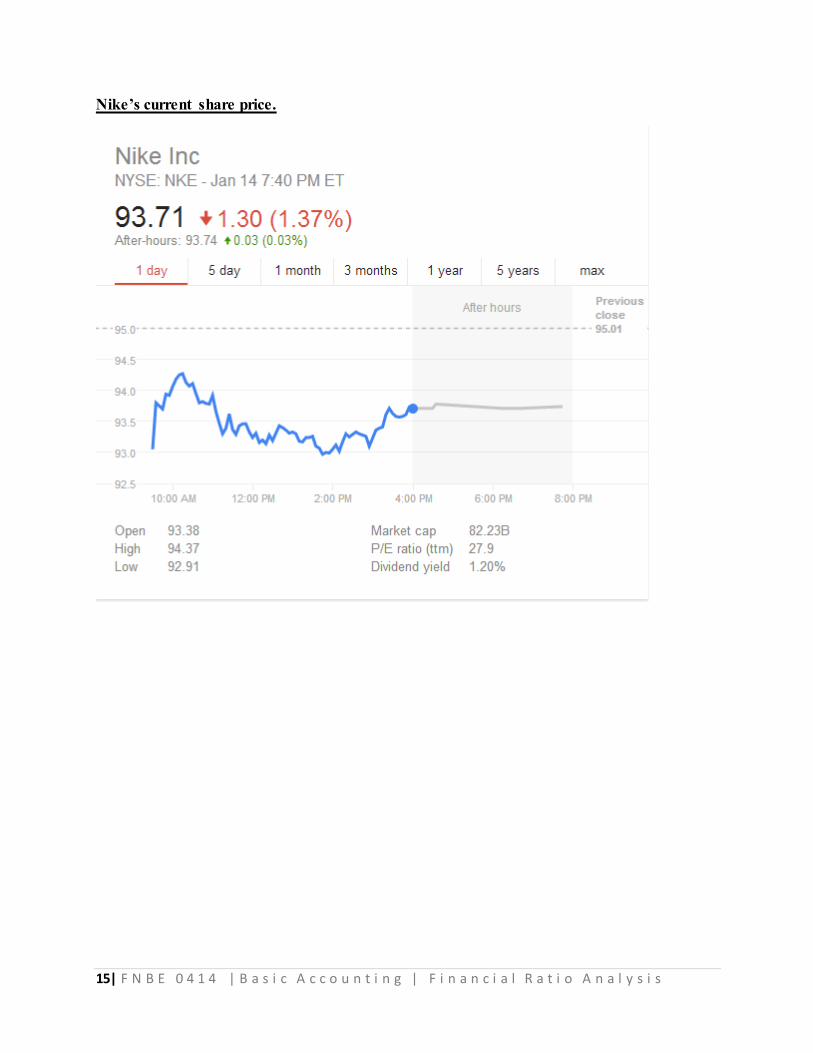
PRICE/EARNINGS RATIOS
Price / earnings ratios:
= 𝐶𝑢𝑟𝑟𝑒𝑛𝑡 𝑠ℎ𝑎𝑟𝑒 𝑝𝑟𝑖𝑐𝑒
𝐸𝑎𝑟𝑛𝑖𝑛𝑔𝑠 𝑝𝑒𝑟 𝑠ℎ𝑎𝑟𝑒
= 93.71
3.46
= 27.08
INTERPRETATION:
The price / earnings ratios of Nike as of 29 May 2014 is 28.5 years. This means investors who
bought share of Nike would have to wait 28.5 years in order to retain their investments. The
price / earnings ratios is also higher than what a conservative investor would pay, which is higher
than in 15 years.
10| F N B E 0 4 1 4 | B a s i c A c c o u n t i n g | F i n a n c i a l R a t i o A n a l y s i s
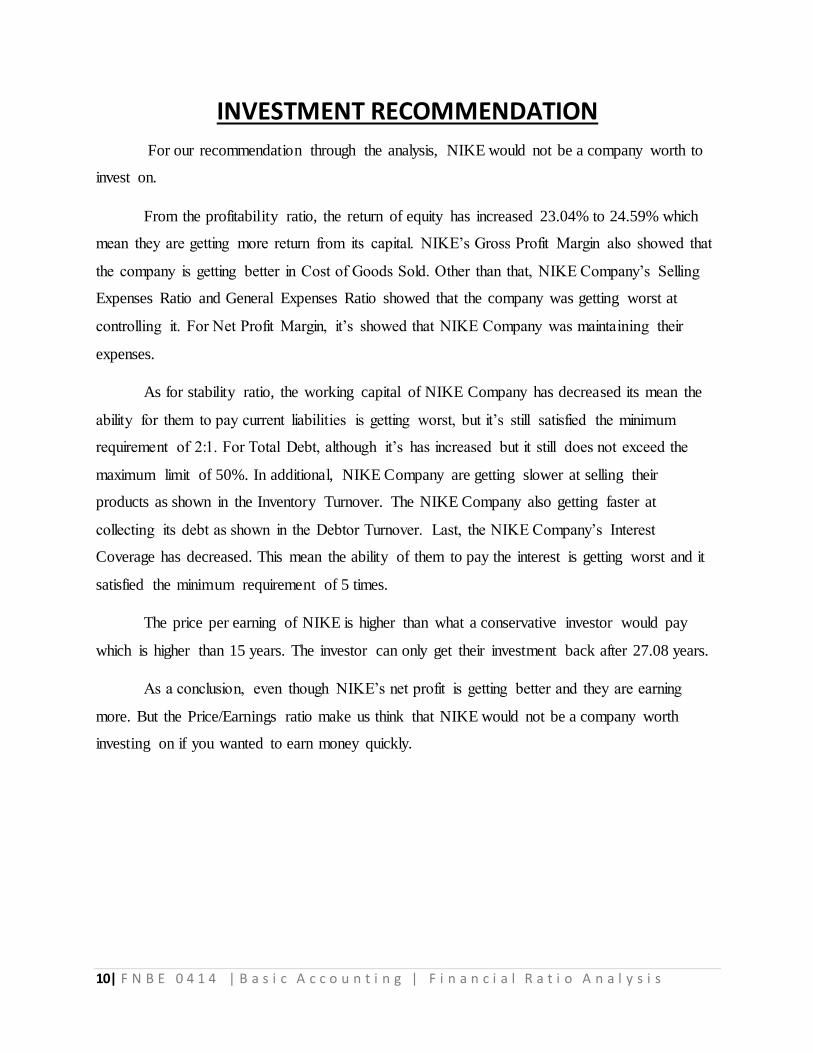
INVESTMENT RECOMMENDATION
For our recommendation through the analysis, NIKE would not be a company worth to
invest on.
From the profitability ratio, the return of equity has increased 23.04% to 24.59% which
mean they are getting more return from its capital. NIKE’s Gross Profit Margin also showed that
the company is getting better in Cost of Goods Sold. Other than that, NIKE Company’s Selling
Expenses Ratio and General Expenses Ratio showed that the company was getting worst at
controlling it. For Net Profit Margin, it’s showed that NIKE Company was maintaining their
expenses.
As for stability ratio, the working capital of NIKE Company has decreased its mean the
ability for them to pay current liabilities is getting worst, but it’s still satisfied the minimum
requirement of 2:1. For Total Debt, although it’s has increased but it still does not exceed the
maximum limit of 50%. In additional, NIKE Company are getting slower at selling their
products as shown in the Inventory Turnover. The NIKE Company also getting faster at
collecting its debt as shown in the Debtor Turnover. Last, the NIKE Company’s Interest
Coverage has decreased. This mean the ability of them to pay the interest is getting worst and it
satisfied the minimum requirement of 5 times.
The price per earning of NIKE is higher than what a conservative investor would pay
which is higher than 15 years. The investor can only get their investment back after 27.08 years.
As a conclusion, even though NIKE’s net profit is getting better and they are earning
more. But the Price/Earnings ratio make us think that NIKE would not be a company worth
investing on if you wanted to earn money quickly.
11| F N B E 0 4 1 4 | B a s i c A c c o u n t i n g | F i n a n c i a l R a t i o A n a l y s i s
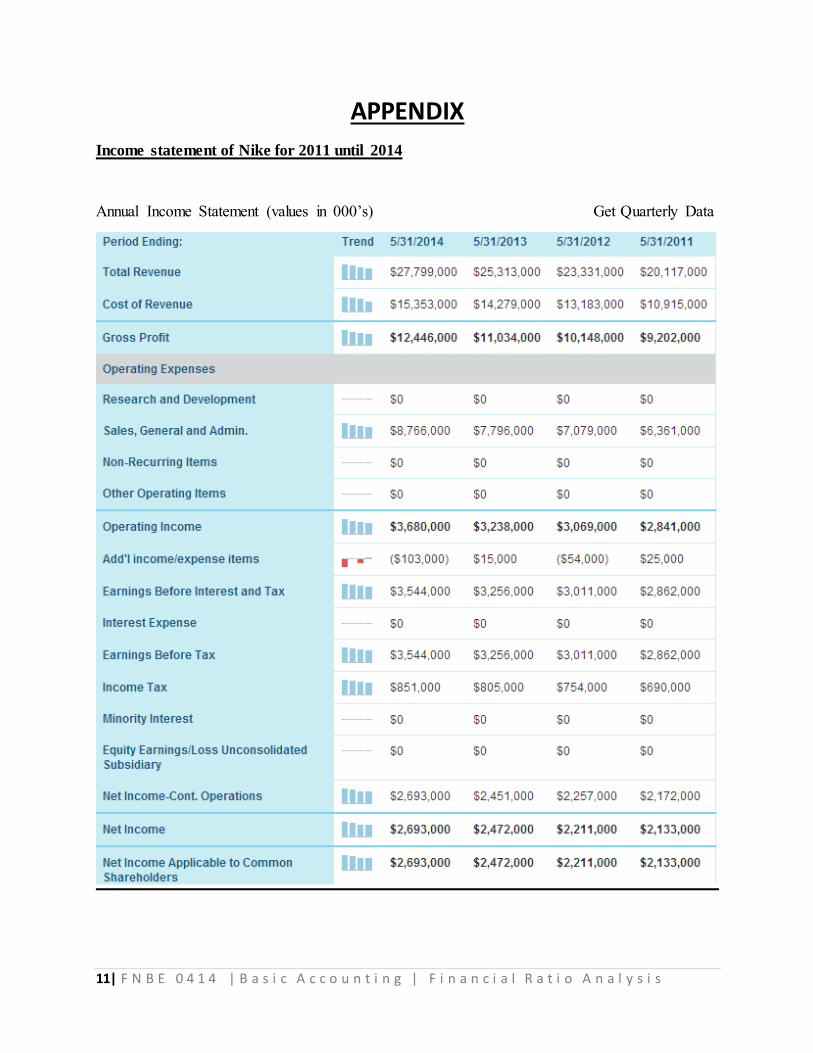
APPENDIX
Income statement of Nike for 2011 until 2014
Annual Income Statement (values in 000’s) Get Quarterly Data
12| F N B E 0 4 1 4 | B a s i c A c c o u n t i n g | F i n a n c i a l R a t i o A n a l y s i s
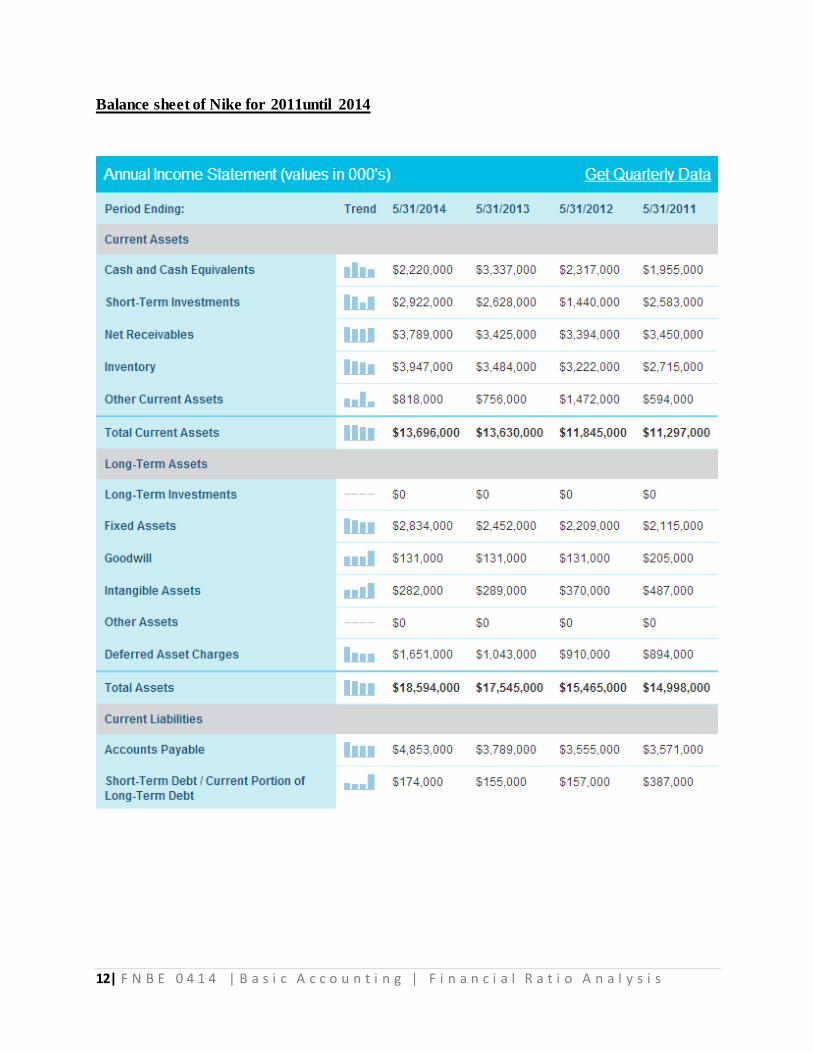
Balance sheet of Nike for 2011until 2014
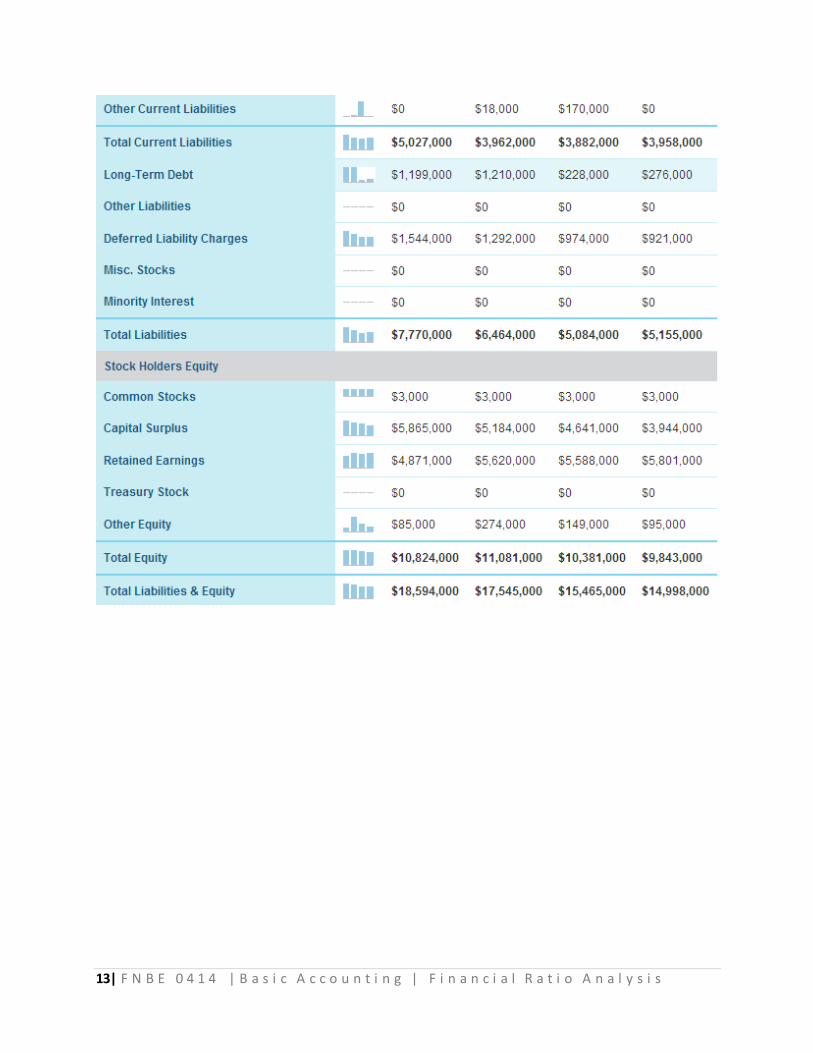
13| F N B E 0 4 1 4 | B a s i c A c c o u n t i n g | F i n a n c i a l R a t i o A n a l y s i s
14| F N B E 0 4 1 4 | B a s i c A c c o u n t i n g | F i n a n c i a l R a t i o A n a l y s i s
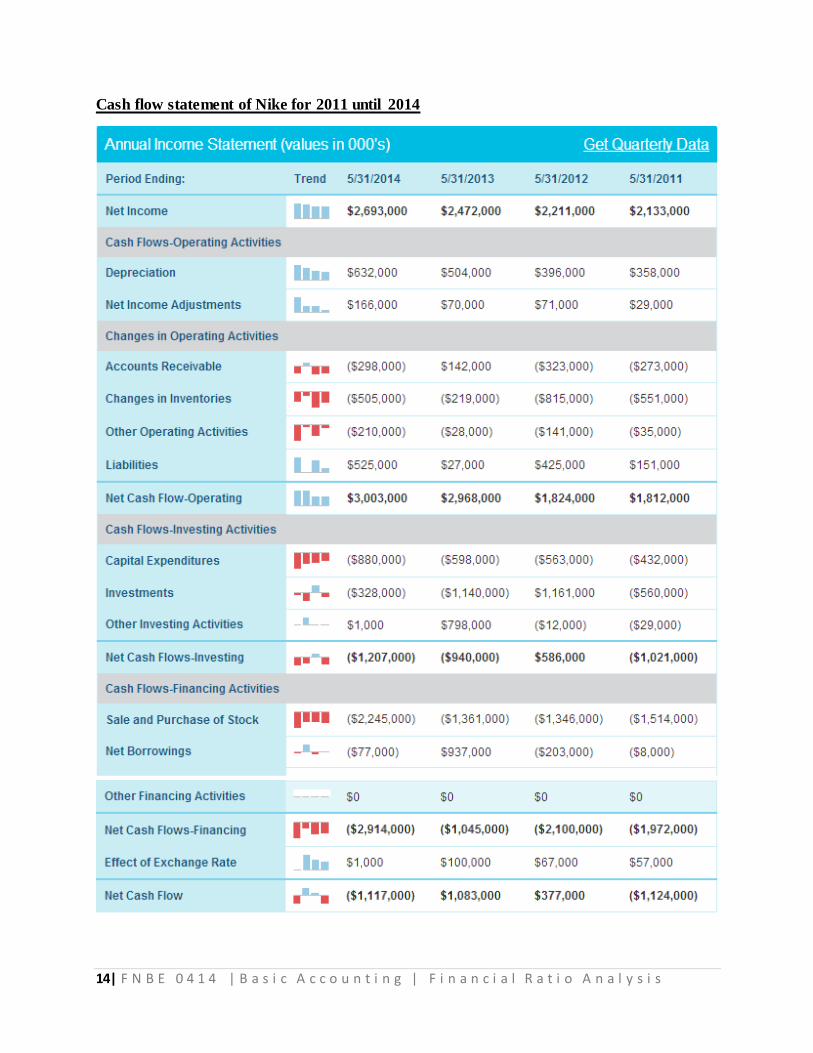
Cash flow statement of Nike for 2011 until 2014
15| F N B E 0 4 1 4 | B a s i c A c c o u n t i n g | F i n a n c i a l R a t i o A n a l y s i s
Nike’s current share price.
16| F N B E 0 4 1 4 | B a s i c A c c o u n t i n g | F i n a n c i a l R a t i o A n a l y s i s
REFERENCES
1. NKE Company Financials. (2015, January 14). Retrieved from
http://www.nasdaq.com/symbol/nke/financials?query=ratios
2. Nike, Inc. (NKE). (2015, January 14). Retrieved from
https://finance.yahoo.com/q/is?s=NKE Income Statement&annual
3. Wiley, J. (2000) Accounting Standard: Statements of Financial Accounting Concepts.
N.Y.
4. Jones, M. (2006) Financial Accounting. Chichester, England.
5. Walter, T.H. & Charles, T.H. (2001) Financial Accounting. Upper Saddle River, N.J.