Embed Size (px)
Citation preview

DESIGNING, MANUFACTURING AND CREATING ULTIMATE VALUE FOR A FASHIONABLE AND LUCRATIVE FUTURE…
06 Main Information 32 History of DESA26 Board Members 42 Investor Relations
08 DESA at a Glance 3428 Management Team
Business Model Distinguishing DESA
46
10 Key Performance Indicators 35 Highlights
of 201330 Our Vision & Mission 52 Audit Report
14 Chairman’s Message 40 Human Resources30 Our Value Chain
& Targets 91 Other Activities
CONTENTS
Corporate GovernancePrinciples
Production Facility and Headquarters in
Sefaköy with an indoor area of 17,000 m² built
on an area of
6,000 m2
Million Equity
63.6Export
Champion for
3consecutive
years
Solution provider of
international brands
Headquarters and
showroom in London
Distributorship of Aerosoles
in Turkey since 2003
26Years of
Distributorship in Turkey
indoor area for leather tanning
facilities
20,000 m2
Düzce Facility with an indoor area
of 10,000 m² spanning a total area of
20,000m2
Total Area of Stores
18,598 m2
Employees
1,937
Years of Experience
41
111Total Stores
2International
Stores (London)
International DesignTeam
Stores
28
7Years of Partnership
(60%-40% JV)
Million EBIDTA
11.8TL Million Revenue
183.1TL
Million Total Assets
157.8TL
TL
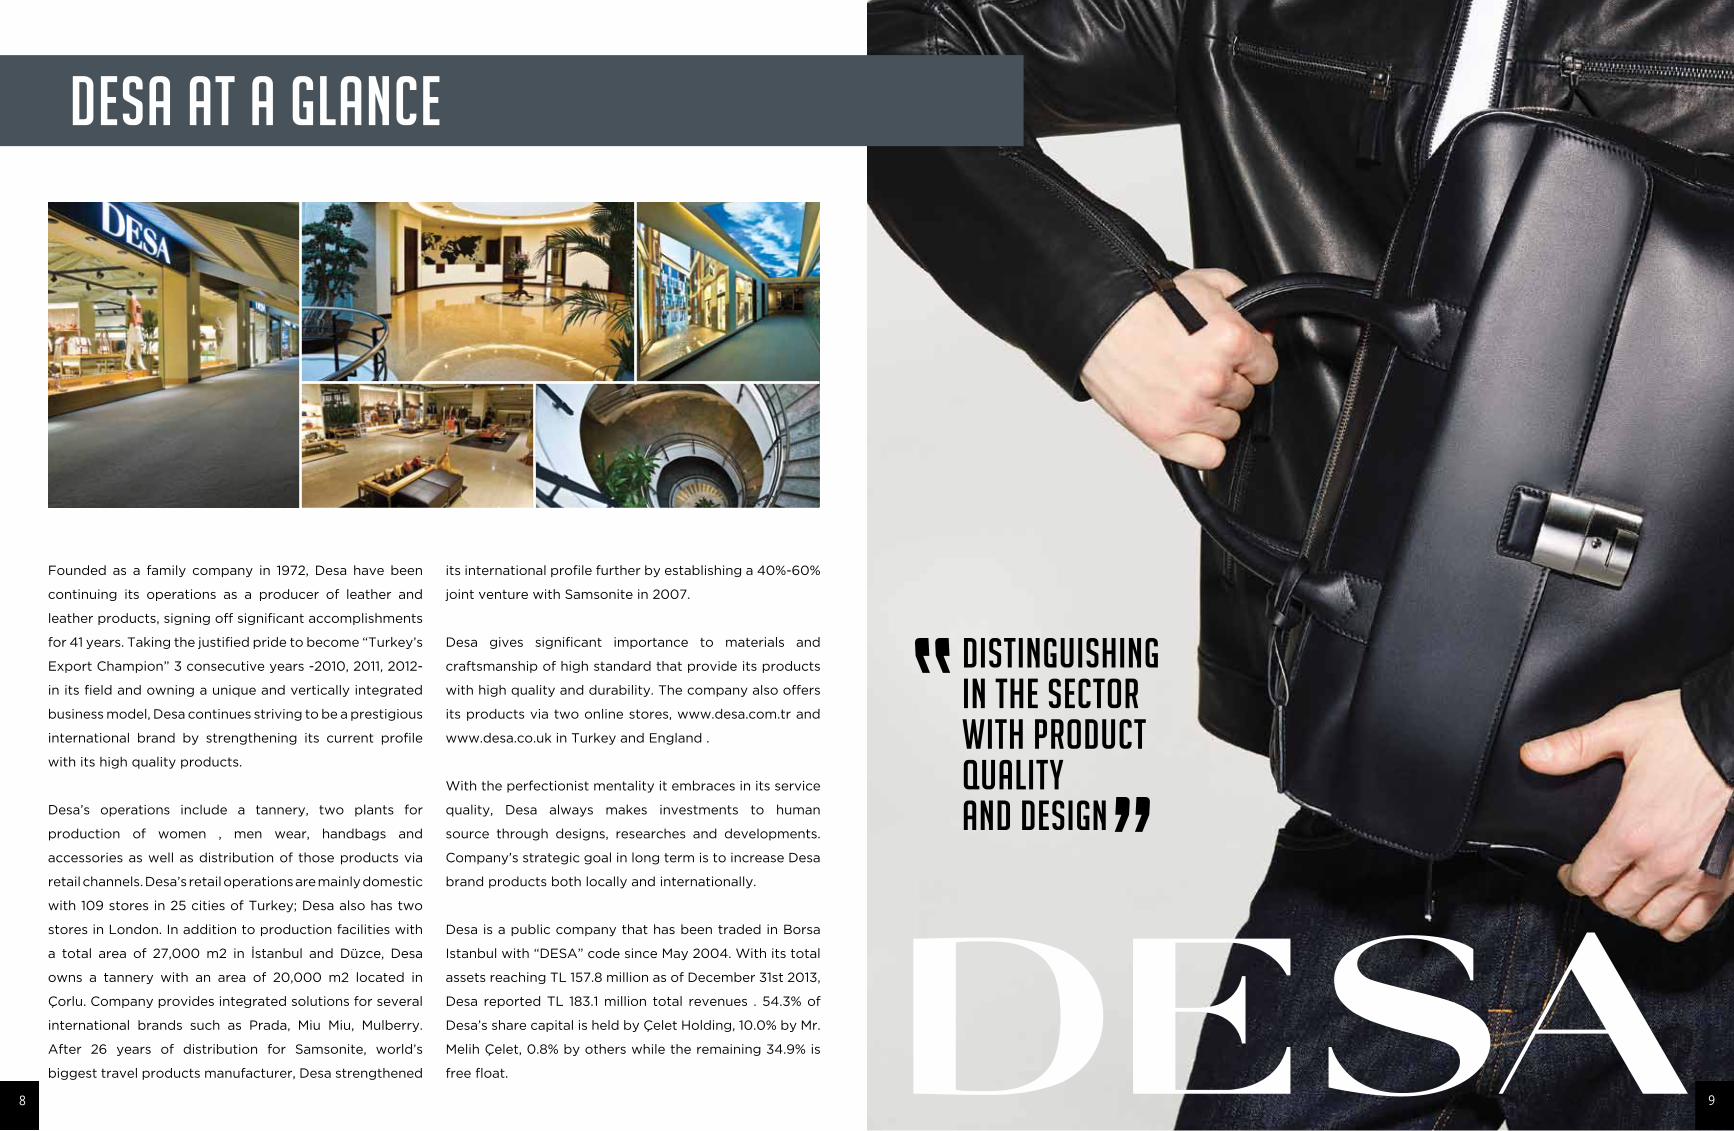
DISTINGUISHING IN THE SECTORWITH PRODUCT QUALITYAND DESIGN
DESA AT A GLANCE
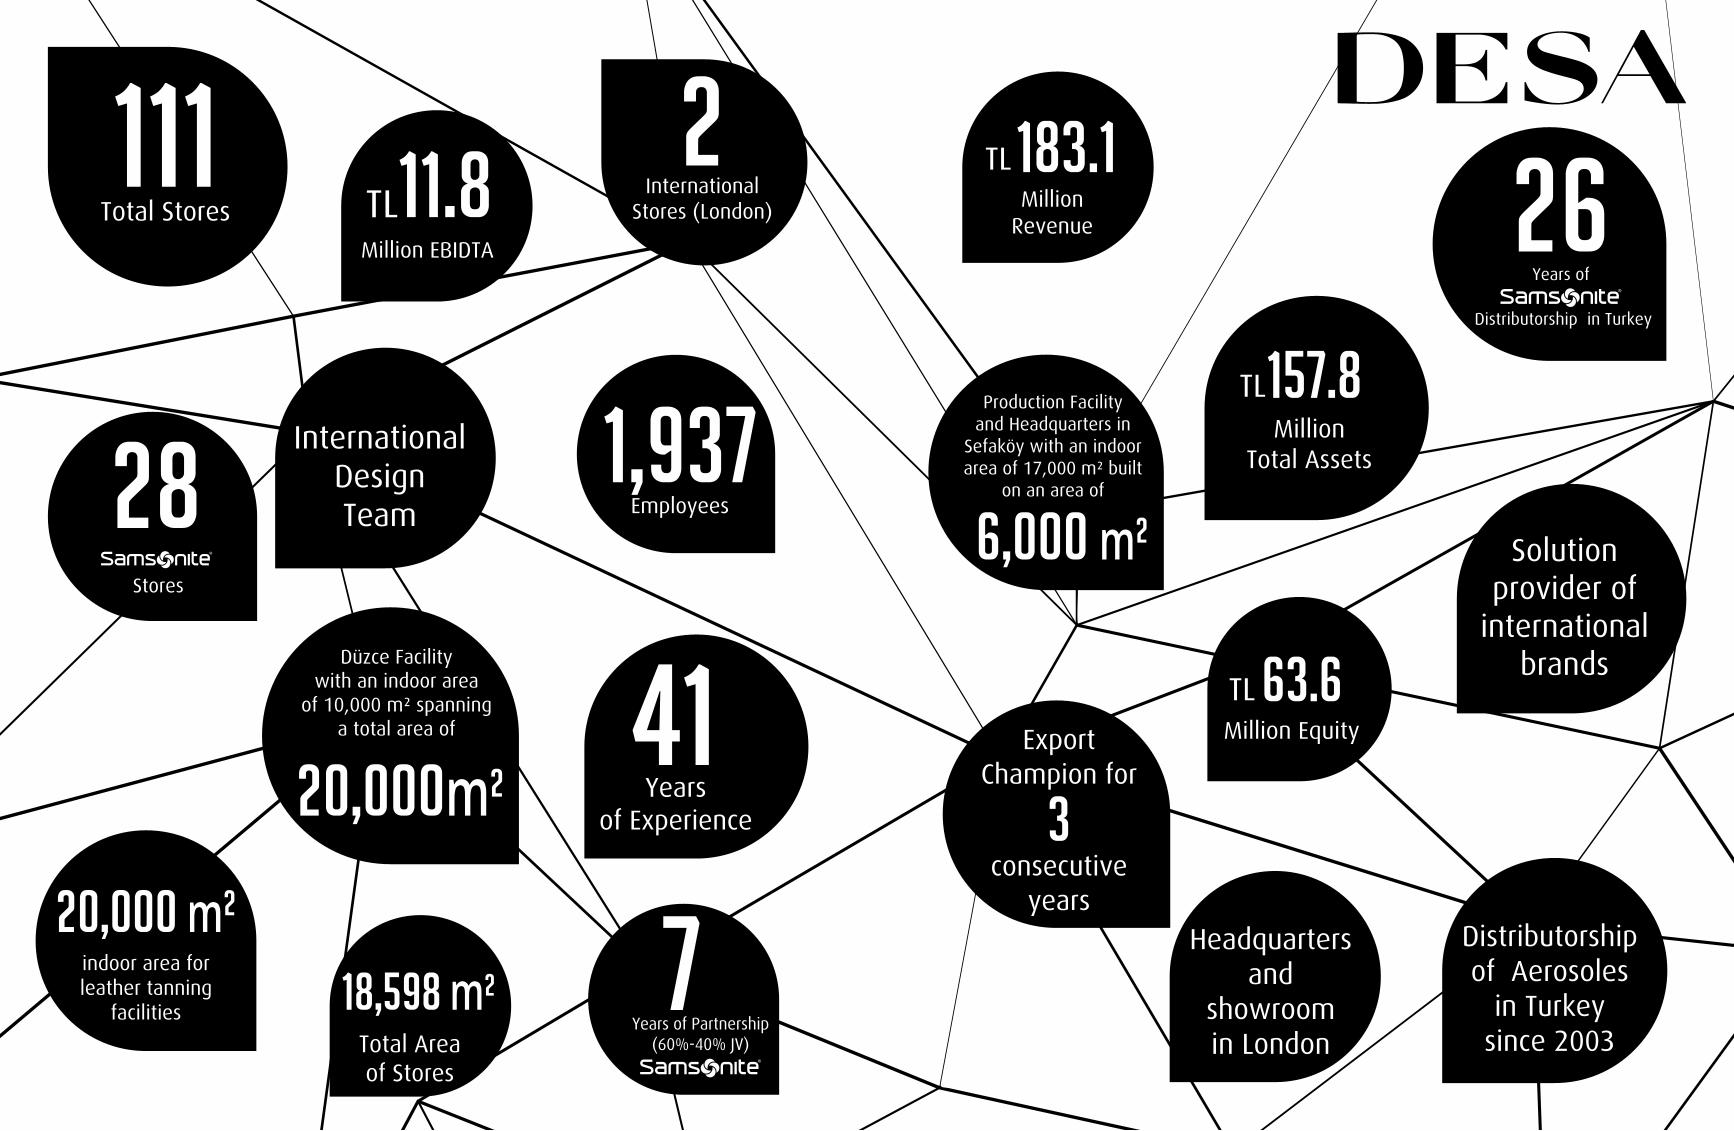
Founded as a family company in 1972, Desa have been
continuing its operations as a producer of leather and
leather products, signing off significant accomplishments
for 41 years. Taking the justified pride to become “Turkey’s
Export Champion” 3 consecutive years -2010, 2011, 2012-
in its field and owning a unique and vertically integrated
business model, Desa continues striving to be a prestigious
international brand by strengthening its current profile
with its high quality products.
Desa’s operations include a tannery, two plants for
production of women , men wear, handbags and
accessories as well as distribution of those products via
retail channels. Desa’s retail operations are mainly domestic
with 109 stores in 25 cities of Turkey; Desa also has two
stores in London. In addition to production facilities with
a total area of 27,000 m2 in İstanbul and Düzce, Desa
owns a tannery with an area of 20,000 m2 located in
Çorlu. Company provides integrated solutions for several
international brands such as Prada, Miu Miu, Mulberry.
After 26 years of distribution for Samsonite, world’s
biggest travel products manufacturer, Desa strengthened
its international profile further by establishing a 40%-60%
joint venture with Samsonite in 2007.
Desa gives significant importance to materials and
craftsmanship of high standard that provide its products
with high quality and durability. The company also offers
its products via two online stores, www.desa.com.tr and
www.desa.co.uk in Turkey and England .
With the perfectionist mentality it embraces in its service
quality, Desa always makes investments to human
source through designs, researches and developments.
Company’s strategic goal in long term is to increase Desa
brand products both locally and internationally.
Desa is a public company that has been traded in Borsa
Istanbul with “DESA” code since May 2004. With its total
assets reaching TL 157.8 million as of December 31st 2013,
Desa reported TL 183.1 million total revenues . 54.3% of
Desa’s share capital is held by Çelet Holding, 10.0% by Mr.
Melih Çelet, 0.8% by others while the remaining 34.9% is
free float.
8 9
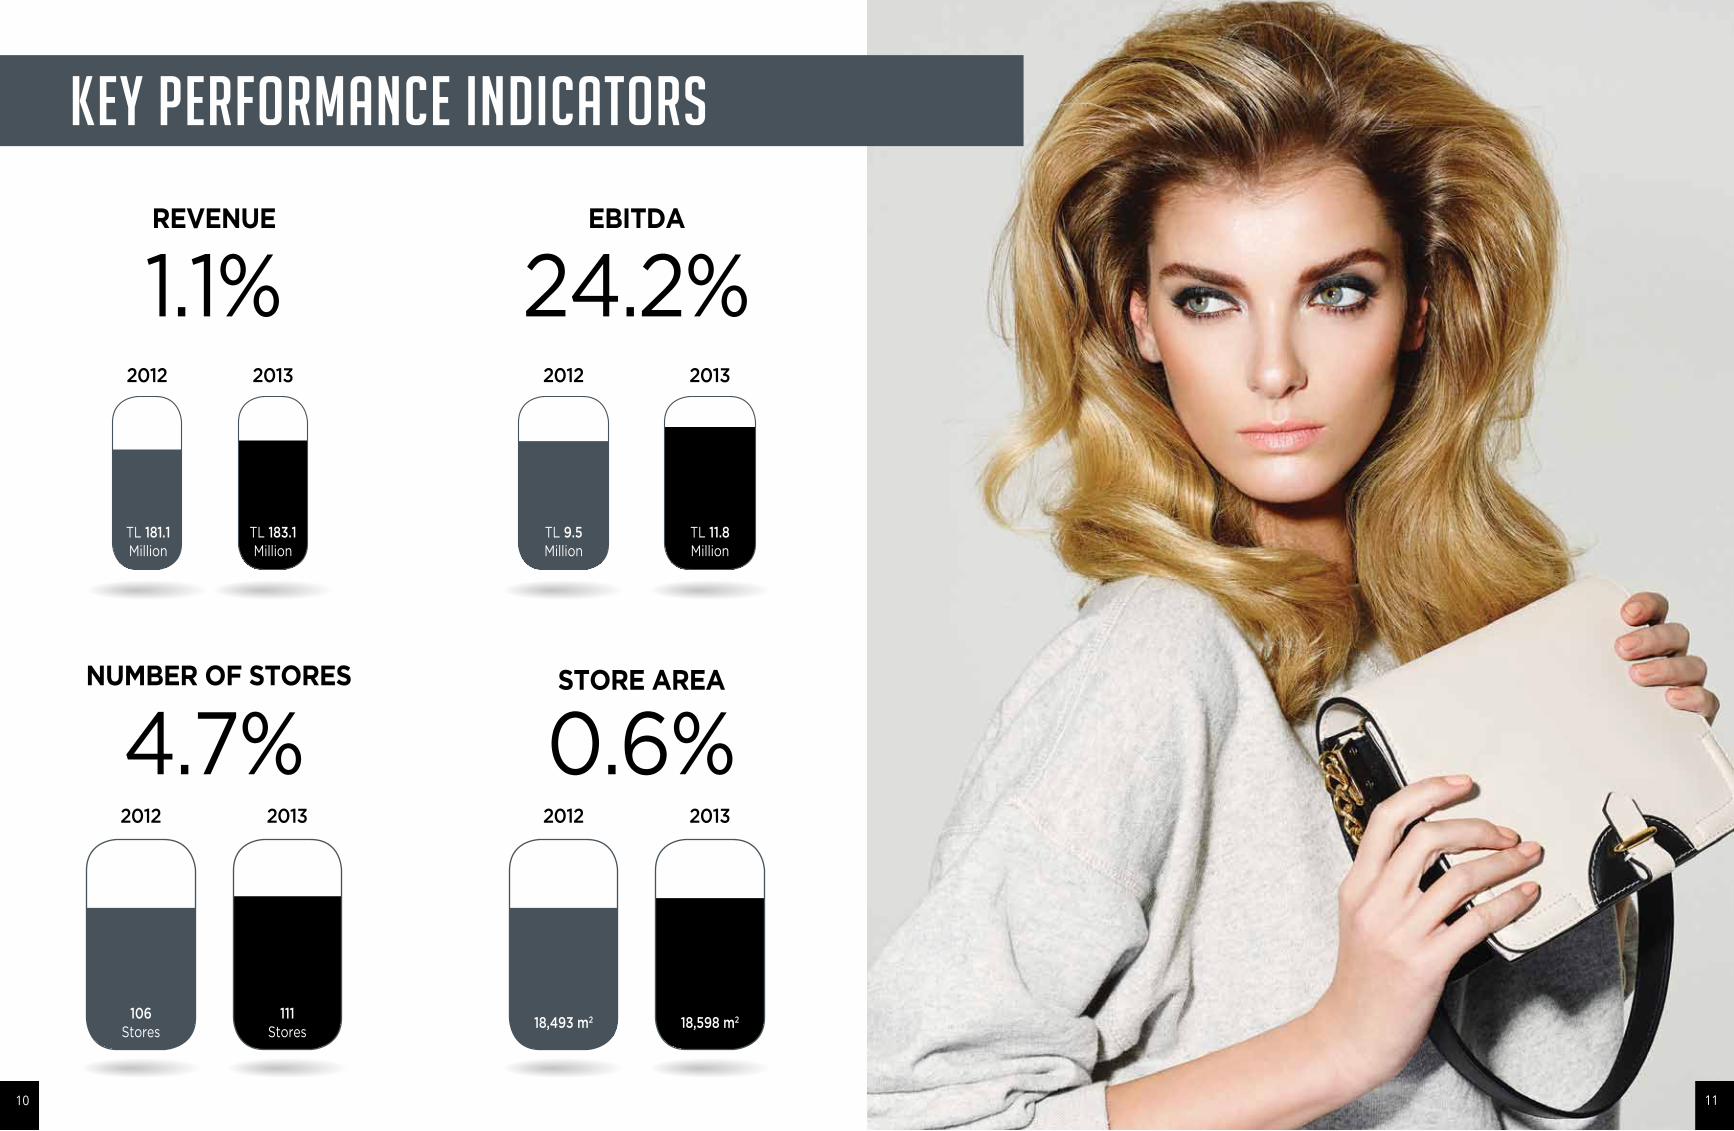
REVENUE
STORE AREA
EBITDA
1.1%
NUMBER OF STORES
4.7% 0.6%
24.2%2012 2013
KEY PERFORMANCE INDICATORS
181 Milyon TL
2012 20122013 2013
106 Stores
111 Stores
18,493 m2 18,598 m2
2012 2013
TL 9.5 Million
TL 11.8 Million
TL 183.1Million
TL 181.1Million
10 11
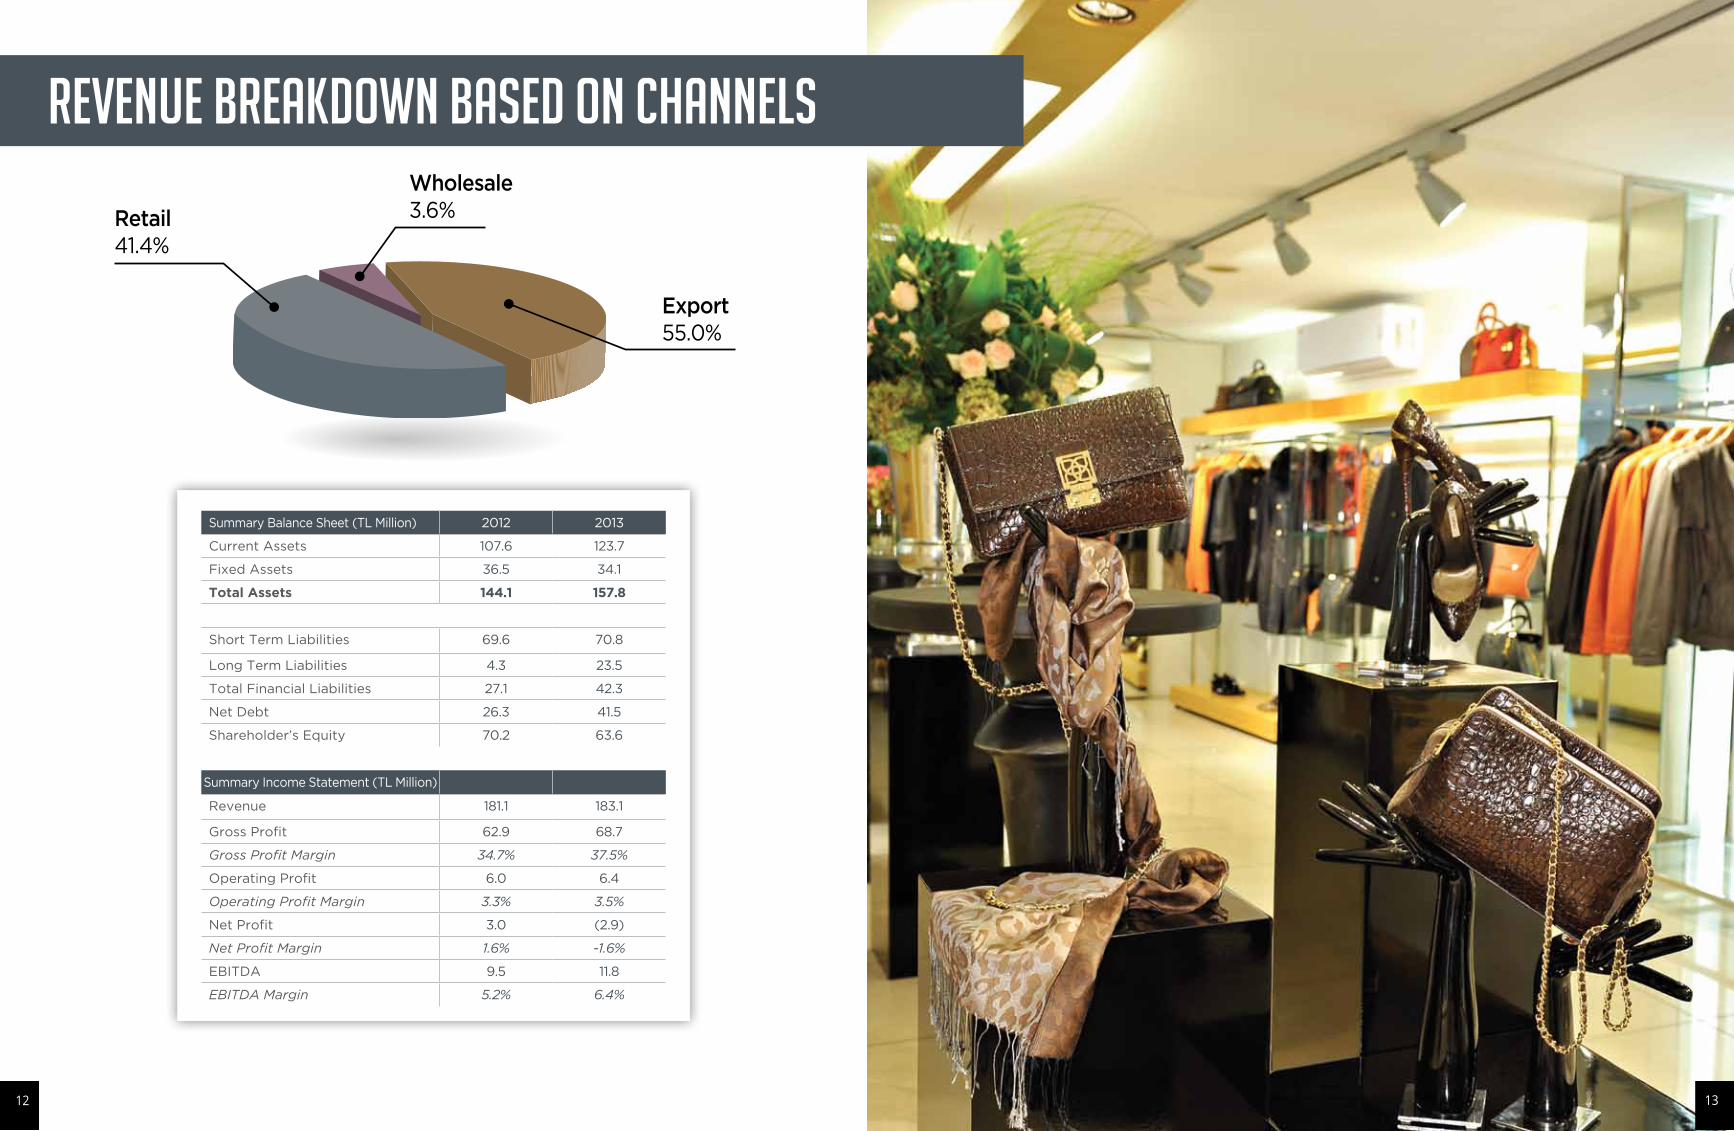
Wholesale 3.6%
REVENUE BREAKDOWN BASED ON CHANNELS
Retail 41.4%
Export 55.0%
Summary Balance Sheet (TL Million) 2012 2013
Current Assets 107.6 123.7
Fixed Assets 36.5 34.1
Total Assets 144.1 157.8
Short Term Liabilities 69.6 70.8
Long Term Liabilities 4.3 23.5
Total Financial Liabilities 27.1 42.3
Net Debt 26.3 41.5
Shareholder’s Equity 70.2 63.6
Summary Income Statement (TL Million)
Revenue 181.1 183.1
Gross Profit 62.9 68.7
Gross Profit Margin 34.7% 37.5%
Operating Profit 6.0 6.4
Operating Profit Margin 3.3% 3.5%
Net Profit 3.0 (2.9)
Net Profit Margin 1.6% -1.6%
EBITDA 9.5 11.8
EBITDA Margin 5.2% 6.4%
12 13
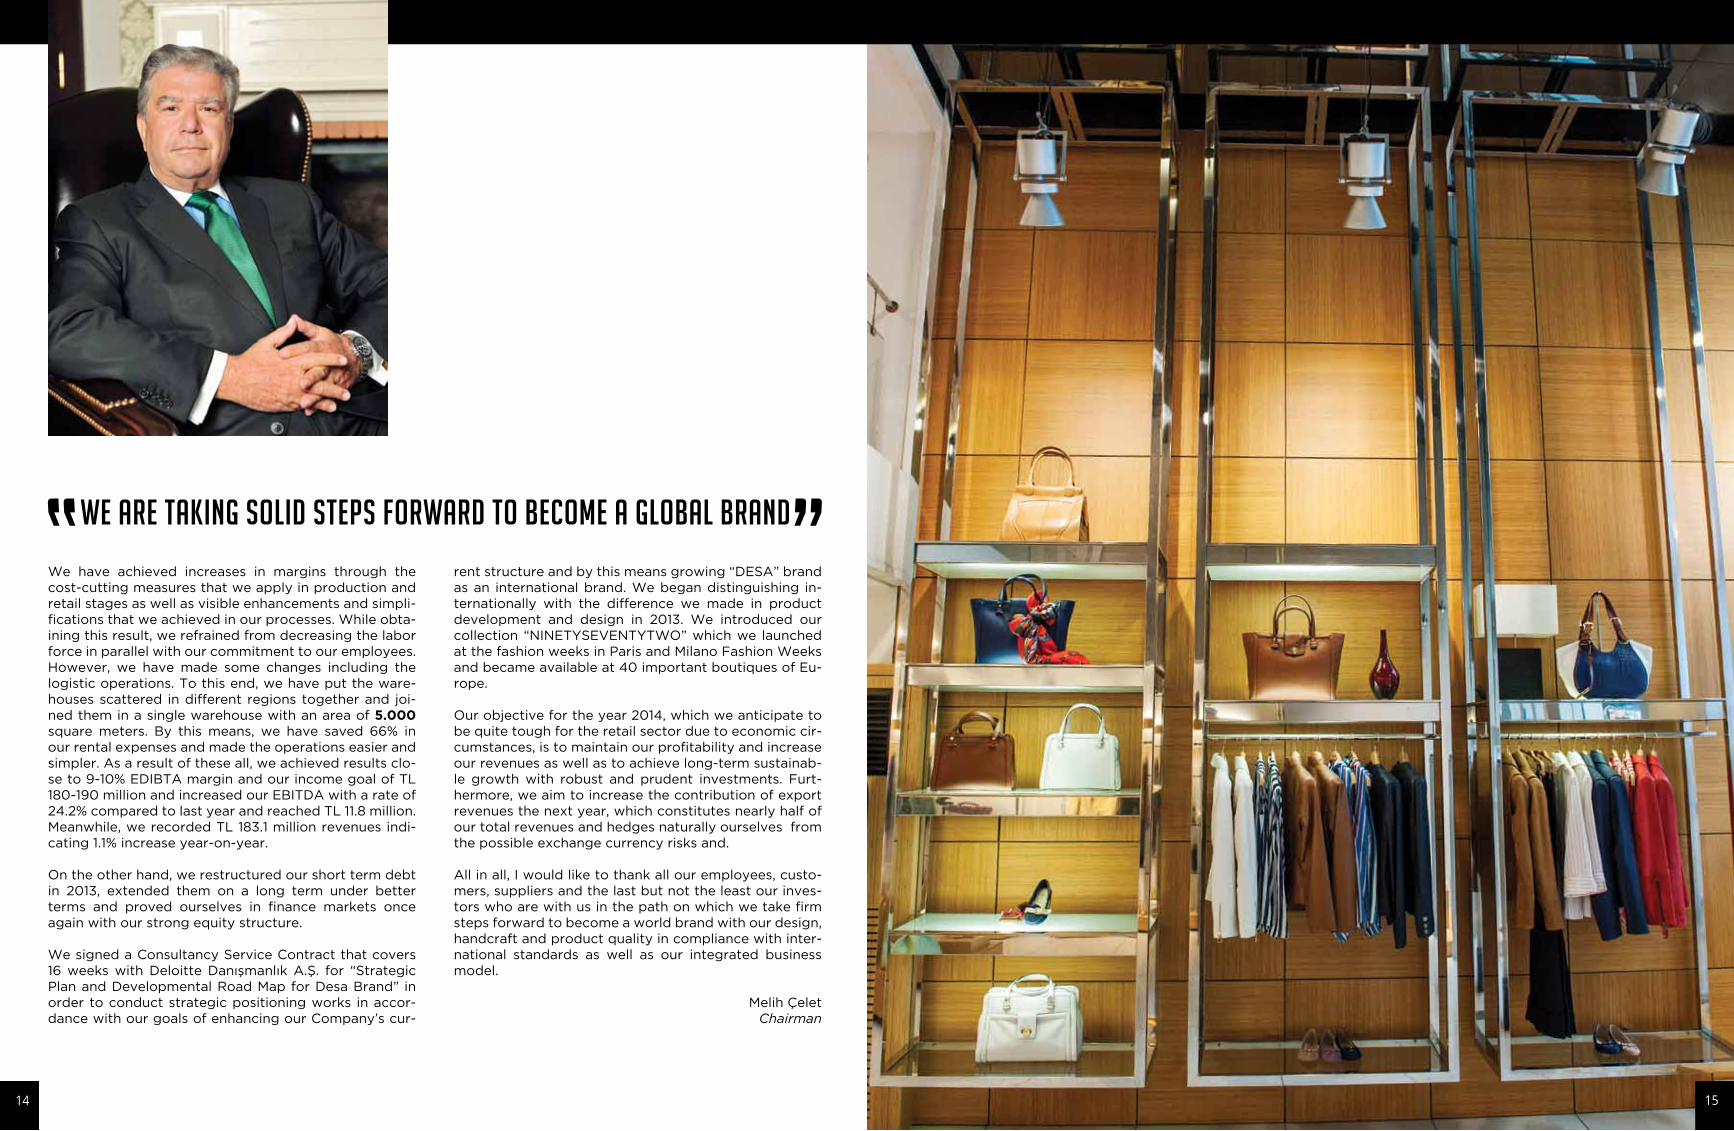
WE ARE TAKING SOLID STEPS FORWARD TO BECOME A GLOBAL BRAND
We have achieved increases in margins through the cost-cutting measures that we apply in production and retail stages as well as visible enhancements and simpli-fications that we achieved in our processes. While obta-ining this result, we refrained from decreasing the labor force in parallel with our commitment to our employees. However, we have made some changes including the logistic operations. To this end, we have put the ware-houses scattered in different regions together and joi-ned them in a single warehouse with an area of 5.000 square meters. By this means, we have saved 66% in our rental expenses and made the operations easier and simpler. As a result of these all, we achieved results clo-se to 9-10% EDIBTA margin and our income goal of TL 180-190 million and increased our EBITDA with a rate of 24.2% compared to last year and reached TL 11.8 million. Meanwhile, we recorded TL 183.1 million revenues indi-cating 1.1% increase year-on-year.
On the other hand, we restructured our short term debt in 2013, extended them on a long term under better terms and proved ourselves in finance markets once again with our strong equity structure.
We signed a Consultancy Service Contract that covers 16 weeks with Deloitte Danışmanlık A.Ş. for “Strategic Plan and Developmental Road Map for Desa Brand” in order to conduct strategic positioning works in accor-dance with our goals of enhancing our Company’s cur-
rent structure and by this means growing “DESA” brand as an international brand. We began distinguishing in-ternationally with the difference we made in product development and design in 2013. We introduced our collection “NINETYSEVENTYTWO” which we launched at the fashion weeks in Paris and Milano Fashion Weeks and became available at 40 important boutiques of Eu-rope.
Our objective for the year 2014, which we anticipate to be quite tough for the retail sector due to economic cir-cumstances, is to maintain our profitability and increase our revenues as well as to achieve long-term sustainab-le growth with robust and prudent investments. Furt-hermore, we aim to increase the contribution of export revenues the next year, which constitutes nearly half of our total revenues and hedges naturally ourselves from the possible exchange currency risks and.
All in all, I would like to thank all our employees, custo-mers, suppliers and the last but not the least our inves-tors who are with us in the path on which we take firm steps forward to become a world brand with our design, handcraft and product quality in compliance with inter-national standards as well as our integrated business model.
Melih Çelet Chairman
14 15

NINETEENSEVENTYTWO
16 17
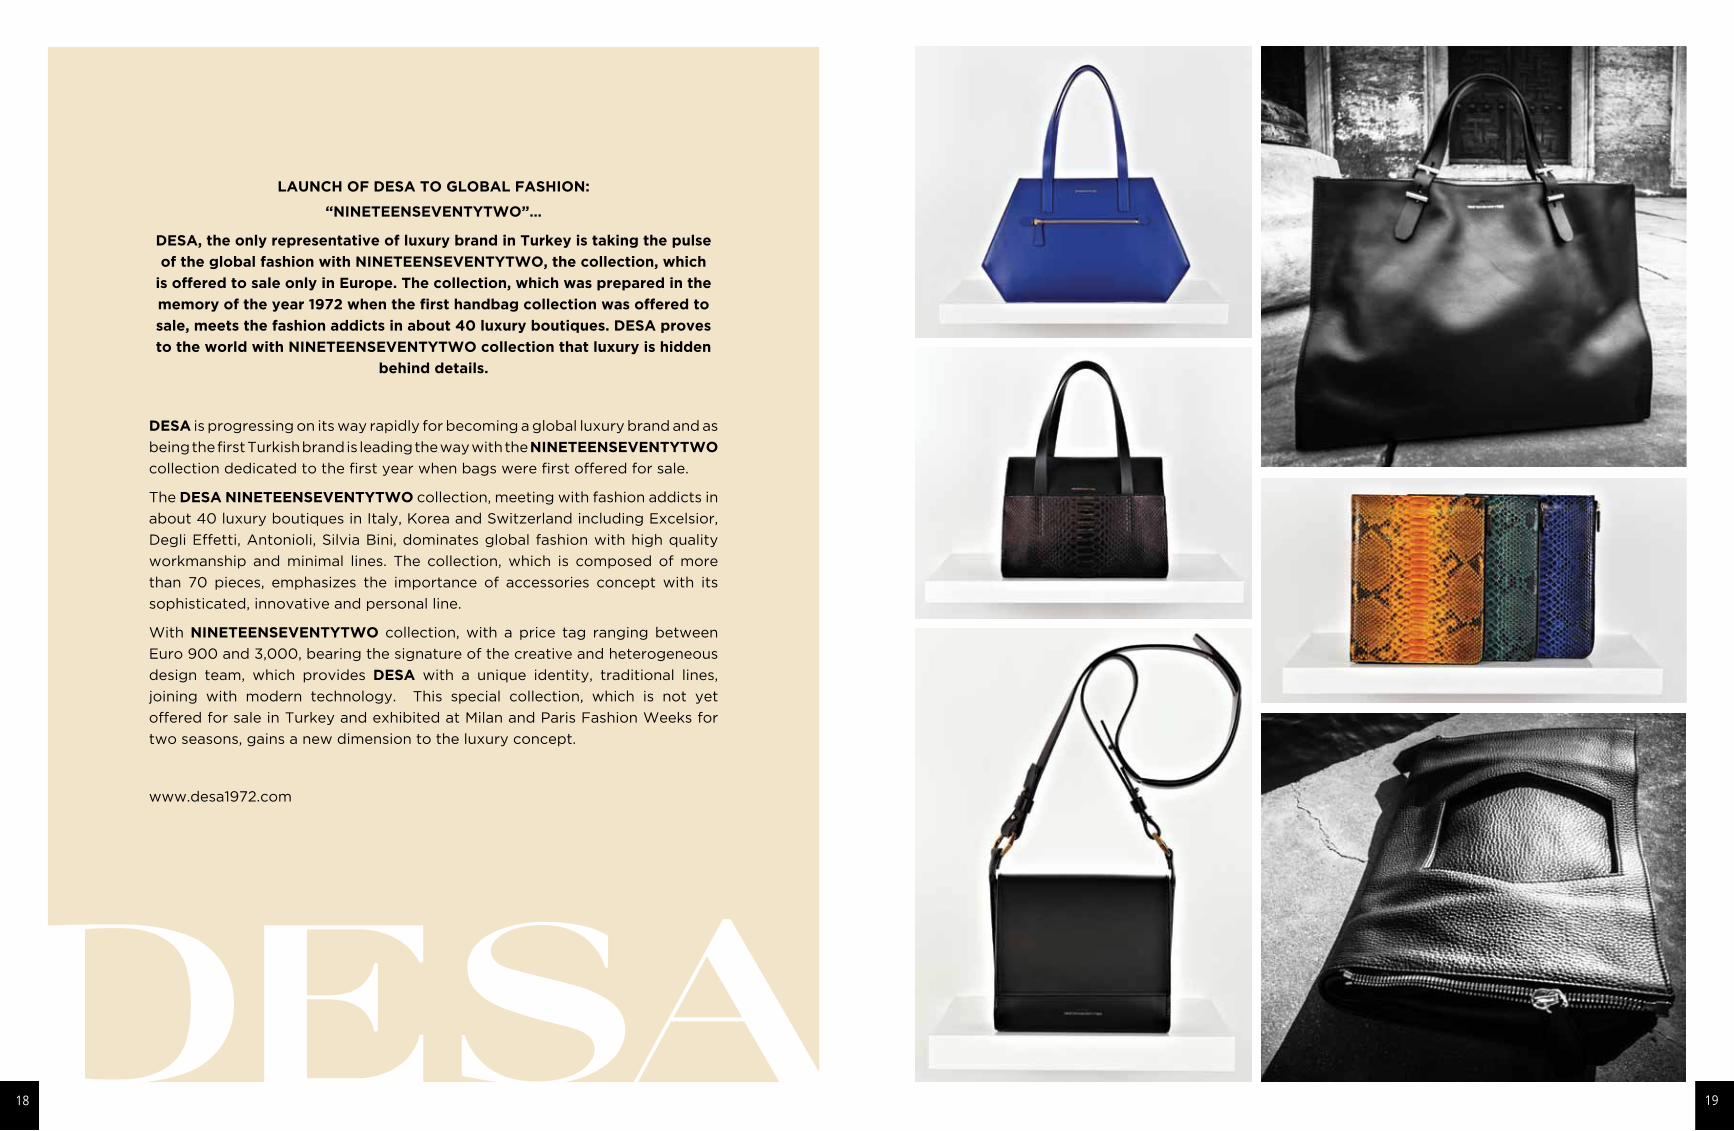
LAUNCH OF DESA TO GLOBAL FASHION:
“NINETEENSEVENTYTWO”…
DESA, the only representative of luxury brand in Turkey is taking the pulse
of the global fashion with NINETEENSEVENTYTWO, the collection, which
is offered to sale only in Europe. The collection, which was prepared in the
memory of the year 1972 when the first handbag collection was offered to
sale, meets the fashion addicts in about 40 luxury boutiques. DESA proves
to the world with NINETEENSEVENTYTWO collection that luxury is hidden
behind details.
DESA is progressing on its way rapidly for becoming a global luxury brand and as
being the first Turkish brand is leading the way with the NINETEENSEVENTYTWO
collection dedicated to the first year when bags were first offered for sale.
The DESA NINETEENSEVENTYTWO collection, meeting with fashion addicts in
about 40 luxury boutiques in Italy, Korea and Switzerland including Excelsior,
Degli Effetti, Antonioli, Silvia Bini, dominates global fashion with high quality
workmanship and minimal lines. The collection, which is composed of more
than 70 pieces, emphasizes the importance of accessories concept with its
sophisticated, innovative and personal line.
With NINETEENSEVENTYTWO collection, with a price tag ranging between
Euro 900 and 3,000, bearing the signature of the creative and heterogeneous
design team, which provides DESA with a unique identity, traditional lines,
joining with modern technology. This special collection, which is not yet
offered for sale in Turkey and exhibited at Milan and Paris Fashion Weeks for
two seasons, gains a new dimension to the luxury concept.
www.desa1972.com
18 19

NINETEENSEVENTYTWO
New DESA NINETEENSEVENTYTWO collection offered to our customers at Milano Fashion Week held between
February 21st and 24th 2014 and Paris Fashion Week Fashion Week held between March 1st and 5th 2014.
DESA produced a special collection with high levels of quality, handcraft and minimal design named DESA
NINETEENSEVENTYTWO, dedicated to the first year when the brand launched its first handbags. These
special products yet to be launched in Turkey are available in about 40 luxury boutiques such as Excelsior,
Degli Effetti, Antonioli, Silvia Bini in Italy, Korea and Switzerland.
NINETEENSEVENTYTWO
Offered through pop-up showroom in Hotel Baglioni during Milano Fashion Week between September 21st
and 23rd 2013 to the taste of world-famous boutiques, SS14 collection consists of 70 pieces, prices of which
vary between 900 and 3,000 Euros. The most remarkable piece of the collection is a handbag designed with a
body of red python and interior of all lambskin. It presents an original and spectacular design that can be used
as both a clutch and shoulder bag. This special collection was also exhibited in the showroom established at
Espace Commines within the scope of Paris Fashion Week dated September 28th – October 4th 2013, proving
that a Turkish brand has reached the highest levels of design and quality.
20 21

22 23
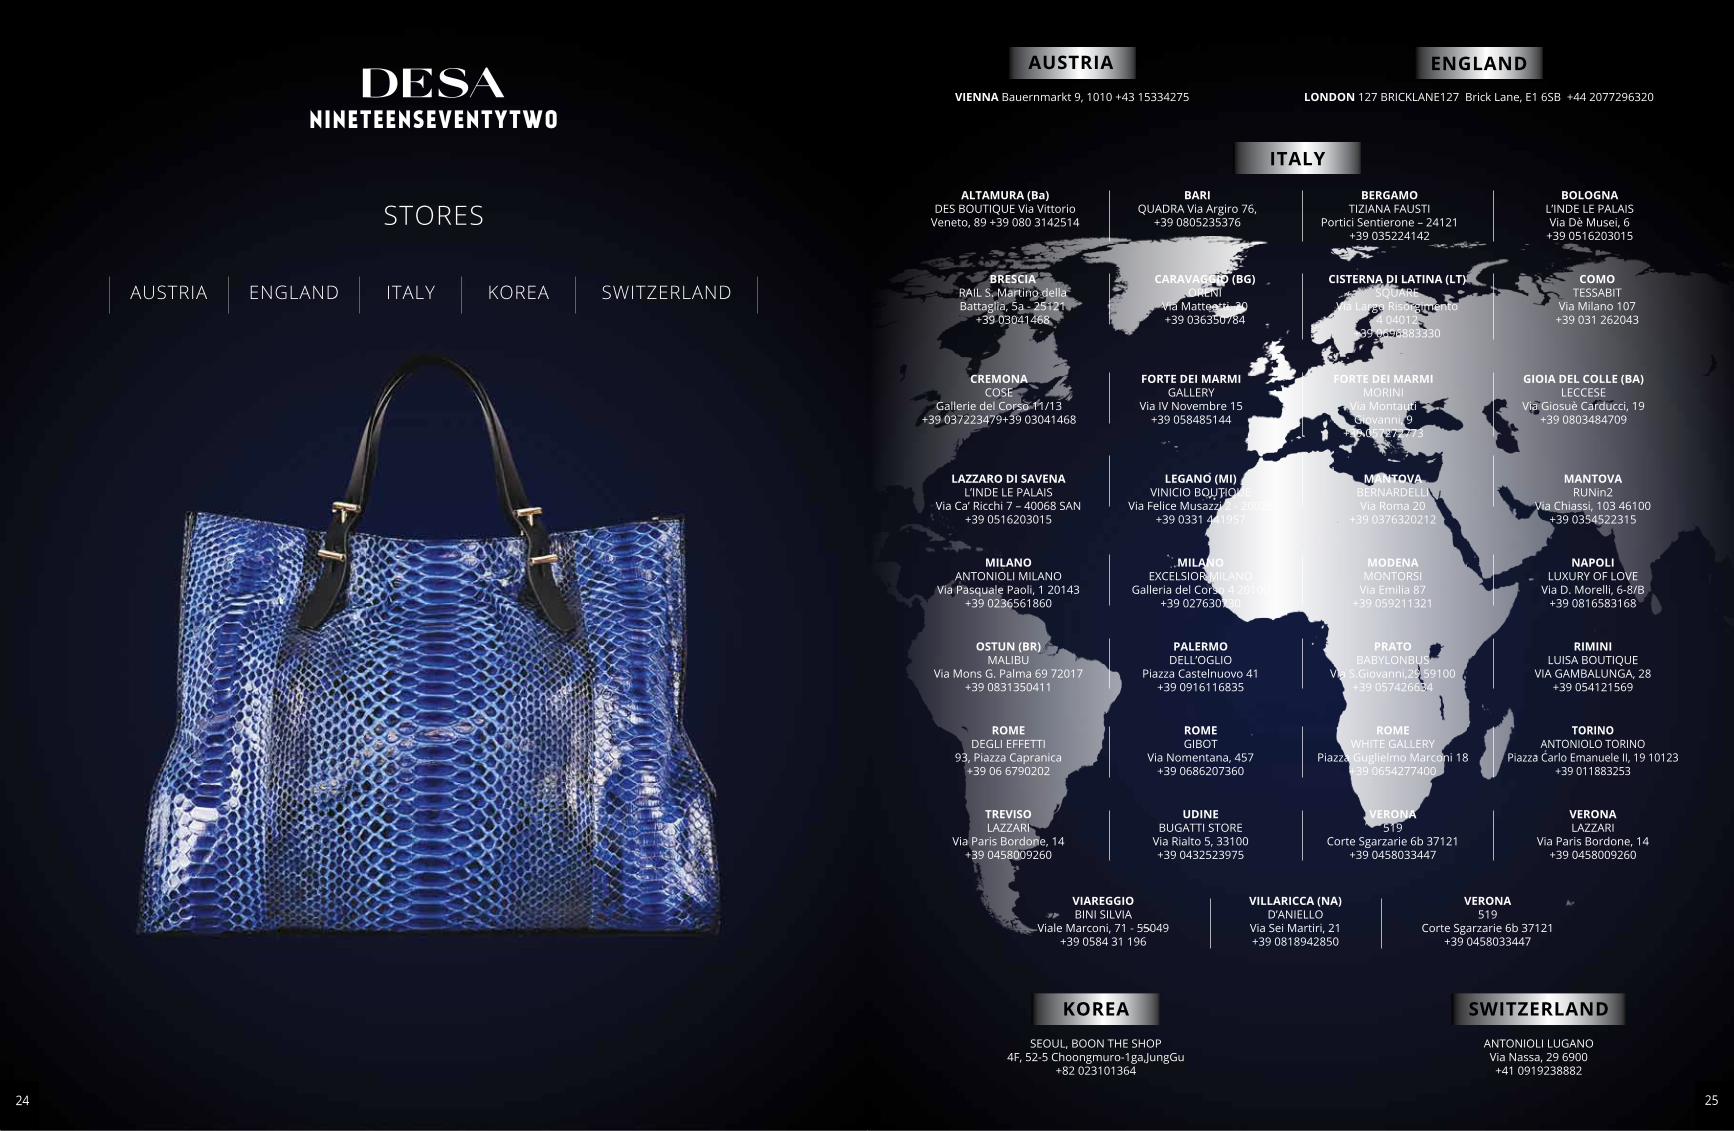
VIENNA Bauernmarkt 9, 1010 +43 15334275
SEOUL, BOON THE SHOP4F, 52-5 Choongmuro-1ga,JungGu
+82 023101364
ANTONIOLI LUGANO Via Nassa, 29 6900+41 0919238882
LONDON 127 BRICKLANE127 Brick Lane, E1 6SB +44 2077296320
AUSTRIA
KOREA SWITZERLAND
ENGLAND
ITALY
ALTAMURA (Ba)DES BOUTIQUE Via Vittorio
Veneto, 89 +39 080 3142514
BERGAMOTIZIANA FAUSTI
Portici Sentierone – 24121+39 035224142
BOLOGNA L’INDE LE PALAISVia Dè Musei, 6
+39 0516203015
BARI QUADRA Via Argiro 76,
+39 0805235376
BRESCIARAIL S. Martino della Battaglia, 5a - 25121
+39 03041468
CISTERNA DI LATINA (LT)SQUARE
Via Largo Risorgimento 4 04012
+39 0696883330
COMO TESSABIT
Via Milano 107+39 031 262043
CARAVAGGIO (BG) ORENI
Via Matteotti, 20+39 036350784
CREMONACOSE
Gallerie del Corso 11/13+39 037223479+39 03041468
FORTE DEI MARMIMORINI
Via Montauti Giovanni, 9
+39 057272773
GIOIA DEL COLLE (BA)LECCESE
Via Giosuè Carducci, 19+39 0803484709
FORTE DEI MARMIGALLERY
Via IV Novembre 15+39 058485144
LAZZARO DI SAVENA L’INDE LE PALAIS
Via Ca’ Ricchi 7 – 40068 SAN+39 0516203015
MANTOVABERNARDELLIVia Roma 20
+39 0376320212
MANTOVARUNin2
Via Chiassi, 103 46100+39 0354522315
LEGANO (MI)VINICIO BOUTIQUE
Via Felice Musazzi 2 - 20025+39 0331 441957
MILANOANTONIOLI MILANO
Via Pasquale Paoli, 1 20143+39 0236561860
MODENAMONTORSI
Via Emilia 87+39 059211321
NAPOLILUXURY OF LOVE
Via D. Morelli, 6-8/B+39 0816583168
MILANOEXCELSIOR MILANO
Galleria del Corso 4 20100+39 027630730
OSTUN (BR)MALIBU
Via Mons G. Palma 69 72017+39 0831350411
PRATOBABYLONBUS
Via S.Giovanni,29 59100+39 057426634
RIMINILUISA BOUTIQUE
VIA GAMBALUNGA, 28+39 054121569
PALERMODELL’OGLIO
Piazza Castelnuovo 41+39 0916116835
ROMEDEGLI EFFETTI
93, Piazza Capranica+39 06 6790202
ROMEWHITE GALLERY
Piazza Guglielmo Marconi 18+39 0654277400
TORINOANTONIOLO TORINO
Piazza Carlo Emanuele II, 19 10123+39 011883253
ROMEGIBOT
Via Nomentana, 457+39 0686207360
TREVISOLAZZARI
Via Paris Bordone, 14+39 0458009260
VERONA519
Corte Sgarzarie 6b 37121+39 0458033447
VERONALAZZARI
Via Paris Bordone, 14+39 0458009260
UDINEBUGATTI STORE
Via Rialto 5, 33100+39 0432523975
VIAREGGIOBINI SILVIA
Viale Marconi, 71 - 55049+39 0584 31 196
VERONA519
Corte Sgarzarie 6b 37121+39 0458033447
VILLARICCA (NA)D’ANIELLO
Via Sei Martiri, 21+39 0818942850
NINETEENSEVENTYTWO
STORES
AUSTRIA ENGLAND ITALY KOREA SWITZERLAND
24 25
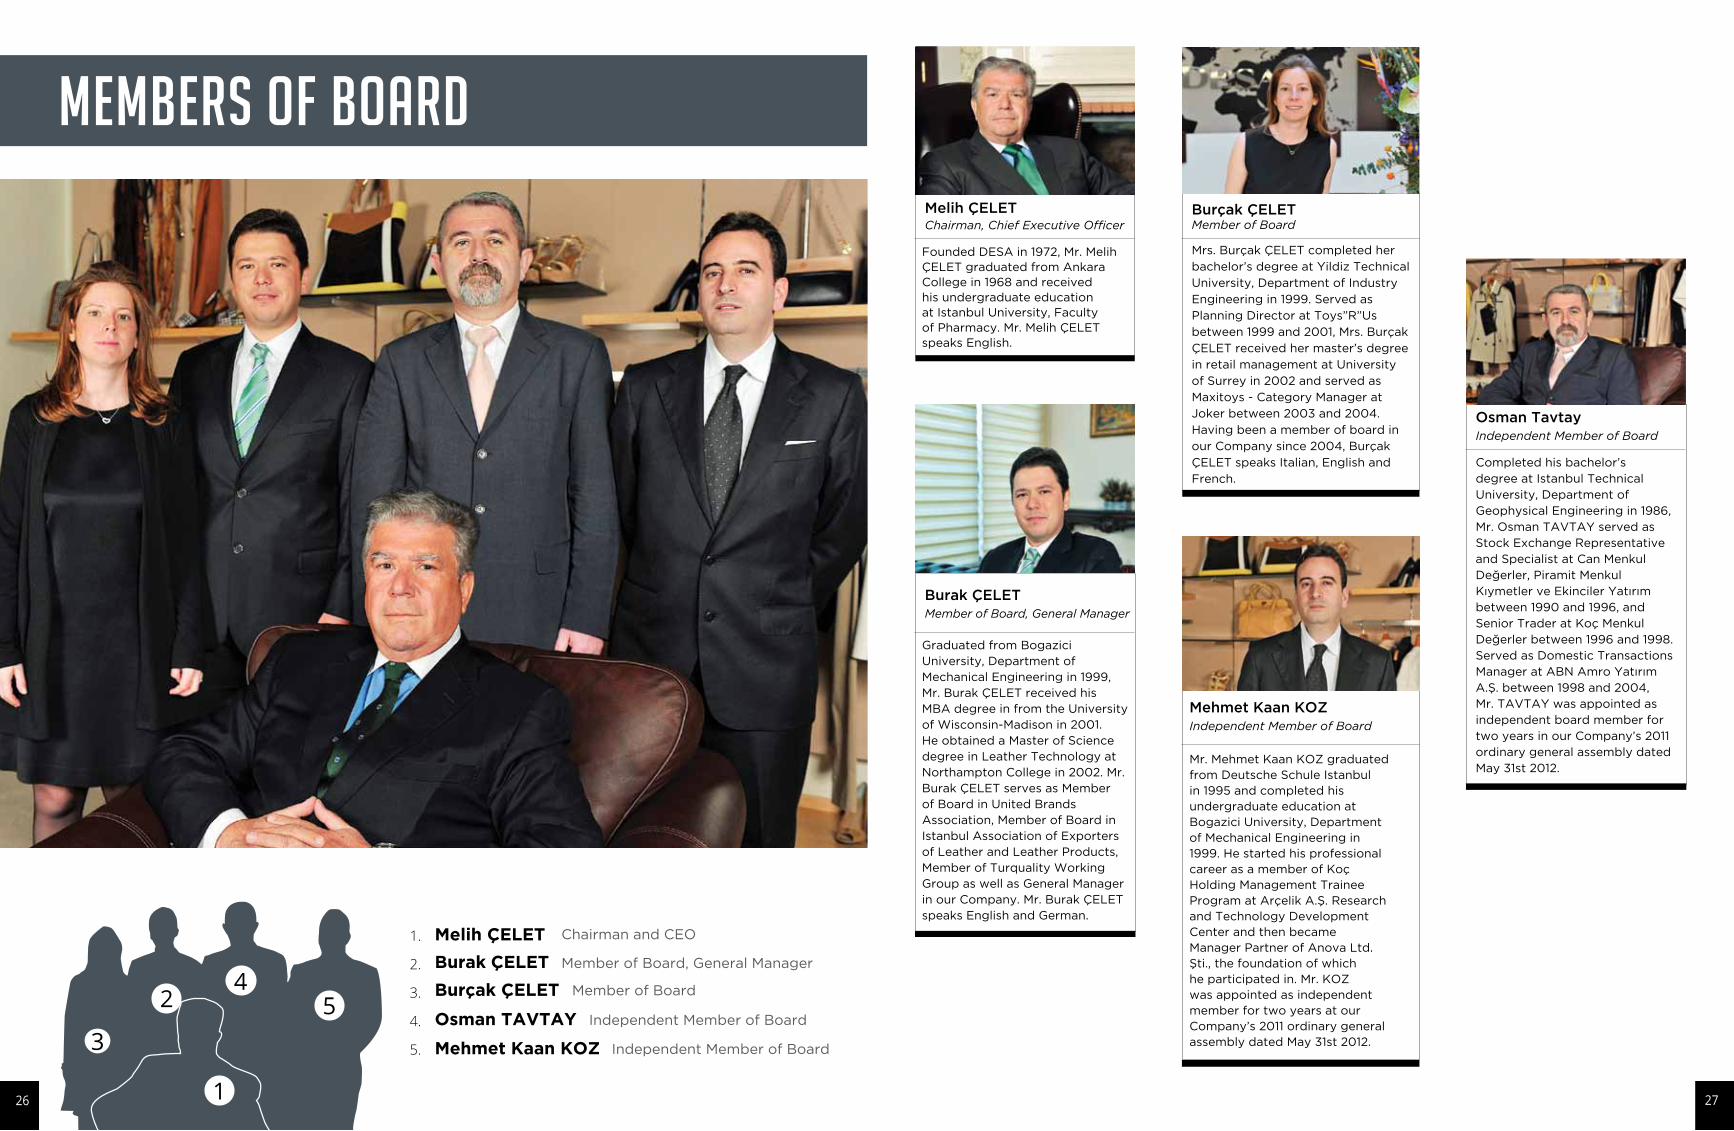
Mr. Mehmet Kaan KOZ graduated from Deutsche Schule Istanbul in 1995 and completed his undergraduate education at Bogazici University, Department of Mechanical Engineering in 1999. He started his professional career as a member of Koç Holding Management Trainee Program at Arçelik A.Ş. Research and Technology Development Center and then became Manager Partner of Anova Ltd. Şti., the foundation of which he participated in. Mr. KOZ was appointed as independent member for two years at our Company’s 2011 ordinary general assembly dated May 31st 2012.
Independent Member of Board
Mehmet Kaan KOZ
Graduated from Bogazici University, Department of Mechanical Engineering in 1999, Mr. Burak ÇELET received his MBA degree in from the University of Wisconsin-Madison in 2001. He obtained a Master of Science degree in Leather Technology at Northampton College in 2002. Mr. Burak ÇELET serves as Member of Board in United Brands Association, Member of Board in Istanbul Association of Exporters of Leather and Leather Products, Member of Turquality Working Group as well as General Manager in our Company. Mr. Burak ÇELET speaks English and German.
Member of Board, General Manager
Burak ÇELET
Founded DESA in 1972, Mr. Melih ÇELET graduated from Ankara College in 1968 and received his undergraduate education at Istanbul University, Faculty of Pharmacy. Mr. Melih ÇELET speaks English.
Chairman, Chief Executive OfficerMelih ÇELET
Member of BoardBurçak ÇELET
Mrs. Burçak ÇELET completed her
bachelor’s degree at Yildiz Technical
University, Department of Industry
Engineering in 1999. Served as
Planning Director at Toys”R”Us
between 1999 and 2001, Mrs. Burçak
ÇELET received her master’s degree
in retail management at University
of Surrey in 2002 and served as
Maxitoys - Category Manager at
Joker between 2003 and 2004.
Having been a member of board in
our Company since 2004, Burçak
ÇELET speaks Italian, English and
French.
Independent Member of Board
Osman Tavtay
Completed his bachelor’s degree at Istanbul Technical University, Department of Geophysical Engineering in 1986, Mr. Osman TAVTAY served as Stock Exchange Representative and Specialist at Can Menkul Değerler, Piramit Menkul Kıymetler ve Ekinciler Yatırım between 1990 and 1996, and Senior Trader at Koç Menkul Değerler between 1996 and 1998. Served as Domestic Transactions Manager at ABN Amro Yatırım A.Ş. between 1998 and 2004, Mr. TAVTAY was appointed as independent board member for two years in our Company’s 2011 ordinary general assembly dated May 31st 2012.
1
2
3
45
MEMBERS OF BOARD
Independent Member of Board
1.
2.
3.
4.
5. Independent Member of Board
Chairman and CEO
Member of Board, General Manager
Member of Board
Osman TAVTAY
Mehmet Kaan KOZ
Melih ÇELET
Burak ÇELET
Burçak ÇELET
26 27
MANAGEMENT TEAM
Completed his undergraduate education at Mugla University, School of Business Administration, Mr. Ayhan DİRİBAŞ
received his master’s degree in business administration at Lasalle University and Marmara University in 2003. Begun his
career at Doğuş Holding in Finance Department in 1992, Mr. DİRİBAŞ served as Internal Auditor at Oger Holding between
1996 and 1998, as Deputy General Managery at Reysaş Holding A.Ş. between 1999 and 2004, as Accounting and Finance
Director for Retail Group at Unitim Holding A.Ş. between 2005 and 2010. Mr. DİRİBAŞ was appointed as Executive Vice
President of Financial Affairs in our Company in January 2013.
Executive Vice President of Financial Affairs
Ayhan DİRİBAŞ
Received his undergraduate education at St. Mary’s University of Texas in 1978, Mr. Alpaslan KARAYALÇIN received his
master’s degree in Operational Researching at Lancaster University and Bogazici University in 1981. After conducting
many infrastructure projects for İSKİ and Istanbul Metropolitan Municipality between 1982 and 1987 at Karayalçın İnş.
Taahhüt Ltd. which he owned, Mr. Karayalçın served as Brand Manager at MUDO A.Ş. between 1987 and 1989; Deputy
General Manager at Sanko A.Ş. between 1989 and 1991; Deputy General Manager at Vepa A.Ş. between 1991 and 2000;
Clothing and Accessories Sales Director at Nike BV between 2000 and 2001; Marketing and Sales Director at Esemspor
A.Ş. between 2001 and 2003; Managing Director at Alan Alternatif Sporlar A.Ş.between 2003 and 2005; and Deputy
General Manager and Deputy Head of Operations at Intersport between 2006 and 2007. Mr. KARAYALÇIN has been
serving as Executive Vice President of Marketing and Sales in our Company since 2010.
Alpaslan KARAYALÇINExecutive Vice President of Marketing and Sales
28 29
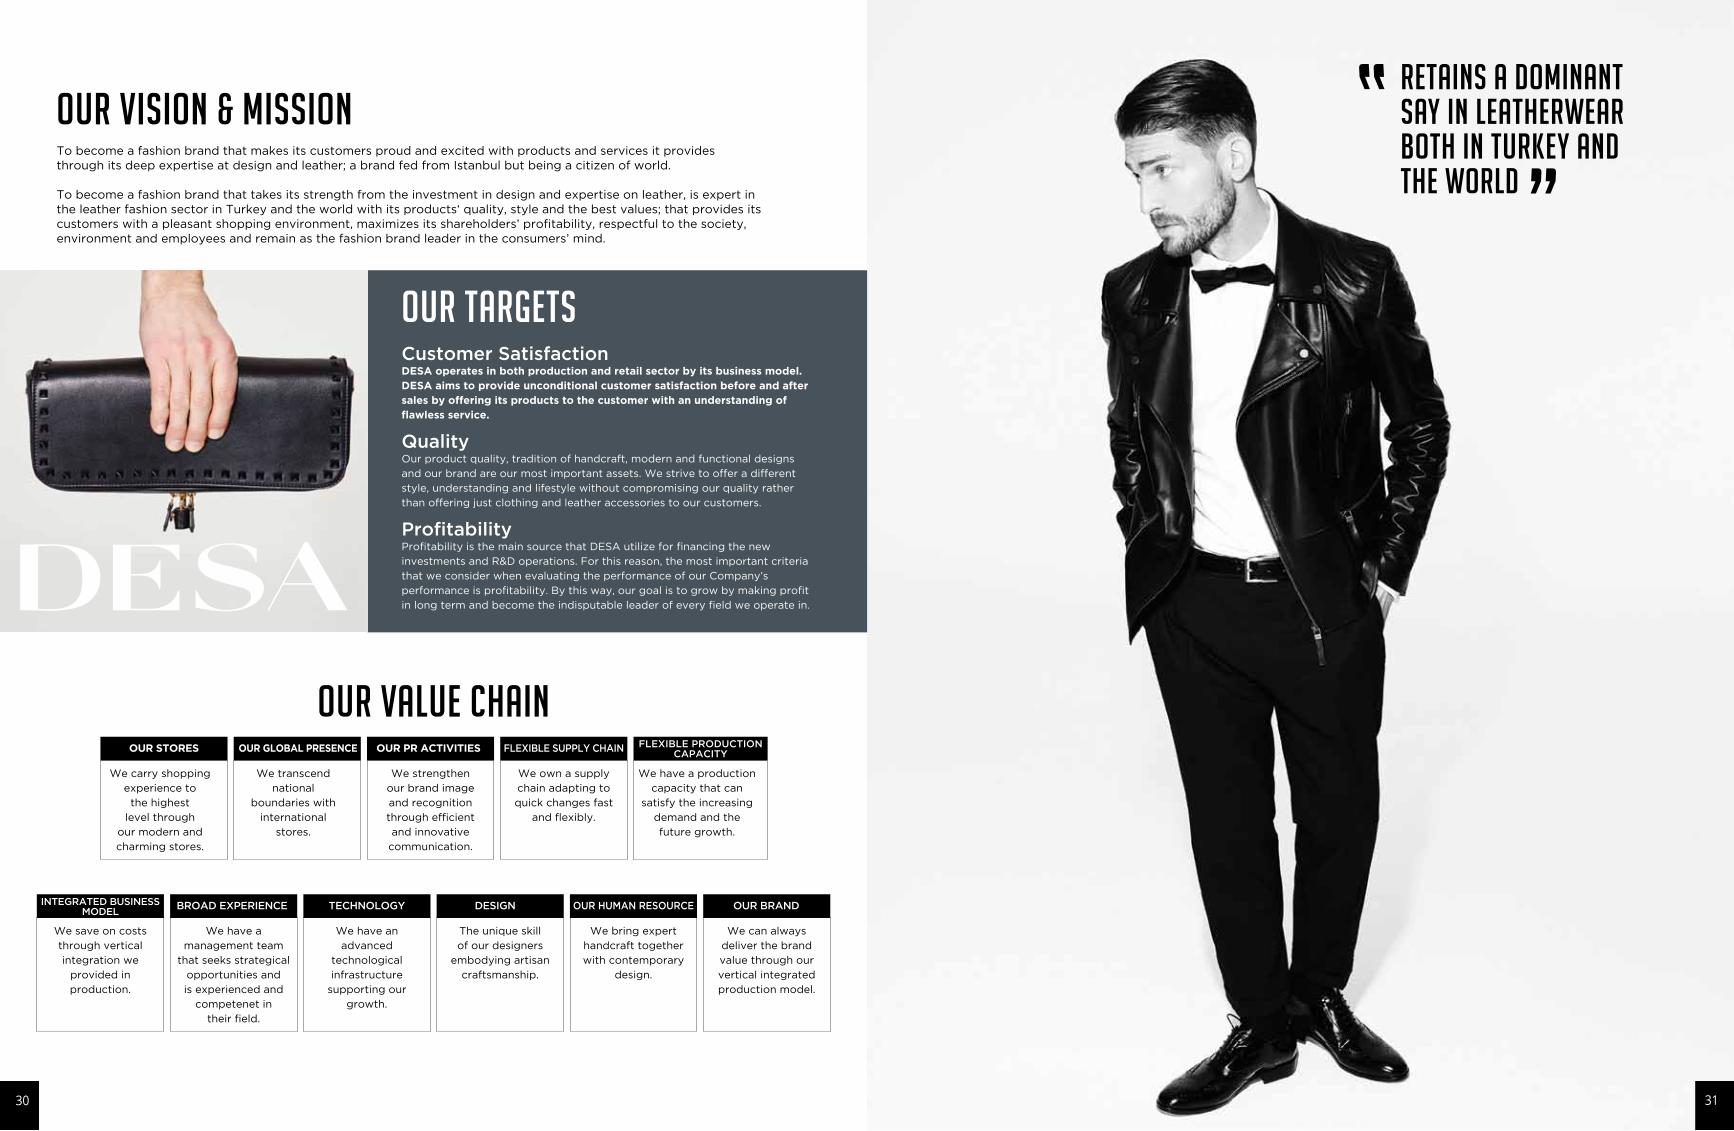
RETAINS A DOMINANT SAY IN LEATHERWEAR BOTH IN TURKEY AND THE WORLD
OUR VISION & MISSIONTo become a fashion brand that makes its customers proud and excited with products and services it provides through its deep expertise at design and leather; a brand fed from Istanbul but being a citizen of world.
To become a fashion brand that takes its strength from the investment in design and expertise on leather, is expert in the leather fashion sector in Turkey and the world with its products‘ quality, style and the best values; that provides its customers with a pleasant shopping environment, maximizes its shareholders’ profitability, respectful to the society, environment and employees and remain as the fashion brand leader in the consumers’ mind.
OUR TARGETSCustomer SatisfactionDESA operates in both production and retail sector by its business model. DESA aims to provide unconditional customer satisfaction before and after sales by offering its products to the customer with an understanding of flawless service.
QualityOur product quality, tradition of handcraft, modern and functional designs
and our brand are our most important assets. We strive to offer a different
style, understanding and lifestyle without compromising our quality rather
than offering just clothing and leather accessories to our customers.
ProfitabilityProfitability is the main source that DESA utilize for financing the new
investments and R&D operations. For this reason, the most important criteria
that we consider when evaluating the performance of our Company’s
performance is profitability. By this way, our goal is to grow by making profit
in long term and become the indisputable leader of every field we operate in.
OUR VALUE CHAINWe own a supply
chain adapting to
quick changes fast
and flexibly.
FLEXIBLE SUPPLY CHAIN
We carry shopping
experience to
the highest
level through
our modern and
charming stores.
OUR STORES
We transcend
national
boundaries with
international
stores.
OUR GLOBAL PRESENCE
We strengthen
our brand image
and recognition
through efficient
and innovative
communication.
OUR PR ACTIVITIES
We have a production
capacity that can
satisfy the increasing
demand and the
future growth.
FLEXIBLE PRODUCTION CAPACITY
We save on costs
through vertical
integration we
provided in
production.
INTEGRATED BUSINESS MODEL
We have a
management team
that seeks strategical
opportunities and
is experienced and
competenet in
their field.
BROAD EXPERIENCE
We have an
advanced
technological
infrastructure
supporting our
growth.
TECHNOLOGY
The unique skill
of our designers
embodying artisan
craftsmanship.
DESIGN
We bring expert
handcraft together
with contemporary
design.
OUR HUMAN RESOURCE
We can always
deliver the brand
value through our
vertical integrated
production model.
OUR BRAND
30 31
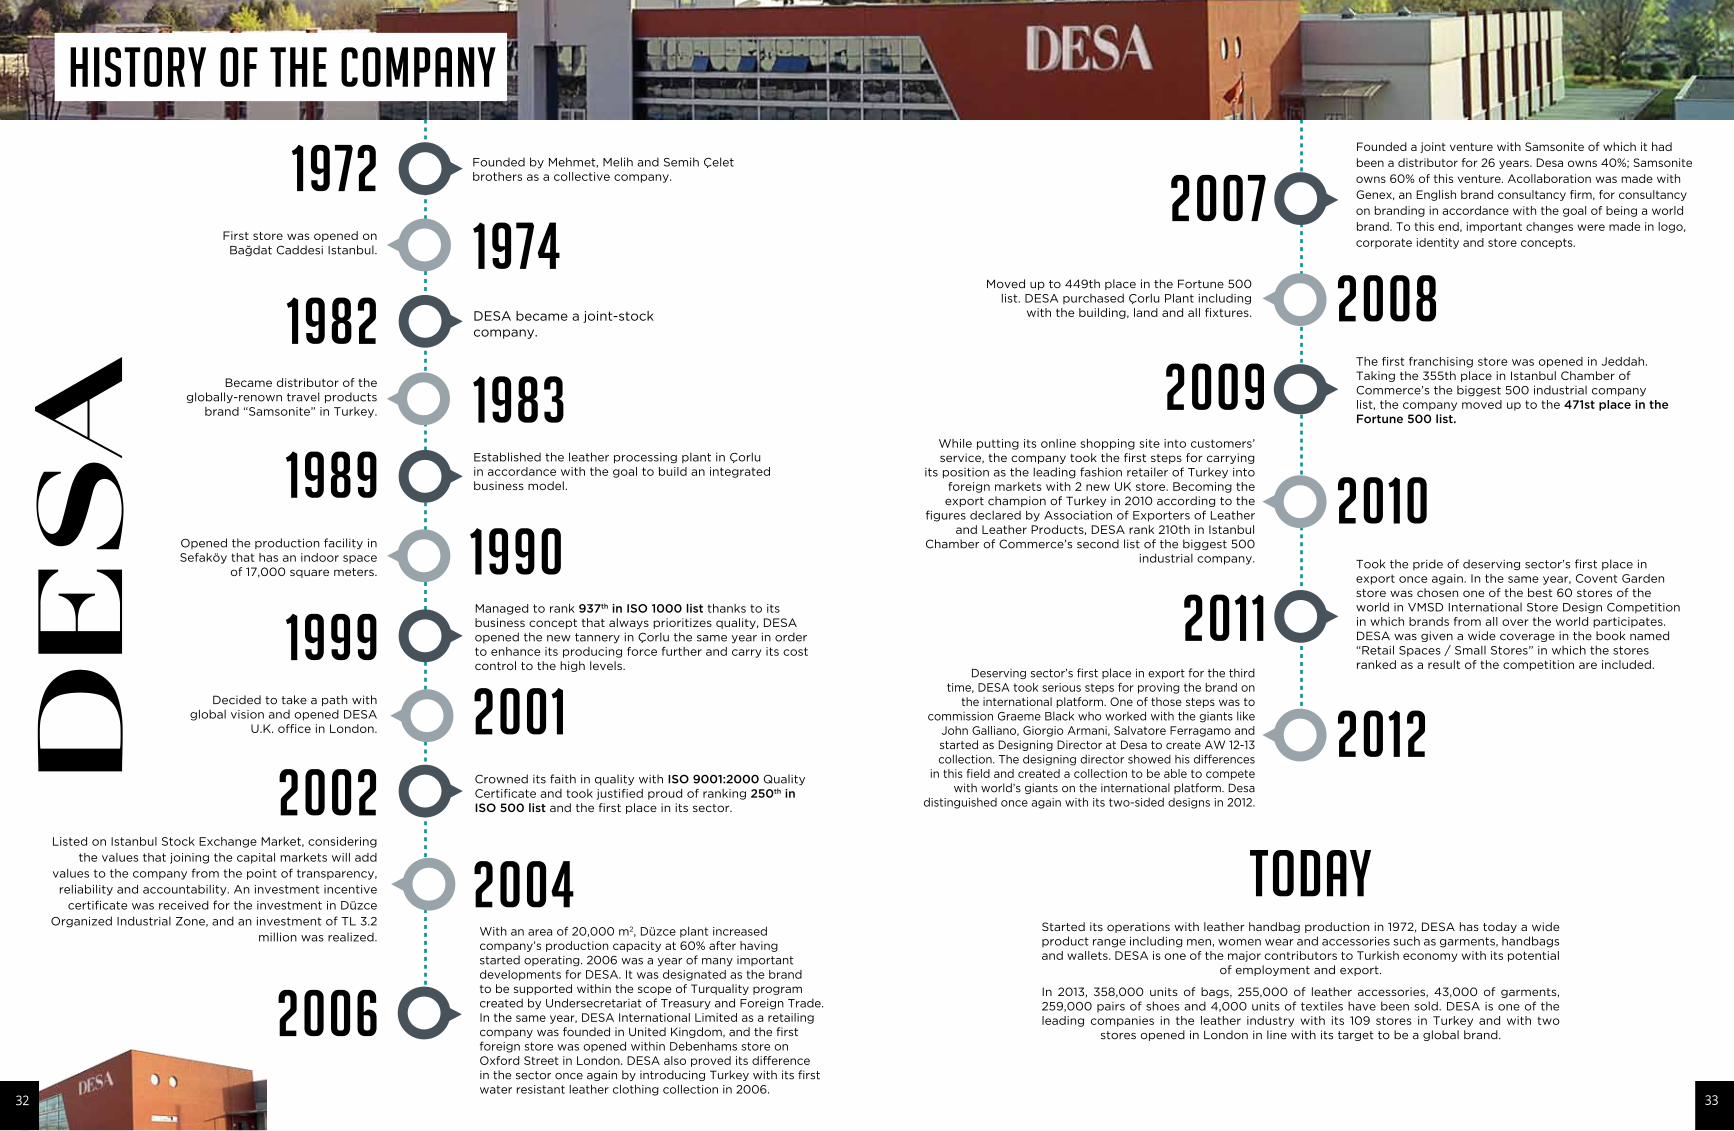
TODAYStarted its operations with leather handbag production in 1972, DESA has today a wide product range including men, women wear and accessories such as garments, handbags and wallets. DESA is one of the major contributors to Turkish economy with its potential
of employment and export.
In 2013, 358,000 units of bags, 255,000 of leather accessories, 43,000 of garments, 259,000 pairs of shoes and 4,000 units of textiles have been sold. DESA is one of the leading companies in the leather industry with its 109 stores in Turkey and with two
stores opened in London in line with its target to be a global brand.
2007Founded a joint venture with Samsonite of which it had been a distributor for 26 years. Desa owns 40%; Samsonite owns 60% of this venture. Acollaboration was made with Genex, an English brand consultancy firm, for consultancy on branding in accordance with the goal of being a world brand. To this end, important changes were made in logo, corporate identity and store concepts.
2009The first franchising store was opened in Jeddah. Taking the 355th place in Istanbul Chamber of Commerce’s the biggest 500 industrial company list, the company moved up to the 471st place in the Fortune 500 list.
2011Took the pride of deserving sector’s first place in export once again. In the same year, Covent Garden store was chosen one of the best 60 stores of the world in VMSD International Store Design Competition in which brands from all over the world participates. DESA was given a wide coverage in the book named “Retail Spaces / Small Stores” in which the stores ranked as a result of the competition are included.
2008Moved up to 449th place in the Fortune 500 list. DESA purchased Çorlu Plant including
with the building, land and all fixtures.
2010While putting its online shopping site into customers’ service, the company took the first steps for carrying
its position as the leading fashion retailer of Turkey into foreign markets with 2 new UK store. Becoming the export champion of Turkey in 2010 according to the
figures declared by Association of Exporters of Leather and Leather Products, DESA rank 210th in Istanbul
Chamber of Commerce’s second list of the biggest 500 industrial company.
2012Deserving sector’s first place in export for the third
time, DESA took serious steps for proving the brand on the international platform. One of those steps was to
commission Graeme Black who worked with the giants like John Galliano, Giorgio Armani, Salvatore Ferragamo and started as Designing Director at Desa to create AW 12-13 collection. The designing director showed his differences
in this field and created a collection to be able to compete with world’s giants on the international platform. Desa
distinguished once again with its two-sided designs in 2012.
1972 Founded by Mehmet, Melih and Semih Çelet brothers as a collective company.
1982 DESA became a joint-stock company.
1989Established the leather processing plant in Çorlu in accordance with the goal to build an integrated business model.
1999Managed to rank 937th in ISO 1000 list thanks to its business concept that always prioritizes quality, DESA opened the new tannery in Çorlu the same year in order to enhance its producing force further and carry its cost control to the high levels.
2002 Crowned its faith in quality with ISO 9001:2000 Quality Certificate and took justified proud of ranking 250th in ISO 500 list and the first place in its sector.
1974First store was opened on Bağdat Caddesi Istanbul.
2006
With an area of 20,000 m2, Düzce plant increased company’s production capacity at 60% after having started operating. 2006 was a year of many important developments for DESA. It was designated as the brand to be supported within the scope of Turquality program created by Undersecretariat of Treasury and Foreign Trade. In the same year, DESA International Limited as a retailing company was founded in United Kingdom, and the first foreign store was opened within Debenhams store on Oxford Street in London. DESA also proved its difference in the sector once again by introducing Turkey with its first water resistant leather clothing collection in 2006.
Listed on Istanbul Stock Exchange Market, considering the values that joining the capital markets will add
values to the company from the point of transparency, reliability and accountability. An investment incentive
certificate was received for the investment in Düzce Organized Industrial Zone, and an investment of TL 3.2
million was realized.
2004
1983Became distributor of the globally-renown travel products
brand “Samsonite” in Turkey.
1990Opened the production facility in Sefaköy that has an indoor space
of 17,000 square meters.
2001Decided to take a path with global vision and opened DESA
U.K. office in London.
HISTORY OF THE COMPANY
32 33

DESA’YI FARKLI KILANENTEGRE İŞ MODELİTHE INTEGRATED BUSINESS MODEL
DISTINGUISHING DESA The element that makes DESA different from its peers is that DESA controls
all stages of the service process it provides through the company’s tanneries,
production skill of leather garments, bags and accessories and retail stores
under control.
Leading its sector in export and retail fields, DESA makes important
investments in R&D, human resources and education fields to increase
customer satisfaction through products of good quality and flawless service
appropriate for today’s trends.
Weekly Capacity
28,850* Kg Cattle raw leather
processing
RAW MATERIAL PRODUCTION
Leather production
in the Çorlu tannery
20,000 m2
indoor
production area
170,200 Kg Small cattle raw
leather processing
Suede, Napa, Fur, Calf leather processing
PRODUCTION
Production of leather garments, handbags and
accessories
Internationaldesign team
Düzce facility
10,000 m2 indoor production area
Weekly Capacity
14,000 pieces of handbags
Istanbul facility
17,000 m2 indoor production area
Weekly Capacity
2,000
pieces of leather garment
1,000
pieces of textile
6,000
pieces of handbags
75
Desa Mono Brand Stores
18
Desa Samsonite
5 Desa Franchises
1
Online Store
Desa.com.tr
2 International Stores
(UK)
10
Samsonite Stores
40%
DESA
60%Samsonite partnership (JV)
18,598 m2
Store Area
RETAIL STORES
34 35
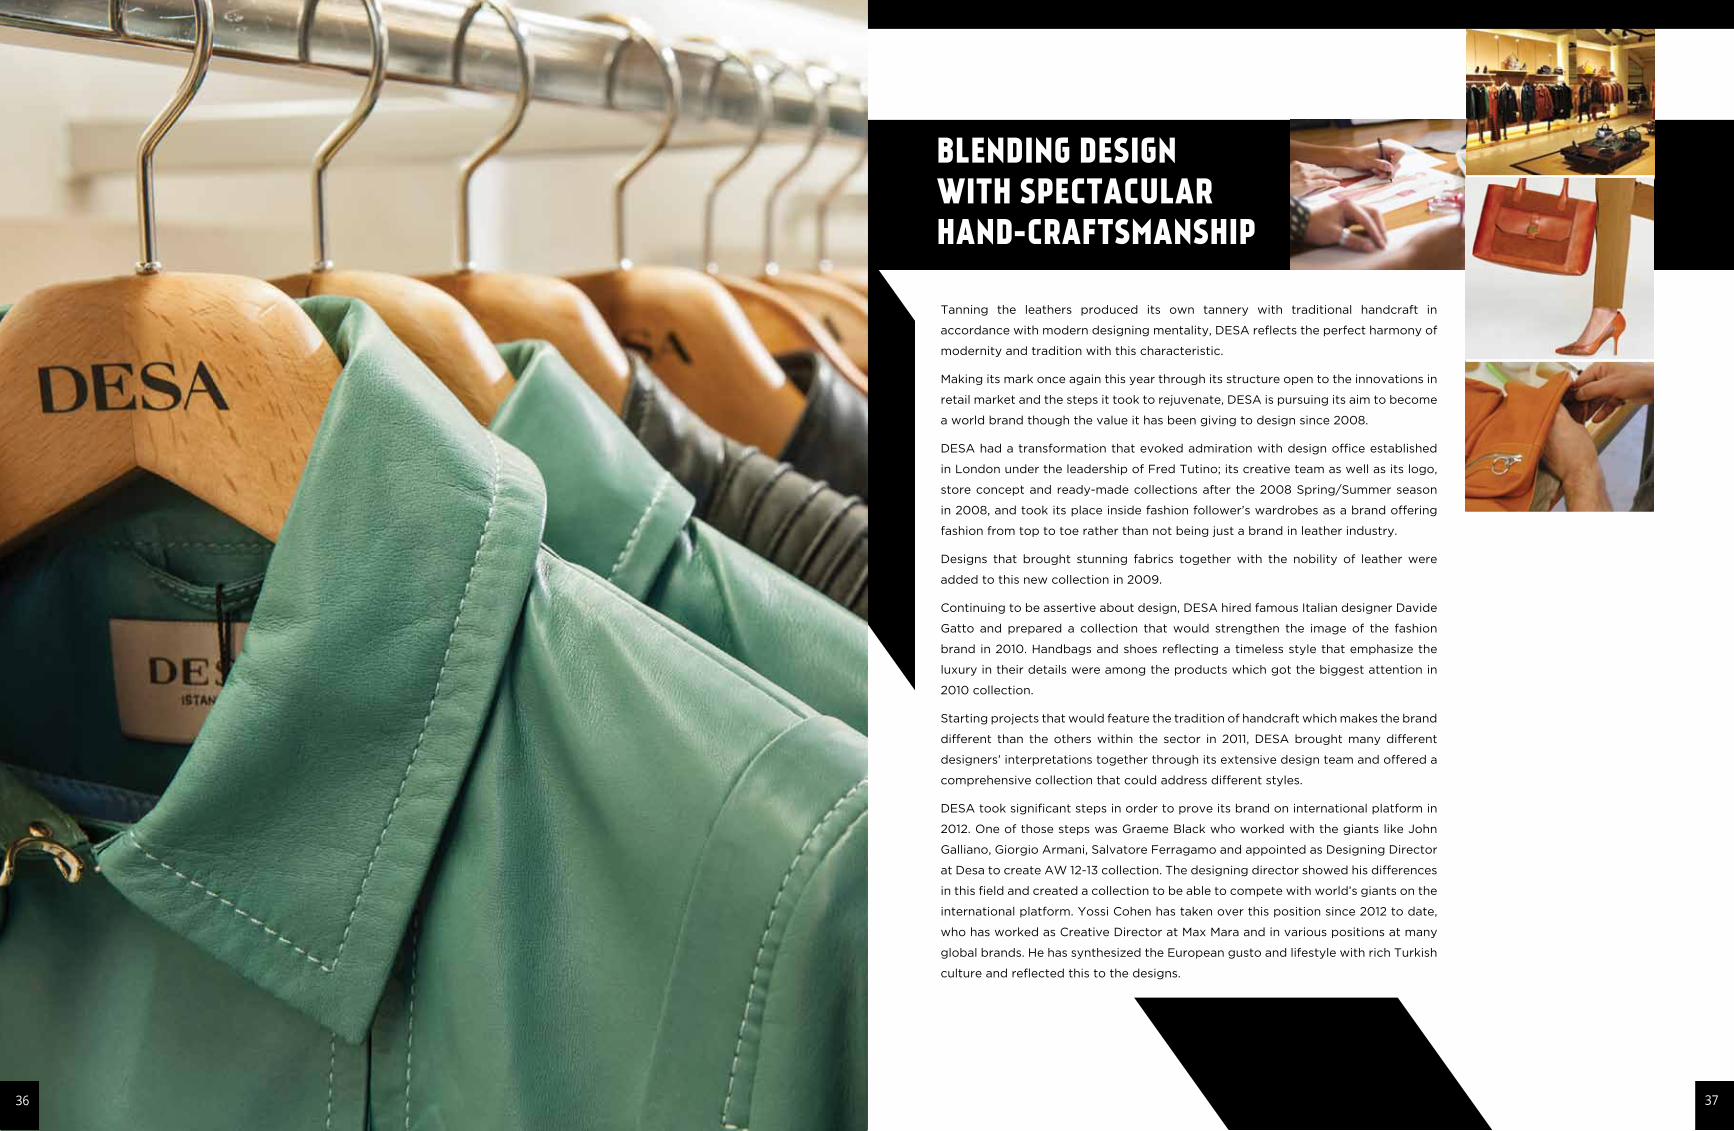
BLENDING DESIGN WITH SPECTACULAR HAND-CRAFTSMANSHIP
Tanning the leathers produced its own tannery with traditional handcraft in
accordance with modern designing mentality, DESA reflects the perfect harmony of
modernity and tradition with this characteristic.
Making its mark once again this year through its structure open to the innovations in
retail market and the steps it took to rejuvenate, DESA is pursuing its aim to become
a world brand though the value it has been giving to design since 2008.
DESA had a transformation that evoked admiration with design office established
in London under the leadership of Fred Tutino; its creative team as well as its logo,
store concept and ready-made collections after the 2008 Spring/Summer season
in 2008, and took its place inside fashion follower’s wardrobes as a brand offering
fashion from top to toe rather than not being just a brand in leather industry.
Designs that brought stunning fabrics together with the nobility of leather were
added to this new collection in 2009.
Continuing to be assertive about design, DESA hired famous Italian designer Davide
Gatto and prepared a collection that would strengthen the image of the fashion
brand in 2010. Handbags and shoes reflecting a timeless style that emphasize the
luxury in their details were among the products which got the biggest attention in
2010 collection.
Starting projects that would feature the tradition of handcraft which makes the brand
different than the others within the sector in 2011, DESA brought many different
designers’ interpretations together through its extensive design team and offered a
comprehensive collection that could address different styles.
DESA took significant steps in order to prove its brand on international platform in
2012. One of those steps was Graeme Black who worked with the giants like John
Galliano, Giorgio Armani, Salvatore Ferragamo and appointed as Designing Director
at Desa to create AW 12-13 collection. The designing director showed his differences
in this field and created a collection to be able to compete with world’s giants on the
international platform. Yossi Cohen has taken over this position since 2012 to date,
who has worked as Creative Director at Max Mara and in various positions at many
global brands. He has synthesized the European gusto and lifestyle with rich Turkish
culture and reflected this to the designs.
36 37
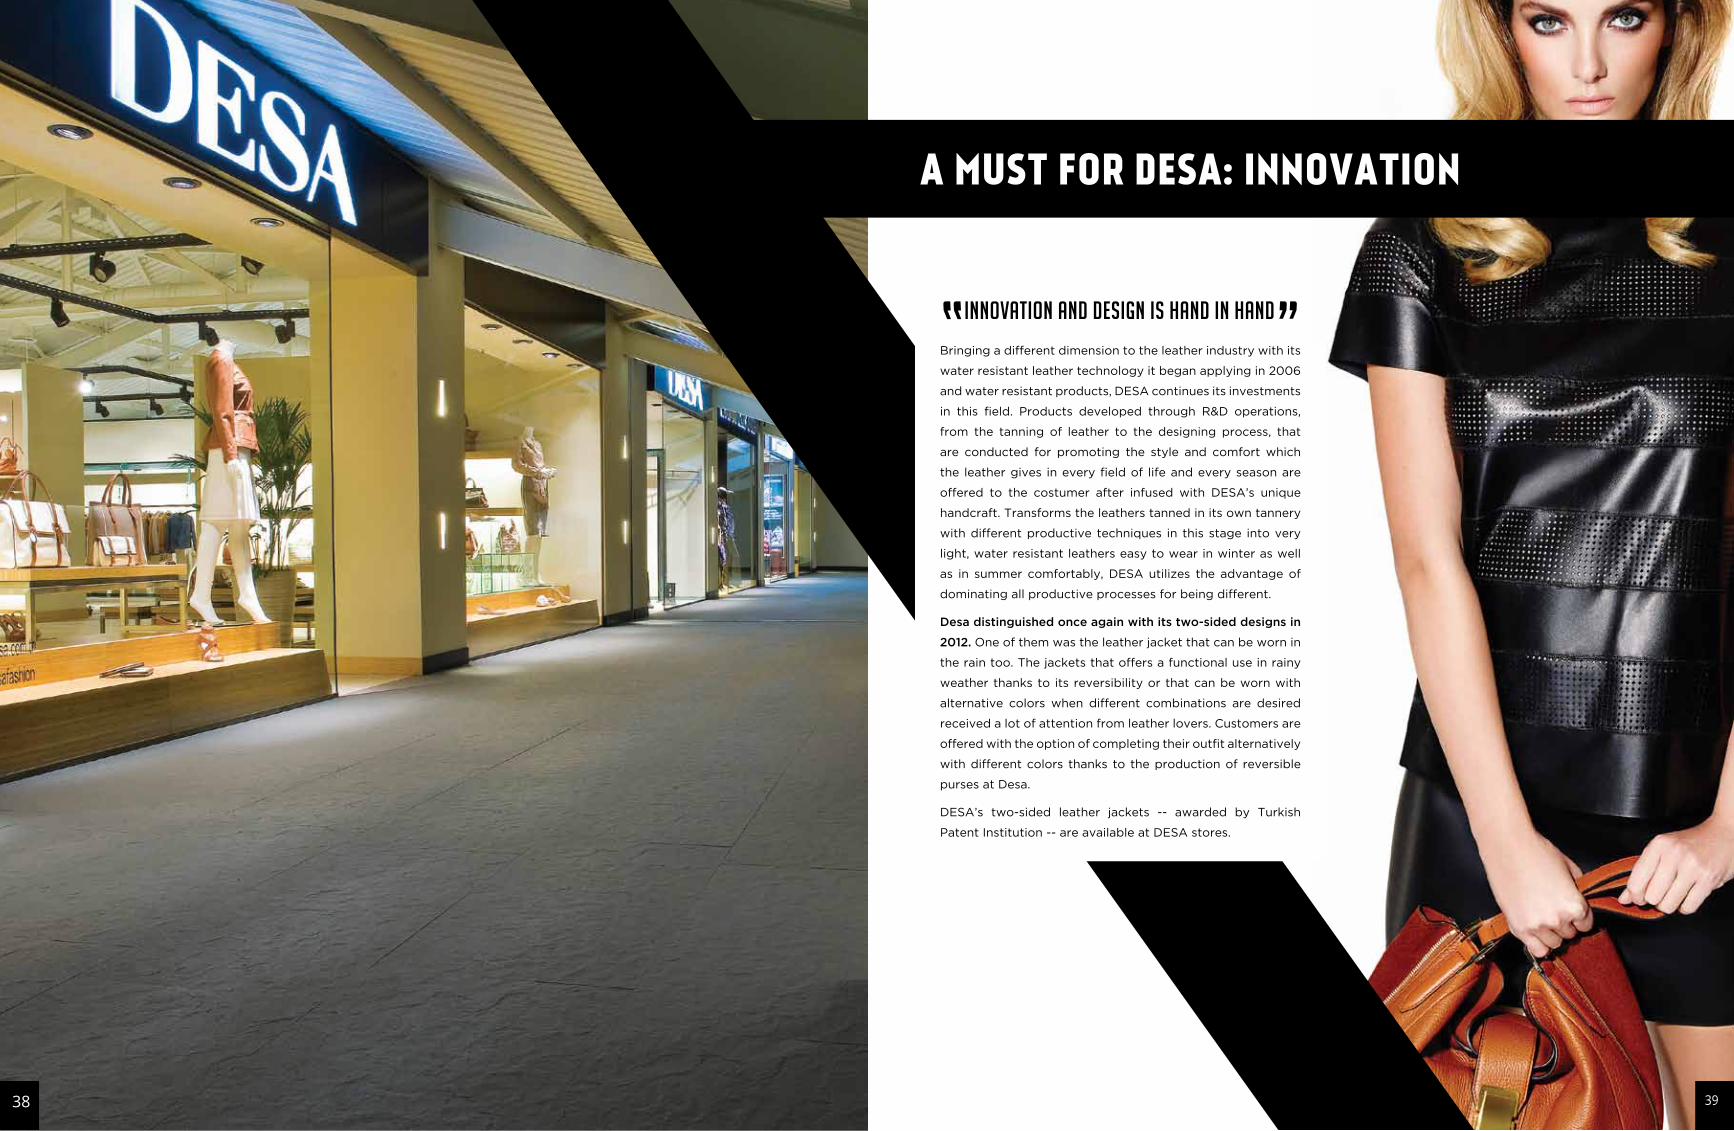
A MUST FOR DESA: INNOVATION
INNOVATION AND DESIGN IS HAND IN HAND
Bringing a different dimension to the leather industry with its
water resistant leather technology it began applying in 2006
and water resistant products, DESA continues its investments
in this field. Products developed through R&D operations,
from the tanning of leather to the designing process, that
are conducted for promoting the style and comfort which
the leather gives in every field of life and every season are
offered to the costumer after infused with DESA’s unique
handcraft. Transforms the leathers tanned in its own tannery
with different productive techniques in this stage into very
light, water resistant leathers easy to wear in winter as well
as in summer comfortably, DESA utilizes the advantage of
dominating all productive processes for being different.
Desa distinguished once again with its two-sided designs in
2012. One of them was the leather jacket that can be worn in
the rain too. The jackets that offers a functional use in rainy
weather thanks to its reversibility or that can be worn with
alternative colors when different combinations are desired
received a lot of attention from leather lovers. Customers are
offered with the option of completing their outfit alternatively
with different colors thanks to the production of reversible
purses at Desa.
DESA’s two-sided leather jackets -- awarded by Turkish
Patent Institution -- are available at DESA stores.
3938
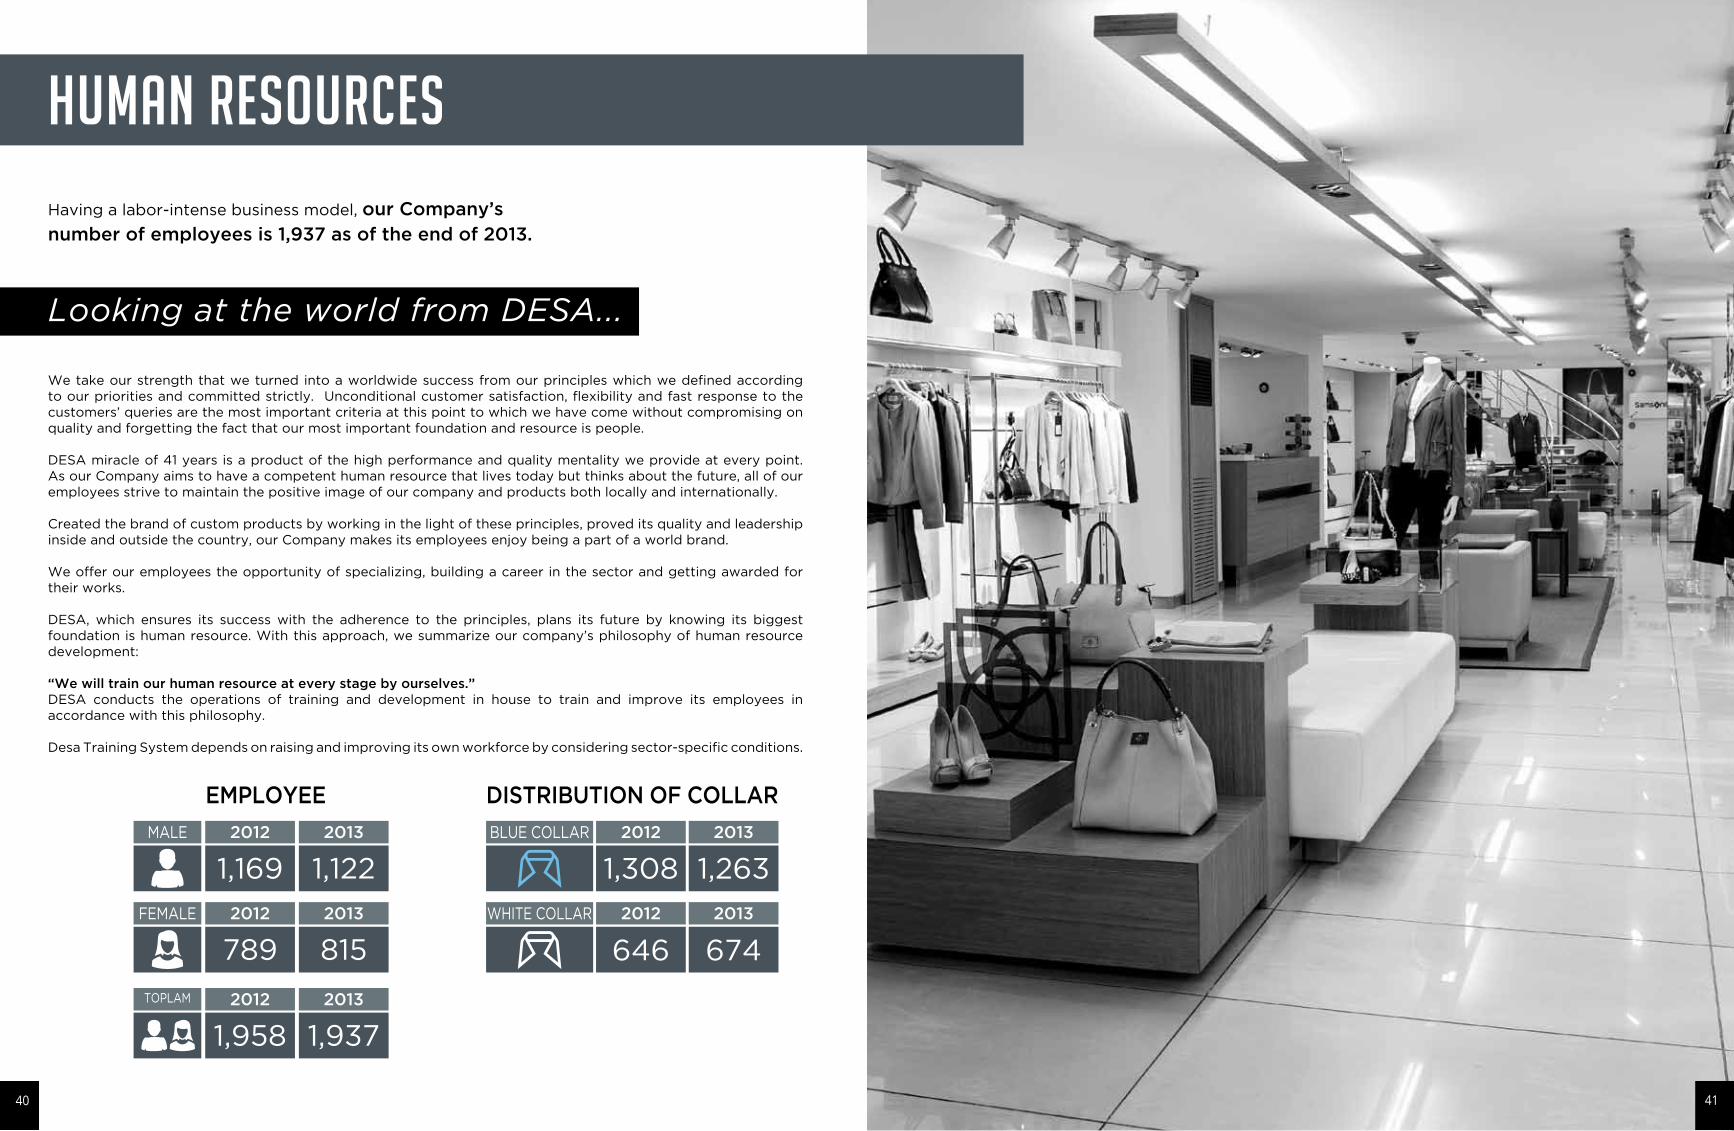
Having a labor-intense business model, our Company’s number of employees is 1,937 as of the end of 2013.
Looking at the world from DESA...
HUMAN RESOURCES
We take our strength that we turned into a worldwide success from our principles which we defined according to our priorities and committed strictly. Unconditional customer satisfaction, flexibility and fast response to the customers’ queries are the most important criteria at this point to which we have come without compromising on quality and forgetting the fact that our most important foundation and resource is people.
DESA miracle of 41 years is a product of the high performance and quality mentality we provide at every point. As our Company aims to have a competent human resource that lives today but thinks about the future, all of our employees strive to maintain the positive image of our company and products both locally and internationally.
Created the brand of custom products by working in the light of these principles, proved its quality and leadership inside and outside the country, our Company makes its employees enjoy being a part of a world brand.
We offer our employees the opportunity of specializing, building a career in the sector and getting awarded for their works.
DESA, which ensures its success with the adherence to the principles, plans its future by knowing its biggest foundation is human resource. With this approach, we summarize our company’s philosophy of human resource development:
“We will train our human resource at every stage by ourselves.”DESA conducts the operations of training and development in house to train and improve its employees in accordance with this philosophy.
Desa Training System depends on raising and improving its own workforce by considering sector-specific conditions.
EMPLOYEE
815
MALE
FEMALE
TOPLAM
2012
2012
2012
2013
2013
2013
1,169
789
1,958 1,937
1,122
DISTRIBUTION OF COLLAR
BLUE COLLAR 2012 2013
1,308 1,263
WHITE COLLAR 2012 2013
646 674
40 41
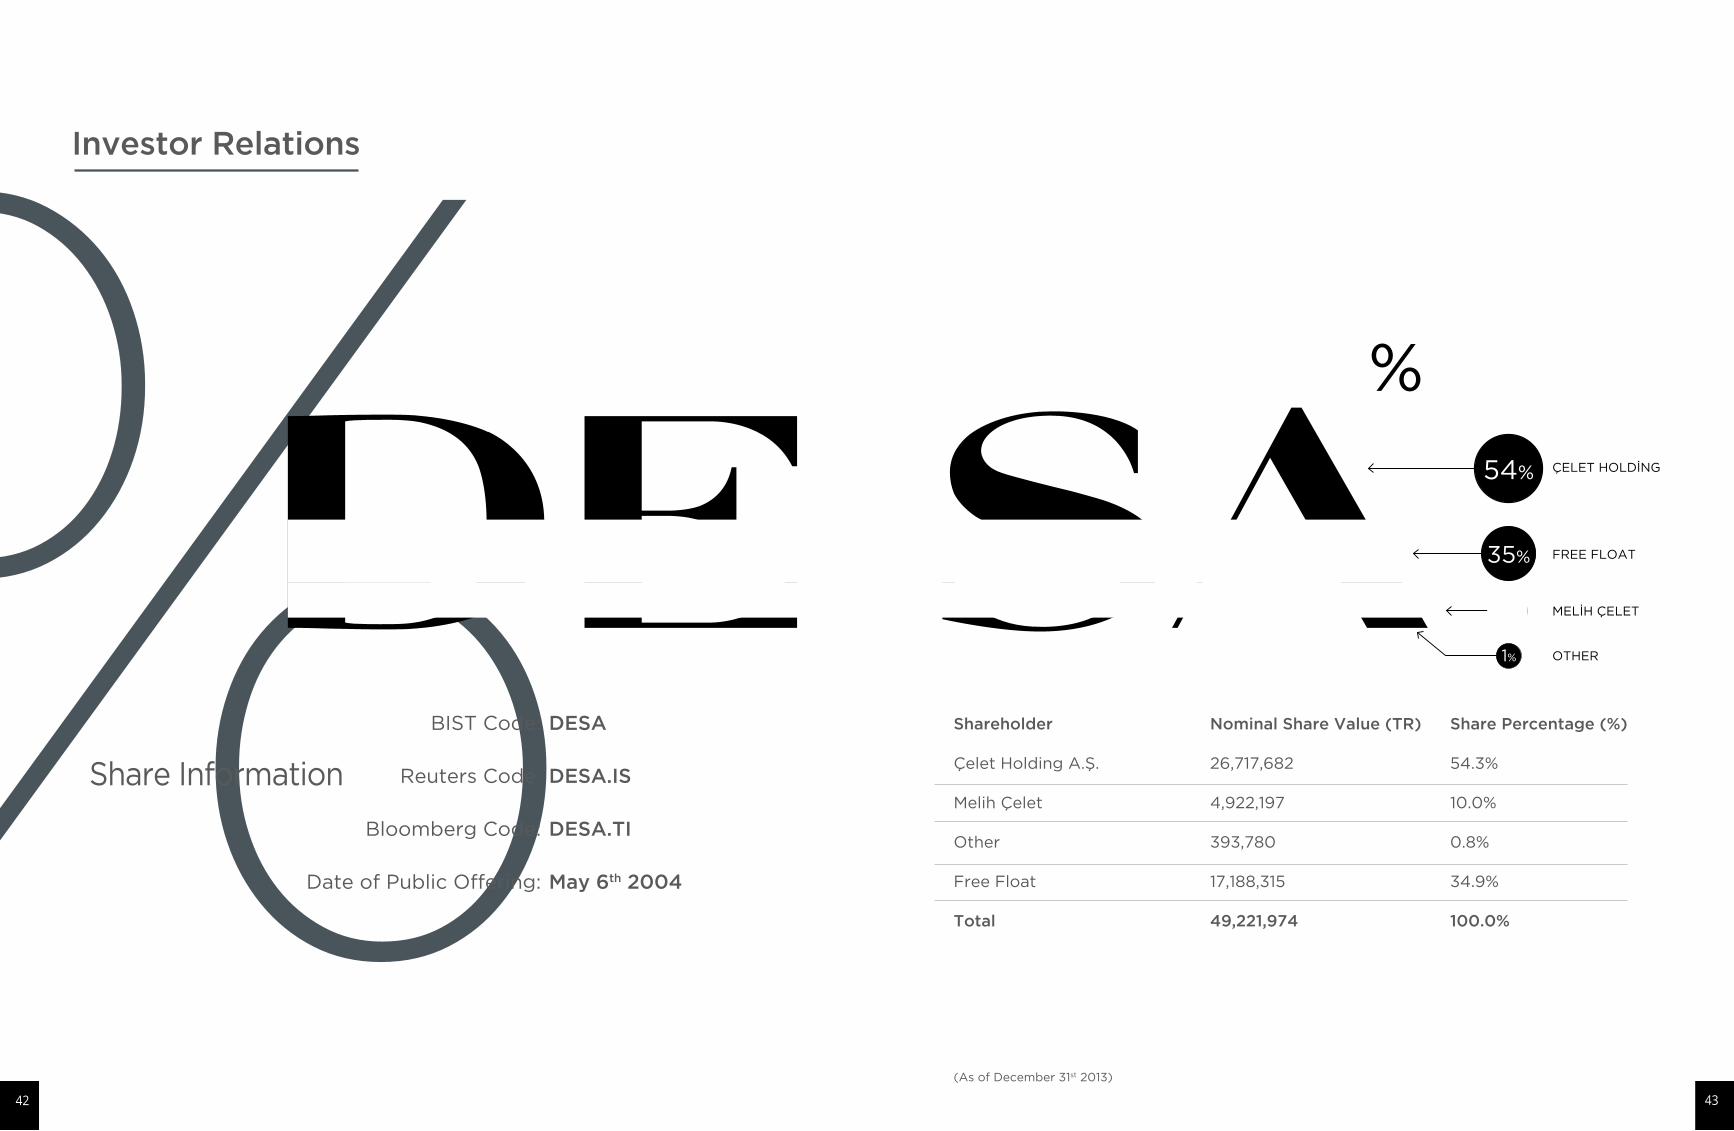
Shareholder
Çelet Holding A.Ş.
Melih Çelet
Other
Free Float
Total
Nominal Share Value (TR)
26,717,682
4,922,197
393,780
17,188,315
49,221,974
Share Percentage (%)
54.3%
10.0%
0.8%
34.9%
100.0%
%ÇELET HOLDİNG
MELİH ÇELET
OTHER
54%
35%
1%
10%
FREE FLOAT
Share Information
BIST Code:
Reuters Code:
Bloomberg Code:
Date of Public Offering:
(As of December 31st 2013)
DESA
DESA.IS
DESA.TI
May 6th 2004
Investor Relations
42 43
A FASHION BRAND FED FROM ISTANBUL BUT BEING A WORLD CITIZEN.
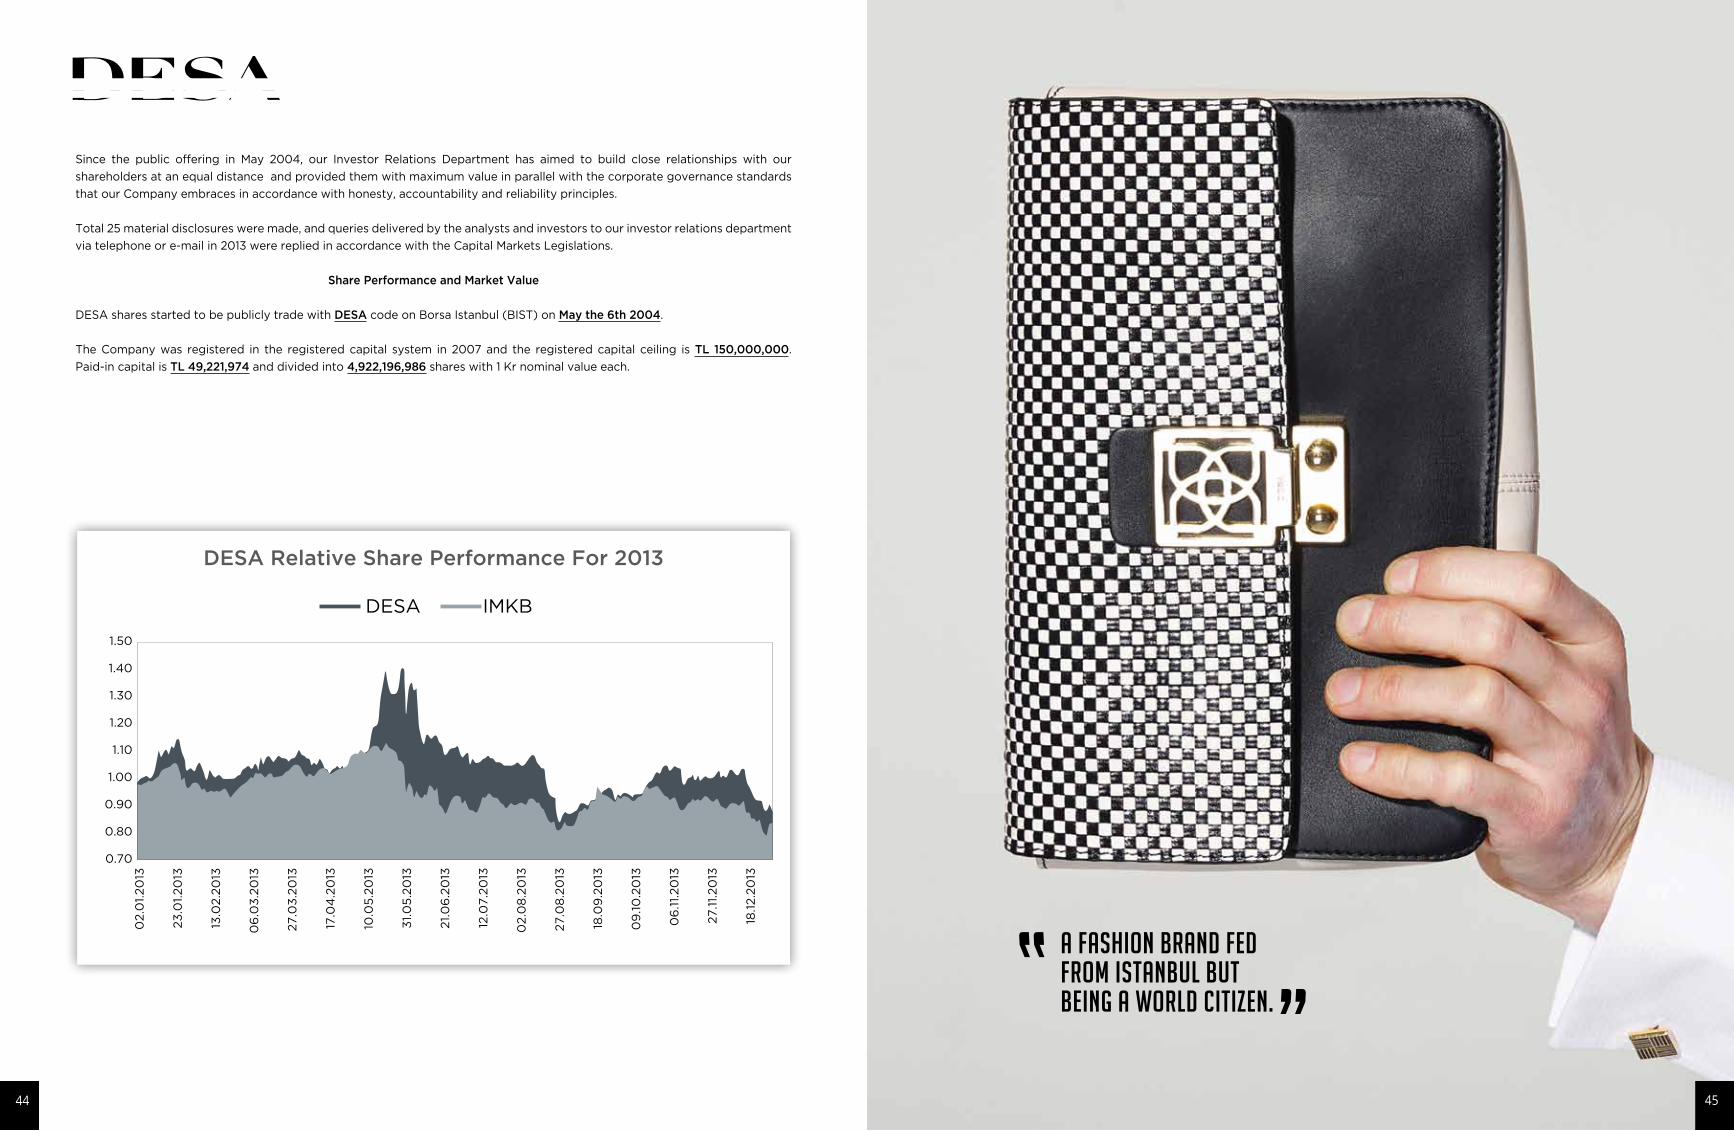
Since the public offering in May 2004, our Investor Relations Department has aimed to build close relationships with our
shareholders at an equal distance and provided them with maximum value in parallel with the corporate governance standards
that our Company embraces in accordance with honesty, accountability and reliability principles.
Total 25 material disclosures were made, and queries delivered by the analysts and investors to our investor relations department
via telephone or e-mail in 2013 were replied in accordance with the Capital Markets Legislations.
Share Performance and Market Value
DESA shares started to be publicly trade with DESA code on Borsa Istanbul (BIST) on May the 6th 2004.
The Company was registered in the registered capital system in 2007 and the registered capital ceiling is TL 150,000,000.
Paid-in capital is TL 49,221,974 and divided into 4,922,196,986 shares with 1 Kr nominal value each.
DESA Relative Share Performance For 2013
DESA IMKB
18.1
2.2
013
02.0
1.20
13
23
.01.
20
13
13.0
2.2
013
06
.03
.20
13
27.0
3.2
013
17.0
4.2
013
31.
05
.20
13
02.0
8.2
013
12.0
7.2
013
27.0
8.2
013
18.0
9.2
013
09
.10
.20
13
06
.11.
20
13
21.
06
.20
13
10.0
5.2
013
27.1
1.20
13
1.50
0.70
0.80
0.90
1.00
1.10
1.20
1.30
1.40
44 45
shareholder, all requests to obtain informa-
tion are discussed with the relevant depart-
ments and answered and communicated to
the shareholders by telephone or e-mail.
Any kind of information that would interest
to the shareholders during the year is dis-
closed with the necessary explanations and
published on the website.
2.2.2. Right to Request a Private Auditor
Although there is no arrangement regard-
ing appointment of a private auditor in the
Articles of Association, no request has been
received from the shareholders in this direc-
tion. The Company’s activities are periodi-
cally audited by an Independent Auditor and
Statutory Auditors determined at the Gen-
eral Assembly. The independent auditing
company, selected in the Ordinary General
Assembly for 2012 held on April 5th 2013 is
Kapital Karden Bağımsız Denetim ve Serbest
Muhasebeci Mali Müşavirlik Anonim Şirketi.
2.3. INFORMATION ON GENERAL
ASSEMBLY
The General Assembly meetings are held
taking into account the Turkish Commercial
Code, the Capital Markets Legislation and
the Corporate Governance Principles to al-
low the shareholders to obtain adequate in-
formation and broad participation.
2.3.1. General Assembly Pertaining to 2012
The General Assembly meeting was held
on April 5th 2013 with a quorum of 76%. No
specific period of time was provided to reg-
ister the registered shareholders into the
share ledger and the relevant provisions of
the Turkish Commercial Code were applied.
The General Assembly meeting was held in
the Company’s headquarters in order to fa-
cilitate the participation under the supervi-
sion of the Commissioner appointed by the
Ministry of Industry and Trade. The location
where our General Assembly meetings are
held is arranged in a manner allowing par-
ticipation of all shareholders. A separate
agenda item on the donations and aids dur-
ing the year was included in the agenda of
the General Assembly. No proposal with re-
spect to the agenda was submitted by the
shareholders separately. Media did not par-
ticipate in the meeting.
Article 1527 of the Turkish Commercial Code
No. 6102 dated January 1st 2011 resolved
that attending joint-stock company general
assemblies, making proposals, expressing
views and explanations and voting in an
electronic environment result all the legal
consequences of physical attendance and
voting, and the system for attending gener-
al assembly meetings and voting in an elec-
tronic environment is mandatory for compa-
nies listed in the stock exchange. In order to
determine the implementation principles of
the aforementioned Article, the Regulation
on the Electronic General Assembly Meet-
ings of Joint Stock Companies (EGKS Regu-
lation) was published in the Official Gazette
No. 28395, dated August 28th 2012, and the
Communiqué on the Electronic General As-
sembly System Applicable to Joint Stock
Companies, which governs the procedures
and principles of establishment, operation,
technical issues and security criteria of the
general assembly electronic system, was
published in the Official Gazette No. 28396,
dated August 29th .2012, and the effective
date of these regulations was determined as
October 1st 2012. Accordingly, the article
20 of our Company’s Articles of Association
was amended in accordance with the rel-
evant legislation and such amendment was
submitted to the stakeholders for approv-
al in the General Assembly meeting dated
April 5th 2013.
2.3.2. Invitations and Announcements
Invitations to the General Assembly meet-
ings are made by the Board of Directors in
accordance with the Turkish Commercial
Code (TCC), the Capital Market Law and
the provisions of the Company’s Articles of
Association. When the Board of Directors
adopts a resolution for a General Assembly,
the necessary announcements are made via
the PDP and the public is informed.
Announcement for a General Assembly
meeting is published on all editions of a
newspaper published daily in Turkey and
on the Trade Registry Gazette to reach the
greatest possible number of shareholders
within the framework of the necessary legal
provisions.
The legal processes and regulations are ob-
served for all announcements by disclosing
the necessary documents on the agenda
items to the public before General Assem-
bly meetings. The Company’s annual report
was presented to the shareholders at the
Company’s headquarters before the General
Assembly within the time periods provided
in the legislation. In addition, it was submit-
ted for review of the shareholders and all
other stakeholders at the Company’s web
site (www.desa.com.tr). There is no ques-
tion which was not answered during the
General Assembly meeting but answered by
the Investor Relations Department in writing
later on.
2.3.3. Methods of Voting
The example of the power of attorney for
shareholders who will be represented by a
proxy in the General Assembly Meeting is
available on the Company’s web-page and
newspaper advertisement.
2.3.4. Principles for Participating in the
General Assembly
Group A shares are registered shares and
Group B shares are bearer shares in our Com-
pany. The records in the Shareholders List of
the shareholders, whose shares were in the
investor accounts under the Intermediary In-
stitutions before the Central Registry Agen-
cy and who wished to attend the General
Assembly Meeting, were taken into account
under the provisions governing the General
Assembly Procedures of the Central Regis-
try Agency in the Company’s 2012 annual
general meeting held on April 5th 2013. It was
not legally possible to participate in the 2011
General Assembly meeting for the sharehold-
ers who did not register in the Shareholders
List before the CRA. On the other hand, ac-
cording to the Regulation on the Principles
and Procedures of the General Assembly
Meetings of Joint Stock Companies and Rep-
resentatives of the Ministry of Customs and
Trade to be present at these meetings pub-
lished in the Official Gazette No. 28481, dated
November 28, 2012; the list of shareholders
eligible to participate in the General Assem-
bly Meetings is prepared by the Board of Di-
rectors by the shareholder table in terms of
shares monitored by recording pursuant to
Article 10/A of the Law No. 2499 by the Cen-
tral Registry Agency, for other uncertificated
shares or bearer shares and certificate own-
ers, by the share ledger, and for shareholders
with bearer shares, by those with entrance
card, and this list is signed by the Chairman
of the Board of Directors or one of the Board
Members to be appointed by the Chairman.
According to the said Regulation, all share-
holders in the list prepared by the Board
of Directors have the right to attend Gen-
eral Assembly meetings. These shareholders
may attend the General Assembly meetings
PART I - STATEMENT OF COMPLIANCE WITH CORPORATE GOVERNANCE PRINCIPLES
Desa Deri Sanayi ve Ticaret A.S. has identi-
fied the principles contained in the Corpo-
rate Principles published by the Capital Mar-
kets Board as a target for itself.
The ability to operate at international stan-
dards is also of utmost importance besides
creating value to the shareholders with a
stable and profitable growth performance
in order to effectively take a place in the fi-
nancial markets developing with the depth
emerging as a result of globalization trends
in the financial markets.
Good corporate governance has a signifi-
cant contribution to the sustainability of the
Company as well as increase of its reliability
and prestige in the finance and capital mar-
kets.
DESA communicates the necessary infor-
mation to all its investors and analysts si-
multaneously in a timely, secure, stable and
proper manner under the legal and regula-
tory rules. Investors and other sharehold-
ers can access DESA-related historical and
current information in real-time and full pre-
sented on our website in the Investor Rela-
tions section.
The Company’s management aims at com-
plying with the obligations arising from the
Corporate Governance Principles Commu-
niqué No: II-17.1 published by the Capital
Markets Board Communiqué as a whole,
and has taken the necessary actions for this
purpose. The principles mandated for our
company within the scope of the Corporate
Governance Principles Communiqué are
complied with.
PART II – SHAREHOLDERS
2.1. INVESTOR RELATIONS DEPARTMENT
2.1.1. Investor Relations Department and its
Duties
The legislation and the Articles of Associa-
tion are complied for the exercise of share-
holders’ rights and practices that will ensure
the exercise of these rights are available.
Desa Deri San. ve Tic. A.S. established an
“Investor Relations Department” to manage
relations with the investors from the date of
the public offering in 2004. All relationships
between DESA and the shareholders are
carried out under the responsibility of the
“Investor Relations Department” as a result
of the joint efforts conducted with the rel-
evant departments in accordance with the
following principles.
The Investor Relations Department is re-
sponsible for informing on the Company’s
activities and financial condition, excluding
confidential information and trade secrets
of the shareholders and potential investors,
on a regular basis so as to not to cause an
information inequality and managing the
communication between the shareholders
and the Company in coordination with the
other departments.
In this context, the Investor Relations De-
partment is responsible for:
• Presenting the Company to the existing
and potential investors and brokerage
institutions, replying the queries of ana-
lysts and researchers working in these
institutions,
• Answering questions and requests from
the shareholders,
• Ensuring investor-related databases and
records to be kept up to date and order-
ly,
• Providing a two-way information flow
acting as a bridge between the share-
holders and the Company’s senior man-
agement and the Board of Directors,
• Reporting to the relevant departments
within the Company and senior manage-
ment about developments in the capital
markets and stock performance,
• Ensuring the shareholders to access the
most accurate, quick and complete in-
formation by updating the web-page,
activity report, investor presentations,
investor bulletins, corporate films and so
on communication means on a regular
basis which the shareholders can receive
information about DESA,
In addition, the Department helps executing
the General Assembly Meetings conducted
within the Company in accordance with the
legislation in force and the Articles of As-
sociation and other internal regulations.
Minutes of the General Assembly meetings
ensures keeping voting results recorded
and the through the minutes of the General
Assembly meeting and relevant reports are
submitted to the shareholders by the Inves-
tor Relations Department.
The Investor Relations Department per-
forms all kinds of public disclosures, such
as disclosing financial reports prepared by
the Department of Finance and particular
events as required by legislation.
Contact information of the Investor Rela-
tions Department is provided below.
Pınar Kaya – Investor Relations Specialist
Phone : 0212 473 18 00
Fax : 0212 698 98 12
E- mail : [email protected]
E- mail : [email protected]
Investor Relations Specialist Pınar Kaya car-
ries out her duties in a manner affiliated to
Ayhan Diribaş, our Company’s Executive
Vice President of Financial Affairs. The re-
port with respect to the investor relations
activities carried out in 2013 has been sub-
mitted to the Board of Directors on Febru-
ary 28th 2014. Pınar Kaya, the Investor Re-
lations Specialist of our Company holds an
Advanced Level License on Capital Market
Activities.
2.1.2. Information on Activities of the
Investor Relations Department in 2013
Questions that were addressed to the inves-
tor relations department by phone or e-mail
were answered. The Company’s web-page,
investor presentations were regularly up-
dated in order to ensure investors to monitor
up-to-date information. Disclosures which
are important to investors were published on
the Company’s web-page after announced in
the Public Disclosure Platform (PDP).
Updates in the investor tools are made on a
quarterly basis. Compliance with the legisla-
tion is observed to the maximum extent for
fulfilling the investor demands, and no com-
plaint against the Company about the exer-
cise of the shareholders’ rights or administra-
tive and legal proceedings brought against
the Company in this regard was made in the
past year to the best of our knowledge.
2.2. SHAREHOLDERS’ RIGHT TO OBTAIN
INFORMATION
2.2.1. Principles regarding Exercise of the
Right to Obtain and Review Information
No distinction is made between the share-
holders regarding the exercise of the right to
obtain and review information. Apart from
information in trade secret nature from the
CORPORATE GOVERNANCE PRINCIPLES
46 47
of the Company and with details stipulated
in Turkish Commercial Code as well as Capi-
tal Markets Legislation.
PART IV – STAKEHOLDERS
4.1. DISCLOSURES TO STAKEHOLDERS
Stakeholders will be informed on the mat-
ters that concern them through the press,
material disclosures, and press and analyst
meetings and in electronic media in line with
the Company’s disclosure policy.
Participation in the management requires to
be elected to the Board of Directors; how-
ever, employees are encouraged to partici-
pate in the management with various busi-
ness processes. There is no restriction for
the stakeholders to transmit the Company’s
actions that are contrary to the legislation
and unethical to the Company’s Corporate
Governance Committee and the Audit Com-
mittee.
Ensuring compliance with the legal regula-
tions as well as supervision thereof is under
the responsibility of the Audit Committee
and examining as well as settling the com-
plaints from shareholders and stakeholders
about the matters related with the corpo-
rate governance is under the responsibility
of the Corporate Governance Committee.
4.2. PARTICIPATIONS OF STAKEHOLDERS
TO MANAGEMENT
No model was formed with respect to inclu-
sion of the stakeholders to the management
of the company. On the other hand, the re-
quests and the proposals submitted in the
meeting held with the employees and the
other stakeholders are evaluated by man-
agement and policies as well as practices
related thereto are developed.
4.3. HUMAN RESOURCES POLICY
The Company’s total number of employees
as of December 31st 2013 is 1,937 (1,954, as of
December 31st 2012).
Without forgetting the fact that our most
important resource is human, we summa-
rize the human resource development phi-
losophy of our company targeting to have
human resources necessary for the future
while living today as follows: “We will train
our human resources at every level by our-
selves.”
We carry out the training and development
activities under our own structure in order
to train and develop DESA employees in
accordance with this philosophy. Further-
more, we try to ensure the conformity of the
qualifications that we look for the person-
nel to be employed in our company with the
job to be performed by such personnel and
choose individuals who are prescient as well
as have career expectations for the success
of this policy. We clearly explain their duties
and responsibilities to all of the personnel
employed in our company during employ-
ment interview; provide them with orienta-
tion training after employment and deliver
their job definitions in writing.
A “joint working committee” was formed in
order to make corporate and personal tar-
gets parallel by increasing the motivation in
the company, to ensure the communication
of the problems encountered by the person-
nel to the management systematically for
solving the same as well as to assess the re-
quests of the employees within the frame of
social responsibility standard and to share
the same with the management. This com-
mittee consists of the representatives elect-
ed from each department by the votes of
our personnel and works in accordance with
written regulations.
There is no complaint with respect to dis-
crimination in our company and also no
complaint arisen in social responsibility in-
spections carried out by independent audi-
tors regularly related thereto upon requests
of our customers. Furthermore, the text of
“the social responsibility policy” is placed
in locations visible by all of the employees
throughout the workplace.
4.4. CODES OF CONDUCT AND SOCIAL
RESPONSIBILITY
Codes of conduct were created for the
Company and employees, and these codes
of conduct determined were disclosed to
the employees with the Human Resources
Manual and to the public in accordance with
the disclosure policy.
In its history of 40 years, the corporate cul-
ture of Desa in compliance with honesty,
respect, ethical behaviour and the laws and
regulations always has been at the forefront.
Aiming at offering a healthy development,
universal quality and standards of products
and services by ensuring customer satis-
faction together with its employees and in
this way, becoming a symbol of credibility,
continuity and prestige before our country,
its customers, shareholders, the companies
it exports to, the values of Desa shed light
to the path to be followed to achieve these
objectives, and these are shared with the
public through its website. The ethical val-
ues of Desa are the key factors lying behind
its success and to achieve the future objec-
tives.
Desa has been attaching importance to sup-
port social and cultural activities since its
foundation. For this purpose, the Company
sponsors various activities.
Desa operates in line with the system that
it has created within the framework of the
Labour Law and Laws on Social Security
and Employee Health and Safety. In addi-
tion, Desa have the ETI BASE CODE audits
performed twice a year by the companies
accredited by Sedex system and all the re-
ports are loaded to the Sedex system. Au-
dits are performed on various subjects in-
cluding quality, environment, management
system and SA8000.
The Company observes the industry-specif-
ic norms on the environment in production
under the Environmental Policy and System
created by the Company itself. No lawsuit
was filed against the Company for damage
to the environment during the period. The
Company’s codes of conduct are available
at our website (www.desa.com.tr).
PART V – BOARD OF DIRECTORS
5.1. STRUCTURE AND FORMATION OF
BOARD OF DIRECTORS
Turkish Commercial Code, Capital Markets
Board regulations and the Corporate Gov-
ernance Principles apply to the election of
board members. The Board of Directors
consists of five members totally two of
which are independent members
Melih ÇELET
Executive Member – Chairman
Burak ÇELET
Executive Member – General Manager
Burçak ÇELET
Non-executive Member
Osman Tavtay
Non-executive Independent Member
Mehmet Kaan Koz
Non-executive Independent Member
Any event which would render the indepen-
dency of the independent board members
null and void did not occurred as of the re-
spective activity period. The statements of
independency of the independent board
members are as follows.
Since I have been elected as “Independent
Member” of the Board of Directors in the
themselves as well as being represented
by a third party. Such representatives are
not required to be a shareholder.
The shareholders may have themselves
represented by other shareholders or
by a proxy to be appointed externally
in the General Assembly meetings in ac-
cordance with the Capital Markets Board
regulations governing voting by proxy.
Representatives, who are shareholders of
the Company, are also authorized to vote
on behalf of the shareholders that they
represent other than their own votes.
2.3.5. Meeting Minutes
Meeting minutes are available at www.
kap.gov.tr and www.desa.com.tr immedi-
ately after the end of the meeting. In ad-
dition, these minutes are available review
by the shareholders at the Company’s
headquarters and are shared with inves-
tors who request to access these minutes.
2.4. VOTING RIGHTS AND MINORITY
RIGHTS
2.4.1. Exercise of Voting Right
The Company avoids practices that make
exercising voting rights difficult and pro-
vides all shareholders with an equal, easy
and convenient voting possibility. Non-
preferential shareholders having the right
to vote in the Company may vote them-
selves as well as through a third party
who is not a shareholder. No provision
that prevents any person, who is not a
shareholder, to vote by proxy as a repre-
sentative for the unprivileged shares ex-
ists in the Articles of Association.
2.4.2. Minority Rights
The Company pays attention to exercise
of the minority rights. No complaint was
made in this regard in 2013. Since we priv-
ileged shares for the voting rights, there
is no regulation on the cumulative voting.
Group A shares have the right to deter-
mine 4 out of 5 board members. Each
Group A share is entitled with fifty votes
and each Group B share is entitled to one
vote in the ordinary and extraordinary
general meetings. No company with any
cross-shareholding relations exists. Cu-
mulative voting method is not included
in the Company’s Articles of Association.
There is no provision in the Articles of
Association for determining the minority
rights in a manner less than one twenti-
eth of the capital.
2.5. DIVIDEND DISTRIBUTION POLICY
AND DIVIDEND DISTRIBUTION PERIOD
2.5.1. Dividend Distribution Policy
DESA Deri Sanayi Ve Ticaret A.S. carries
out dividend distribution in accordance
with the CMB regulation. The Company
unanimously resolved to follow a well-bal-
anced and prudent dividend distribution
policy by taking into consideration utiliz-
ing internal and external investment op-
portunities as well as the shareholders in
the market and the Company’s interests in
order to consider additional investments
to be made abroad and prevent possi-
ble effects of a global economic crisis in
line with the targets of “DESA” brand of
growing, developing and being a global
company with a strong financial structure
in accordance with the Corporate Gov-
ernance Principles of the Capital Markets
Board. This dividend distribution policy is
included in the annual report and available
at the Company’s official web-page. The
dividend distribution policy of the com-
pany was submitted to the shareholders’
information in General Assembly meeting
dated April 4th 2013 pertaining to 2012.
There is no privilege with respect to the
company’s profit sharing. During the Gen-
eral Assembly meeting related with 2012,
distribution of dividend in cash amount-
ing to TL 3.000.000 was approved by the
shareholders. Accordingly, it was resolved
to pay a cash dividend amounting to TL
0,0518061 per share for real persons and
TL 0,0609484for fully responsible legal
entities. The first cash dividend payment
of the Company since its public offering in
2004 was realized on May 28th 2013.
2.5.2. Dividend Distribution Period
The approval of the General Assembly
and the legal time limits are observed
based on the provisions of the Turkish
Commercial Code, the Capital Market
Board regulations and the provisions of
the Company’s Articles of Association
for dividend distribution.
2.6. TRANSFER OF SHARES
The Articles of Association does not in-
clude any provisions that make public
Group B shareholders to freely transfer
their shares difficult and restrict share
transfer. Bearer shares shall be trans-
ferred and assigned in accordance with
the provisions of the Turkish Commercial
Code and other relevant legislation. For
non-public Group A shares owned by a
controlling shareholder, other Group A
shareholders have a pre-emption right
in proportion to their shares before the
Company according to Article 9 of the
Articles of Association.
PART III –PUBLIC DISCLOSURE AND TRANSPARENCY
3.1 CORPORATE WEBSITE AND ITS
COMTENT
The official website of Desa Deri San. ve
Tic. A.S. (www.desa.com.tr) is periodi-
cally updated and in addition, the web-
site includes prospective information.
The necessary information is published
on the Company’s website in accordance
with the CMB’s Corporate Governance
Principles. The Company’s website soon
will be serving also in English language
in order to make the website available
to foreign investors. Our investors are
informed regularly on the following mat-
ters including the issues specified by the
Corporate Governance Principles in the
investor relations section of the website
to provide the existing and potential in-
vestors and intermediaries with a more
comprehensive flow of information.
• The Company’s Articles of Associa-
tion
• Trade registry information
• Financial Data
• Audit Reports
• Annual Reports
• Investor Presentations
• Corporate Governance Practices and
Compliance Report
• Duty and Working Principles of Cor-
porate Governance Committee
• Material Disclosures
• Agenda of the General Assembly
• Minutes of the General Assembly
Meetings
• Attendance Sheet
• Partnership Structure
• Company Policies
• Board Members
• Sample of power of attorney
• Frequently asked questions
• Communication information
3.2. Annual Reports
Annual reports are prepared in a manner
to allow our shareholders, the public and
all other stakeholders to obtain full and
accurate information about the activities CORP
ORAT
E GOV
ERNA
NCE P
RINC
IPLE
S
48 49
tion to the participation in the meeting of
the Board of Directors of the Company in
person.
The damages to the Company which may be
caused by the defaults of the Board Mem-
bers during the performance of their duties
have not been insured yet.
5.1. NUMBER, STRUCTURE AND INDEPEN-
DENCY OF COMMITTEES ESTABLISHED IN
BOARD OF DIRECTORS
Efforts on Corporate Governance were
launched in 2005. The Audit Committee
acting under the Board of Directors was es-
tablished with decision of the board of di-
rectors numbered 18, dated May 26th 2004.
The Corporate Governance Committee has
been established with the decision of the
board of directors numbered 22, dated June
19th 2012 within the framework of the Prin-
ciples of Corporate Governance in the activ-
ity period of the year 2012. The duties and
responsibilities for Candidate Nomination
Committee, Committee for Early Detection
of Risk and Remuneration Committee were
assigned to the established committee.
The Committee for Early Detection of Risk
was established with decision of the board
of directors numbered 16, dated May 20th
2013. Osman Tavtay was elected as the
chairman of the committee and Burçak Çe-
let as the member.
5.1.1. Audit Committee
The Audit Committee fulfils the duties pro-
vided for the audit committee in the Capi-
tal Markets Regulation. In this context, the
Company’s accounting system performs
disclosure of the financial information to the
public, independent audit and supervision
of the operation and effectiveness of the in-
ternal control system of the partnership.
Selecting the independent auditing compa-
ny, preparing independent audit contracts
and initiating independent audit process
and activities of the independent auditing
organization at each step take place under
the supervision of the audit committee.
The Audit Committee must submit the an-
nual and interim financial statements to be
disclosed to the public to the Board of Di-
rectors in writing with its own evaluations
by obtaining the views of the responsible
executives and independent auditors of the
partnership regarding the compliance of the
statements with the accounting principles
of the partnership, the truth and accuracy,
and shall convene at least four times in a
year and more frequently if necessary.
The Audit Committee together with the
Company’s management are responsible for
maintaining the internal and external audit-
ing carefully and ensuring compliance of the
records, procedures and reports with the
relevant laws, rules and regulations as well
as the principles of the CMB and IFRS. This
committee consists of non-executive inde-
pendent members.
Members of the Audit Committee:
Chairman: OSMAN TAVTAY
Member: MEHMET KAAN KOZ
5.1.2. Corporate Governance Committee
The Corporate Governance Committee per-
forms acts to support and assist the Board
of Directors by performing efforts for com-
pliance of the Company with the corporate
governance principles, determination of
the board members and senior executives,
assessment of remuneration, reward and
performance and career planning, investor
relations and public disclosure. The reason
for Mehmet Kaan Koz, independent mem-
ber, is assigned to the both committees is
that two of our independent members are
assigned to the audit committee due to the
requirement that the audit committee must
consist of independent members. He carries
out these duties because the members of
the Corporate Governance Committee must
consist of non-executive members.
Corporate Governance Committee Mem-
bers:
Chairman: MEHMET KAAN KOZ
Member: BURÇAK ÇELET
The necessary compliance will be ensured in
the first half of 2014 with respect to appoint-
ment of Pınar Kaya, the Investor Relations
Specialist as the member of the corporate
management committee of the Company
pursuant to the subparagraph 2 of the ar-
ticle 11 of the Corporate Governance Prin-
ciples Communiqué No: II-17.1
5.4. RISK MANAGEMENT AND INTERNAL
CONTROL MECHANISM
The Company’s risk management includes
auditing the financial risk, market risk and
operational risk on a regular basis and is
carried out periodically by the finance de-
partment. The Company’s internal control
mechanism is under the responsibility of the
Department of Financial Affairs and the In-
ternal Audit Committee.
5.5. COMPANY’S STRATEGIC TARGETS
Desa’s mission, vision, targets and ethical
values are added to the corporate identity
file and published on the Company’s web-
site.
The Board of Directors agrees on and ap-
proves the creation of strategic objectives
prepared by the managers. Activities are as-
sessed on monthly, quarterly, semi-annual, 9
months and annual basis. The strategic ob-
jectives for the year 2014 have been estab-
lished and review of the production targets
has been started. Efforts for spread of the
targets are ongoing. The next 5-year strate-
gic planning process has begun. The actual
situation for the year 2013 has been deter-
mined by creating all the indicators for fi-
nancial, customer, process and learning, de-
velopment targets for all the departments,
and the forecast for the year 2014 has been
established.
25. FINANCIAL RIGHTS TO THE BOARD
OF DIRECTORS
The rights, the interests and the fees provid-
ed to the members of the Board of Directors
are applied based on the decisions taken at
the General Assembly. No benefit, such as
debt, surety, credit and etc., was provided
to the Board Members during the reporting
period. The financial rights in remuneration
provided to the Board of Directors are dis-
cussed at the General Assembly, and the
public is informed through the meeting min-
utes. The rights determined are informed
not on an individual basis but whether or
not they are provided to the executive
members or independent members. The
principles with respect to remunerations
of the members of the board of directors
and the manager having administrative re-
sponsibilities have been adopted with deci-
sion of the board of directors numbered 15,
dated May 20th 2013 and posted in investor
relations section of the Company’s website.
Policy will also be submitted for the share-
holders’ information in the Ordinary General
Assembly meeting for 2013.
General Assembly meeting dated May
31st 2012, I hereby submit the following
issues for our Board of Directors’, our
shareholders’ and all other stakeholders’
information pursuant to the regulations
of the Capital Markets Board regarding
corporate governance;
• No direct or indirect relationship
in terms of employment, capital or
other important trading activities has
been formed between me, spouse or
my blood or affinity relatives up to
the third degree and any of Desa Deri
San. Ve Tic. A.Ş’s related parties or le-
gal entities which have management
or capital relation with shareholders
having shares at a rate of 5% or more
in the capital of Desa Deri directly or
indirectly within last five years,
• I have not been employed in a company,
primarily serving as auditing, consulting
and rating company, which undertakes
full or partial activities or organization
of Desa Deri under an agreement and
held any position in such a company
as a member of the board of directors
within the last five years,
• I have not been employed in, been a
partner or a member of the board of
directors of a company, which is pro-
viding significant amount of services
and products to Desa Deri within the
last five years,
• I have the required professional
training, knowledge and experience
for performing the duties of which I
would assume with my capacity as an
independent member of the board of
directors properly ,
• I am not a full-time employer of any
public institution or organization,
• I am considered as a resident in Tur-
key in accordance with the Income
Tax Law
• I have strong standards of ethics,
professional reputation and experi-
ence for adding positive contribution
in activities of Desa Deri, for securing
my independency about subjects in
relation with the conflicts of share-
holders and for making independent
decisions with taking into account of
stakeholders’ rights,
• I am able to allocate necessary time
for businesses of the company at a
level sufficient for monitoring the
processes and the activities of Desa
Deri as well as fulfilling the require-
ments of my duties.
The CVs of the members of the Board of
Directors are as follows:
Melih ÇELET
Chairman - CEO
Mr. Melih ÇELET, founded Desa in 1972,
graduated from Ankara College in
1968 and studied at Istanbul University,
Faculty of Pharmacy. Mr. Melih ÇELET
speaks English.
Burak ÇELET
Board Member – General Manager
Mr. Burak ÇELET graduated from
Boğazici University in 1999, with a Bach-
elor’s degree in Mechanical Engineering.
He received an MBA degree in Corporate
Finance from University of Wisconsin,
Madison, in 2001. He obtained a Master
of Science degree in Leather Technology
from Northampton College in 2002. Mr.
Burak ÇELET serves as a Board Member
of the United Brands Association, Board
Member of the Istanbul Leather and
Leather Products Exporters’ Associa-
tion as well as Member of the Turqual-
ity Working Group in addition to his duty
as General Manager in our Company. Mr.
Burak ÇELET speaks English and Ger-
man.
Burçak ÇELET
Board Member
Ms. Burçak ÇELET completed her bach-
elor’s degree in Industrial Engineering
at Yıldız Technical University in 1999.
Between 1999 and 2001, she worked as
Planning Director at Toys’R’Us. She re-
ceived her Master of Science degree in
Retail Management from University of
Surrey in 2002 and she served as Cate-
gory Director at Joker Maxitoys between
2003 and 2004. Ms. Burçak ÇELET, who
has been serving as a Board Member in
our Company since December 22nd 2006,
speaks Italian, English and French.
Mehmet Kaan KOZ
Independent Board Member
Mr. Mehmet Kaan KOZ completed his un-
dergraduate education at Boğazici Uni-
versity, Department of Mechanical Engi-
neering in 1999 that he entered in 1995
after graduating from the German High
School. He began his professional career
in Arçelik A.S. Research and Technology
Development Centre as a member of
Koç Holding’s Management Trainee Pro-
gram in 1999 and then he had a start in
the business life and became the Manag-
ing Partner of Anova Ltd. Şti. established
in 2003. Mr. KOZ was elected as an in-
dependent member for a period of two
years with the resolution dated May 31st
2012 taken in the Company’s annual gen-
eral meeting for the year 2011.
Osman TAVTAY
Independent Board Member
Mr. Osman TAVTAY, who completed his
bachelor’s degree in Geophysical Engi-
neering at Istanbul Technical University
in 1986, served as a Senior Trader at Koç
Menkul Değerler between 1996 and 1998
after serving as a Stock Exchange Agent
and Expert at Can Menkul Değerler, Pi-
ramit Menkul Kıymetler and Ekinciler
Yatırım between 1990 and 1996. Mr.
TAVTAY, who served as Domestic Oper-
ations Director at ABN Amro Yatırım A.S.
between 1998 and 2004, was elected as
an independent member for a period of
two years at the Company’s 2011 annual
general meeting dated May 31st 2012.
Since the nomination committee has
not been established yet on the date in
which our Independent Board Members
were elected, two candidates were sub-
mitted to the General Assembly together
with their statements of independency
for approval. The Board Members are
not bound by specific rules to undertake
different duties outside the Company
and Mr. Mehmet Kaan Koz, a member
of the Board of Directors carries out the
duty of managing partner in Anova Ltd.
Şti. There is only one female member in
existing board of directors of our com-
pany and this rate is less than the mini-
mum limit of 25% stipulated in Corporate
Governance Principles Communiqué. A
target of two years was established for
achieving the percentage stipulated in
the Communiqué.
5.1. PRINCIPLES FOR ACTIVITIES OF
BOARD OF DIRECTORS
Activities of the Board of Directors are
carried out under the provisions of the
Turkish Commercial Code and the Ar-
ticles of Association. The number of
resolutions taken by the Board of Di-
rectors increased to 33 with the resolu-
tions taken within the framework of the
paragraph 4 of Article 390 of the Turk-
ish Commercial Code No. 6102 in 2013.
The members of the Board of Directors
do not have the right of casting vote and
each member is entitled to one vote.
Votes are announced as accepted or re-
jected at the meetings of the Board of
Directors. Those who have a counter
vote shall write the justification of the
decision and sign. However, no public
disclosure has been made in this regard
recently as such kind of opposition or
difference of opinion has not been de-
clared. The Board Members pay atten-CORP
ORAT
E GOV
ERNA
NCE P
RINC
IPLE
S
50 51
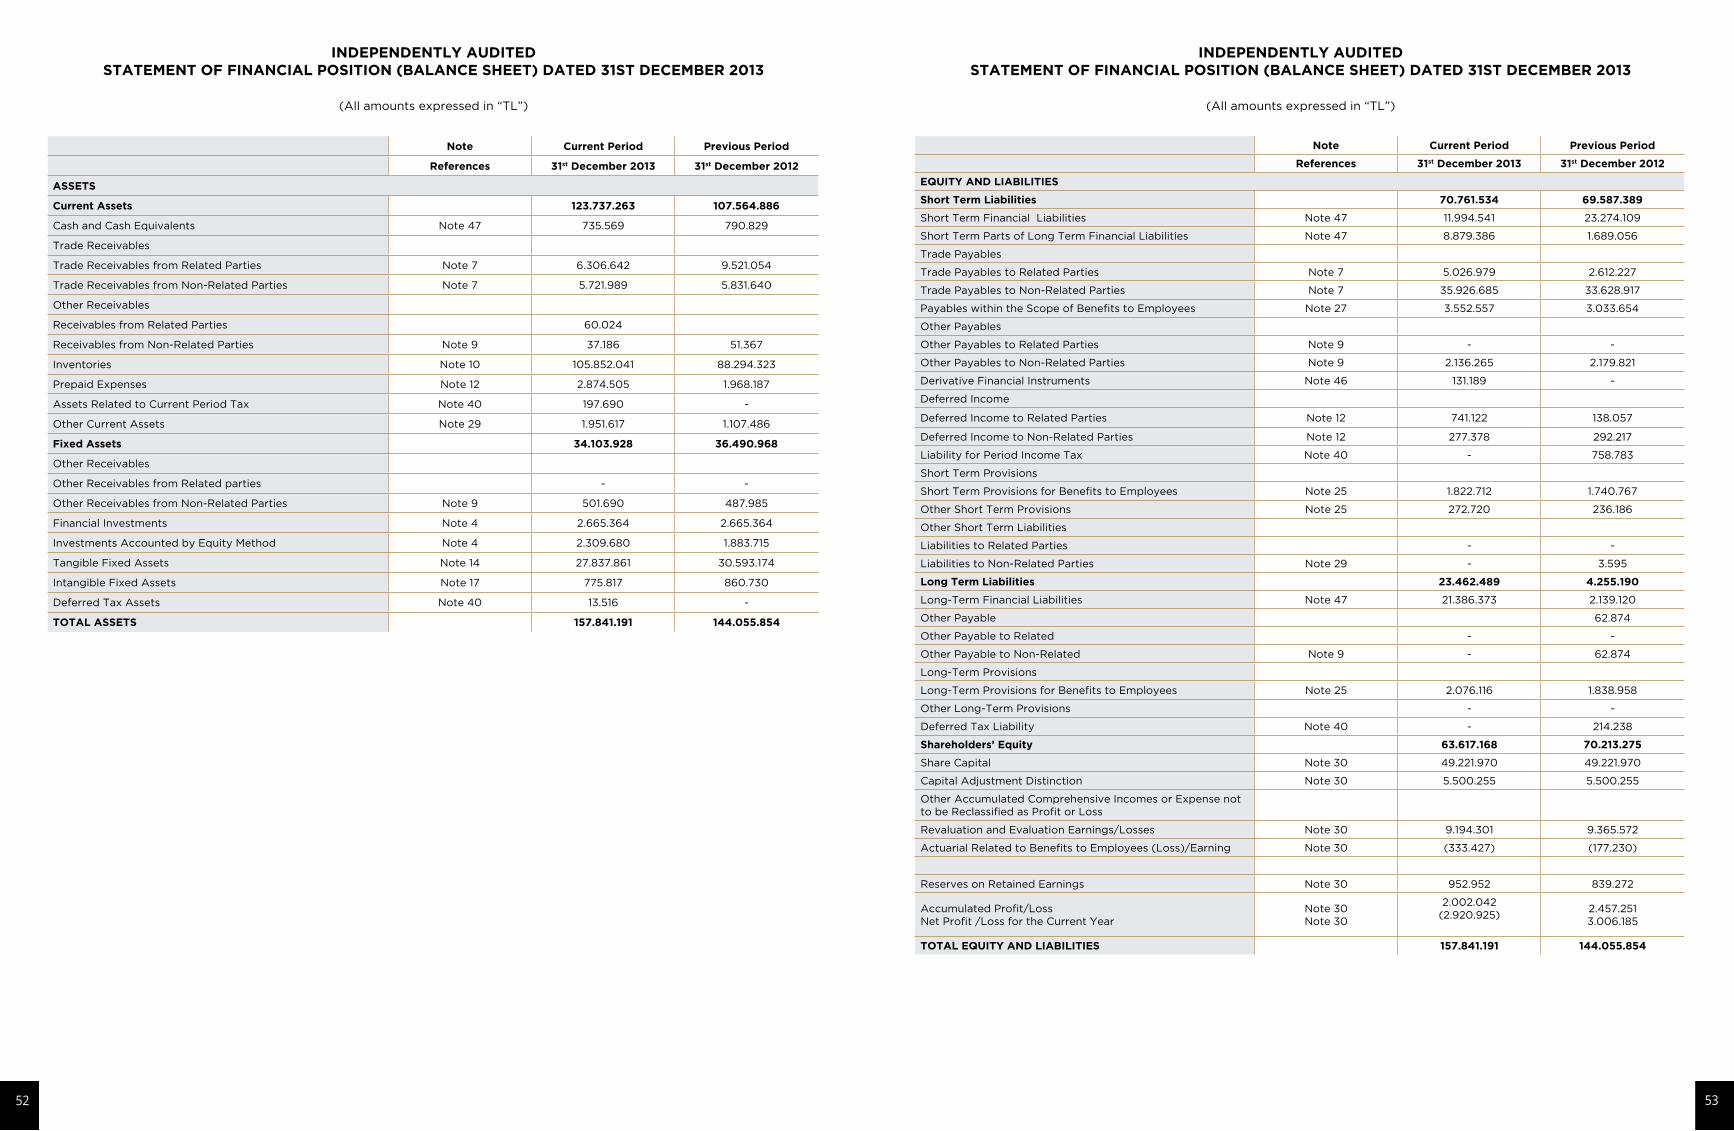
INDEPENDENTLY AUDITED STATEMENT OF FINANCIAL POSITION (BALANCE SHEET) DATED 31ST DECEMBER 2013
(All amounts expressed in “TL”)
Note Current Period Previous Period
References 31st December 2013 31st December 2012
EQUITY AND LIABILITIES
Short Term Liabilities 70.761.534 69.587.389
Short Term Financial Liabilities Note 47 11.994.541 23.274.109
Short Term Parts of Long Term Financial Liabilities Note 47 8.879.386 1.689.056
Trade Payables
Trade Payables to Related Parties Note 7 5.026.979 2.612.227
Trade Payables to Non-Related Parties Note 7 35.926.685 33.628.917
Payables within the Scope of Benefits to Employees Note 27 3.552.557 3.033.654
Other Payables
Other Payables to Related Parties Note 9 - -
Other Payables to Non-Related Parties Note 9 2.136.265 2.179.821
Derivative Financial Instruments Note 46 131.189 -
Deferred Income
Deferred Income to Related Parties Note 12 741.122 138.057
Deferred Income to Non-Related Parties Note 12 277.378 292.217
Liability for Period Income Tax Note 40 - 758.783
Short Term Provisions
Short Term Provisions for Benefits to Employees Note 25 1.822.712 1.740.767
Other Short Term Provisions Note 25 272.720 236.186
Other Short Term Liabilities
Liabilities to Related Parties - -
Liabilities to Non-Related Parties Note 29 - 3.595
Long Term Liabilities 23.462.489 4.255.190
Long-Term Financial Liabilities Note 47 21.386.373 2.139.120
Other Payable 62.874
Other Payable to Related - -
Other Payable to Non-Related Note 9 - 62.874
Long-Term Provisions
Long-Term Provisions for Benefits to Employees Note 25 2.076.116 1.838.958
Other Long-Term Provisions - -
Deferred Tax Liability Note 40 - 214.238
Shareholders’ Equity 63.617.168 70.213.275
Share Capital Note 30 49.221.970 49.221.970
Capital Adjustment Distinction Note 30 5.500.255 5.500.255
Other Accumulated Comprehensive Incomes or Expense not to be Reclassified as Profit or Loss
Revaluation and Evaluation Earnings/Losses Note 30 9.194.301 9.365.572
Actuarial Related to Benefits to Employees (Loss)/Earning Note 30 (333.427) (177.230)
Reserves on Retained Earnings Note 30 952.952 839.272
Accumulated Profit/LossNet Profit /Loss for the Current Year
Note 30Note 30
2.002.042(2.920.925)
2.457.2513.006.185
TOTAL EQUITY AND LIABILITIES 157.841.191 144.055.854
INDEPENDENTLY AUDITED STATEMENT OF FINANCIAL POSITION (BALANCE SHEET) DATED 31ST DECEMBER 2013
(All amounts expressed in “TL”)
Note Current Period Previous Period
References 31st December 2013 31st December 2012
ASSETS
Current Assets 123.737.263 107.564.886
Cash and Cash Equivalents Note 47 735.569 790.829
Trade Receivables
Trade Receivables from Related Parties Note 7 6.306.642 9.521.054
Trade Receivables from Non-Related Parties Note 7 5.721.989 5.831.640
Other Receivables
Receivables from Related Parties 60.024
Receivables from Non-Related Parties Note 9 37.186 51.367
Inventories Note 10 105.852.041 88.294.323
Prepaid Expenses Note 12 2.874.505 1.968.187
Assets Related to Current Period Tax Note 40 197.690 -
Other Current Assets Note 29 1.951.617 1.107.486
Fixed Assets 34.103.928 36.490.968
Other Receivables
Other Receivables from Related parties - -
Other Receivables from Non-Related Parties Note 9 501.690 487.985
Financial Investments Note 4 2.665.364 2.665.364
Investments Accounted by Equity Method Note 4 2.309.680 1.883.715
Tangible Fixed Assets Note 14 27.837.861 30.593.174
Intangible Fixed Assets Note 17 775.817 860.730
Deferred Tax Assets Note 40 13.516 -
TOTAL ASSETS 157.841.191 144.055.854
52 53
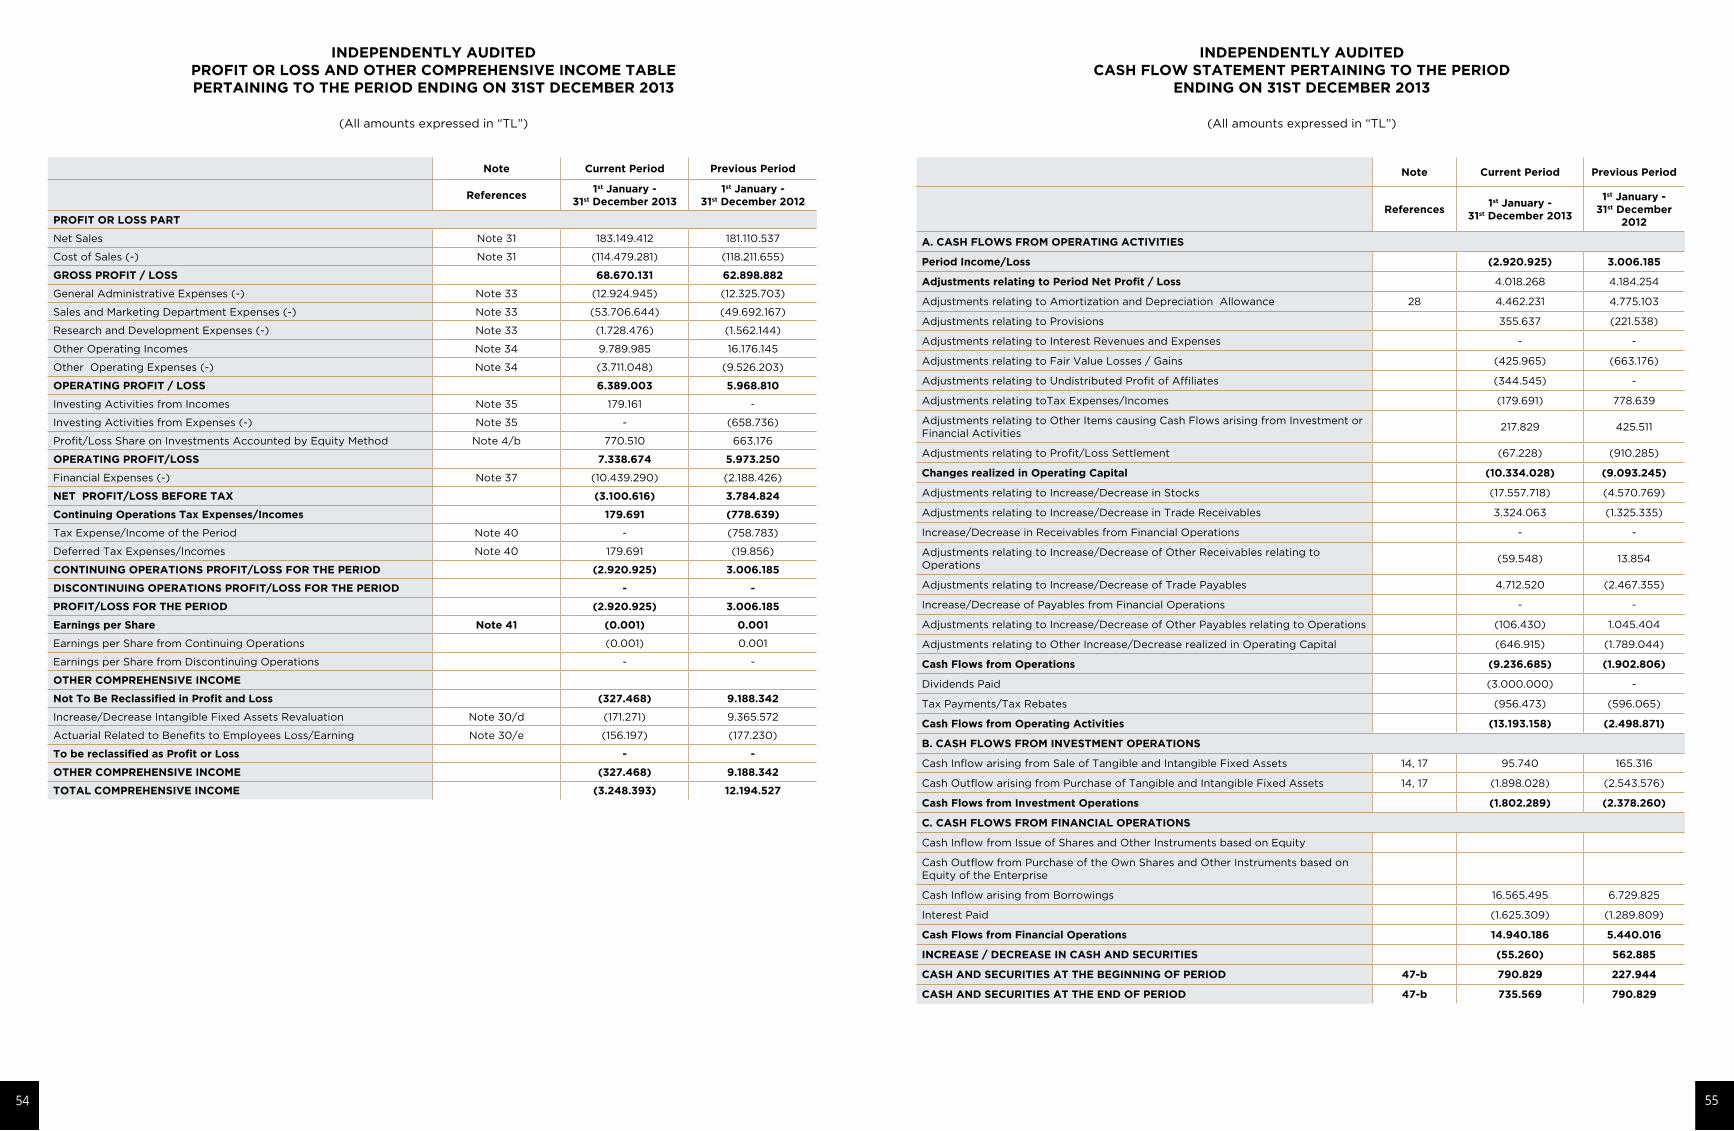
INDEPENDENTLY AUDITED CASH FLOW STATEMENT PERTAINING TO THE PERIOD
ENDING ON 31ST DECEMBER 2013
(All amounts expressed in “TL”)
Note Current Period Previous Period
References1st January -
31st December 2013
1st January -31st December
2012
A. CASH FLOWS FROM OPERATING ACTIVITIES
Period Income/Loss (2.920.925) 3.006.185
Adjustments relating to Period Net Profit / Loss 4.018.268 4.184.254
Adjustments relating to Amortization and Depreciation Allowance 28 4.462.231 4.775.103
Adjustments relating to Provisions 355.637 (221.538)
Adjustments relating to Interest Revenues and Expenses - -
Adjustments relating to Fair Value Losses / Gains (425.965) (663.176)
Adjustments relating to Undistributed Profit of Affiliates (344.545) -
Adjustments relating toTax Expenses/Incomes (179.691) 778.639
Adjustments relating to Other Items causing Cash Flows arising from Investment or Financial Activities
217.829 425.511
Adjustments relating to Profit/Loss Settlement (67.228) (910.285)
Changes realized in Operating Capital (10.334.028) (9.093.245)
Adjustments relating to Increase/Decrease in Stocks (17.557.718) (4.570.769)
Adjustments relating to Increase/Decrease in Trade Receivables 3.324.063 (1.325.335)
Increase/Decrease in Receivables from Financial Operations - -
Adjustments relating to Increase/Decrease of Other Receivables relating to Operations
(59.548) 13.854
Adjustments relating to Increase/Decrease of Trade Payables 4.712.520 (2.467.355)
Increase/Decrease of Payables from Financial Operations - -
Adjustments relating to Increase/Decrease of Other Payables relating to Operations (106.430) 1.045.404
Adjustments relating to Other Increase/Decrease realized in Operating Capital (646.915) (1.789.044)
Cash Flows from Operations (9.236.685) (1.902.806)
Dividends Paid (3.000.000) -
Tax Payments/Tax Rebates (956.473) (596.065)
Cash Flows from Operating Activities (13.193.158) (2.498.871)
B. CASH FLOWS FROM INVESTMENT OPERATIONS
Cash Inflow arising from Sale of Tangible and Intangible Fixed Assets 14, 17 95.740 165.316
Cash Outflow arising from Purchase of Tangible and Intangible Fixed Assets 14, 17 (1.898.028) (2.543.576)
Cash Flows from Investment Operations (1.802.289) (2.378.260)
C. CASH FLOWS FROM FINANCIAL OPERATIONS
Cash Inflow from Issue of Shares and Other Instruments based on Equity
Cash Outflow from Purchase of the Own Shares and Other Instruments based on Equity of the Enterprise
Cash Inflow arising from Borrowings 16.565.495 6.729.825
Interest Paid (1.625.309) (1.289.809)
Cash Flows from Financial Operations 14.940.186 5.440.016
INCREASE / DECREASE IN CASH AND SECURITIES (55.260) 562.885
CASH AND SECURITIES AT THE BEGINNING OF PERIOD 47-b 790.829 227.944
CASH AND SECURITIES AT THE END OF PERIOD 47-b 735.569 790.829
INDEPENDENTLY AUDITED PROFIT OR LOSS AND OTHER COMPREHENSIVE INCOME TABLEPERTAINING TO THE PERIOD ENDING ON 31ST DECEMBER 2013
(All amounts expressed in “TL”)
Note Current Period Previous Period
References1st January -
31st December 20131st January -
31st December 2012
PROFIT OR LOSS PART
Net Sales Note 31 183.149.412 181.110.537
Cost of Sales (-) Note 31 (114.479.281) (118.211.655)
GROSS PROFIT / LOSS 68.670.131 62.898.882
General Administrative Expenses (-) Note 33 (12.924.945) (12.325.703)
Sales and Marketing Department Expenses (-) Note 33 (53.706.644) (49.692.167)
Research and Development Expenses (-) Note 33 (1.728.476) (1.562.144)
Other Operating Incomes Note 34 9.789.985 16.176.145
Other Operating Expenses (-) Note 34 (3.711.048) (9.526.203)
OPERATING PROFIT / LOSS 6.389.003 5.968.810
Investing Activities from Incomes Note 35 179.161 -
Investing Activities from Expenses (-) Note 35 - (658.736)
Profit/Loss Share on Investments Accounted by Equity Method Note 4/b 770.510 663.176
OPERATING PROFIT/LOSS 7.338.674 5.973.250
Financial Expenses (-) Note 37 (10.439.290) (2.188.426)
NET PROFIT/LOSS BEFORE TAX (3.100.616) 3.784.824
Continuing Operations Tax Expenses/Incomes 179.691 (778.639)
Tax Expense/Income of the Period Note 40 - (758.783)
Deferred Tax Expenses/Incomes Note 40 179.691 (19.856)
CONTINUING OPERATIONS PROFIT/LOSS FOR THE PERIOD (2.920.925) 3.006.185
DISCONTINUING OPERATIONS PROFIT/LOSS FOR THE PERIOD - -
PROFIT/LOSS FOR THE PERIOD (2.920.925) 3.006.185
Earnings per Share Note 41 (0.001) 0.001
Earnings per Share from Continuing Operations (0.001) 0.001
Earnings per Share from Discontinuing Operations - -
OTHER COMPREHENSIVE INCOME
Not To Be Reclassified in Profit and Loss (327.468) 9.188.342
Increase/Decrease Intangible Fixed Assets Revaluation Note 30/d (171.271) 9.365.572
Actuarial Related to Benefits to Employees Loss/Earning Note 30/e (156.197) (177.230)
To be reclassified as Profit or Loss - -
OTHER COMPREHENSIVE INCOME (327.468) 9.188.342
TOTAL COMPREHENSIVE INCOME (3.248.393) 12.194.527
54 55
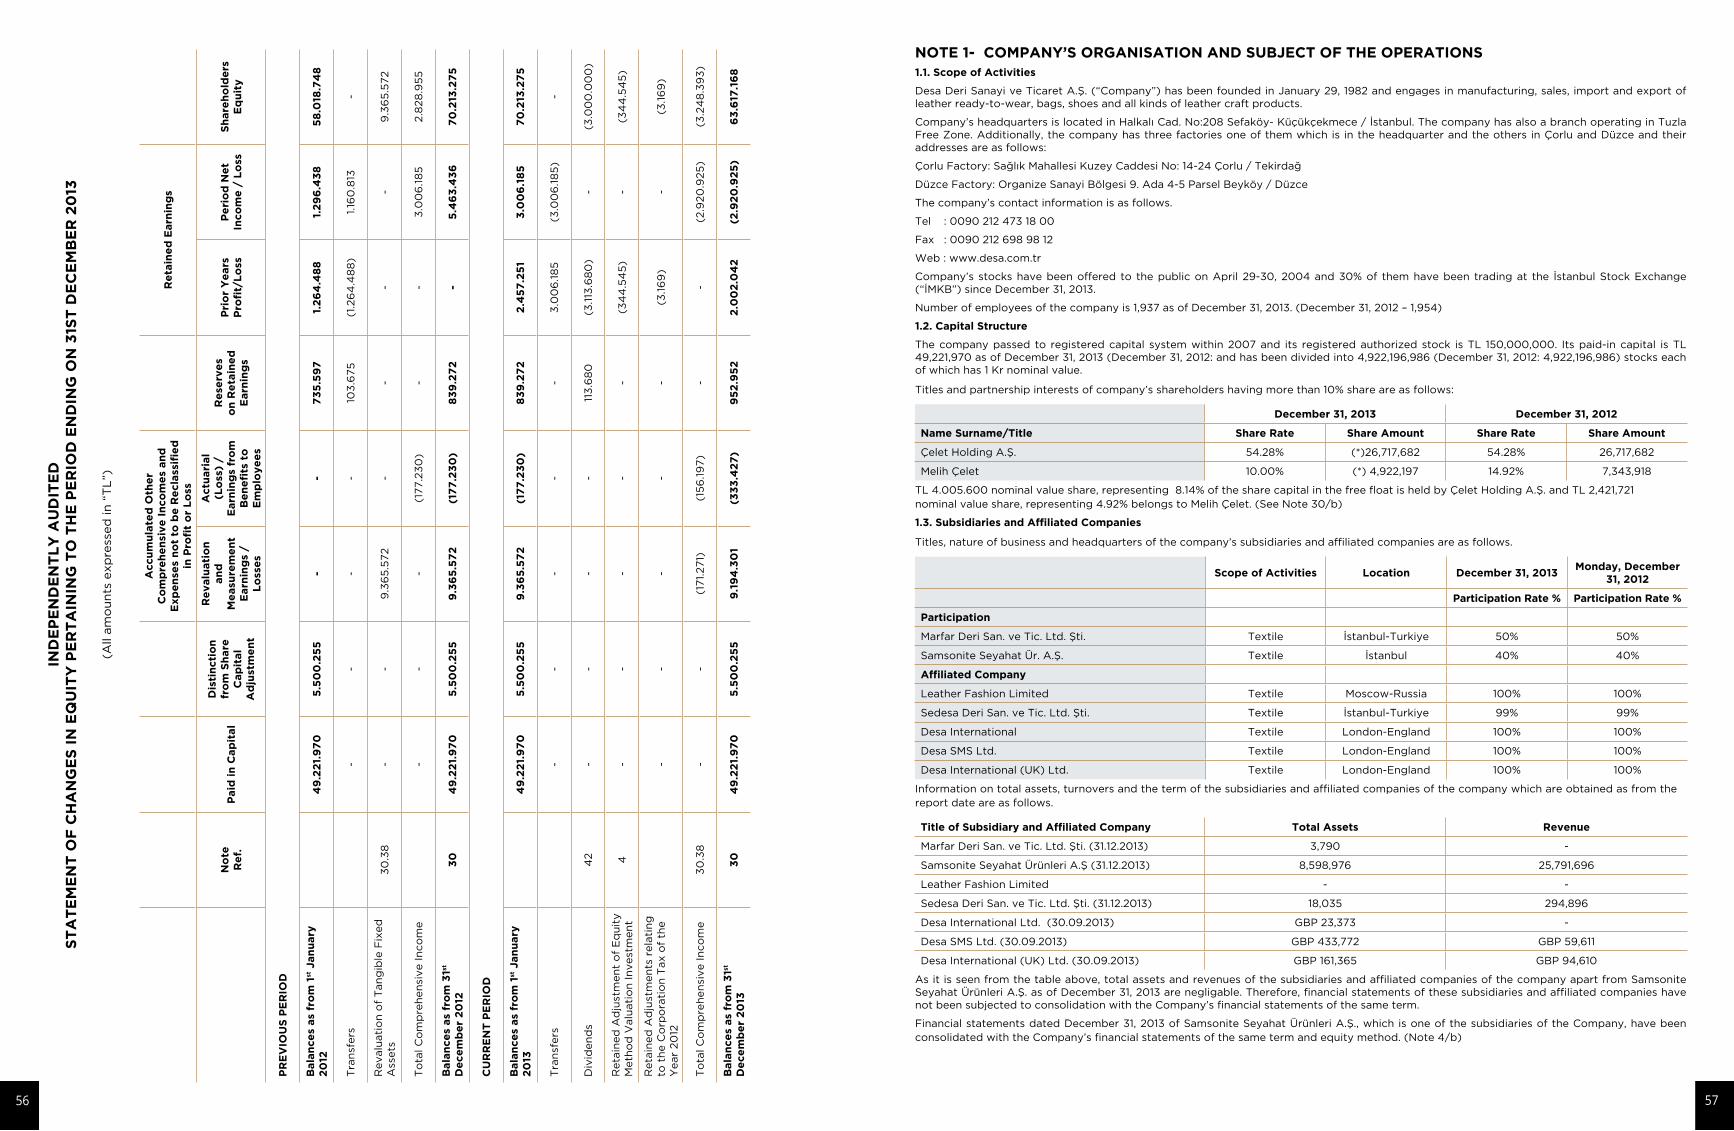
NOTE 1- COMPANY’S ORGANISATION AND SUBJECT OF THE OPERATIONS1.1. Scope of Activities
Desa Deri Sanayi ve Ticaret A.Ş. (“Company”) has been founded in January 29, 1982 and engages in manufacturing, sales, import and export of leather ready-to-wear, bags, shoes and all kinds of leather craft products.
Company’s headquarters is located in Halkalı Cad. No:208 Sefaköy- Küçükçekmece / İstanbul. The company has also a branch operating in Tuzla Free Zone. Additionally, the company has three factories one of them which is in the headquarter and the others in Çorlu and Düzce and their addresses are as follows:
Çorlu Factory: Sağlık Mahallesi Kuzey Caddesi No: 14-24 Çorlu / Tekirdağ
Düzce Factory: Organize Sanayi Bölgesi 9. Ada 4-5 Parsel Beyköy / Düzce
The company’s contact information is as follows.
Tel : 0090 212 473 18 00
Fax : 0090 212 698 98 12
Web : www.desa.com.tr
Company’s stocks have been offered to the public on April 29-30, 2004 and 30% of them have been trading at the İstanbul Stock Exchange (“İMKB”) since December 31, 2013.
Number of employees of the company is 1,937 as of December 31, 2013. (December 31, 2012 – 1,954)
1.2. Capital Structure
The company passed to registered capital system within 2007 and its registered authorized stock is TL 150,000,000. Its paid-in capital is TL 49,221,970 as of December 31, 2013 (December 31, 2012: and has been divided into 4,922,196,986 (December 31, 2012: 4,922,196,986) stocks each of which has 1 Kr nominal value.
Titles and partnership interests of company’s shareholders having more than 10% share are as follows:
December 31, 2013 December 31, 2012
Name Surname/Title Share Rate Share Amount Share Rate Share Amount
Çelet Holding A.Ş. 54.28% (*)26,717,682 54.28% 26,717,682
Melih Çelet 10.00% (*) 4,922,197 14.92% 7,343,918
TL 4.005.600 nominal value share, representing 8.14% of the share capital in the free float is held by Çelet Holding A.Ş. and TL 2,421,721 nominal value share, representing 4.92% belongs to Melih Çelet. (See Note 30/b)
1.3. Subsidiaries and Affiliated Companies
Titles, nature of business and headquarters of the company’s subsidiaries and affiliated companies are as follows.
Scope of Activities Location December 31, 2013
Monday, December 31, 2012
Participation Rate % Participation Rate %
Participation
Marfar Deri San. ve Tic. Ltd. Şti. Textile İstanbul-Turkiye 50% 50%
Samsonite Seyahat Ür. A.Ş. Textile İstanbul 40% 40%
Affiliated Company
Leather Fashion Limited Textile Moscow-Russia 100% 100%
Sedesa Deri San. ve Tic. Ltd. Şti. Textile İstanbul-Turkiye 99% 99%
Desa International Textile London-England 100% 100%
Desa SMS Ltd. Textile London-England 100% 100%
Desa International (UK) Ltd. Textile London-England 100% 100%
Information on total assets, turnovers and the term of the subsidiaries and affiliated companies of the company which are obtained as from the report date are as follows.
Title of Subsidiary and Affiliated Company Total Assets Revenue
Marfar Deri San. ve Tic. Ltd. Şti. (31.12.2013) 3,790 -
Samsonite Seyahat Ürünleri A.Ş (31.12.2013) 8,598,976 25,791,696
Leather Fashion Limited - -
Sedesa Deri San. ve Tic. Ltd. Şti. (31.12.2013) 18,035 294,896
Desa International Ltd. (30.09.2013) GBP 23,373 -
Desa SMS Ltd. (30.09.2013) GBP 433,772 GBP 59,611
Desa International (UK) Ltd. (30.09.2013) GBP 161,365 GBP 94,610
As it is seen from the table above, total assets and revenues of the subsidiaries and affiliated companies of the company apart from Samsonite Seyahat Ürünleri A.Ş. as of December 31, 2013 are negligable. Therefore, financial statements of these subsidiaries and affiliated companies have not been subjected to consolidation with the Company’s financial statements of the same term.
Financial statements dated December 31, 2013 of Samsonite Seyahat Ürünleri A.Ş., which is one of the subsidiaries of the Company, have been consolidated with the Company’s financial statements of the same term and equity method. (Note 4/b)
IND
EP
EN
DE
NT
LY
AU
DIT
ED
S
TA
TE
ME
NT
OF
CH
AN
GE
S I
N E
QU
ITY
PE
RT
AIN
ING
TO
TH
E P
ER
IOD
EN
DIN
G O
N 3
1ST
DE
CE
MB
ER
20
13
(All
am
ou
nts
exp
ress
ed
in
“T
L”)
Accu
mu
late
d O
the
r C
om
pre
he
nsi
ve
In
co
me
s an
d
Exp
en
ses
no
t to
be
Re
cla
ssifi
ed
in
Pro
fit
or
Lo
ss
Re
tain
ed
Earn
ing
s
No
teR
ef.
Paid
in
Cap
ital
Dis
tin
cti
on
fr
om
Sh
are
C
ap
ital
Ad
just
me
nt
Re
valu
ati
on
an
d
Me
asu
rem
en
t E
arn
ing
s /
Lo
sse
s
Actu
ari
al
(Lo
ss)
/ E
arn
ing
s fr
om
B
en
efi
ts t
o
Em
plo
ye
es
Re
serv
es
on
Re
tain
ed
E
arn
ing
s
Pri
or
Ye
ars
P
rofi
t/L
oss
Pe
rio
d N
et
Inco
me
/ L
oss
Sh
are
ho
lde
rs
Eq
uit
y
PR
EV
IOU
S P
ER
IOD
Bala
nce
s as
fro
m 1
st J
an
uary
2
012
4
9.2
21.
97
05
.50
0.2
55
--
73
5.5
97
1.2
64
.48
81.
29
6.4
38
58
.018
.74
8
Tra
nsf
ers
-
--
-10
3.6
75
(1.2
64
.48
8)
1.16
0.8
13-
Revalu
ati
on
of
Tan
gib
le F
ixed
A
ssets
30
.38
--
9.3
65
.572
--
--
9.3
65
.572
To
tal C
om
pre
hen
sive In
co
me
--
-(1
77.2
30
)-
-3
.00
6.1
85
2.8
28
.95
5
Bala
nce
s as
fro
m 3
1st
De
ce
mb
er
20
12
30
49
.22
1.9
70
5.5
00
.25
59
.36
5.5
72
(17
7.2
30
)8
39
.27
2-
5.4
63
.43
67
0.2
13.2
75
CU
RR
EN
T P
ER
IOD
Bala
nce
s as
fro
m 1
st J
an
uary
2
013
49
.22
1.9
70
5.5
00
.25
59
.36
5.5
72
(17
7.2
30
)8
39
.27
22
.45
7.2
51
3.0
06
.18
57
0.2
13.2
75
Tra
nsf
ers
-
--
--
3.0
06
.18
5(3
.00
6.1
85
)-
Div
iden
ds
42
--
--
113
.68
0(3
.113
.68
0)
-(3
.00
0.0
00
)
Reta
ined
Ad
just
men
t o
f E
qu
ity
Meth
od
Valu
ati
on
In
vest
men
t 4
--
--
-(3
44
.54
5)
-(3
44
.54
5)
Reta
ined
Ad
just
men
ts r
ela
tin
g
to t
he C
orp
ora
tio
n T
ax o
f th
e
Year
20
12
--
--
-(3
.16
9)
-(3
.16
9)
To
tal C
om
pre
hen
sive In
co
me
30
.38
--
(171.
271)
(15
6.1
97)
--
(2.9
20
.925
)(3
.24
8.3
93
)
Bala
nce
s as
fro
m 3
1st
De
ce
mb
er
20
133
04
9.2
21.
97
05
.50
0.2
55
9.1
94
.30
1(3
33
.42
7)
95
2.9
52
2.0
02
.04
2(2
.92
0.9
25
)6
3.6
17.1
68
56 57
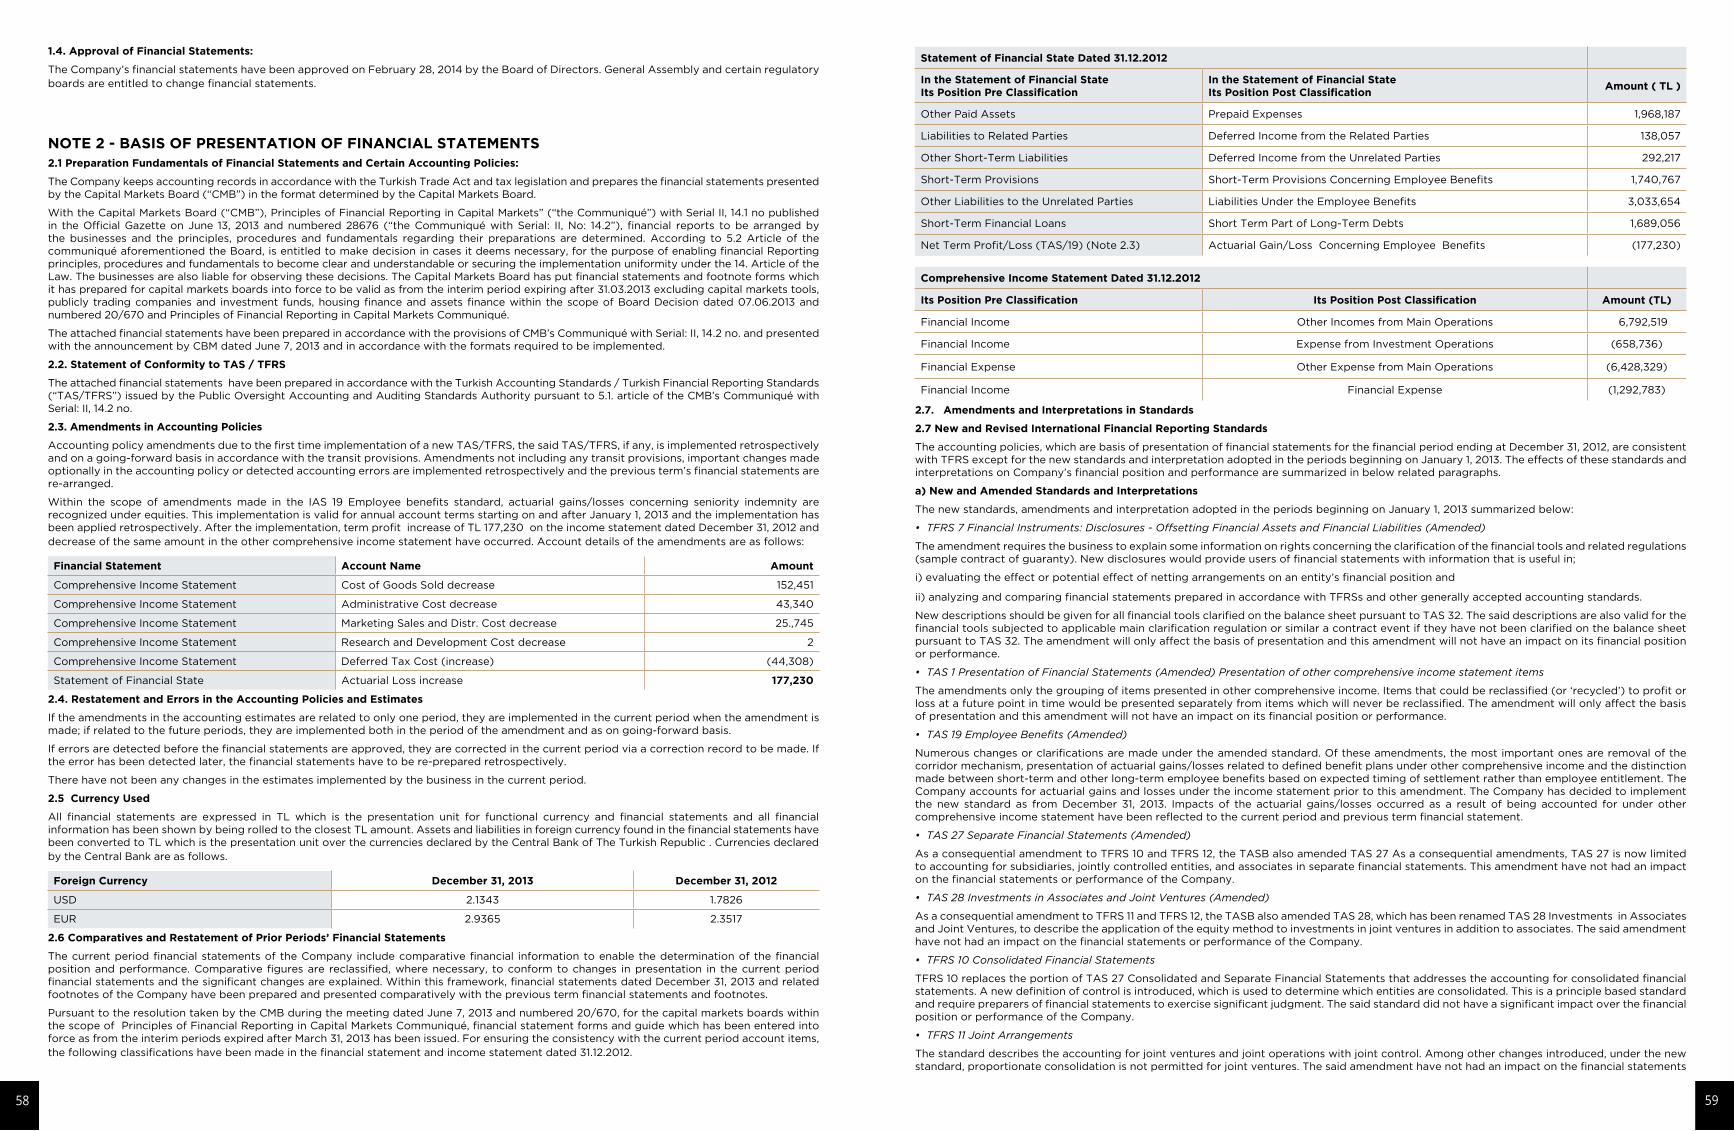
Statement of Financial State Dated 31.12.2012
In the Statement of Financial StateIts Position Pre Classification
In the Statement of Financial StateIts Position Post Classification
Amount ( TL )
Other Paid Assets Prepaid Expenses 1,968,187
Liabilities to Related Parties Deferred Income from the Related Parties 138,057
Other Short-Term Liabilities Deferred Income from the Unrelated Parties 292,217
Short-Term Provisions Short-Term Provisions Concerning Employee Benefits 1,740,767
Other Liabilities to the Unrelated Parties Liabilities Under the Employee Benefits 3,033,654
Short-Term Financial Loans Short Term Part of Long-Term Debts 1,689,056
Net Term Profit/Loss (TAS/19) (Note 2.3) Actuarial Gain/Loss Concerning Employee Benefits (177,230)
Comprehensive Income Statement Dated 31.12.2012
Its Position Pre Classification Its Position Post Classification Amount (TL)
Financial Income Other Incomes from Main Operations 6,792,519
Financial Income Expense from Investment Operations (658,736)
Financial Expense Other Expense from Main Operations (6,428,329)
Financial Income Financial Expense (1,292,783)
2.7. Amendments and Interpretations in Standards
2.7 New and Revised International Financial Reporting Standards
The accounting policies, which are basis of presentation of financial statements for the financial period ending at December 31, 2012, are consistent with TFRS except for the new standards and interpretation adopted in the periods beginning on January 1, 2013. The effects of these standards and interpretations on Company’s financial position and performance are summarized in below related paragraphs.
a) New and Amended Standards and Interpretations
The new standards, amendments and interpretation adopted in the periods beginning on January 1, 2013 summarized below:
• TFRS 7 Financial Instruments: Disclosures - Offsetting Financial Assets and Financial Liabilities (Amended)
The amendment requires the business to explain some information on rights concerning the clarification of the financial tools and related regulations (sample contract of guaranty). New disclosures would provide users of financial statements with information that is useful in;
i) evaluating the effect or potential effect of netting arrangements on an entity’s financial position and
ii) analyzing and comparing financial statements prepared in accordance with TFRSs and other generally accepted accounting standards.
New descriptions should be given for all financial tools clarified on the balance sheet pursuant to TAS 32. The said descriptions are also valid for the financial tools subjected to applicable main clarification regulation or similar a contract event if they have not been clarified on the balance sheet pursuant to TAS 32. The amendment will only affect the basis of presentation and this amendment will not have an impact on its financial position or performance.
• TAS 1 Presentation of Financial Statements (Amended) Presentation of other comprehensive income statement items
The amendments only the grouping of items presented in other comprehensive income. Items that could be reclassified (or ‘recycled’) to profit or loss at a future point in time would be presented separately from items which will never be reclassified. The amendment will only affect the basis of presentation and this amendment will not have an impact on its financial position or performance.
• TAS 19 Employee Benefits (Amended)
Numerous changes or clarifications are made under the amended standard. Of these amendments, the most important ones are removal of the corridor mechanism, presentation of actuarial gains/losses related to defined benefit plans under other comprehensive income and the distinction made between short-term and other long-term employee benefits based on expected timing of settlement rather than employee entitlement. The Company accounts for actuarial gains and losses under the income statement prior to this amendment. The Company has decided to implement the new standard as from December 31, 2013. Impacts of the actuarial gains/losses occurred as a result of being accounted for under other comprehensive income statement have been reflected to the current period and previous term financial statement.
• TAS 27 Separate Financial Statements (Amended)
As a consequential amendment to TFRS 10 and TFRS 12, the TASB also amended TAS 27 As a consequential amendments, TAS 27 is now limited to accounting for subsidiaries, jointly controlled entities, and associates in separate financial statements. This amendment have not had an impact on the financial statements or performance of the Company.
• TAS 28 Investments in Associates and Joint Ventures (Amended)
As a consequential amendment to TFRS 11 and TFRS 12, the TASB also amended TAS 28, which has been renamed TAS 28 Investments in Associates and Joint Ventures, to describe the application of the equity method to investments in joint ventures in addition to associates. The said amendment have not had an impact on the financial statements or performance of the Company.
• TFRS 10 Consolidated Financial Statements
TFRS 10 replaces the portion of TAS 27 Consolidated and Separate Financial Statements that addresses the accounting for consolidated financial statements. A new definition of control is introduced, which is used to determine which entities are consolidated. This is a principle based standard and require preparers of financial statements to exercise significant judgment. The said standard did not have a significant impact over the financial position or performance of the Company.
• TFRS 11 Joint Arrangements
The standard describes the accounting for joint ventures and joint operations with joint control. Among other changes introduced, under the new standard, proportionate consolidation is not permitted for joint ventures. The said amendment have not had an impact on the financial statements
1.4. Approval of Financial Statements:
The Company’s financial statements have been approved on February 28, 2014 by the Board of Directors. General Assembly and certain regulatory boards are entitled to change financial statements.
NOTE 2 - BASIS OF PRESENTATION OF FINANCIAL STATEMENTS2.1 Preparation Fundamentals of Financial Statements and Certain Accounting Policies:
The Company keeps accounting records in accordance with the Turkish Trade Act and tax legislation and prepares the financial statements presented by the Capital Markets Board (“CMB”) in the format determined by the Capital Markets Board.
With the Capital Markets Board (“CMB”), Principles of Financial Reporting in Capital Markets” (“the Communiqué”) with Serial II, 14.1 no published in the Official Gazette on June 13, 2013 and numbered 28676 (“the Communiqué with Serial: II, No: 14.2”), financial reports to be arranged by the businesses and the principles, procedures and fundamentals regarding their preparations are determined. According to 5.2 Article of the communiqué aforementioned the Board, is entitled to make decision in cases it deems necessary, for the purpose of enabling financial Reporting principles, procedures and fundamentals to become clear and understandable or securing the implementation uniformity under the 14. Article of the Law. The businesses are also liable for observing these decisions. The Capital Markets Board has put financial statements and footnote forms which it has prepared for capital markets boards into force to be valid as from the interim period expiring after 31.03.2013 excluding capital markets tools, publicly trading companies and investment funds, housing finance and assets finance within the scope of Board Decision dated 07.06.2013 and numbered 20/670 and Principles of Financial Reporting in Capital Markets Communiqué.
The attached financial statements have been prepared in accordance with the provisions of CMB’s Communiqué with Serial: II, 14.2 no. and presented with the announcement by CBM dated June 7, 2013 and in accordance with the formats required to be implemented.
2.2. Statement of Conformity to TAS / TFRS
The attached financial statements have been prepared in accordance with the Turkish Accounting Standards / Turkish Financial Reporting Standards (“TAS/TFRS”) issued by the Public Oversight Accounting and Auditing Standards Authority pursuant to 5.1. article of the CMB’s Communiqué with Serial: II, 14.2 no.
2.3. Amendments in Accounting Policies
Accounting policy amendments due to the first time implementation of a new TAS/TFRS, the said TAS/TFRS, if any, is implemented retrospectively and on a going-forward basis in accordance with the transit provisions. Amendments not including any transit provisions, important changes made optionally in the accounting policy or detected accounting errors are implemented retrospectively and the previous term’s financial statements are re-arranged.
Within the scope of amendments made in the IAS 19 Employee benefits standard, actuarial gains/losses concerning seniority indemnity are recognized under equities. This implementation is valid for annual account terms starting on and after January 1, 2013 and the implementation has been applied retrospectively. After the implementation, term profit increase of TL 177,230 on the income statement dated December 31, 2012 and decrease of the same amount in the other comprehensive income statement have occurred. Account details of the amendments are as follows:
Financial Statement Account Name Amount
Comprehensive Income Statement Cost of Goods Sold decrease 152,451
Comprehensive Income Statement Administrative Cost decrease 43,340
Comprehensive Income Statement Marketing Sales and Distr. Cost decrease 25.,745
Comprehensive Income Statement Research and Development Cost decrease 2
Comprehensive Income Statement Deferred Tax Cost (increase) (44,308)
Statement of Financial State Actuarial Loss increase 177,230
2.4. Restatement and Errors in the Accounting Policies and Estimates
If the amendments in the accounting estimates are related to only one period, they are implemented in the current period when the amendment is made; if related to the future periods, they are implemented both in the period of the amendment and as on going-forward basis.
If errors are detected before the financial statements are approved, they are corrected in the current period via a correction record to be made. If the error has been detected later, the financial statements have to be re-prepared retrospectively.
There have not been any changes in the estimates implemented by the business in the current period.
2.5 Currency Used
All financial statements are expressed in TL which is the presentation unit for functional currency and financial statements and all financial information has been shown by being rolled to the closest TL amount. Assets and liabilities in foreign currency found in the financial statements have been converted to TL which is the presentation unit over the currencies declared by the Central Bank of The Turkish Republic . Currencies declared by the Central Bank are as follows.
Foreign Currency December 31, 2013 December 31, 2012
USD 2.1343 1.7826
EUR 2.9365 2.3517
2.6 Comparatives and Restatement of Prior Periods’ Financial Statements
The current period financial statements of the Company include comparative financial information to enable the determination of the financial position and performance. Comparative figures are reclassified, where necessary, to conform to changes in presentation in the current period financial statements and the significant changes are explained. Within this framework, financial statements dated December 31, 2013 and related footnotes of the Company have been prepared and presented comparatively with the previous term financial statements and footnotes.
Pursuant to the resolution taken by the CMB during the meeting dated June 7, 2013 and numbered 20/670, for the capital markets boards within the scope of Principles of Financial Reporting in Capital Markets Communiqué, financial statement forms and guide which has been entered into force as from the interim periods expired after March 31, 2013 has been issued. For ensuring the consistency with the current period account items, the following classifications have been made in the financial statement and income statement dated 31.12.2012.
58 59
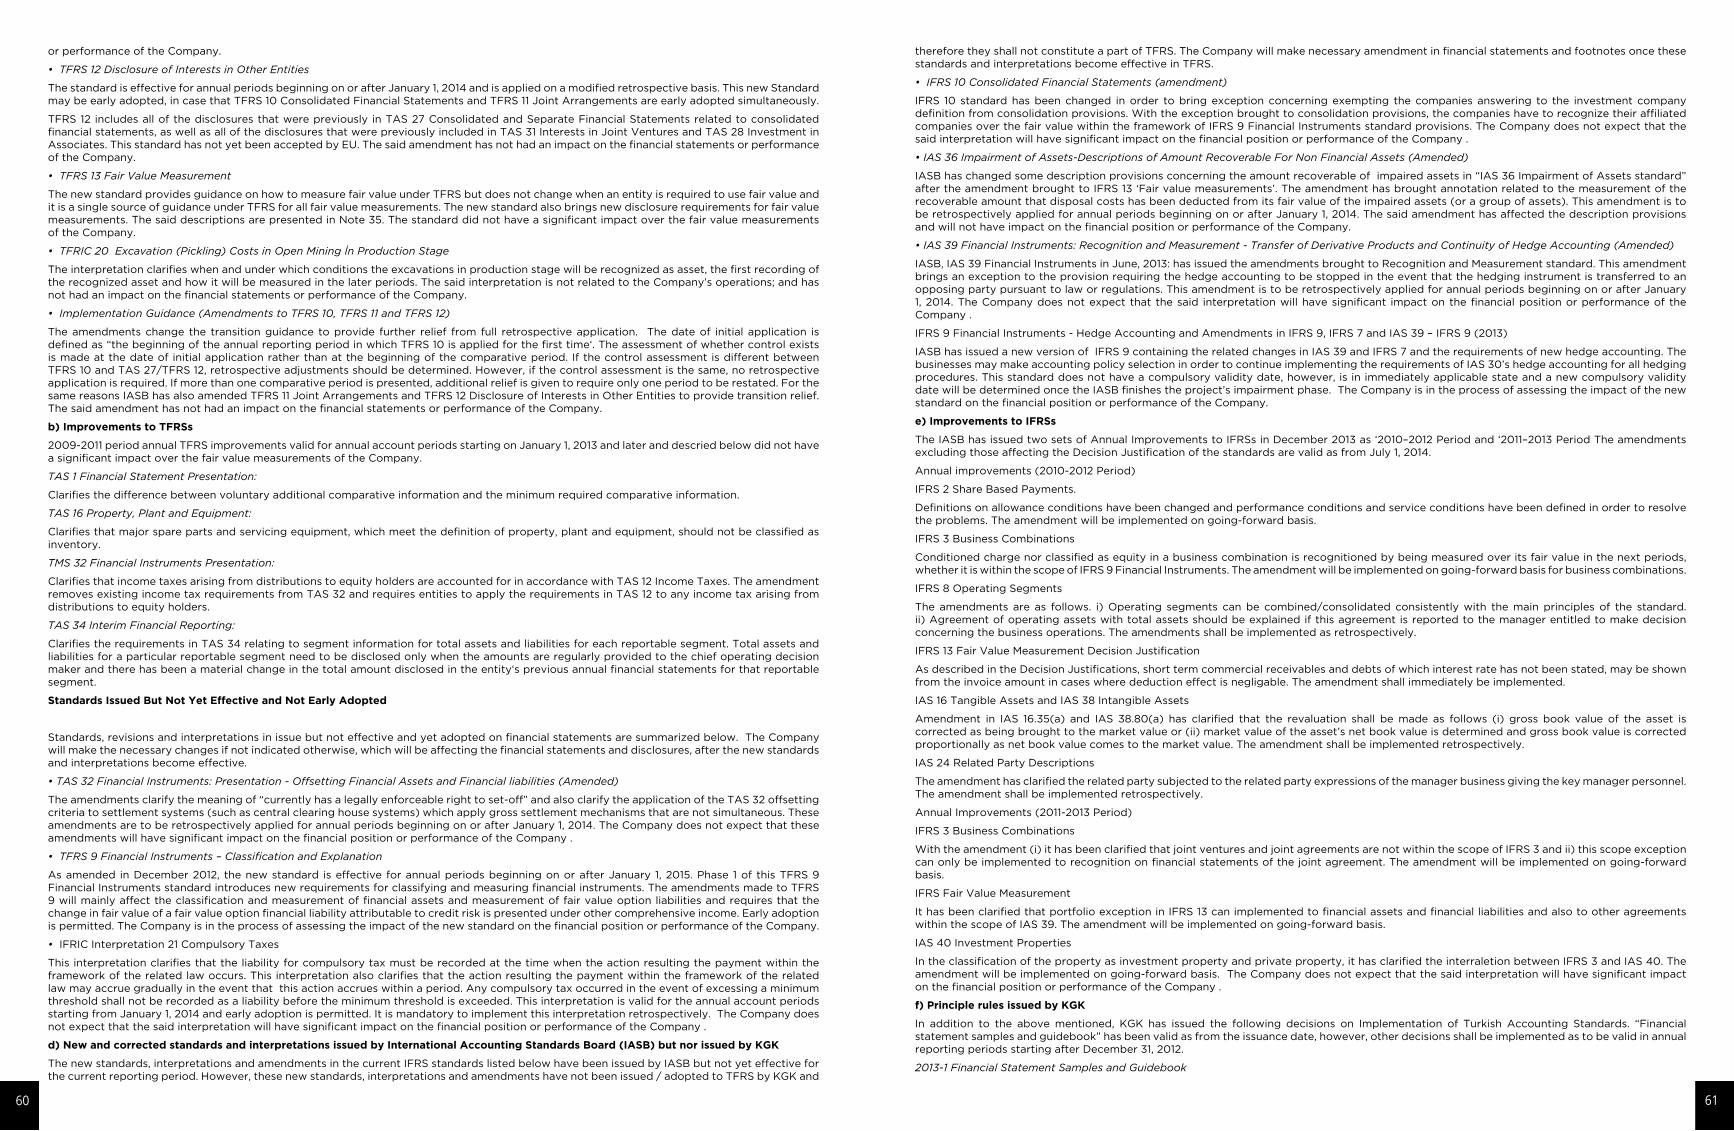
therefore they shall not constitute a part of TFRS. The Company will make necessary amendment in financial statements and footnotes once these standards and interpretations become effective in TFRS.
• IFRS 10 Consolidated Financial Statements (amendment)
IFRS 10 standard has been changed in order to bring exception concerning exempting the companies answering to the investment company definition from consolidation provisions. With the exception brought to consolidation provisions, the companies have to recognize their affiliated companies over the fair value within the framework of IFRS 9 Financial Instruments standard provisions. The Company does not expect that the said interpretation will have significant impact on the financial position or performance of the Company .
• IAS 36 Impairment of Assets-Descriptions of Amount Recoverable For Non Financial Assets (Amended)
IASB has changed some description provisions concerning the amount recoverable of impaired assets in “IAS 36 Impairment of Assets standard” after the amendment brought to IFRS 13 ‘Fair value measurements’. The amendment has brought annotation related to the measurement of the recoverable amount that disposal costs has been deducted from its fair value of the impaired assets (or a group of assets). This amendment is to be retrospectively applied for annual periods beginning on or after January 1, 2014. The said amendment has affected the description provisions and will not have impact on the financial position or performance of the Company.
• IAS 39 Financial Instruments: Recognition and Measurement - Transfer of Derivative Products and Continuity of Hedge Accounting (Amended)
IASB, IAS 39 Financial Instruments in June, 2013: has issued the amendments brought to Recognition and Measurement standard. This amendment brings an exception to the provision requiring the hedge accounting to be stopped in the event that the hedging instrument is transferred to an opposing party pursuant to law or regulations. This amendment is to be retrospectively applied for annual periods beginning on or after January 1, 2014. The Company does not expect that the said interpretation will have significant impact on the financial position or performance of the Company .
IFRS 9 Financial Instruments - Hedge Accounting and Amendments in IFRS 9, IFRS 7 and IAS 39 – IFRS 9 (2013)
IASB has issued a new version of IFRS 9 containing the related changes in IAS 39 and IFRS 7 and the requirements of new hedge accounting. The businesses may make accounting policy selection in order to continue implementing the requirements of IAS 30’s hedge accounting for all hedging procedures. This standard does not have a compulsory validity date, however, is in immediately applicable state and a new compulsory validity date will be determined once the IASB finishes the project’s impairment phase. The Company is in the process of assessing the impact of the new standard on the financial position or performance of the Company.
e) Improvements to IFRSs
The IASB has issued two sets of Annual Improvements to IFRSs in December 2013 as ‘2010–2012 Period and ‘2011–2013 Period The amendments excluding those affecting the Decision Justification of the standards are valid as from July 1, 2014.
Annual improvements (2010-2012 Period)
IFRS 2 Share Based Payments.
Definitions on allowance conditions have been changed and performance conditions and service conditions have been defined in order to resolve the problems. The amendment will be implemented on going-forward basis.
IFRS 3 Business Combinations
Conditioned charge nor classified as equity in a business combination is recognitioned by being measured over its fair value in the next periods, whether it is within the scope of IFRS 9 Financial Instruments. The amendment will be implemented on going-forward basis for business combinations.
IFRS 8 Operating Segments
The amendments are as follows. i) Operating segments can be combined/consolidated consistently with the main principles of the standard. ii) Agreement of operating assets with total assets should be explained if this agreement is reported to the manager entitled to make decision concerning the business operations. The amendments shall be implemented as retrospectively.
IFRS 13 Fair Value Measurement Decision Justification
As described in the Decision Justifications, short term commercial receivables and debts of which interest rate has not been stated, may be shown from the invoice amount in cases where deduction effect is negligable. The amendment shall immediately be implemented.
IAS 16 Tangible Assets and IAS 38 Intangible Assets
Amendment in IAS 16.35(a) and IAS 38.80(a) has clarified that the revaluation shall be made as follows (i) gross book value of the asset is corrected as being brought to the market value or (ii) market value of the asset’s net book value is determined and gross book value is corrected proportionally as net book value comes to the market value. The amendment shall be implemented retrospectively.
IAS 24 Related Party Descriptions
The amendment has clarified the related party subjected to the related party expressions of the manager business giving the key manager personnel. The amendment shall be implemented retrospectively.
Annual Improvements (2011-2013 Period)
IFRS 3 Business Combinations
With the amendment (i) it has been clarified that joint ventures and joint agreements are not within the scope of IFRS 3 and ii) this scope exception can only be implemented to recognition on financial statements of the joint agreement. The amendment will be implemented on going-forward basis.
IFRS Fair Value Measurement
It has been clarified that portfolio exception in IFRS 13 can implemented to financial assets and financial liabilities and also to other agreements within the scope of IAS 39. The amendment will be implemented on going-forward basis.
IAS 40 Investment Properties
In the classification of the property as investment property and private property, it has clarified the interraletion between IFRS 3 and IAS 40. The amendment will be implemented on going-forward basis. The Company does not expect that the said interpretation will have significant impact on the financial position or performance of the Company .
f) Principle rules issued by KGK
In addition to the above mentioned, KGK has issued the following decisions on Implementation of Turkish Accounting Standards. “Financial statement samples and guidebook” has been valid as from the issuance date, however, other decisions shall be implemented as to be valid in annual reporting periods starting after December 31, 2012.
2013-1 Financial Statement Samples and Guidebook
or performance of the Company.
• TFRS 12 Disclosure of Interests in Other Entities
The standard is effective for annual periods beginning on or after January 1, 2014 and is applied on a modified retrospective basis. This new Standard may be early adopted, in case that TFRS 10 Consolidated Financial Statements and TFRS 11 Joint Arrangements are early adopted simultaneously.
TFRS 12 includes all of the disclosures that were previously in TAS 27 Consolidated and Separate Financial Statements related to consolidated financial statements, as well as all of the disclosures that were previously included in TAS 31 Interests in Joint Ventures and TAS 28 Investment in Associates. This standard has not yet been accepted by EU. The said amendment has not had an impact on the financial statements or performance of the Company.
• TFRS 13 Fair Value Measurement
The new standard provides guidance on how to measure fair value under TFRS but does not change when an entity is required to use fair value and it is a single source of guidance under TFRS for all fair value measurements. The new standard also brings new disclosure requirements for fair value measurements. The said descriptions are presented in Note 35. The standard did not have a significant impact over the fair value measurements of the Company.
• TFRIC 20 Excavation (Pickling) Costs in Open Mining İn Production Stage
The interpretation clarifies when and under which conditions the excavations in production stage will be recognized as asset, the first recording of the recognized asset and how it will be measured in the later periods. The said interpretation is not related to the Company’s operations; and has not had an impact on the financial statements or performance of the Company.
• Implementation Guidance (Amendments to TFRS 10, TFRS 11 and TFRS 12)
The amendments change the transition guidance to provide further relief from full retrospective application. The date of initial application is defined as “the beginning of the annual reporting period in which TFRS 10 is applied for the first time‘. The assessment of whether control exists is made at the date of initial application rather than at the beginning of the comparative period. If the control assessment is different between TFRS 10 and TAS 27/TFRS 12, retrospective adjustments should be determined. However, if the control assessment is the same, no retrospective application is required. If more than one comparative period is presented, additional relief is given to require only one period to be restated. For the same reasons IASB has also amended TFRS 11 Joint Arrangements and TFRS 12 Disclosure of Interests in Other Entities to provide transition relief. The said amendment has not had an impact on the financial statements or performance of the Company.
b) Improvements to TFRSs
2009-2011 period annual TFRS improvements valid for annual account periods starting on January 1, 2013 and later and descried below did not have a significant impact over the fair value measurements of the Company.
TAS 1 Financial Statement Presentation:
Clarifies the difference between voluntary additional comparative information and the minimum required comparative information.
TAS 16 Property, Plant and Equipment:
Clarifies that major spare parts and servicing equipment, which meet the definition of property, plant and equipment, should not be classified as inventory.
TMS 32 Financial Instruments Presentation:
Clarifies that income taxes arising from distributions to equity holders are accounted for in accordance with TAS 12 Income Taxes. The amendment removes existing income tax requirements from TAS 32 and requires entities to apply the requirements in TAS 12 to any income tax arising from distributions to equity holders.
TAS 34 Interim Financial Reporting:
Clarifies the requirements in TAS 34 relating to segment information for total assets and liabilities for each reportable segment. Total assets and liabilities for a particular reportable segment need to be disclosed only when the amounts are regularly provided to the chief operating decision maker and there has been a material change in the total amount disclosed in the entity‘s previous annual financial statements for that reportable segment.
Standards Issued But Not Yet Effective and Not Early Adopted
Standards, revisions and interpretations in issue but not effective and yet adopted on financial statements are summarized below. The Company will make the necessary changes if not indicated otherwise, which will be affecting the financial statements and disclosures, after the new standards and interpretations become effective.
• TAS 32 Financial Instruments: Presentation - Offsetting Financial Assets and Financial liabilities (Amended)
The amendments clarify the meaning of “currently has a legally enforceable right to set-off” and also clarify the application of the TAS 32 offsetting criteria to settlement systems (such as central clearing house systems) which apply gross settlement mechanisms that are not simultaneous. These amendments are to be retrospectively applied for annual periods beginning on or after January 1, 2014. The Company does not expect that these amendments will have significant impact on the financial position or performance of the Company .
• TFRS 9 Financial Instruments – Classification and Explanation
As amended in December 2012, the new standard is effective for annual periods beginning on or after January 1, 2015. Phase 1 of this TFRS 9 Financial Instruments standard introduces new requirements for classifying and measuring financial instruments. The amendments made to TFRS 9 will mainly affect the classification and measurement of financial assets and measurement of fair value option liabilities and requires that the change in fair value of a fair value option financial liability attributable to credit risk is presented under other comprehensive income. Early adoption is permitted. The Company is in the process of assessing the impact of the new standard on the financial position or performance of the Company.
• IFRIC Interpretation 21 Compulsory Taxes
This interpretation clarifies that the liability for compulsory tax must be recorded at the time when the action resulting the payment within the framework of the related law occurs. This interpretation also clarifies that the action resulting the payment within the framework of the related law may accrue gradually in the event that this action accrues within a period. Any compulsory tax occurred in the event of excessing a minimum threshold shall not be recorded as a liability before the minimum threshold is exceeded. This interpretation is valid for the annual account periods starting from January 1, 2014 and early adoption is permitted. It is mandatory to implement this interpretation retrospectively. The Company does not expect that the said interpretation will have significant impact on the financial position or performance of the Company .
d) New and corrected standards and interpretations issued by International Accounting Standards Board (IASB) but nor issued by KGK
The new standards, interpretations and amendments in the current IFRS standards listed below have been issued by IASB but not yet effective for the current reporting period. However, these new standards, interpretations and amendments have not been issued / adopted to TFRS by KGK and
60 61
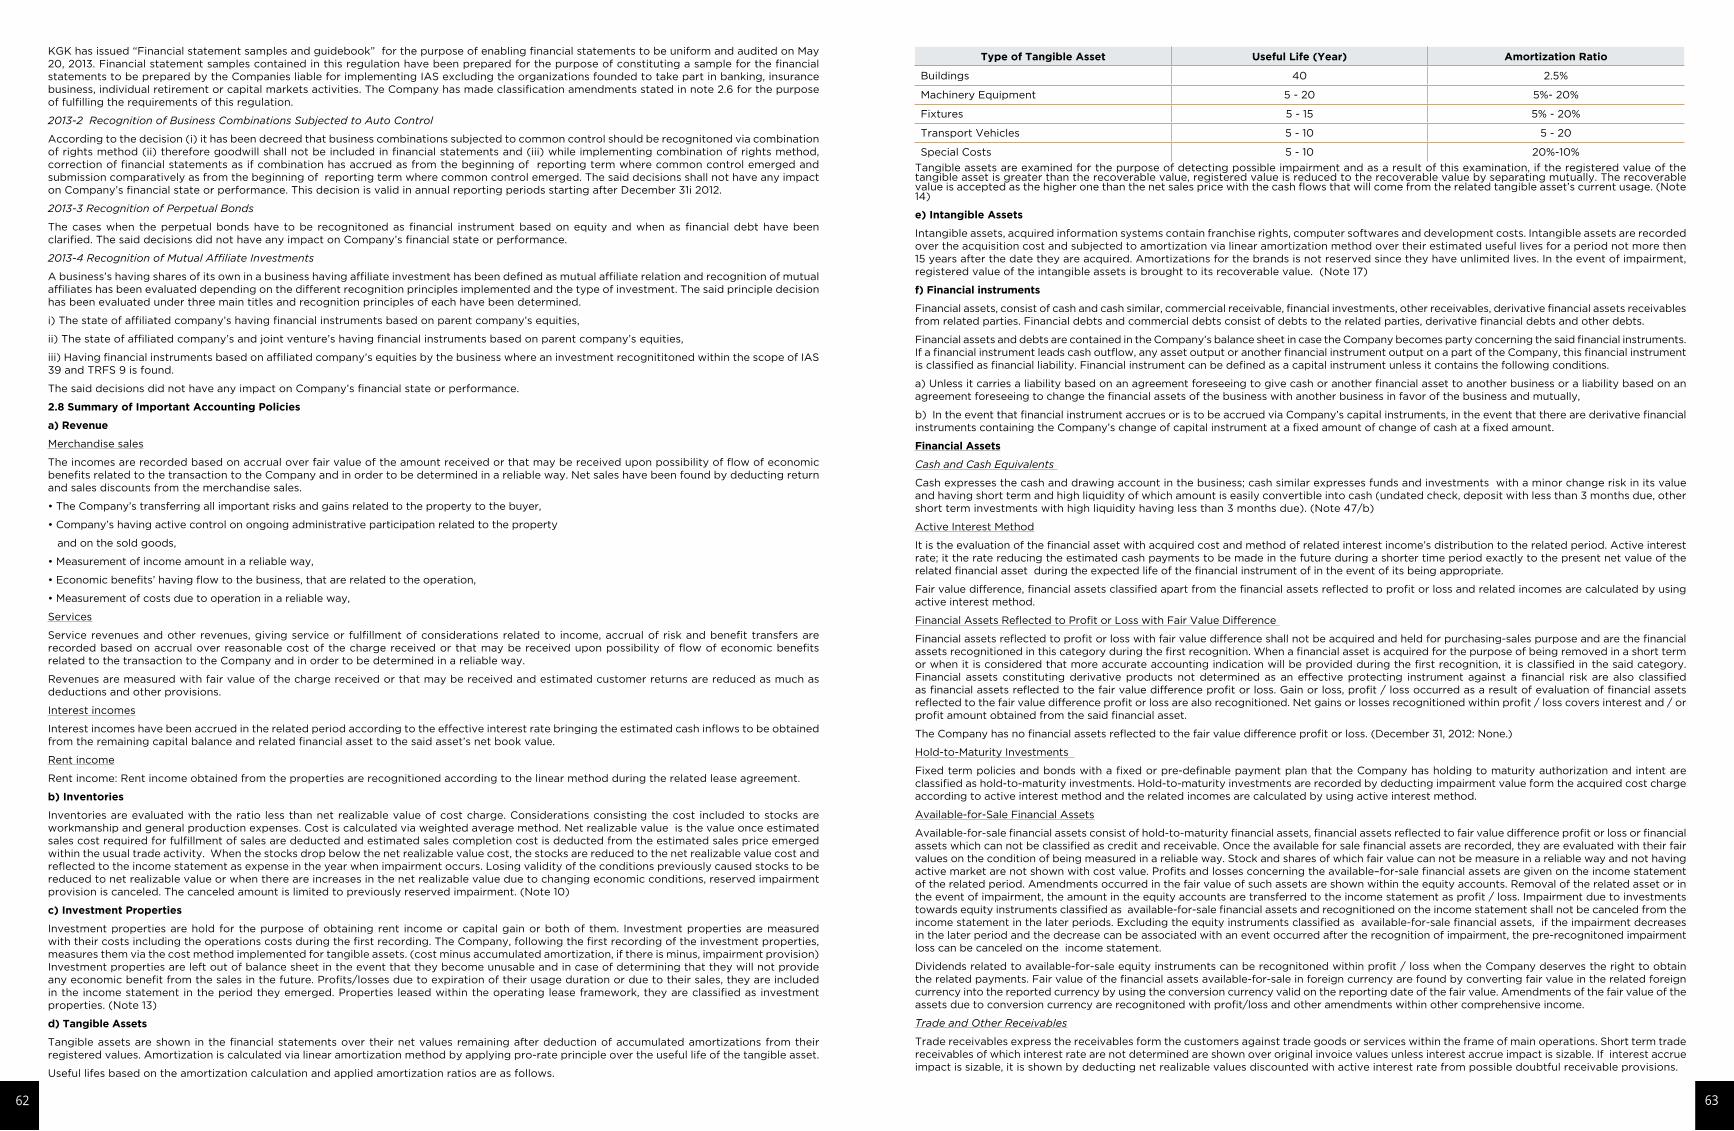
Type of Tangible Asset Useful Life (Year) Amortization Ratio
Buildings 40 2.5%
Machinery Equipment 5 - 20 5%- 20%
Fixtures 5 - 15 5% - 20%
Transport Vehicles 5 - 10 5 - 20
Special Costs 5 - 10 20%-10%
Tangible assets are examined for the purpose of detecting possible impairment and as a result of this examination, if the registered value of the tangible asset is greater than the recoverable value, registered value is reduced to the recoverable value by separating mutually. The recoverable value is accepted as the higher one than the net sales price with the cash flows that will come from the related tangible asset’s current usage. (Note 14)
e) Intangible Assets
Intangible assets, acquired information systems contain franchise rights, computer softwares and development costs. Intangible assets are recorded over the acquisition cost and subjected to amortization via linear amortization method over their estimated useful lives for a period not more then 15 years after the date they are acquired. Amortizations for the brands is not reserved since they have unlimited lives. In the event of impairment, registered value of the intangible assets is brought to its recoverable value. (Note 17)
f) Financial instruments
Financial assets, consist of cash and cash similar, commercial receivable, financial investments, other receivables, derivative financial assets receivables from related parties. Financial debts and commercial debts consist of debts to the related parties, derivative financial debts and other debts.
Financial assets and debts are contained in the Company’s balance sheet in case the Company becomes party concerning the said financial instruments. If a financial instrument leads cash outflow, any asset output or another financial instrument output on a part of the Company, this financial instrument is classified as financial liability. Financial instrument can be defined as a capital instrument unless it contains the following conditions.
a) Unless it carries a liability based on an agreement foreseeing to give cash or another financial asset to another business or a liability based on an agreement foreseeing to change the financial assets of the business with another business in favor of the business and mutually,
b) In the event that financial instrument accrues or is to be accrued via Company’s capital instruments, in the event that there are derivative financial instruments containing the Company’s change of capital instrument at a fixed amount of change of cash at a fixed amount.
Financial Assets
Cash and Cash Equivalents
Cash expresses the cash and drawing account in the business; cash similar expresses funds and investments with a minor change risk in its value and having short term and high liquidity of which amount is easily convertible into cash (undated check, deposit with less than 3 months due, other short term investments with high liquidity having less than 3 months due). (Note 47/b)
Active Interest Method
It is the evaluation of the financial asset with acquired cost and method of related interest income’s distribution to the related period. Active interest rate; it the rate reducing the estimated cash payments to be made in the future during a shorter time period exactly to the present net value of the related financial asset during the expected life of the financial instrument of in the event of its being appropriate.
Fair value difference, financial assets classified apart from the financial assets reflected to profit or loss and related incomes are calculated by using active interest method.
Financial Assets Reflected to Profit or Loss with Fair Value Difference
Financial assets reflected to profit or loss with fair value difference shall not be acquired and held for purchasing-sales purpose and are the financial assets recognitioned in this category during the first recognition. When a financial asset is acquired for the purpose of being removed in a short term or when it is considered that more accurate accounting indication will be provided during the first recognition, it is classified in the said category. Financial assets constituting derivative products not determined as an effective protecting instrument against a financial risk are also classified as financial assets reflected to the fair value difference profit or loss. Gain or loss, profit / loss occurred as a result of evaluation of financial assets reflected to the fair value difference profit or loss are also recognitioned. Net gains or losses recognitioned within profit / loss covers interest and / or profit amount obtained from the said financial asset.
The Company has no financial assets reflected to the fair value difference profit or loss. (December 31, 2012: None.)
Hold-to-Maturity Investments
Fixed term policies and bonds with a fixed or pre-definable payment plan that the Company has holding to maturity authorization and intent are classified as hold-to-maturity investments. Hold-to-maturity investments are recorded by deducting impairment value form the acquired cost charge according to active interest method and the related incomes are calculated by using active interest method.
Available-for-Sale Financial Assets
Available-for-sale financial assets consist of hold-to-maturity financial assets, financial assets reflected to fair value difference profit or loss or financial assets which can not be classified as credit and receivable. Once the available for sale financial assets are recorded, they are evaluated with their fair values on the condition of being measured in a reliable way. Stock and shares of which fair value can not be measure in a reliable way and not having active market are not shown with cost value. Profits and losses concerning the available–for-sale financial assets are given on the income statement of the related period. Amendments occurred in the fair value of such assets are shown within the equity accounts. Removal of the related asset or in the event of impairment, the amount in the equity accounts are transferred to the income statement as profit / loss. Impairment due to investments towards equity instruments classified as available-for-sale financial assets and recognitioned on the income statement shall not be canceled from the income statement in the later periods. Excluding the equity instruments classified as available-for-sale financial assets, if the impairment decreases in the later period and the decrease can be associated with an event occurred after the recognition of impairment, the pre-recognitoned impairment loss can be canceled on the income statement.
Dividends related to available-for-sale equity instruments can be recognitoned within profit / loss when the Company deserves the right to obtain the related payments. Fair value of the financial assets available-for-sale in foreign currency are found by converting fair value in the related foreign currency into the reported currency by using the conversion currency valid on the reporting date of the fair value. Amendments of the fair value of the assets due to conversion currency are recognitoned with profit/loss and other amendments within other comprehensive income.
Trade and Other Receivables
Trade receivables express the receivables form the customers against trade goods or services within the frame of main operations. Short term trade receivables of which interest rate are not determined are shown over original invoice values unless interest accrue impact is sizable. If interest accrue impact is sizable, it is shown by deducting net realizable values discounted with active interest rate from possible doubtful receivable provisions.
KGK has issued “Financial statement samples and guidebook” for the purpose of enabling financial statements to be uniform and audited on May 20, 2013. Financial statement samples contained in this regulation have been prepared for the purpose of constituting a sample for the financial statements to be prepared by the Companies liable for implementing IAS excluding the organizations founded to take part in banking, insurance business, individual retirement or capital markets activities. The Company has made classification amendments stated in note 2.6 for the purpose of fulfilling the requirements of this regulation.
2013-2 Recognition of Business Combinations Subjected to Auto Control
According to the decision (i) it has been decreed that business combinations subjected to common control should be recognitoned via combination of rights method (ii) therefore goodwill shall not be included in financial statements and (iii) while implementing combination of rights method, correction of financial statements as if combination has accrued as from the beginning of reporting term where common control emerged and submission comparatively as from the beginning of reporting term where common control emerged. The said decisions shall not have any impact on Company’s financial state or performance. This decision is valid in annual reporting periods starting after December 31i 2012.
2013-3 Recognition of Perpetual Bonds
The cases when the perpetual bonds have to be recognitoned as financial instrument based on equity and when as financial debt have been clarified. The said decisions did not have any impact on Company’s financial state or performance.
2013-4 Recognition of Mutual Affiliate Investments
A business’s having shares of its own in a business having affiliate investment has been defined as mutual affiliate relation and recognition of mutual affiliates has been evaluated depending on the different recognition principles implemented and the type of investment. The said principle decision has been evaluated under three main titles and recognition principles of each have been determined.
i) The state of affiliated company’s having financial instruments based on parent company’s equities,
ii) The state of affiliated company’s and joint venture’s having financial instruments based on parent company’s equities,
iii) Having financial instruments based on affiliated company’s equities by the business where an investment recognititoned within the scope of IAS 39 and TRFS 9 is found.
The said decisions did not have any impact on Company’s financial state or performance.
2.8 Summary of Important Accounting Policies
a) Revenue
Merchandise sales
The incomes are recorded based on accrual over fair value of the amount received or that may be received upon possibility of flow of economic benefits related to the transaction to the Company and in order to be determined in a reliable way. Net sales have been found by deducting return and sales discounts from the merchandise sales.
• The Company’s transferring all important risks and gains related to the property to the buyer,
• Company’s having active control on ongoing administrative participation related to the property
and on the sold goods,
• Measurement of income amount in a reliable way,
• Economic benefits’ having flow to the business, that are related to the operation,
• Measurement of costs due to operation in a reliable way,
Services
Service revenues and other revenues, giving service or fulfillment of considerations related to income, accrual of risk and benefit transfers are recorded based on accrual over reasonable cost of the charge received or that may be received upon possibility of flow of economic benefits related to the transaction to the Company and in order to be determined in a reliable way.
Revenues are measured with fair value of the charge received or that may be received and estimated customer returns are reduced as much as deductions and other provisions.
Interest incomes
Interest incomes have been accrued in the related period according to the effective interest rate bringing the estimated cash inflows to be obtained from the remaining capital balance and related financial asset to the said asset’s net book value.
Rent income
Rent income: Rent income obtained from the properties are recognitioned according to the linear method during the related lease agreement.
b) Inventories
Inventories are evaluated with the ratio less than net realizable value of cost charge. Considerations consisting the cost included to stocks are workmanship and general production expenses. Cost is calculated via weighted average method. Net realizable value is the value once estimated sales cost required for fulfillment of sales are deducted and estimated sales completion cost is deducted from the estimated sales price emerged within the usual trade activity. When the stocks drop below the net realizable value cost, the stocks are reduced to the net realizable value cost and reflected to the income statement as expense in the year when impairment occurs. Losing validity of the conditions previously caused stocks to be reduced to net realizable value or when there are increases in the net realizable value due to changing economic conditions, reserved impairment provision is canceled. The canceled amount is limited to previously reserved impairment. (Note 10)
c) Investment Properties
Investment properties are hold for the purpose of obtaining rent income or capital gain or both of them. Investment properties are measured with their costs including the operations costs during the first recording. The Company, following the first recording of the investment properties, measures them via the cost method implemented for tangible assets. (cost minus accumulated amortization, if there is minus, impairment provision) Investment properties are left out of balance sheet in the event that they become unusable and in case of determining that they will not provide any economic benefit from the sales in the future. Profits/losses due to expiration of their usage duration or due to their sales, they are included in the income statement in the period they emerged. Properties leased within the operating lease framework, they are classified as investment properties. (Note 13)
d) Tangible Assets
Tangible assets are shown in the financial statements over their net values remaining after deduction of accumulated amortizations from their registered values. Amortization is calculated via linear amortization method by applying pro-rate principle over the useful life of the tangible asset.
Useful lifes based on the amortization calculation and applied amortization ratios are as follows.
62 63
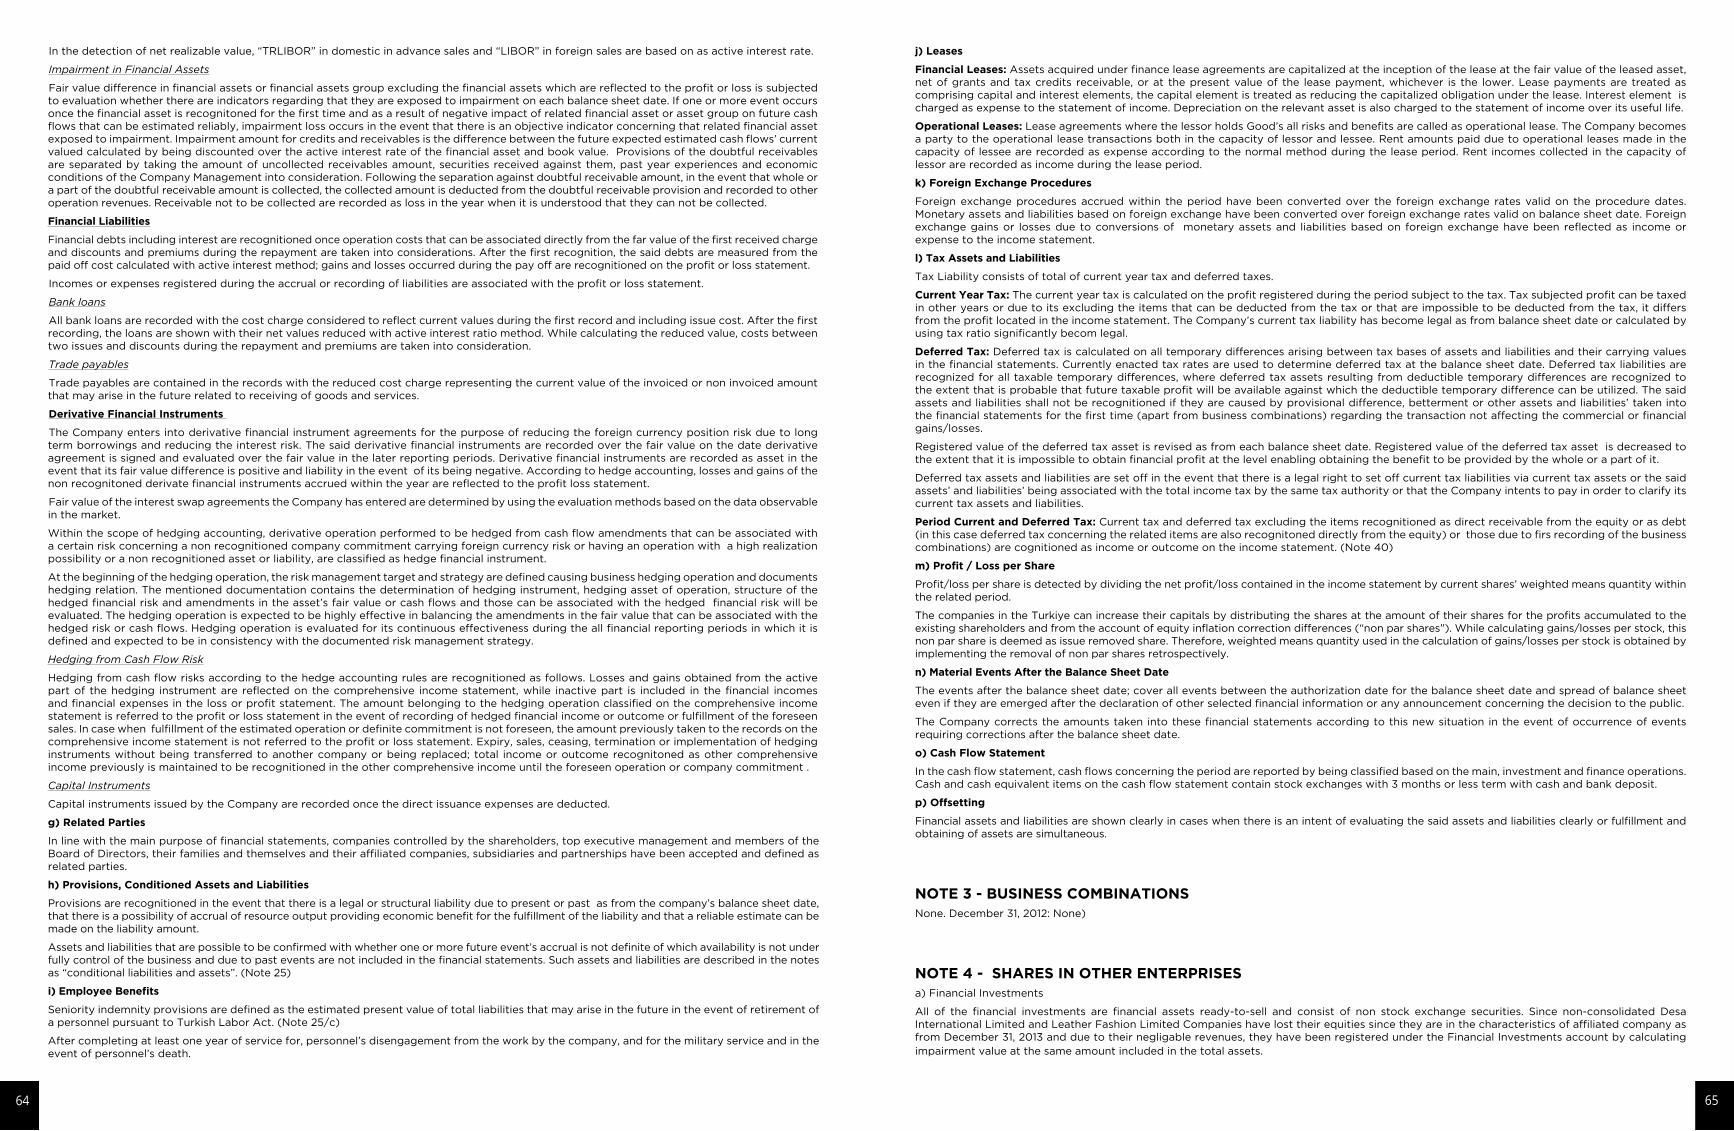
j) Leases
Financial Leases: Assets acquired under finance lease agreements are capitalized at the inception of the lease at the fair value of the leased asset, net of grants and tax credits receivable, or at the present value of the lease payment, whichever is the lower. Lease payments are treated as comprising capital and interest elements, the capital element is treated as reducing the capitalized obligation under the lease. Interest element is charged as expense to the statement of income. Depreciation on the relevant asset is also charged to the statement of income over its useful life.
Operational Leases: Lease agreements where the lessor holds Good’s all risks and benefits are called as operational lease. The Company becomes a party to the operational lease transactions both in the capacity of lessor and lessee. Rent amounts paid due to operational leases made in the capacity of lessee are recorded as expense according to the normal method during the lease period. Rent incomes collected in the capacity of lessor are recorded as income during the lease period.
k) Foreign Exchange Procedures
Foreign exchange procedures accrued within the period have been converted over the foreign exchange rates valid on the procedure dates. Monetary assets and liabilities based on foreign exchange have been converted over foreign exchange rates valid on balance sheet date. Foreign exchange gains or losses due to conversions of monetary assets and liabilities based on foreign exchange have been reflected as income or expense to the income statement.
l) Tax Assets and Liabilities
Tax Liability consists of total of current year tax and deferred taxes.
Current Year Tax: The current year tax is calculated on the profit registered during the period subject to the tax. Tax subjected profit can be taxed in other years or due to its excluding the items that can be deducted from the tax or that are impossible to be deducted from the tax, it differs from the profit located in the income statement. The Company’s current tax liability has become legal as from balance sheet date or calculated by using tax ratio significantly becom legal.
Deferred Tax: Deferred tax is calculated on all temporary differences arising between tax bases of assets and liabilities and their carrying values in the financial statements. Currently enacted tax rates are used to determine deferred tax at the balance sheet date. Deferred tax liabilities are recognized for all taxable temporary differences, where deferred tax assets resulting from deductible temporary differences are recognized to the extent that is probable that future taxable profit will be available against which the deductible temporary difference can be utilized. The said assets and liabilities shall not be recognitioned if they are caused by provisional difference, betterment or other assets and liabilities’ taken into the financial statements for the first time (apart from business combinations) regarding the transaction not affecting the commercial or financial gains/losses.
Registered value of the deferred tax asset is revised as from each balance sheet date. Registered value of the deferred tax asset is decreased to the extent that it is impossible to obtain financial profit at the level enabling obtaining the benefit to be provided by the whole or a part of it.
Deferred tax assets and liabilities are set off in the event that there is a legal right to set off current tax liabilities via current tax assets or the said assets’ and liabilities’ being associated with the total income tax by the same tax authority or that the Company intents to pay in order to clarify its current tax assets and liabilities.
Period Current and Deferred Tax: Current tax and deferred tax excluding the items recognitioned as direct receivable from the equity or as debt (in this case deferred tax concerning the related items are also recognitoned directly from the equity) or those due to firs recording of the business combinations) are cognitioned as income or outcome on the income statement. (Note 40)
m) Profit / Loss per Share
Profit/loss per share is detected by dividing the net profit/loss contained in the income statement by current shares’ weighted means quantity within the related period.
The companies in the Turkiye can increase their capitals by distributing the shares at the amount of their shares for the profits accumulated to the existing shareholders and from the account of equity inflation correction differences (“non par shares”). While calculating gains/losses per stock, this non par share is deemed as issue removed share. Therefore, weighted means quantity used in the calculation of gains/losses per stock is obtained by implementing the removal of non par shares retrospectively.
n) Material Events After the Balance Sheet Date
The events after the balance sheet date; cover all events between the authorization date for the balance sheet date and spread of balance sheet even if they are emerged after the declaration of other selected financial information or any announcement concerning the decision to the public.
The Company corrects the amounts taken into these financial statements according to this new situation in the event of occurrence of events requiring corrections after the balance sheet date.
o) Cash Flow Statement
In the cash flow statement, cash flows concerning the period are reported by being classified based on the main, investment and finance operations. Cash and cash equivalent items on the cash flow statement contain stock exchanges with 3 months or less term with cash and bank deposit.
p) Offsetting
Financial assets and liabilities are shown clearly in cases when there is an intent of evaluating the said assets and liabilities clearly or fulfillment and obtaining of assets are simultaneous.
NOTE 3 - BUSINESS COMBINATIONSNone. December 31, 2012: None)
NOTE 4 - SHARES IN OTHER ENTERPRISESa) Financial Investments
All of the financial investments are financial assets ready-to-sell and consist of non stock exchange securities. Since non-consolidated Desa International Limited and Leather Fashion Limited Companies have lost their equities since they are in the characteristics of affiliated company as from December 31, 2013 and due to their negligable revenues, they have been registered under the Financial Investments account by calculating impairment value at the same amount included in the total assets.
In the detection of net realizable value, “TRLIBOR” in domestic in advance sales and “LIBOR” in foreign sales are based on as active interest rate.
Impairment in Financial Assets
Fair value difference in financial assets or financial assets group excluding the financial assets which are reflected to the profit or loss is subjected to evaluation whether there are indicators regarding that they are exposed to impairment on each balance sheet date. If one or more event occurs once the financial asset is recognitoned for the first time and as a result of negative impact of related financial asset or asset group on future cash flows that can be estimated reliably, impairment loss occurs in the event that there is an objective indicator concerning that related financial asset exposed to impairment. Impairment amount for credits and receivables is the difference between the future expected estimated cash flows’ current valued calculated by being discounted over the active interest rate of the financial asset and book value. Provisions of the doubtful receivables are separated by taking the amount of uncollected receivables amount, securities received against them, past year experiences and economic conditions of the Company Management into consideration. Following the separation against doubtful receivable amount, in the event that whole or a part of the doubtful receivable amount is collected, the collected amount is deducted from the doubtful receivable provision and recorded to other operation revenues. Receivable not to be collected are recorded as loss in the year when it is understood that they can not be collected.
Financial Liabilities
Financial debts including interest are recognitioned once operation costs that can be associated directly from the far value of the first received charge and discounts and premiums during the repayment are taken into considerations. After the first recognition, the said debts are measured from the paid off cost calculated with active interest method; gains and losses occurred during the pay off are recognitioned on the profit or loss statement.
Incomes or expenses registered during the accrual or recording of liabilities are associated with the profit or loss statement.
Bank loans
All bank loans are recorded with the cost charge considered to reflect current values during the first record and including issue cost. After the first recording, the loans are shown with their net values reduced with active interest ratio method. While calculating the reduced value, costs between two issues and discounts during the repayment and premiums are taken into consideration.
Trade payables
Trade payables are contained in the records with the reduced cost charge representing the current value of the invoiced or non invoiced amount that may arise in the future related to receiving of goods and services.
Derivative Financial Instruments
The Company enters into derivative financial instrument agreements for the purpose of reducing the foreign currency position risk due to long term borrowings and reducing the interest risk. The said derivative financial instruments are recorded over the fair value on the date derivative agreement is signed and evaluated over the fair value in the later reporting periods. Derivative financial instruments are recorded as asset in the event that its fair value difference is positive and liability in the event of its being negative. According to hedge accounting, losses and gains of the non recognitoned derivate financial instruments accrued within the year are reflected to the profit loss statement.
Fair value of the interest swap agreements the Company has entered are determined by using the evaluation methods based on the data observable in the market.
Within the scope of hedging accounting, derivative operation performed to be hedged from cash flow amendments that can be associated with a certain risk concerning a non recognitioned company commitment carrying foreign currency risk or having an operation with a high realization possibility or a non recognitioned asset or liability, are classified as hedge financial instrument.
At the beginning of the hedging operation, the risk management target and strategy are defined causing business hedging operation and documents hedging relation. The mentioned documentation contains the determination of hedging instrument, hedging asset of operation, structure of the hedged financial risk and amendments in the asset’s fair value or cash flows and those can be associated with the hedged financial risk will be evaluated. The hedging operation is expected to be highly effective in balancing the amendments in the fair value that can be associated with the hedged risk or cash flows. Hedging operation is evaluated for its continuous effectiveness during the all financial reporting periods in which it is defined and expected to be in consistency with the documented risk management strategy.
Hedging from Cash Flow Risk
Hedging from cash flow risks according to the hedge accounting rules are recognitioned as follows. Losses and gains obtained from the active part of the hedging instrument are reflected on the comprehensive income statement, while inactive part is included in the financial incomes and financial expenses in the loss or profit statement. The amount belonging to the hedging operation classified on the comprehensive income statement is referred to the profit or loss statement in the event of recording of hedged financial income or outcome or fulfillment of the foreseen sales. In case when fulfillment of the estimated operation or definite commitment is not foreseen, the amount previously taken to the records on the comprehensive income statement is not referred to the profit or loss statement. Expiry, sales, ceasing, termination or implementation of hedging instruments without being transferred to another company or being replaced; total income or outcome recognitoned as other comprehensive income previously is maintained to be recognitioned in the other comprehensive income until the foreseen operation or company commitment .
Capital Instruments
Capital instruments issued by the Company are recorded once the direct issuance expenses are deducted.
g) Related Parties
In line with the main purpose of financial statements, companies controlled by the shareholders, top executive management and members of the Board of Directors, their families and themselves and their affiliated companies, subsidiaries and partnerships have been accepted and defined as related parties.
h) Provisions, Conditioned Assets and Liabilities
Provisions are recognitioned in the event that there is a legal or structural liability due to present or past as from the company’s balance sheet date, that there is a possibility of accrual of resource output providing economic benefit for the fulfillment of the liability and that a reliable estimate can be made on the liability amount.
Assets and liabilities that are possible to be confirmed with whether one or more future event’s accrual is not definite of which availability is not under fully control of the business and due to past events are not included in the financial statements. Such assets and liabilities are described in the notes as “conditional liabilities and assets”. (Note 25)
i) Employee Benefits
Seniority indemnity provisions are defined as the estimated present value of total liabilities that may arise in the future in the event of retirement of a personnel pursuant to Turkish Labor Act. (Note 25/c)
After completing at least one year of service for, personnel’s disengagement from the work by the company, and for the military service and in the event of personnel’s death.
64 65
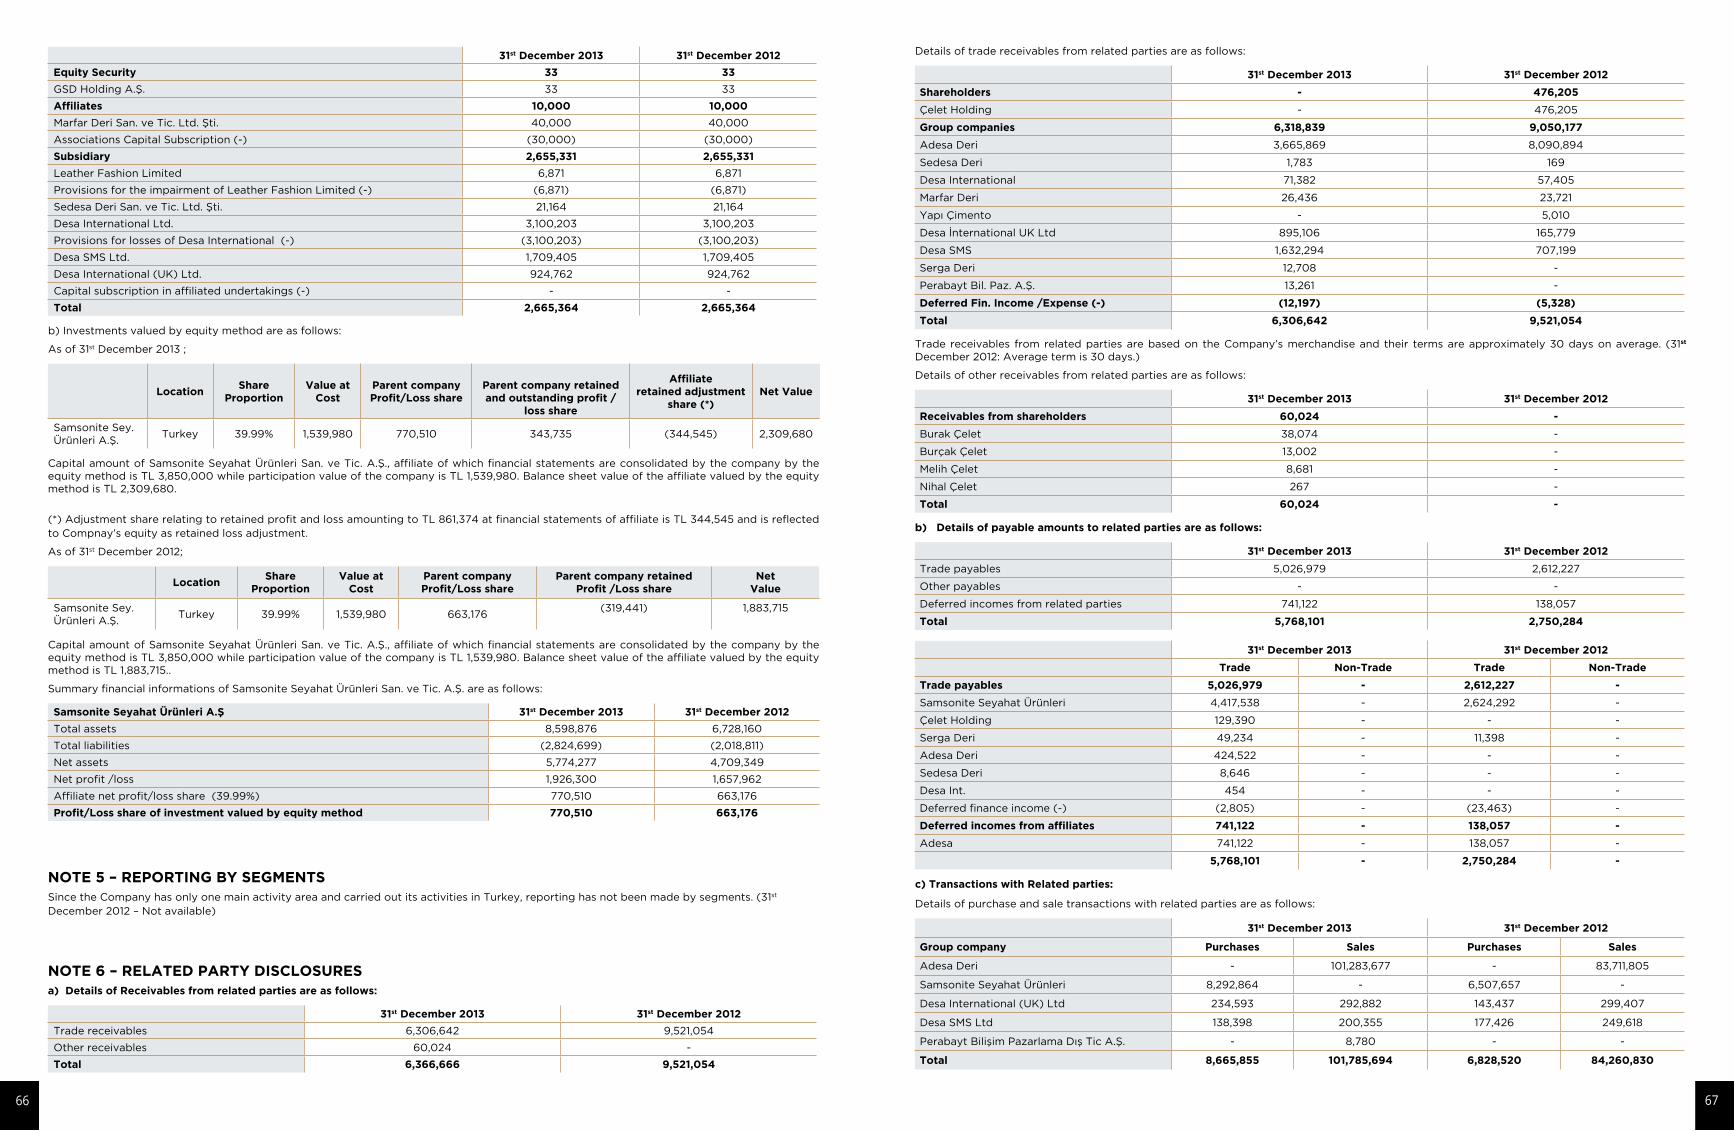
Details of trade receivables from related parties are as follows:
31st December 2013 31st December 2012
Shareholders - 476,205
Çelet Holding - 476,205
Group companies 6,318,839 9,050,177
Adesa Deri 3,665,869 8,090,894
Sedesa Deri 1,783 169
Desa International 71,382 57,405
Marfar Deri 26,436 23,721
Yapı Çimento - 5,010
Desa İnternational UK Ltd 895,106 165,779
Desa SMS 1,632,294 707,199
Serga Deri 12,708 -
Perabayt Bil. Paz. A.Ş. 13,261 -
Deferred Fin. Income /Expense (-) (12,197) (5,328)
Total 6,306,642 9,521,054
Trade receivables from related parties are based on the Company’s merchandise and their terms are approximately 30 days on average. (31st December 2012: Average term is 30 days.)
Details of other receivables from related parties are as follows:
31st December 2013 31st December 2012
Receivables from shareholders 60,024 -
Burak Çelet 38,074 -
Burçak Çelet 13,002 -
Melih Çelet 8,681 -
Nihal Çelet 267 -
Total 60,024 -
b) Details of payable amounts to related parties are as follows:
31st December 2013 31st December 2012
Trade payables 5,026,979 2,612,227
Other payables - -
Deferred incomes from related parties 741,122 138,057
Total 5,768,101 2,750,284
31st December 2013 31st December 2012
Trade Non-Trade Trade Non-Trade
Trade payables 5,026,979 - 2,612,227 -
Samsonite Seyahat Ürünleri 4,417,538 - 2,624,292 -
Çelet Holding 129,390 - - -
Serga Deri 49,234 - 11,398 -
Adesa Deri 424,522 - - -
Sedesa Deri 8,646 - - -
Desa Int. 454 - - -
Deferred finance income (-) (2,805) - (23,463) -
Deferred incomes from affiliates 741,122 - 138,057 -
Adesa 741,122 - 138,057 -
5,768,101 - 2,750,284 -
c) Transactions with Related parties:
Details of purchase and sale transactions with related parties are as follows:
31st December 2013 31st December 2012
Group company Purchases Sales Purchases Sales
Adesa Deri - 101,283,677 - 83,711,805
Samsonite Seyahat Ürünleri 8,292,864 - 6,507,657 -
Desa International (UK) Ltd 234,593 292,882 143,437 299,407
Desa SMS Ltd 138,398 200,355 177,426 249,618
Perabayt Bilişim Pazarlama Dış Tic A.Ş. - 8,780 - -
Total 8,665,855 101,785,694 6,828,520 84,260,830
31st December 2013 31st December 2012
Equity Security 33 33
GSD Holding A.Ş. 33 33
Affiliates 10,000 10,000
Marfar Deri San. ve Tic. Ltd. Şti. 40,000 40,000
Associations Capital Subscription (-) (30,000) (30,000)
Subsidiary 2,655,331 2,655,331
Leather Fashion Limited 6,871 6,871
Provisions for the impairment of Leather Fashion Limited (-) (6,871) (6,871)
Sedesa Deri San. ve Tic. Ltd. Şti. 21,164 21,164
Desa International Ltd. 3,100,203 3,100,203
Provisions for losses of Desa International (-) (3,100,203) (3,100,203)
Desa SMS Ltd. 1,709,405 1,709,405
Desa International (UK) Ltd. 924,762 924,762
Capital subscription in affiliated undertakings (-) - -
Total 2,665,364 2,665,364
b) Investments valued by equity method are as follows:
As of 31st December 2013 ;
LocationShare
ProportionValue at
CostParent companyProfit/Loss share
Parent company retained and outstanding profit /
loss share
Affiliateretained adjustment
share (*)Net Value
Samsonite Sey. Ürünleri A.Ş.
Turkey 39.99% 1,539,980 770,510 343,735 (344,545) 2,309,680
Capital amount of Samsonite Seyahat Ürünleri San. ve Tic. A.Ş., affiliate of which financial statements are consolidated by the company by the equity method is TL 3,850,000 while participation value of the company is TL 1,539,980. Balance sheet value of the affiliate valued by the equity method is TL 2,309,680.
(*) Adjustment share relating to retained profit and loss amounting to TL 861,374 at financial statements of affiliate is TL 344,545 and is reflected to Compnay’s equity as retained loss adjustment.
As of 31st December 2012;
Location
Share Proportion
Value at Cost
Parent companyProfit/Loss share
Parent company retained Profit /Loss share
Net Value
Samsonite Sey. Ürünleri A.Ş.
Turkey 39.99% 1,539,980 663,176(319,441) 1,883,715
Capital amount of Samsonite Seyahat Ürünleri San. ve Tic. A.Ş., affiliate of which financial statements are consolidated by the company by the equity method is TL 3,850,000 while participation value of the company is TL 1,539,980. Balance sheet value of the affiliate valued by the equity method is TL 1,883,715..
Summary financial informations of Samsonite Seyahat Ürünleri San. ve Tic. A.Ş. are as follows:
Samsonite Seyahat Ürünleri A.Ş 31st December 2013 31st December 2012
Total assets 8,598,876 6,728,160
Total liabilities (2,824,699) (2,018,811)
Net assets 5,774,277 4,709,349
Net profit /loss 1,926,300 1,657,962
Affiliate net profit/loss share (39.99%) 770,510 663,176
Profit/Loss share of investment valued by equity method 770,510 663,176
NOTE 5 – REPORTING BY SEGMENTSSince the Company has only one main activity area and carried out its activities in Turkey, reporting has not been made by segments. (31st December 2012 – Not available)
NOTE 6 – RELATED PARTY DISCLOSURESa) Details of Receivables from related parties are as follows:
31st December 2013 31st December 2012
Trade receivables 6,306,642 9,521,054
Other receivables 60,024 -
Total 6,366,666 9,521,054
66 67
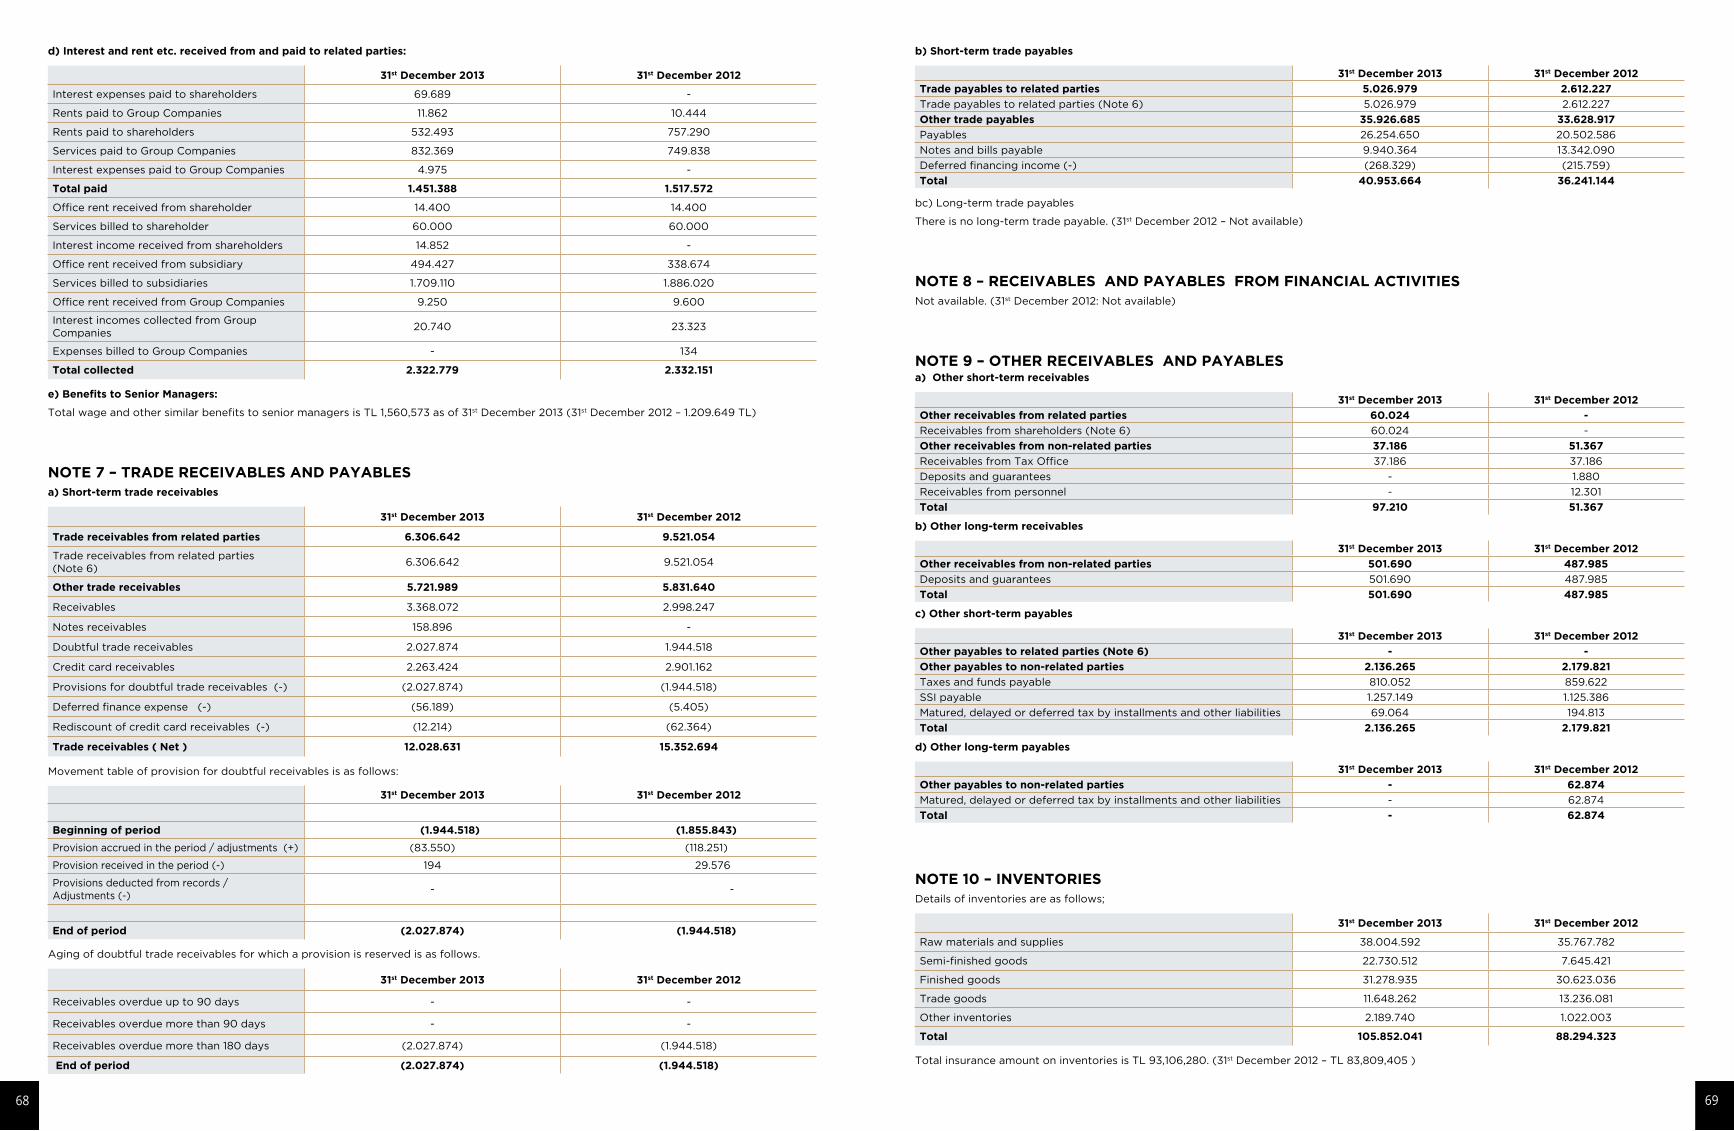
b) Short-term trade payables
31st December 2013 31st December 2012
Trade payables to related parties 5.026.979 2.612.227
Trade payables to related parties (Note 6) 5.026.979 2.612.227
Other trade payables 35.926.685 33.628.917
Payables 26.254.650 20.502.586
Notes and bills payable 9.940.364 13.342.090
Deferred financing income (-) (268.329) (215.759)
Total 40.953.664 36.241.144
bc) Long-term trade payables
There is no long-term trade payable. (31st December 2012 – Not available)
NOTE 8 – RECEIVABLES AND PAYABLES FROM FINANCIAL ACTIVITIESNot available. (31st December 2012: Not available)
NOTE 9 – OTHER RECEIVABLES AND PAYABLES a) Other short-term receivables
31st December 2013 31st December 2012
Other receivables from related parties 60.024 -
Receivables from shareholders (Note 6) 60.024 -
Other receivables from non-related parties 37.186 51.367
Receivables from Tax Office 37.186 37.186
Deposits and guarantees - 1.880
Receivables from personnel - 12.301
Total 97.210 51.367
b) Other long-term receivables
31st December 2013 31st December 2012
Other receivables from non-related parties 501.690 487.985
Deposits and guarantees 501.690 487.985
Total 501.690 487.985
c) Other short-term payables
31st December 2013 31st December 2012
Other payables to related parties (Note 6) - -
Other payables to non-related parties 2.136.265 2.179.821
Taxes and funds payable 810.052 859.622
SSI payable 1.257.149 1.125.386
Matured, delayed or deferred tax by installments and other liabilities 69.064 194.813
Total 2.136.265 2.179.821
d) Other long-term payables
31st December 2013 31st December 2012
Other payables to non-related parties - 62.874
Matured, delayed or deferred tax by installments and other liabilities - 62.874
Total - 62.874
NOTE 10 – INVENTORIESDetails of inventories are as follows;
31st December 2013 31st December 2012
Raw materials and supplies 38.004.592 35.767.782
Semi-finished goods 22.730.512 7.645.421
Finished goods 31.278.935 30.623.036
Trade goods 11.648.262 13.236.081
Other inventories 2.189.740 1.022.003
Total 105.852.041 88.294.323
Total insurance amount on inventories is TL 93,106,280. (31st December 2012 – TL 83,809,405 )
d) Interest and rent etc. received from and paid to related parties:
31st December 2013 31st December 2012
Interest expenses paid to shareholders 69.689 -
Rents paid to Group Companies 11.862 10.444
Rents paid to shareholders 532.493 757.290
Services paid to Group Companies 832.369 749.838
Interest expenses paid to Group Companies 4.975 -
Total paid 1.451.388 1.517.572
Office rent received from shareholder 14.400 14.400
Services billed to shareholder 60.000 60.000
Interest income received from shareholders 14.852 -
Office rent received from subsidiary 494.427 338.674
Services billed to subsidiaries 1.709.110 1.886.020
Office rent received from Group Companies 9.250 9.600
Interest incomes collected from Group Companies
20.740 23.323
Expenses billed to Group Companies - 134
Total collected 2.322.779 2.332.151
e) Benefits to Senior Managers:
Total wage and other similar benefits to senior managers is TL 1,560,573 as of 31st December 2013 (31st December 2012 – 1.209.649 TL)
NOTE 7 – TRADE RECEIVABLES AND PAYABLESa) Short-term trade receivables
31st December 2013 31st December 2012
Trade receivables from related parties 6.306.642 9.521.054
Trade receivables from related parties (Note 6)
6.306.642 9.521.054
Other trade receivables 5.721.989 5.831.640
Receivables 3.368.072 2.998.247
Notes receivables 158.896 -
Doubtful trade receivables 2.027.874 1.944.518
Credit card receivables 2.263.424 2.901.162
Provisions for doubtful trade receivables (-) (2.027.874) (1.944.518)
Deferred finance expense (-) (56.189) (5.405)
Rediscount of credit card receivables (-) (12.214) (62.364)
Trade receivables ( Net ) 12.028.631 15.352.694
Movement table of provision for doubtful receivables is as follows:
31st December 2013 31st December 2012
Beginning of period (1.944.518) (1.855.843)
Provision accrued in the period / adjustments (+) (83.550) (118.251)
Provision received in the period (-) 194 29.576
Provisions deducted from records / Adjustments (-)
- -
End of period (2.027.874) (1.944.518)
Aging of doubtful trade receivables for which a provision is reserved is as follows.
31st December 2013 31st December 2012
Receivables overdue up to 90 days - -
Receivables overdue more than 90 days - -
Receivables overdue more than 180 days (2.027.874) (1.944.518)
End of period (2.027.874) (1.944.518)
68 69
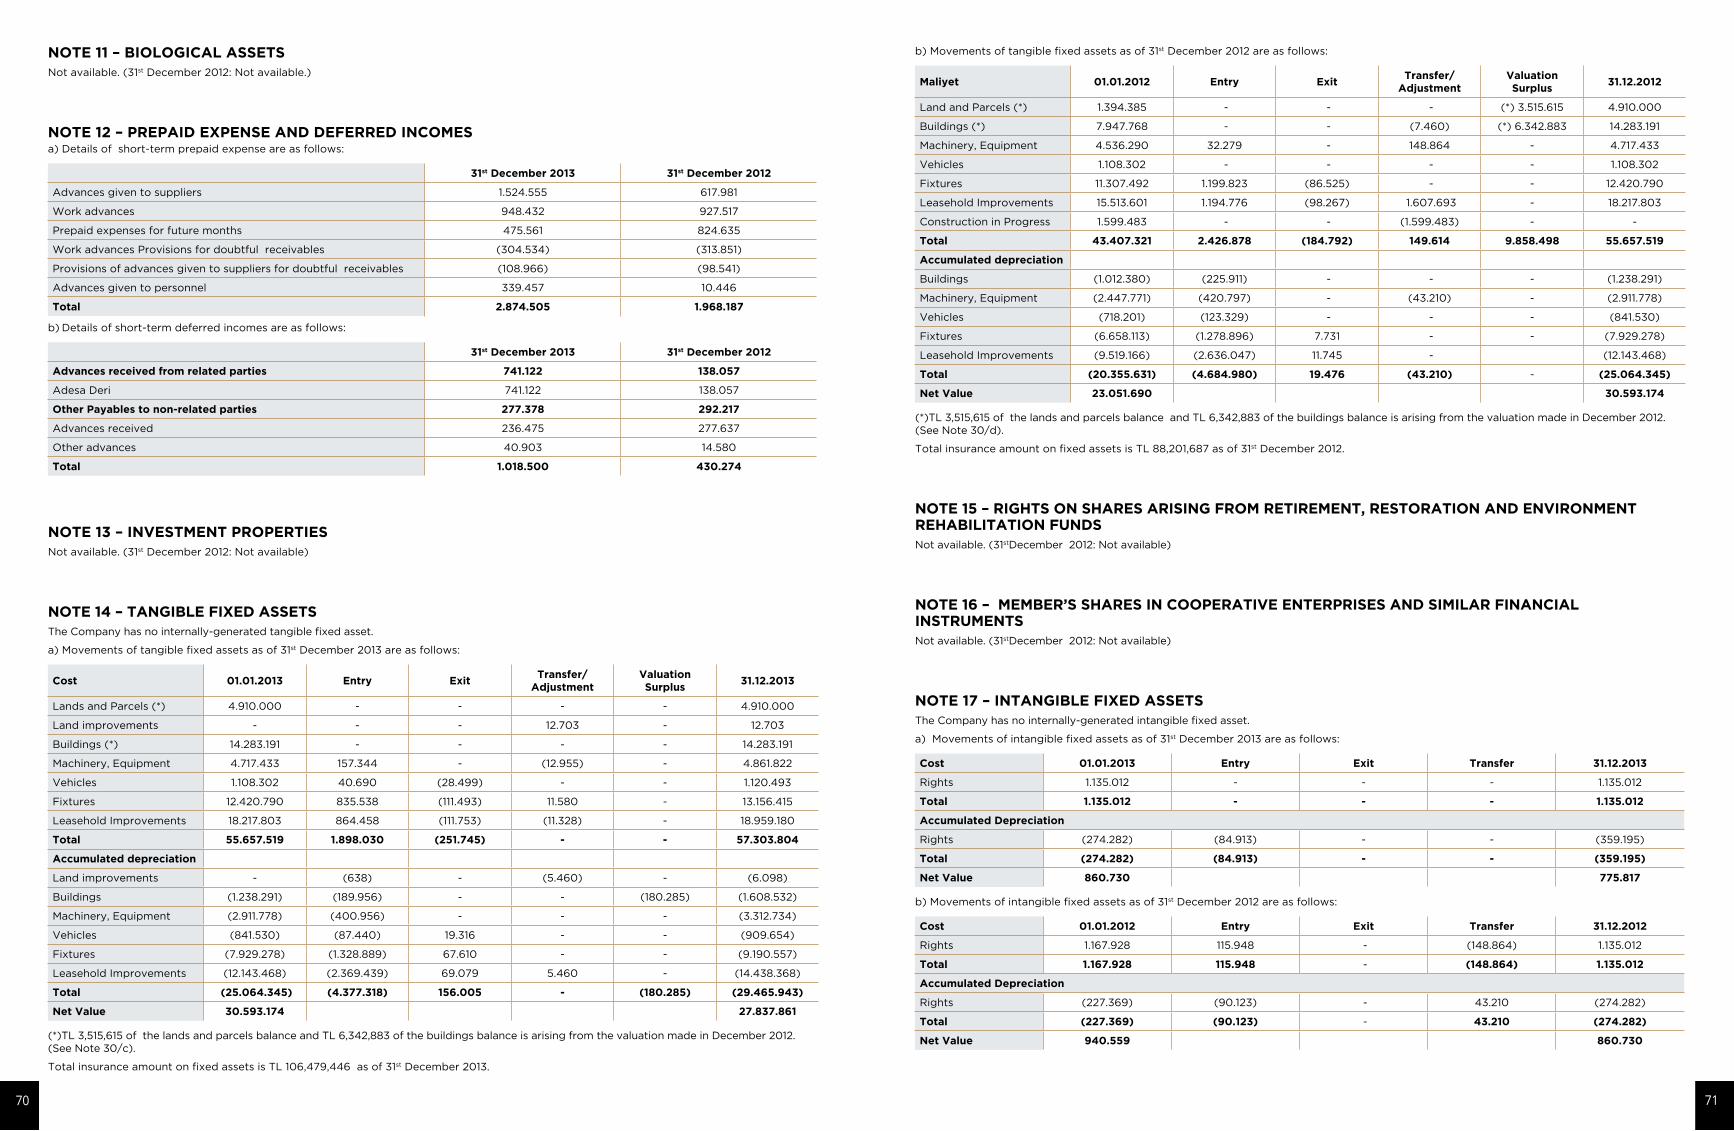
b) Movements of tangible fixed assets as of 31st December 2012 are as follows:
Maliyet 01.01.2012 Entry ExitTransfer/
AdjustmentValuation Surplus
31.12.2012
Land and Parcels (*) 1.394.385 - - - (*) 3.515.615 4.910.000
Buildings (*) 7.947.768 - - (7.460) (*) 6.342.883 14.283.191
Machinery, Equipment 4.536.290 32.279 - 148.864 - 4.717.433
Vehicles 1.108.302 - - - - 1.108.302
Fixtures 11.307.492 1.199.823 (86.525) - - 12.420.790
Leasehold Improvements 15.513.601 1.194.776 (98.267) 1.607.693 - 18.217.803
Construction in Progress 1.599.483 - - (1.599.483) - -
Total 43.407.321 2.426.878 (184.792) 149.614 9.858.498 55.657.519
Accumulated depreciation
Buildings (1.012.380) (225.911) - - - (1.238.291)
Machinery, Equipment (2.447.771) (420.797) - (43.210) - (2.911.778)
Vehicles (718.201) (123.329) - - - (841.530)
Fixtures (6.658.113) (1.278.896) 7.731 - - (7.929.278)
Leasehold Improvements (9.519.166) (2.636.047) 11.745 - (12.143.468)
Total (20.355.631) (4.684.980) 19.476 (43.210) - (25.064.345)
Net Value 23.051.690 30.593.174
(*)TL 3,515,615 of the lands and parcels balance and TL 6,342,883 of the buildings balance is arising from the valuation made in December 2012. (See Note 30/d).
Total insurance amount on fixed assets is TL 88,201,687 as of 31st December 2012.
NOTE 15 – RIGHTS ON SHARES ARISING FROM RETIREMENT, RESTORATION AND ENVIRONMENT REHABILITATION FUNDS Not available. (31stDecember 2012: Not available)
NOTE 16 – MEMBER’S SHARES IN COOPERATIVE ENTERPRISES AND SIMILAR FINANCIAL INSTRUMENTS Not available. (31stDecember 2012: Not available)
NOTE 17 – INTANGIBLE FIXED ASSETSThe Company has no internally-generated intangible fixed asset.
a) Movements of intangible fixed assets as of 31st December 2013 are as follows:
Cost 01.01.2013 Entry Exit Transfer 31.12.2013
Rights 1.135.012 - - - 1.135.012
Total 1.135.012 - - - 1.135.012
Accumulated Depreciation
Rights (274.282) (84.913) - - (359.195)
Total (274.282) (84.913) - - (359.195)
Net Value 860.730 775.817
b) Movements of intangible fixed assets as of 31st December 2012 are as follows:
Cost 01.01.2012 Entry Exit Transfer 31.12.2012
Rights 1.167.928 115.948 - (148.864) 1.135.012
Total 1.167.928 115.948 - (148.864) 1.135.012
Accumulated Depreciation
Rights (227.369) (90.123) - 43.210 (274.282)
Total (227.369) (90.123) - 43.210 (274.282)
Net Value 940.559 860.730
NOTE 11 – BIOLOGICAL ASSETSNot available. (31st December 2012: Not available.)
NOTE 12 – PREPAID EXPENSE AND DEFERRED INCOMES a) Details of short-term prepaid expense are as follows:
31st December 2013 31st December 2012
Advances given to suppliers 1.524.555 617.981
Work advances 948.432 927.517
Prepaid expenses for future months 475.561 824.635
Work advances Provisions for doubtful receivables (304.534) (313.851)
Provisions of advances given to suppliers for doubtful receivables (108.966) (98.541)
Advances given to personnel 339.457 10.446
Total 2.874.505 1.968.187
b) Details of short-term deferred incomes are as follows:
31st December 2013 31st December 2012
Advances received from related parties 741.122 138.057
Adesa Deri 741.122 138.057
Other Payables to non-related parties 277.378 292.217
Advances received 236.475 277.637
Other advances 40.903 14.580
Total 1.018.500 430.274
NOTE 13 – INVESTMENT PROPERTIESNot available. (31st December 2012: Not available)
NOTE 14 – TANGIBLE FIXED ASSETSThe Company has no internally-generated tangible fixed asset.
a) Movements of tangible fixed assets as of 31st December 2013 are as follows:
Cost 01.01.2013 Entry ExitTransfer/
AdjustmentValuation Surplus
31.12.2013
Lands and Parcels (*) 4.910.000 - - - - 4.910.000
Land improvements - - - 12.703 - 12.703
Buildings (*) 14.283.191 - - - - 14.283.191
Machinery, Equipment 4.717.433 157.344 - (12.955) - 4.861.822
Vehicles 1.108.302 40.690 (28.499) - - 1.120.493
Fixtures 12.420.790 835.538 (111.493) 11.580 - 13.156.415
Leasehold Improvements 18.217.803 864.458 (111.753) (11.328) - 18.959.180
Total 55.657.519 1.898.030 (251.745) - - 57.303.804
Accumulated depreciation
Land improvements - (638) - (5.460) - (6.098)
Buildings (1.238.291) (189.956) - - (180.285) (1.608.532)
Machinery, Equipment (2.911.778) (400.956) - - - (3.312.734)
Vehicles (841.530) (87.440) 19.316 - - (909.654)
Fixtures (7.929.278) (1.328.889) 67.610 - - (9.190.557)
Leasehold Improvements (12.143.468) (2.369.439) 69.079 5.460 - (14.438.368)
Total (25.064.345) (4.377.318) 156.005 - (180.285) (29.465.943)
Net Value 30.593.174 27.837.861
(*)TL 3,515,615 of the lands and parcels balance and TL 6,342,883 of the buildings balance is arising from the valuation made in December 2012. (See Note 30/c).
Total insurance amount on fixed assets is TL 106,479,446 as of 31st December 2013.
70 71
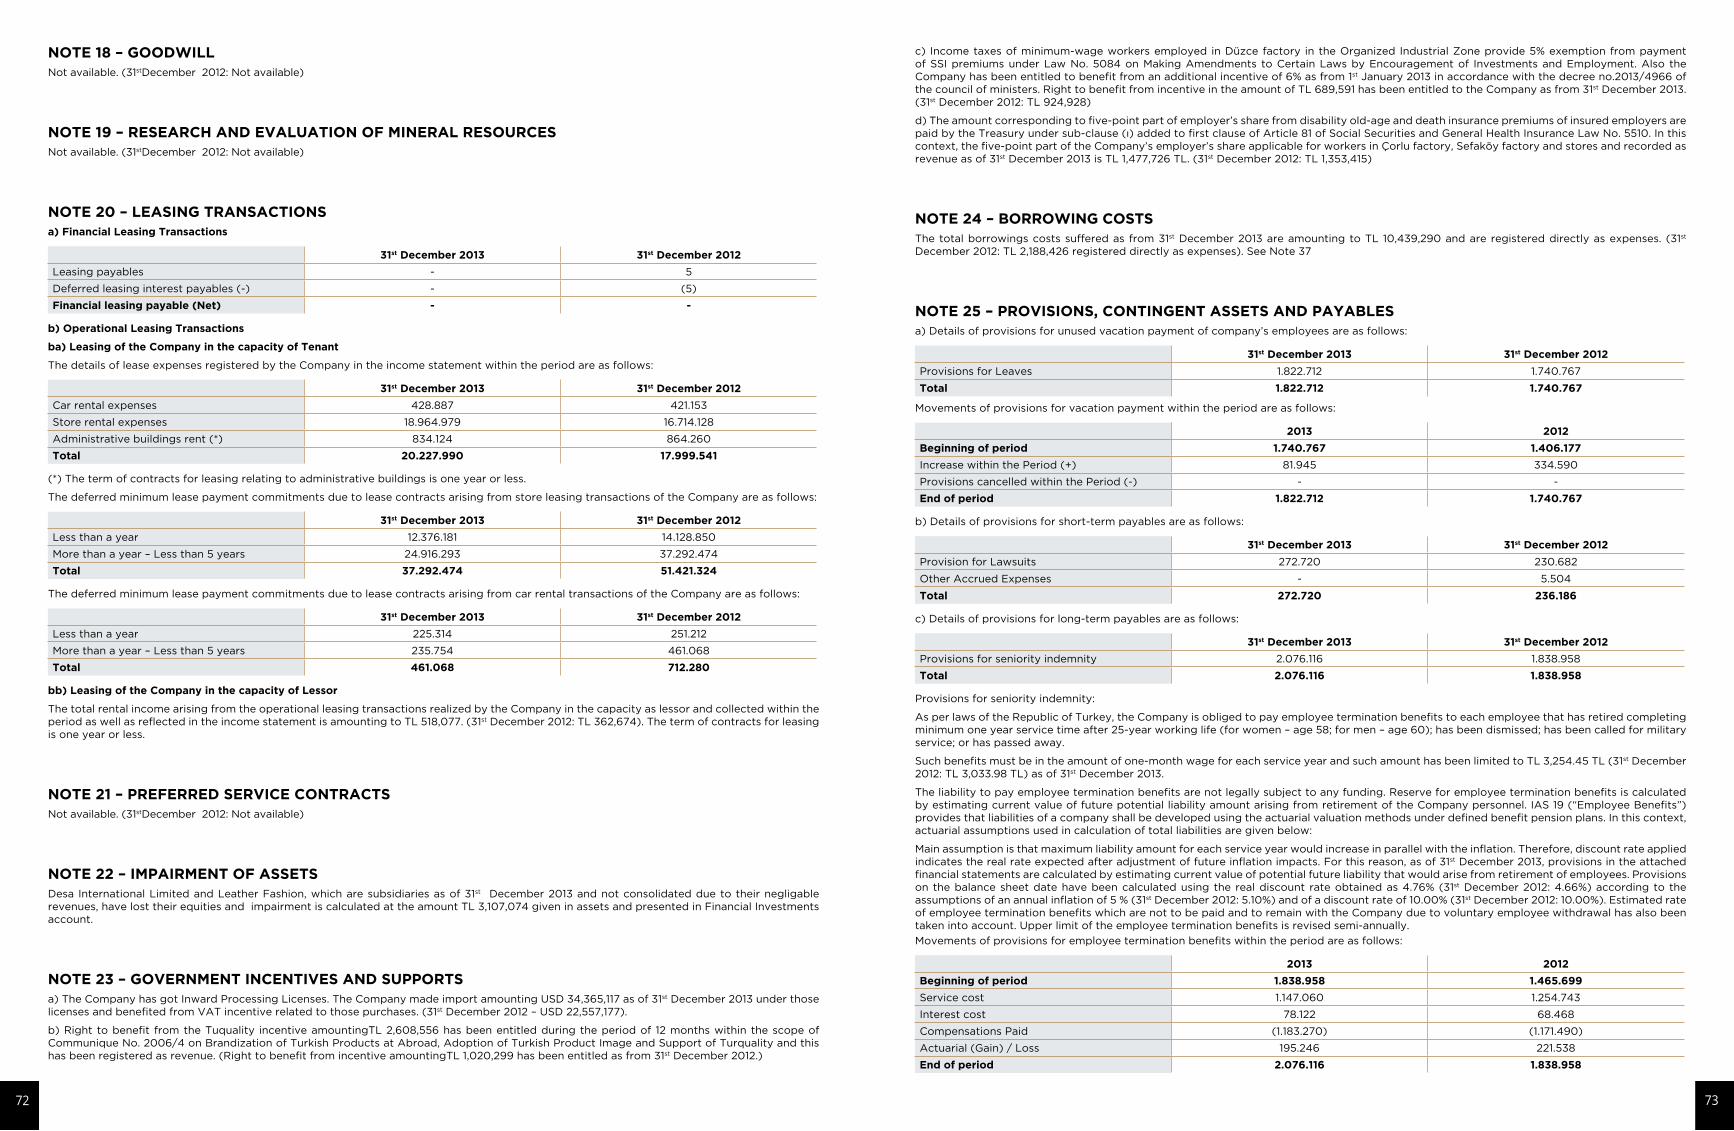
c) Income taxes of minimum-wage workers employed in Düzce factory in the Organized Industrial Zone provide 5% exemption from payment of SSI premiums under Law No. 5084 on Making Amendments to Certain Laws by Encouragement of Investments and Employment. Also the Company has been entitled to benefit from an additional incentive of 6% as from 1st January 2013 in accordance with the decree no.2013/4966 of the council of ministers. Right to benefit from incentive in the amount of TL 689,591 has been entitled to the Company as from 31st December 2013. (31st December 2012: TL 924,928)
d) The amount corresponding to five-point part of employer’s share from disability old-age and death insurance premiums of insured employers are paid by the Treasury under sub-clause (ı) added to first clause of Article 81 of Social Securities and General Health Insurance Law No. 5510. In this context, the five-point part of the Company’s employer’s share applicable for workers in Çorlu factory, Sefaköy factory and stores and recorded as revenue as of 31st December 2013 is TL 1,477,726 TL. (31st December 2012: TL 1,353,415)
NOTE 24 – BORROWING COSTSThe total borrowings costs suffered as from 31st December 2013 are amounting to TL 10,439,290 and are registered directly as expenses. (31st December 2012: TL 2,188,426 registered directly as expenses). See Note 37
NOTE 25 – PROVISIONS, CONTINGENT ASSETS AND PAYABLES a) Details of provisions for unused vacation payment of company’s employees are as follows:
31st December 2013 31st December 2012
Provisions for Leaves 1.822.712 1.740.767
Total 1.822.712 1.740.767
Movements of provisions for vacation payment within the period are as follows:
2013 2012
Beginning of period 1.740.767 1.406.177
Increase within the Period (+) 81.945 334.590
Provisions cancelled within the Period (-) - -
End of period 1.822.712 1.740.767
b) Details of provisions for short-term payables are as follows:
31st December 2013 31st December 2012
Provision for Lawsuits 272.720 230.682
Other Accrued Expenses - 5.504
Total 272.720 236.186
c) Details of provisions for long-term payables are as follows:
31st December 2013 31st December 2012
Provisions for seniority indemnity 2.076.116 1.838.958
Total 2.076.116 1.838.958
Provisions for seniority indemnity:
As per laws of the Republic of Turkey, the Company is obliged to pay employee termination benefits to each employee that has retired completing minimum one year service time after 25-year working life (for women – age 58; for men – age 60); has been dismissed; has been called for military service; or has passed away.
Such benefits must be in the amount of one-month wage for each service year and such amount has been limited to TL 3,254.45 TL (31st December 2012: TL 3,033.98 TL) as of 31st December 2013.
The liability to pay employee termination benefits are not legally subject to any funding. Reserve for employee termination benefits is calculated by estimating current value of future potential liability amount arising from retirement of the Company personnel. IAS 19 (“Employee Benefits”) provides that liabilities of a company shall be developed using the actuarial valuation methods under defined benefit pension plans. In this context, actuarial assumptions used in calculation of total liabilities are given below:
Main assumption is that maximum liability amount for each service year would increase in parallel with the inflation. Therefore, discount rate applied indicates the real rate expected after adjustment of future inflation impacts. For this reason, as of 31st December 2013, provisions in the attached financial statements are calculated by estimating current value of potential future liability that would arise from retirement of employees. Provisions on the balance sheet date have been calculated using the real discount rate obtained as 4.76% (31st December 2012: 4.66%) according to the assumptions of an annual inflation of 5 % (31st December 2012: 5.10%) and of a discount rate of 10.00% (31st December 2012: 10.00%). Estimated rate of employee termination benefits which are not to be paid and to remain with the Company due to voluntary employee withdrawal has also been taken into account. Upper limit of the employee termination benefits is revised semi-annually.
Movements of provisions for employee termination benefits within the period are as follows:
2013 2012
Beginning of period 1.838.958 1.465.699
Service cost 1.147.060 1.254.743
Interest cost 78.122 68.468
Compensations Paid (1.183.270) (1.171.490)
Actuarial (Gain) / Loss 195.246 221.538
End of period 2.076.116 1.838.958
NOTE 18 – GOODWILLNot available. (31stDecember 2012: Not available)
NOTE 19 – RESEARCH AND EVALUATION OF MINERAL RESOURCES Not available. (31stDecember 2012: Not available)
NOTE 20 – LEASING TRANSACTIONSa) Financial Leasing Transactions
31st December 2013 31st December 2012
Leasing payables - 5
Deferred leasing interest payables (-) - (5)
Financial leasing payable (Net) - -
b) Operational Leasing Transactions
ba) Leasing of the Company in the capacity of Tenant
The details of lease expenses registered by the Company in the income statement within the period are as follows:
31st December 2013 31st December 2012
Car rental expenses 428.887 421.153
Store rental expenses 18.964.979 16.714.128
Administrative buildings rent (*) 834.124 864.260
Total 20.227.990 17.999.541
(*) The term of contracts for leasing relating to administrative buildings is one year or less.
The deferred minimum lease payment commitments due to lease contracts arising from store leasing transactions of the Company are as follows:
31st December 2013 31st December 2012
Less than a year 12.376.181 14.128.850
More than a year – Less than 5 years 24.916.293 37.292.474
Total 37.292.474 51.421.324
The deferred minimum lease payment commitments due to lease contracts arising from car rental transactions of the Company are as follows:
31st December 2013 31st December 2012
Less than a year 225.314 251.212
More than a year – Less than 5 years 235.754 461.068
Total 461.068 712.280
bb) Leasing of the Company in the capacity of Lessor
The total rental income arising from the operational leasing transactions realized by the Company in the capacity as lessor and collected within the period as well as reflected in the income statement is amounting to TL 518,077. (31st December 2012: TL 362,674). The term of contracts for leasing is one year or less.
NOTE 21 – PREFERRED SERVICE CONTRACTS Not available. (31stDecember 2012: Not available)
NOTE 22 – IMPAIRMENT OF ASSETSDesa International Limited and Leather Fashion, which are subsidiaries as of 31st December 2013 and not consolidated due to their negligable revenues, have lost their equities and impairment is calculated at the amount TL 3,107,074 given in assets and presented in Financial Investments account.
NOTE 23 – GOVERNMENT INCENTIVES AND SUPPORTSa) The Company has got Inward Processing Licenses. The Company made import amounting USD 34,365,117 as of 31st December 2013 under those licenses and benefited from VAT incentive related to those purchases. (31st December 2012 – USD 22,557,177).
b) Right to benefit from the Tuquality incentive amountingTL 2,608,556 has been entitled during the period of 12 months within the scope of Communique No. 2006/4 on Brandization of Turkish Products at Abroad, Adoption of Turkish Product Image and Support of Turquality and this has been registered as revenue. (Right to benefit from incentive amountingTL 1,020,299 has been entitled as from 31st December 2012.)
72 73
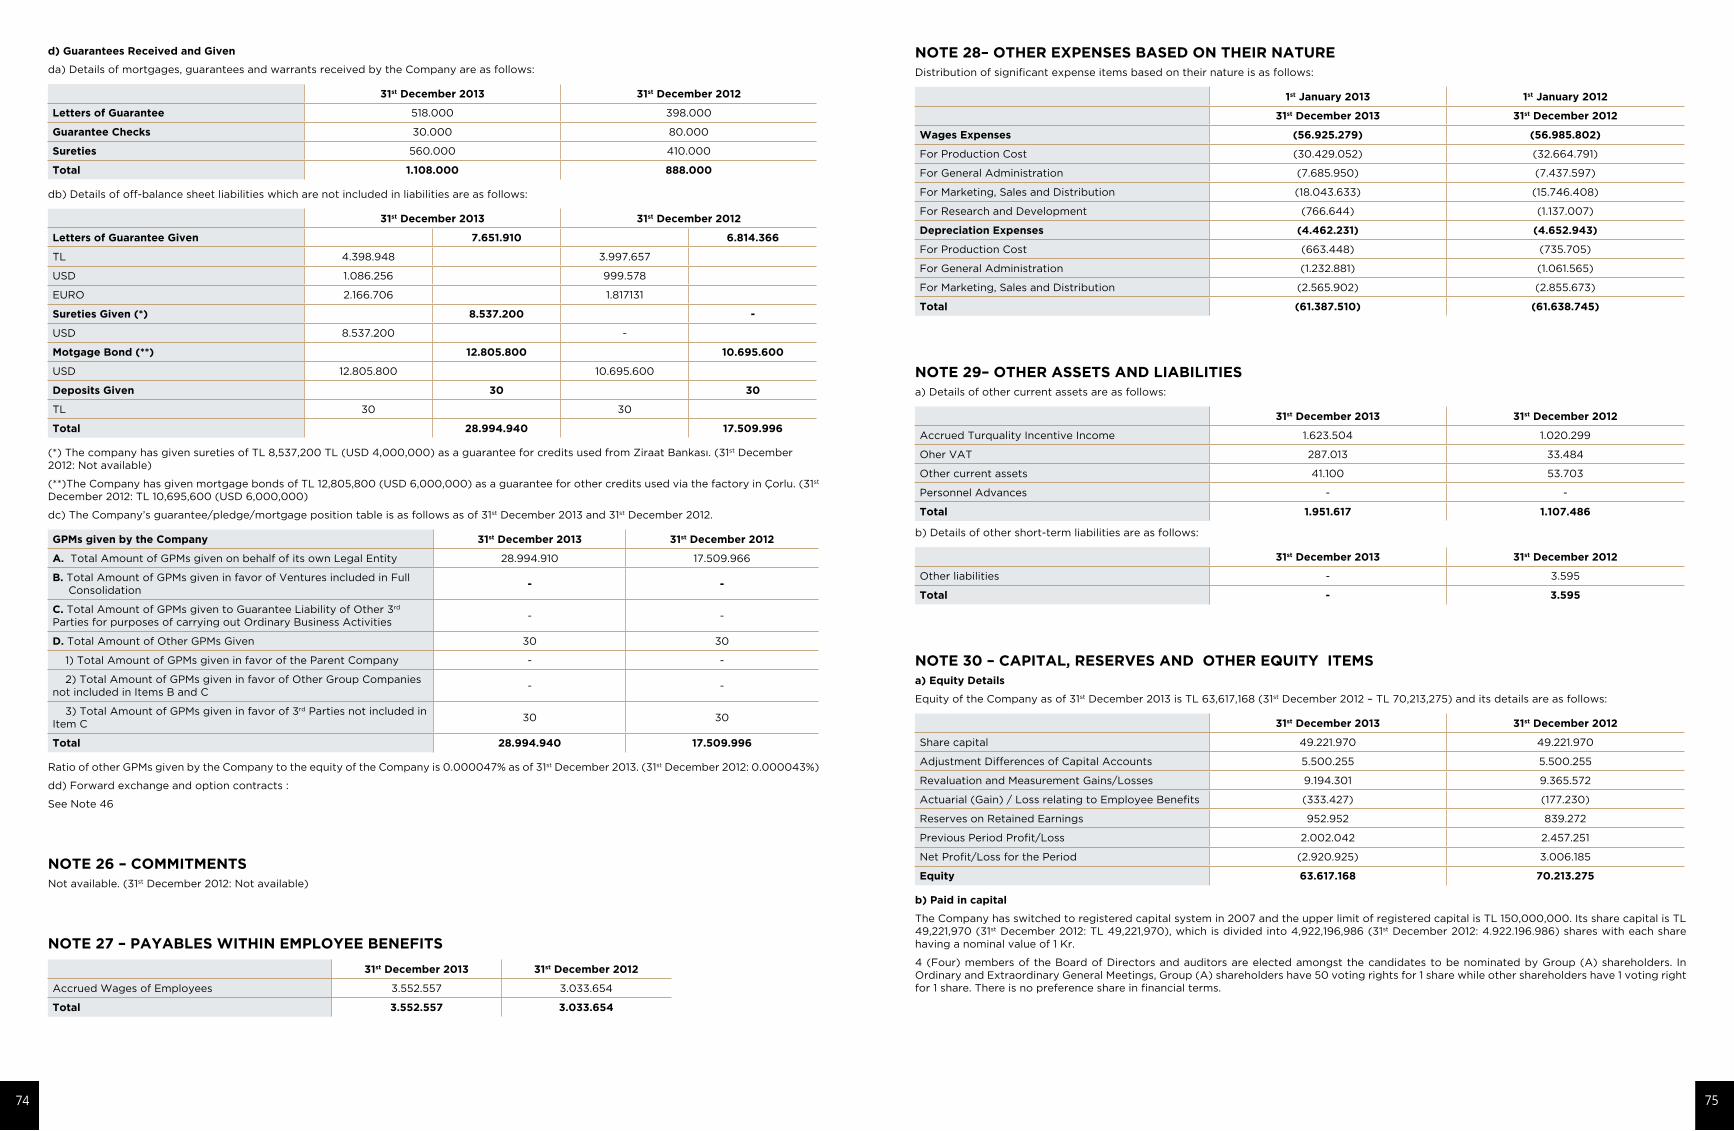
NOTE 28– OTHER EXPENSES BASED ON THEIR NATURE Distribution of significant expense items based on their nature is as follows:
1st January 2013 1st January 2012
31st December 2013 31st December 2012
Wages Expenses (56.925.279) (56.985.802)
For Production Cost (30.429.052) (32.664.791)
For General Administration (7.685.950) (7.437.597)
For Marketing, Sales and Distribution (18.043.633) (15.746.408)
For Research and Development (766.644) (1.137.007)
Depreciation Expenses (4.462.231) (4.652.943)
For Production Cost (663.448) (735.705)
For General Administration (1.232.881) (1.061.565)
For Marketing, Sales and Distribution (2.565.902) (2.855.673)
Total (61.387.510) (61.638.745)
NOTE 29– OTHER ASSETS AND LIABILITIESa) Details of other current assets are as follows:
31st December 2013 31st December 2012
Accrued Turquality Incentive Income 1.623.504 1.020.299
Oher VAT 287.013 33.484
Other current assets 41.100 53.703
Personnel Advances - -
Total 1.951.617 1.107.486
b) Details of other short-term liabilities are as follows:
31st December 2013 31st December 2012
Other liabilities - 3.595
Total - 3.595
NOTE 30 – CAPITAL, RESERVES AND OTHER EQUITY ITEMSa) Equity Details
Equity of the Company as of 31st December 2013 is TL 63,617,168 (31st December 2012 – TL 70,213,275) and its details are as follows:
31st December 2013 31st December 2012
Share capital 49.221.970 49.221.970
Adjustment Differences of Capital Accounts 5.500.255 5.500.255
Revaluation and Measurement Gains/Losses 9.194.301 9.365.572
Actuarial (Gain) / Loss relating to Employee Benefits (333.427) (177.230)
Reserves on Retained Earnings 952.952 839.272
Previous Period Profit/Loss 2.002.042 2.457.251
Net Profit/Loss for the Period (2.920.925) 3.006.185
Equity 63.617.168 70.213.275
b) Paid in capital
The Company has switched to registered capital system in 2007 and the upper limit of registered capital is TL 150,000,000. Its share capital is TL 49,221,970 (31st December 2012: TL 49,221,970), which is divided into 4,922,196,986 (31st December 2012: 4.922.196.986) shares with each share having a nominal value of 1 Kr.
4 (Four) members of the Board of Directors and auditors are elected amongst the candidates to be nominated by Group (A) shareholders. In Ordinary and Extraordinary General Meetings, Group (A) shareholders have 50 voting rights for 1 share while other shareholders have 1 voting right for 1 share. There is no preference share in financial terms.
d) Guarantees Received and Given
da) Details of mortgages, guarantees and warrants received by the Company are as follows:
31st December 2013 31st December 2012
Letters of Guarantee 518.000 398.000
Guarantee Checks 30.000 80.000
Sureties 560.000 410.000
Total 1.108.000 888.000
db) Details of off-balance sheet liabilities which are not included in liabilities are as follows:
31st December 2013 31st December 2012
Letters of Guarantee Given 7.651.910 6.814.366
TL 4.398.948 3.997.657
USD 1.086.256 999.578
EURO 2.166.706 1.817131
Sureties Given (*) 8.537.200 -
USD 8.537.200 -
Motgage Bond (**) 12.805.800 10.695.600
USD 12.805.800 10.695.600
Deposits Given 30 30
TL 30 30
Total 28.994.940 17.509.996
(*) The company has given sureties of TL 8,537,200 TL (USD 4,000,000) as a guarantee for credits used from Ziraat Bankası. (31st December 2012: Not available)
(**)The Company has given mortgage bonds of TL 12,805,800 (USD 6,000,000) as a guarantee for other credits used via the factory in Çorlu. (31st December 2012: TL 10,695,600 (USD 6,000,000)
dc) The Company’s guarantee/pledge/mortgage position table is as follows as of 31st December 2013 and 31st December 2012.
GPMs given by the Company 31st December 2013 31st December 2012
A. Total Amount of GPMs given on behalf of its own Legal Entity 28.994.910 17.509.966
B. Total Amount of GPMs given in favor of Ventures included in Full Consolidation
- -
C. Total Amount of GPMs given to Guarantee Liability of Other 3rd Parties for purposes of carrying out Ordinary Business Activities
- -
D. Total Amount of Other GPMs Given 30 30
1) Total Amount of GPMs given in favor of the Parent Company - -
2) Total Amount of GPMs given in favor of Other Group Companies not included in Items B and C
- -
3) Total Amount of GPMs given in favor of 3rd Parties not included in Item C
30 30
Total 28.994.940 17.509.996
Ratio of other GPMs given by the Company to the equity of the Company is 0.000047% as of 31st December 2013. (31st December 2012: 0.000043%)
dd) Forward exchange and option contracts :
See Note 46
NOTE 26 – COMMITMENTSNot available. (31st December 2012: Not available)
NOTE 27 – PAYABLES WITHIN EMPLOYEE BENEFITS
31st December 2013 31st December 2012
Accrued Wages of Employees 3.552.557 3.033.654
Total 3.552.557 3.033.654
74 75
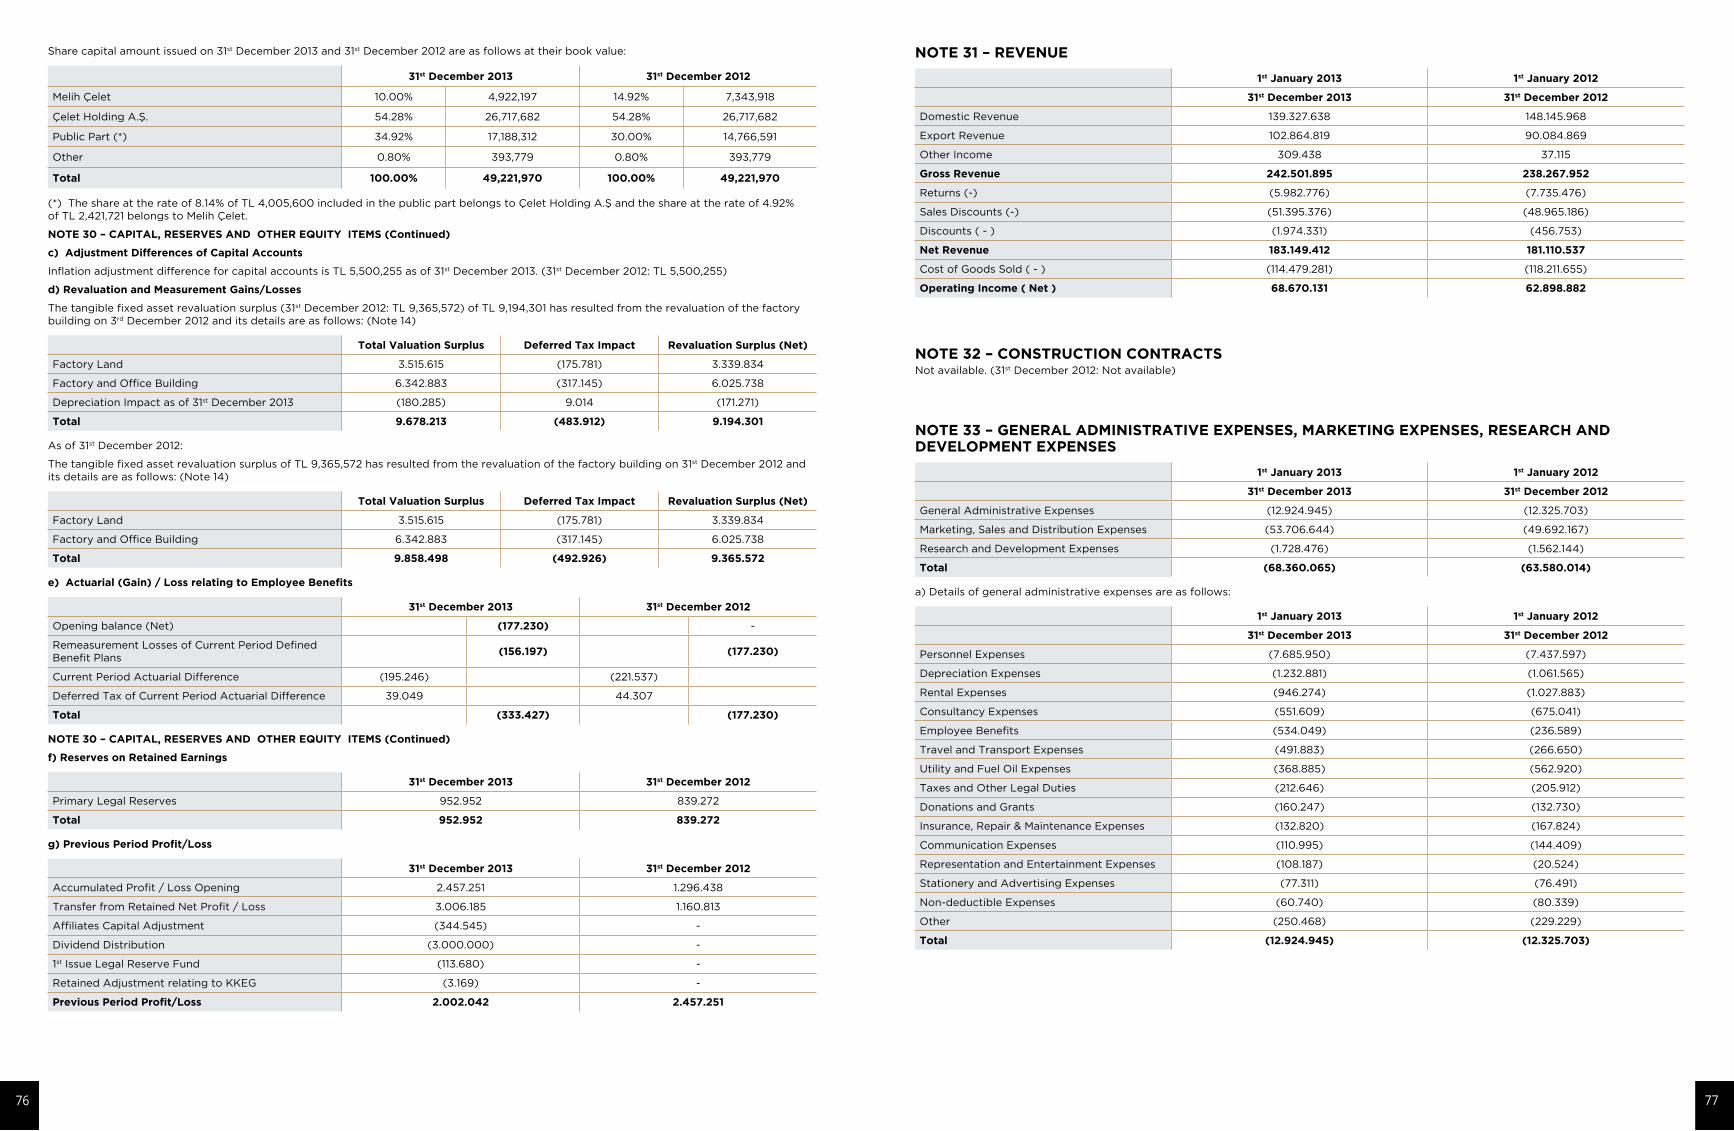
NOTE 31 – REVENUE
1st January 2013 1st January 2012
31st December 2013 31st December 2012
Domestic Revenue 139.327.638 148.145.968
Export Revenue 102.864.819 90.084.869
Other Income 309.438 37.115
Gross Revenue 242.501.895 238.267.952
Returns (-) (5.982.776) (7.735.476)
Sales Discounts (-) (51.395.376) (48.965.186)
Discounts ( - ) (1.974.331) (456.753)
Net Revenue 183.149.412 181.110.537
Cost of Goods Sold ( - ) (114.479.281) (118.211.655)
Operating Income ( Net ) 68.670.131 62.898.882
NOTE 32 – CONSTRUCTION CONTRACTSNot available. (31st December 2012: Not available)
NOTE 33 – GENERAL ADMINISTRATIVE EXPENSES, MARKETING EXPENSES, RESEARCH AND DEVELOPMENT EXPENSES
1st January 2013 1st January 2012
31st December 2013 31st December 2012
General Administrative Expenses (12.924.945) (12.325.703)
Marketing, Sales and Distribution Expenses (53.706.644) (49.692.167)
Research and Development Expenses (1.728.476) (1.562.144)
Total (68.360.065) (63.580.014)
a) Details of general administrative expenses are as follows:
1st January 2013 1st January 2012
31st December 2013 31st December 2012
Personnel Expenses (7.685.950) (7.437.597)
Depreciation Expenses (1.232.881) (1.061.565)
Rental Expenses (946.274) (1.027.883)
Consultancy Expenses (551.609) (675.041)
Employee Benefits (534.049) (236.589)
Travel and Transport Expenses (491.883) (266.650)
Utility and Fuel Oil Expenses (368.885) (562.920)
Taxes and Other Legal Duties (212.646) (205.912)
Donations and Grants (160.247) (132.730)
Insurance, Repair & Maintenance Expenses (132.820) (167.824)
Communication Expenses (110.995) (144.409)
Representation and Entertainment Expenses (108.187) (20.524)
Stationery and Advertising Expenses (77.311) (76.491)
Non-deductible Expenses (60.740) (80.339)
Other (250.468) (229.229)
Total (12.924.945) (12.325.703)
Share capital amount issued on 31st December 2013 and 31st December 2012 are as follows at their book value:
31st December 2013 31st December 2012
Melih Çelet 10.00% 4,922,197 14.92% 7,343,918
Çelet Holding A.Ş. 54.28% 26,717,682 54.28% 26,717,682
Public Part (*) 34.92% 17,188,312 30.00% 14,766,591
Other 0.80% 393,779 0.80% 393,779
Total 100.00% 49,221,970 100.00% 49,221,970
(*) The share at the rate of 8.14% of TL 4,005,600 included in the public part belongs to Çelet Holding A.Ş and the share at the rate of 4.92% of TL 2,421,721 belongs to Melih Çelet.
NOTE 30 – CAPITAL, RESERVES AND OTHER EQUITY ITEMS (Continued)
c) Adjustment Differences of Capital Accounts
Inflation adjustment difference for capital accounts is TL 5,500,255 as of 31st December 2013. (31st December 2012: TL 5,500,255)
d) Revaluation and Measurement Gains/Losses
The tangible fixed asset revaluation surplus (31st December 2012: TL 9,365,572) of TL 9,194,301 has resulted from the revaluation of the factory building on 3rd December 2012 and its details are as follows: (Note 14)
Total Valuation Surplus Deferred Tax Impact Revaluation Surplus (Net)
Factory Land 3.515.615 (175.781) 3.339.834
Factory and Office Building 6.342.883 (317.145) 6.025.738
Depreciation Impact as of 31st December 2013 (180.285) 9.014 (171.271)
Total 9.678.213 (483.912) 9.194.301
As of 31st December 2012:
The tangible fixed asset revaluation surplus of TL 9,365,572 has resulted from the revaluation of the factory building on 31st December 2012 and its details are as follows: (Note 14)
Total Valuation Surplus Deferred Tax Impact Revaluation Surplus (Net)
Factory Land 3.515.615 (175.781) 3.339.834
Factory and Office Building 6.342.883 (317.145) 6.025.738
Total 9.858.498 (492.926) 9.365.572
e) Actuarial (Gain) / Loss relating to Employee Benefits
31st December 2013 31st December 2012
Opening balance (Net) (177.230) -
Remeasurement Losses of Current Period Defined Benefit Plans
(156.197) (177.230)
Current Period Actuarial Difference (195.246) (221.537)
Deferred Tax of Current Period Actuarial Difference 39.049 44.307
Total (333.427) (177.230)
NOTE 30 – CAPITAL, RESERVES AND OTHER EQUITY ITEMS (Continued)
f) Reserves on Retained Earnings
31st December 2013 31st December 2012
Primary Legal Reserves 952.952 839.272
Total 952.952 839.272
g) Previous Period Profit/Loss
31st December 2013 31st December 2012
Accumulated Profit / Loss Opening 2.457.251 1.296.438
Transfer from Retained Net Profit / Loss 3.006.185 1.160.813
Affiliates Capital Adjustment (344.545) -
Dividend Distribution (3.000.000) -
1st Issue Legal Reserve Fund (113.680) -
Retained Adjustment relating to KKEG (3.169) -
Previous Period Profit/Loss 2.002.042 2.457.251
76 77
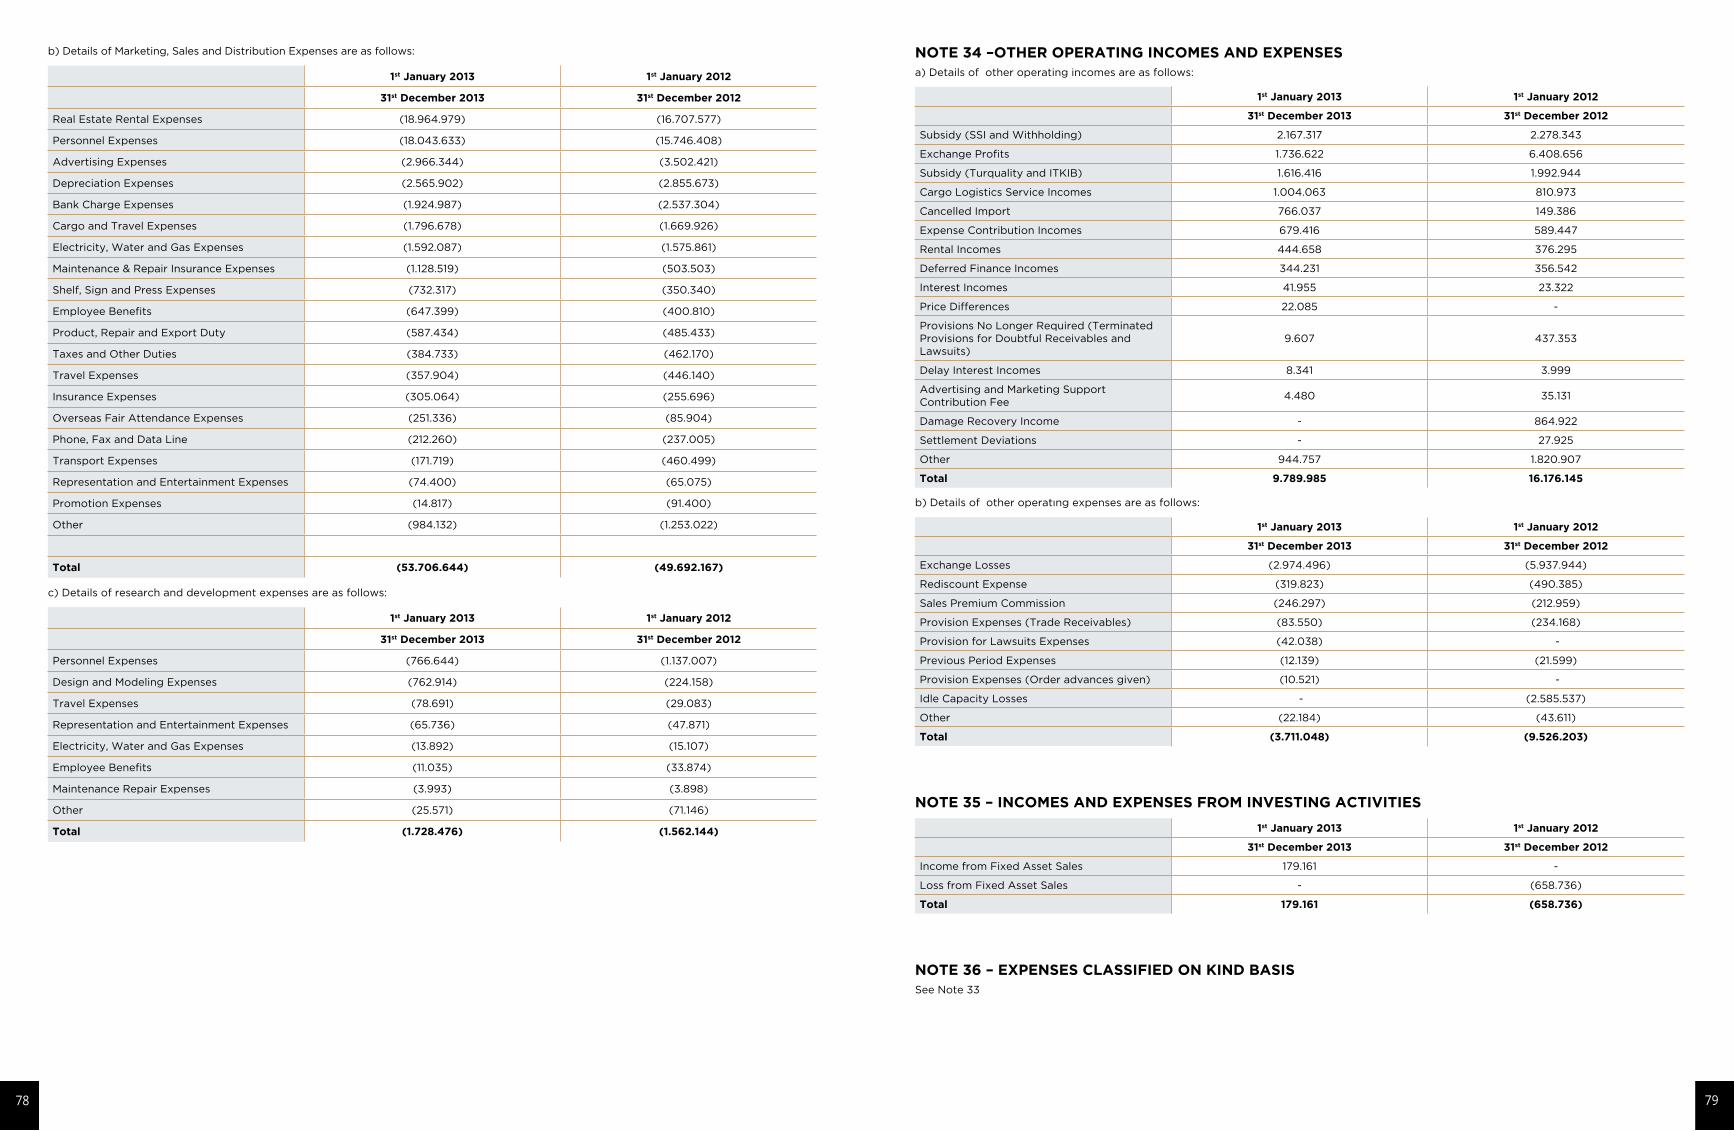
NOTE 34 –OTHER OPERATING INCOMES AND EXPENSES a) Details of other operating incomes are as follows:
1st January 2013 1st January 2012
31st December 2013 31st December 2012
Subsidy (SSI and Withholding) 2.167.317 2.278.343
Exchange Profits 1.736.622 6.408.656
Subsidy (Turquality and ITKIB) 1.616.416 1.992.944
Cargo Logistics Service Incomes 1.004.063 810.973
Cancelled Import 766.037 149.386
Expense Contribution Incomes 679.416 589.447
Rental Incomes 444.658 376.295
Deferred Finance Incomes 344.231 356.542
Interest Incomes 41.955 23.322
Price Differences 22.085 -
Provisions No Longer Required (Terminated Provisions for Doubtful Receivables and Lawsuits)
9.607 437.353
Delay Interest Incomes 8.341 3.999
Advertising and Marketing Support Contribution Fee
4.480 35.131
Damage Recovery Income - 864.922
Settlement Deviations - 27.925
Other 944.757 1.820.907
Total 9.789.985 16.176.145
b) Details of other operatıng expenses are as follows:
1st January 2013 1st January 2012
31st December 2013 31st December 2012
Exchange Losses (2.974.496) (5.937.944)
Rediscount Expense (319.823) (490.385)
Sales Premium Commission (246.297) (212.959)
Provision Expenses (Trade Receivables) (83.550) (234.168)
Provision for Lawsuits Expenses (42.038) -
Previous Period Expenses (12.139) (21.599)
Provision Expenses (Order advances given) (10.521) -
Idle Capacity Losses - (2.585.537)
Other (22.184) (43.611)
Total (3.711.048) (9.526.203)
NOTE 35 – INCOMES AND EXPENSES FROM INVESTING ACTIVITIES
1st January 2013 1st January 2012
31st December 2013 31st December 2012
Income from Fixed Asset Sales 179.161 -
Loss from Fixed Asset Sales - (658.736)
Total 179.161 (658.736)
NOTE 36 – EXPENSES CLASSIFIED ON KIND BASIS See Note 33
b) Details of Marketing, Sales and Distribution Expenses are as follows:
1st January 2013 1st January 2012
31st December 2013 31st December 2012
Real Estate Rental Expenses (18.964.979) (16.707.577)
Personnel Expenses (18.043.633) (15.746.408)
Advertising Expenses (2.966.344) (3.502.421)
Depreciation Expenses (2.565.902) (2.855.673)
Bank Charge Expenses (1.924.987) (2.537.304)
Cargo and Travel Expenses (1.796.678) (1.669.926)
Electricity, Water and Gas Expenses (1.592.087) (1.575.861)
Maintenance & Repair Insurance Expenses (1.128.519) (503.503)
Shelf, Sign and Press Expenses (732.317) (350.340)
Employee Benefits (647.399) (400.810)
Product, Repair and Export Duty (587.434) (485.433)
Taxes and Other Duties (384.733) (462.170)
Travel Expenses (357.904) (446.140)
Insurance Expenses (305.064) (255.696)
Overseas Fair Attendance Expenses (251.336) (85.904)
Phone, Fax and Data Line (212.260) (237.005)
Transport Expenses (171.719) (460.499)
Representation and Entertainment Expenses (74.400) (65.075)
Promotion Expenses (14.817) (91.400)
Other (984.132) (1.253.022)
Total (53.706.644) (49.692.167)
c) Details of research and development expenses are as follows:
1st January 2013 1st January 2012
31st December 2013 31st December 2012
Personnel Expenses (766.644) (1.137.007)
Design and Modeling Expenses (762.914) (224.158)
Travel Expenses (78.691) (29.083)
Representation and Entertainment Expenses (65.736) (47.871)
Electricity, Water and Gas Expenses (13.892) (15.107)
Employee Benefits (11.035) (33.874)
Maintenance Repair Expenses (3.993) (3.898)
Other (25.571) (71.146)
Total (1.728.476) (1.562.144)
78 79
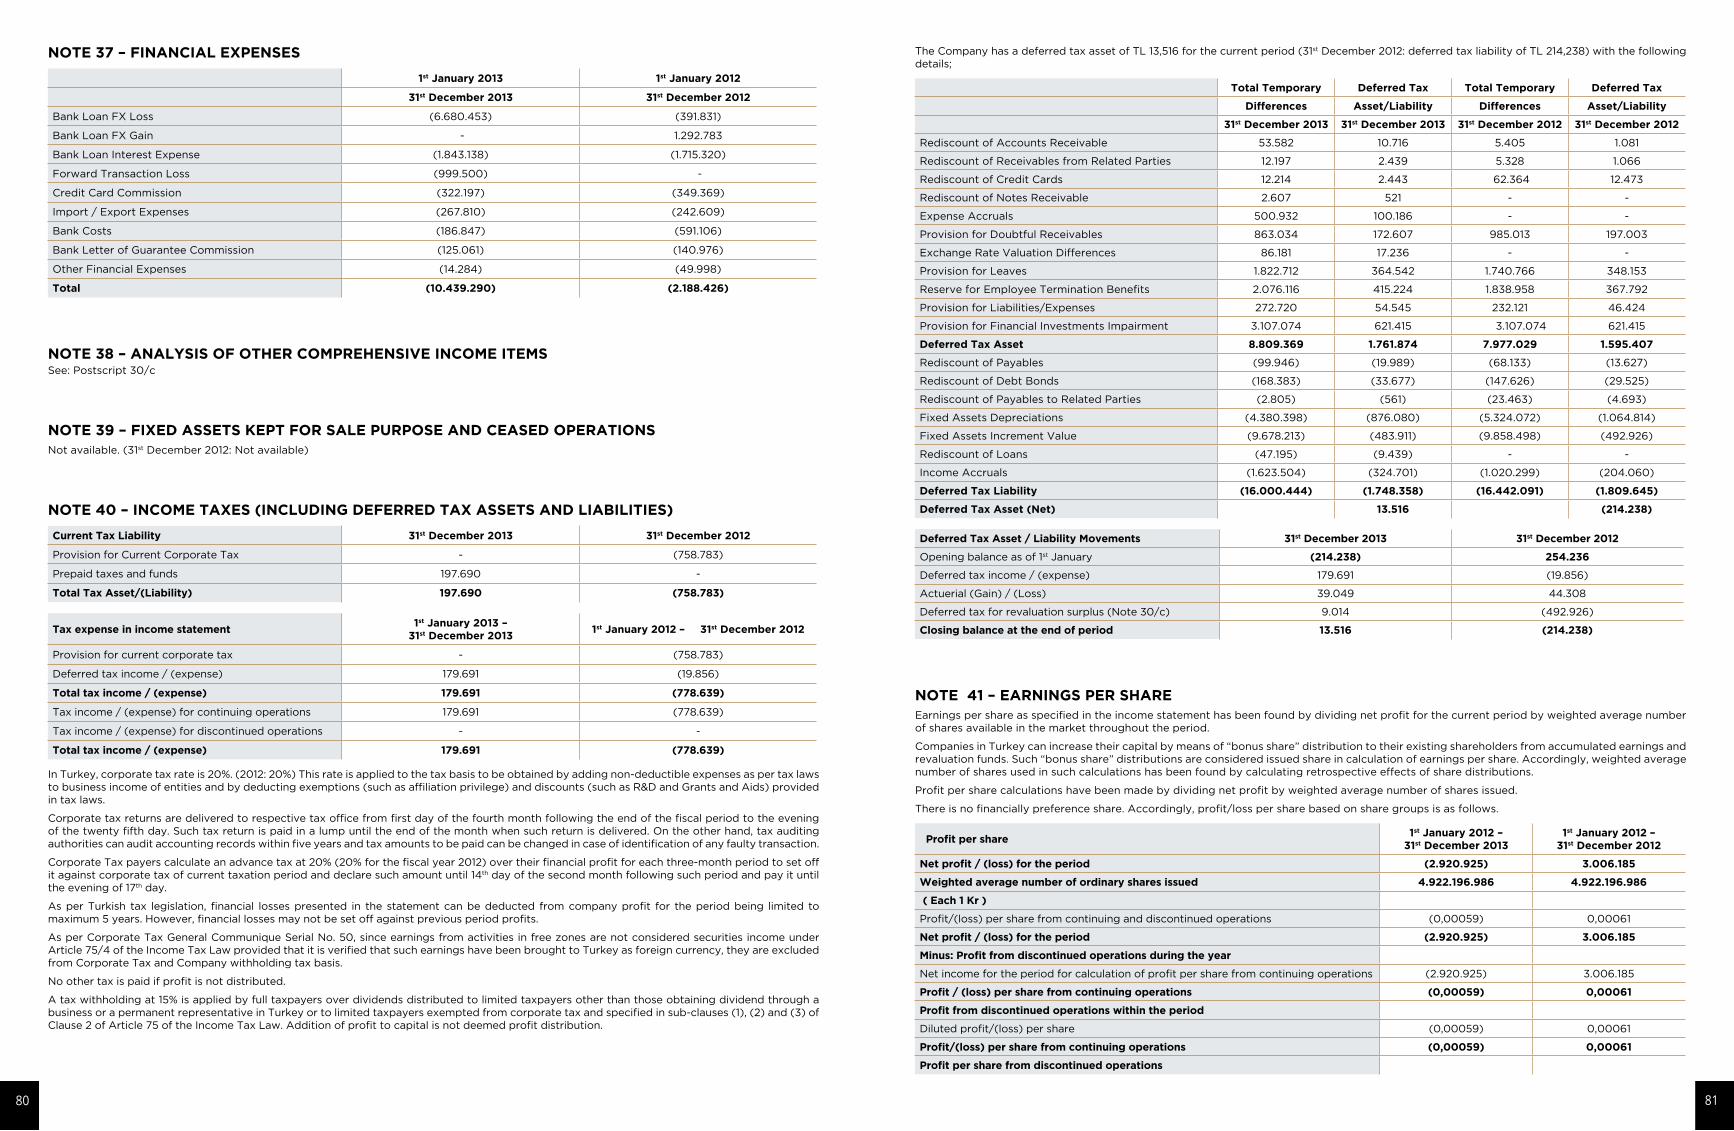
The Company has a deferred tax asset of TL 13,516 for the current period (31st December 2012: deferred tax liability of TL 214,238) with the following details;
Total Temporary Deferred Tax Total Temporary Deferred Tax
Differences Asset/Liability Differences Asset/Liability
31st December 2013 31st December 2013 31st December 2012 31st December 2012
Rediscount of Accounts Receivable 53.582 10.716 5.405 1.081
Rediscount of Receivables from Related Parties 12.197 2.439 5.328 1.066
Rediscount of Credit Cards 12.214 2.443 62.364 12.473
Rediscount of Notes Receivable 2.607 521 - -
Expense Accruals 500.932 100.186 - -
Provision for Doubtful Receivables 863.034 172.607 985.013 197.003
Exchange Rate Valuation Differences 86.181 17.236 - -
Provision for Leaves 1.822.712 364.542 1.740.766 348.153
Reserve for Employee Termination Benefits 2.076.116 415.224 1.838.958 367.792
Provision for Liabilities/Expenses 272.720 54.545 232.121 46.424
Provision for Financial Investments Impairment 3.107.074 621.415 3.107.074 621.415
Deferred Tax Asset 8.809.369 1.761.874 7.977.029 1.595.407
Rediscount of Payables (99.946) (19.989) (68.133) (13.627)
Rediscount of Debt Bonds (168.383) (33.677) (147.626) (29.525)
Rediscount of Payables to Related Parties (2.805) (561) (23.463) (4.693)
Fixed Assets Depreciations (4.380.398) (876.080) (5.324.072) (1.064.814)
Fixed Assets Increment Value (9.678.213) (483.911) (9.858.498) (492.926)
Rediscount of Loans (47.195) (9.439) - -
Income Accruals (1.623.504) (324.701) (1.020.299) (204.060)
Deferred Tax Liability (16.000.444) (1.748.358) (16.442.091) (1.809.645)
Deferred Tax Asset (Net) 13.516 (214.238)
Deferred Tax Asset / Liability Movements 31st December 2013 31st December 2012
Opening balance as of 1st January (214.238) 254.236
Deferred tax income / (expense) 179.691 (19.856)
Actuerial (Gain) / (Loss) 39.049 44.308
Deferred tax for revaluation surplus (Note 30/c) 9.014 (492.926)
Closing balance at the end of period 13.516 (214.238)
NOTE 41 – EARNINGS PER SHAREEarnings per share as specified in the income statement has been found by dividing net profit for the current period by weighted average number of shares available in the market throughout the period.
Companies in Turkey can increase their capital by means of “bonus share” distribution to their existing shareholders from accumulated earnings and revaluation funds. Such “bonus share” distributions are considered issued share in calculation of earnings per share. Accordingly, weighted average number of shares used in such calculations has been found by calculating retrospective effects of share distributions.
Profit per share calculations have been made by dividing net profit by weighted average number of shares issued.
There is no financially preference share. Accordingly, profit/loss per share based on share groups is as follows.
Profit per share1st January 2012 –
31st December 20131st January 2012 –
31st December 2012
Net profit / (loss) for the period (2.920.925) 3.006.185
Weighted average number of ordinary shares issued 4.922.196.986 4.922.196.986
( Each 1 Kr )
Profit/(loss) per share from continuing and discontinued operations (0,00059) 0,00061
Net profit / (loss) for the period (2.920.925) 3.006.185
Minus: Profit from discontinued operations during the year
Net income for the period for calculation of profit per share from continuing operations (2.920.925) 3.006.185
Profit / (loss) per share from continuing operations (0,00059) 0,00061
Profit from discontinued operations within the period
Diluted profit/(loss) per share (0,00059) 0,00061
Profit/(loss) per share from continuing operations (0,00059) 0,00061
Profit per share from discontinued operations
NOTE 37 – FINANCIAL EXPENSES
1st January 2013 1st January 2012
31st December 2013 31st December 2012
Bank Loan FX Loss (6.680.453) (391.831)
Bank Loan FX Gain - 1.292.783
Bank Loan Interest Expense (1.843.138) (1.715.320)
Forward Transaction Loss (999.500) -
Credit Card Commission (322.197) (349.369)
Import / Export Expenses (267.810) (242.609)
Bank Costs (186.847) (591.106)
Bank Letter of Guarantee Commission (125.061) (140.976)
Other Financial Expenses (14.284) (49.998)
Total (10.439.290) (2.188.426)
NOTE 38 – ANALYSIS OF OTHER COMPREHENSIVE INCOME ITEMS See: Postscript 30/c
NOTE 39 – FIXED ASSETS KEPT FOR SALE PURPOSE AND CEASED OPERATIONS Not available. (31st December 2012: Not available)
NOTE 40 – INCOME TAXES (INCLUDING DEFERRED TAX ASSETS AND LIABILITIES)
Current Tax Liability 31st December 2013 31st December 2012
Provision for Current Corporate Tax - (758.783)
Prepaid taxes and funds 197.690 -
Total Tax Asset/(Liability) 197.690 (758.783)
Tax expense in income statement1st January 2013 –
31st December 20131st January 2012 – 31st December 2012
Provision for current corporate tax - (758.783)
Deferred tax income / (expense) 179.691 (19.856)
Total tax income / (expense) 179.691 (778.639)
Tax income / (expense) for continuing operations 179.691 (778.639)
Tax income / (expense) for discontinued operations - -
Total tax income / (expense) 179.691 (778.639)
In Turkey, corporate tax rate is 20%. (2012: 20%) This rate is applied to the tax basis to be obtained by adding non-deductible expenses as per tax laws to business income of entities and by deducting exemptions (such as affiliation privilege) and discounts (such as R&D and Grants and Aids) provided in tax laws.
Corporate tax returns are delivered to respective tax office from first day of the fourth month following the end of the fiscal period to the evening of the twenty fifth day. Such tax return is paid in a lump until the end of the month when such return is delivered. On the other hand, tax auditing authorities can audit accounting records within five years and tax amounts to be paid can be changed in case of identification of any faulty transaction.
Corporate Tax payers calculate an advance tax at 20% (20% for the fiscal year 2012) over their financial profit for each three-month period to set off it against corporate tax of current taxation period and declare such amount until 14th day of the second month following such period and pay it until the evening of 17th day.
As per Turkish tax legislation, financial losses presented in the statement can be deducted from company profit for the period being limited to maximum 5 years. However, financial losses may not be set off against previous period profits.
As per Corporate Tax General Communique Serial No. 50, since earnings from activities in free zones are not considered securities income under Article 75/4 of the Income Tax Law provided that it is verified that such earnings have been brought to Turkey as foreign currency, they are excluded from Corporate Tax and Company withholding tax basis.
No other tax is paid if profit is not distributed.
A tax withholding at 15% is applied by full taxpayers over dividends distributed to limited taxpayers other than those obtaining dividend through a business or a permanent representative in Turkey or to limited taxpayers exempted from corporate tax and specified in sub-clauses (1), (2) and (3) of Clause 2 of Article 75 of the Income Tax Law. Addition of profit to capital is not deemed profit distribution.
80 81
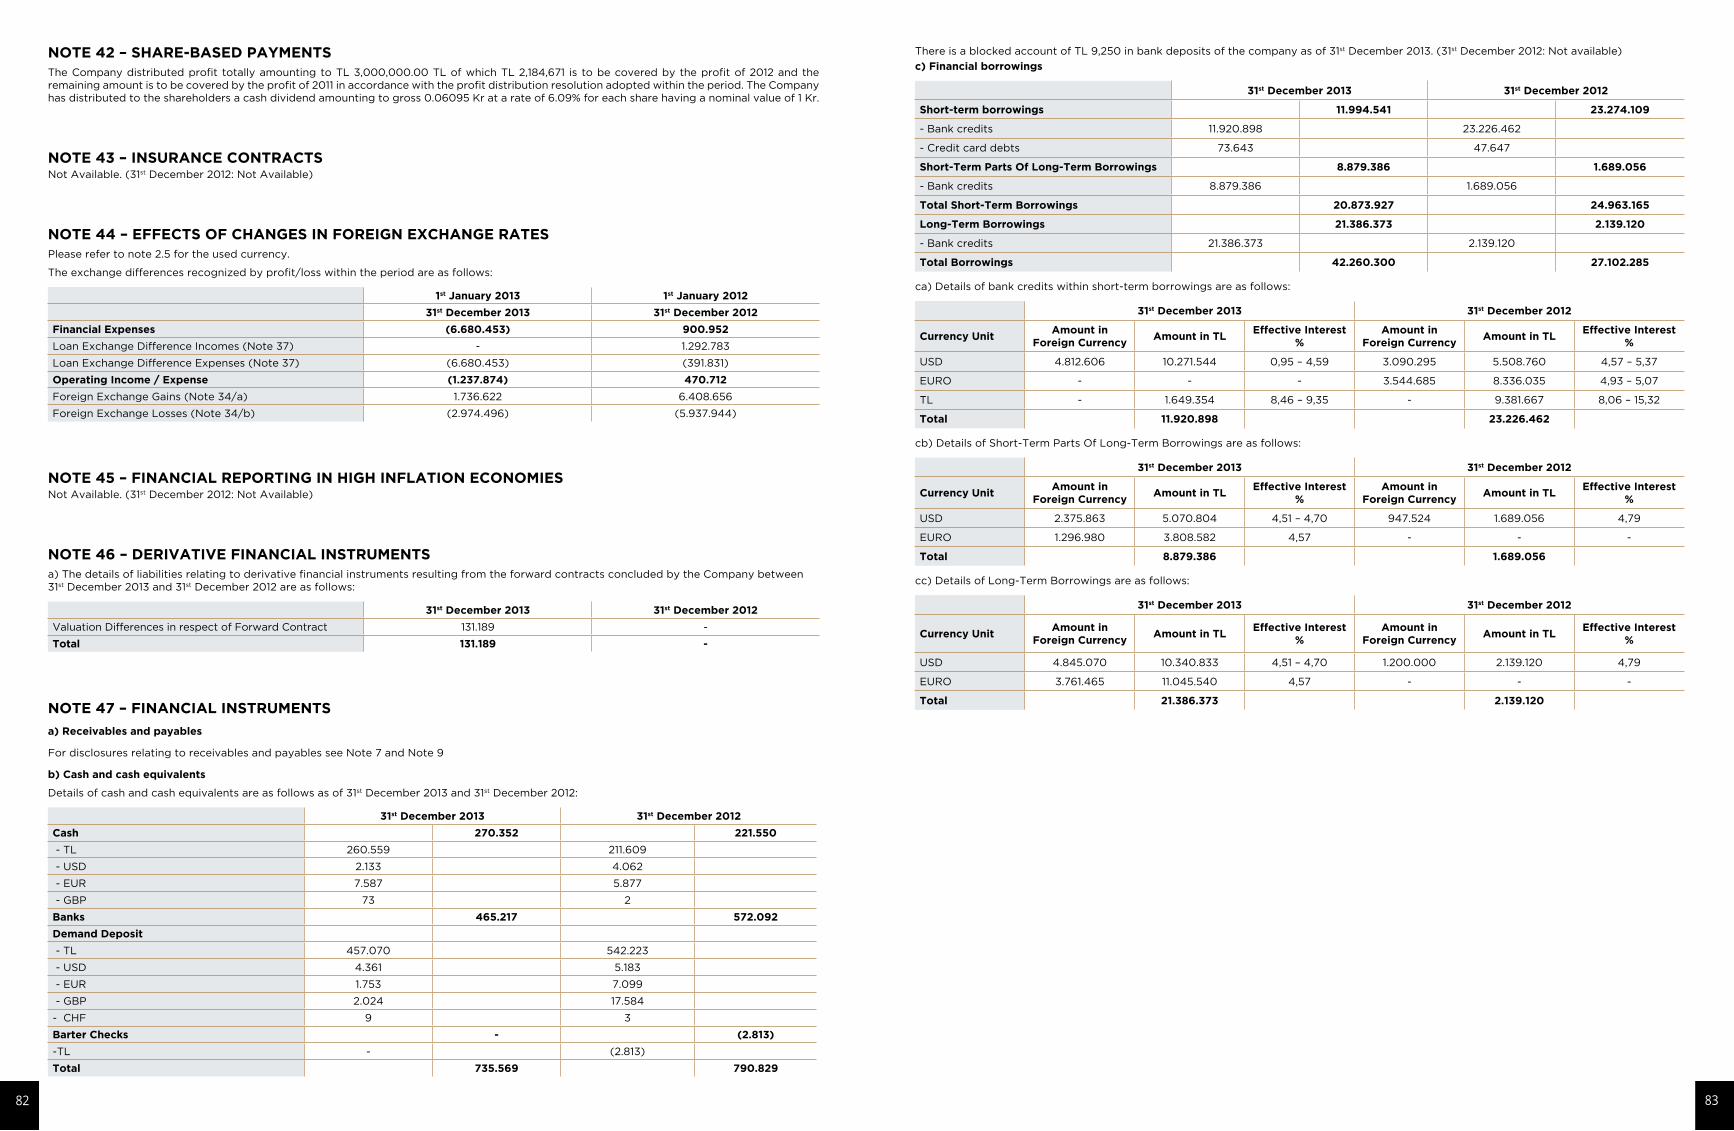
There is a blocked account of TL 9,250 in bank deposits of the company as of 31st December 2013. (31st December 2012: Not available)
c) Financial borrowings
31st December 2013 31st December 2012
Short-term borrowings 11.994.541 23.274.109
- Bank credits 11.920.898 23.226.462
- Credit card debts 73.643 47.647
Short-Term Parts Of Long-Term Borrowings 8.879.386 1.689.056
- Bank credits 8.879.386 1.689.056
Total Short-Term Borrowings 20.873.927 24.963.165
Long-Term Borrowings 21.386.373 2.139.120
- Bank credits 21.386.373 2.139.120
Total Borrowings 42.260.300 27.102.285
ca) Details of bank credits within short-term borrowings are as follows:
31st December 2013 31st December 2012
Currency UnitAmount in
Foreign CurrencyAmount in TL
Effective Interest %
Amount in Foreign Currency
Amount in TLEffective Interest
%
USD 4.812.606 10.271.544 0,95 – 4,59 3.090.295 5.508.760 4,57 – 5,37
EURO - - - 3.544.685 8.336.035 4,93 – 5,07
TL - 1.649.354 8,46 – 9,35 - 9.381.667 8,06 – 15,32
Total 11.920.898 23.226.462
cb) Details of Short-Term Parts Of Long-Term Borrowings are as follows:
31st December 2013 31st December 2012
Currency UnitAmount in
Foreign CurrencyAmount in TL
Effective Interest %
Amount in Foreign Currency
Amount in TLEffective Interest
%
USD 2.375.863 5.070.804 4,51 – 4,70 947.524 1.689.056 4,79
EURO 1.296.980 3.808.582 4,57 - - -
Total 8.879.386 1.689.056
cc) Details of Long-Term Borrowings are as follows:
31st December 2013 31st December 2012
Currency UnitAmount in
Foreign CurrencyAmount in TL
Effective Interest %
Amount in Foreign Currency
Amount in TLEffective Interest
%
USD 4.845.070 10.340.833 4,51 – 4,70 1.200.000 2.139.120 4,79
EURO 3.761.465 11.045.540 4,57 - - -
Total 21.386.373 2.139.120
NOTE 42 – SHARE-BASED PAYMENTS The Company distributed profit totally amounting to TL 3,000,000.00 TL of which TL 2,184,671 is to be covered by the profit of 2012 and the remaining amount is to be covered by the profit of 2011 in accordance with the profit distribution resolution adopted within the period. The Company has distributed to the shareholders a cash dividend amounting to gross 0.06095 Kr at a rate of 6.09% for each share having a nominal value of 1 Kr.
NOTE 43 – INSURANCE CONTRACTSNot Available. (31st December 2012: Not Available)
NOTE 44 – EFFECTS OF CHANGES IN FOREIGN EXCHANGE RATES Please refer to note 2.5 for the used currency.
The exchange differences recognized by profit/loss within the period are as follows:
1st January 2013 1st January 2012
31st December 2013 31st December 2012
Financial Expenses (6.680.453) 900.952
Loan Exchange Difference Incomes (Note 37) - 1.292.783
Loan Exchange Difference Expenses (Note 37) (6.680.453) (391.831)
Operating Income / Expense (1.237.874) 470.712
Foreign Exchange Gains (Note 34/a) 1.736.622 6.408.656
Foreign Exchange Losses (Note 34/b) (2.974.496) (5.937.944)
NOTE 45 – FINANCIAL REPORTING IN HIGH INFLATION ECONOMIES Not Available. (31st December 2012: Not Available)
NOTE 46 – DERIVATIVE FINANCIAL INSTRUMENTS a) The details of liabilities relating to derivative financial instruments resulting from the forward contracts concluded by the Company between 31st December 2013 and 31st December 2012 are as follows:
31st December 2013 31st December 2012
Valuation Differences in respect of Forward Contract 131.189 -
Total 131.189 -
NOTE 47 – FINANCIAL INSTRUMENTS
a) Receivables and payables
For disclosures relating to receivables and payables see Note 7 and Note 9
b) Cash and cash equivalents
Details of cash and cash equivalents are as follows as of 31st December 2013 and 31st December 2012:
31st December 2013 31st December 2012
Cash 270.352 221.550
- TL 260.559 211.609
- USD 2.133 4.062
- EUR 7.587 5.877
- GBP 73 2
Banks 465.217 572.092
Demand Deposit
- TL 457.070 542.223
- USD 4.361 5.183
- EUR 1.753 7.099
- GBP 2.024 17.584
- CHF 9 3
Barter Checks - (2.813)
-TL - (2.813)
Total 735.569 790.829
82 83
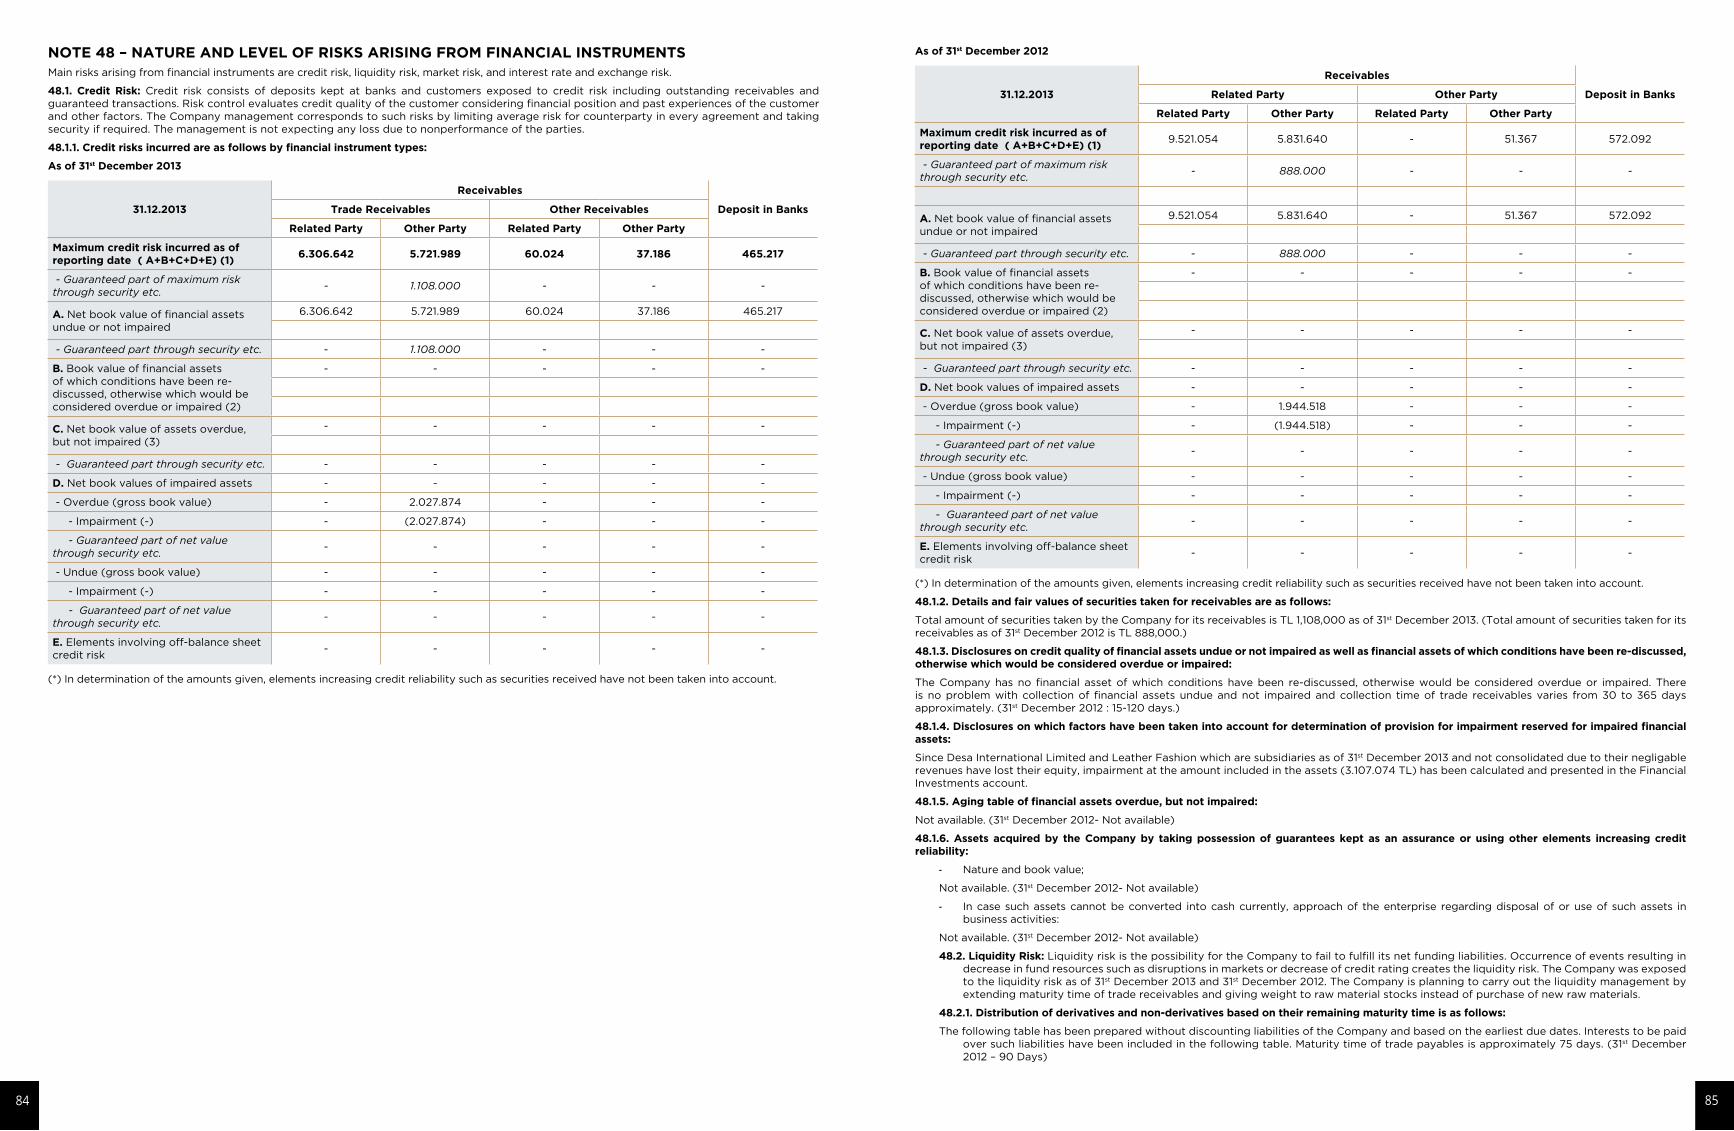
As of 31st December 2012
31.12.2013
Receivables
Deposit in BanksRelated Party Other Party
Related Party Other Party Related Party Other Party
Maximum credit risk incurred as of reporting date ( A+B+C+D+E) (1)
9.521.054 5.831.640 - 51.367 572.092
- Guaranteed part of maximum risk through security etc.
- 888.000 - - -
A. Net book value of financial assets undue or not impaired
9.521.054 5.831.640 - 51.367 572.092
- Guaranteed part through security etc. - 888.000 - - -
B. Book value of financial assets of which conditions have been re-discussed, otherwise which would be considered overdue or impaired (2)
- - - - -
C. Net book value of assets overdue, but not impaired (3)
- - - - -
- Guaranteed part through security etc. - - - - -
D. Net book values of impaired assets - - - - -
- Overdue (gross book value) - 1.944.518 - - -
- Impairment (-) - (1.944.518) - - -
- Guaranteed part of net value through security etc.
- - - - -
- Undue (gross book value) - - - - -
- Impairment (-) - - - - -
- Guaranteed part of net value through security etc.
- - - - -
E. Elements involving off-balance sheet credit risk
- - - - -
(*) In determination of the amounts given, elements increasing credit reliability such as securities received have not been taken into account.
48.1.2. Details and fair values of securities taken for receivables are as follows:
Total amount of securities taken by the Company for its receivables is TL 1,108,000 as of 31st December 2013. (Total amount of securities taken for its receivables as of 31st December 2012 is TL 888,000.)
48.1.3. Disclosures on credit quality of financial assets undue or not impaired as well as financial assets of which conditions have been re-discussed, otherwise which would be considered overdue or impaired:
The Company has no financial asset of which conditions have been re-discussed, otherwise would be considered overdue or impaired. There is no problem with collection of financial assets undue and not impaired and collection time of trade receivables varies from 30 to 365 days approximately. (31st December 2012 : 15-120 days.)
48.1.4. Disclosures on which factors have been taken into account for determination of provision for impairment reserved for impaired financial assets:
Since Desa International Limited and Leather Fashion which are subsidiaries as of 31st December 2013 and not consolidated due to their negligable revenues have lost their equity, impairment at the amount included in the assets (3.107.074 TL) has been calculated and presented in the Financial Investments account.
48.1.5. Aging table of financial assets overdue, but not impaired:
Not available. (31st December 2012- Not available)
48.1.6. Assets acquired by the Company by taking possession of guarantees kept as an assurance or using other elements increasing credit reliability:
- Nature and book value;
Not available. (31st December 2012- Not available)
- In case such assets cannot be converted into cash currently, approach of the enterprise regarding disposal of or use of such assets in business activities:
Not available. (31st December 2012- Not available)
48.2. Liquidity Risk: Liquidity risk is the possibility for the Company to fail to fulfill its net funding liabilities. Occurrence of events resulting in decrease in fund resources such as disruptions in markets or decrease of credit rating creates the liquidity risk. The Company was exposed to the liquidity risk as of 31st December 2013 and 31st December 2012. The Company is planning to carry out the liquidity management by extending maturity time of trade receivables and giving weight to raw material stocks instead of purchase of new raw materials.
48.2.1. Distribution of derivatives and non-derivatives based on their remaining maturity time is as follows:
The following table has been prepared without discounting liabilities of the Company and based on the earliest due dates. Interests to be paid over such liabilities have been included in the following table. Maturity time of trade payables is approximately 75 days. (31st December 2012 – 90 Days)
NOTE 48 – NATURE AND LEVEL OF RISKS ARISING FROM FINANCIAL INSTRUMENTSMain risks arising from financial instruments are credit risk, liquidity risk, market risk, and interest rate and exchange risk.
48.1. Credit Risk: Credit risk consists of deposits kept at banks and customers exposed to credit risk including outstanding receivables and guaranteed transactions. Risk control evaluates credit quality of the customer considering financial position and past experiences of the customer and other factors. The Company management corresponds to such risks by limiting average risk for counterparty in every agreement and taking security if required. The management is not expecting any loss due to nonperformance of the parties.
48.1.1. Credit risks incurred are as follows by financial instrument types:
As of 31st December 2013
31.12.2013
Receivables
Deposit in BanksTrade Receivables Other Receivables
Related Party Other Party Related Party Other Party
Maximum credit risk incurred as of reporting date ( A+B+C+D+E) (1)
6.306.642 5.721.989 60.024 37.186 465.217
- Guaranteed part of maximum risk through security etc.
- 1.108.000 - - -
A. Net book value of financial assets undue or not impaired
6.306.642 5.721.989 60.024 37.186 465.217
- Guaranteed part through security etc. - 1.108.000 - - -
B. Book value of financial assets of which conditions have been re-discussed, otherwise which would be considered overdue or impaired (2)
- - - - -
C. Net book value of assets overdue, but not impaired (3)
- - - - -
- Guaranteed part through security etc. - - - - -
D. Net book values of impaired assets - - - - -
- Overdue (gross book value) - 2.027.874 - - -
- Impairment (-) - (2.027.874) - - -
- Guaranteed part of net value through security etc.
- - - - -
- Undue (gross book value) - - - - -
- Impairment (-) - - - - -
- Guaranteed part of net value through security etc.
- - - - -
E. Elements involving off-balance sheet credit risk
- - - - -
(*) In determination of the amounts given, elements increasing credit reliability such as securities received have not been taken into account.
84 85
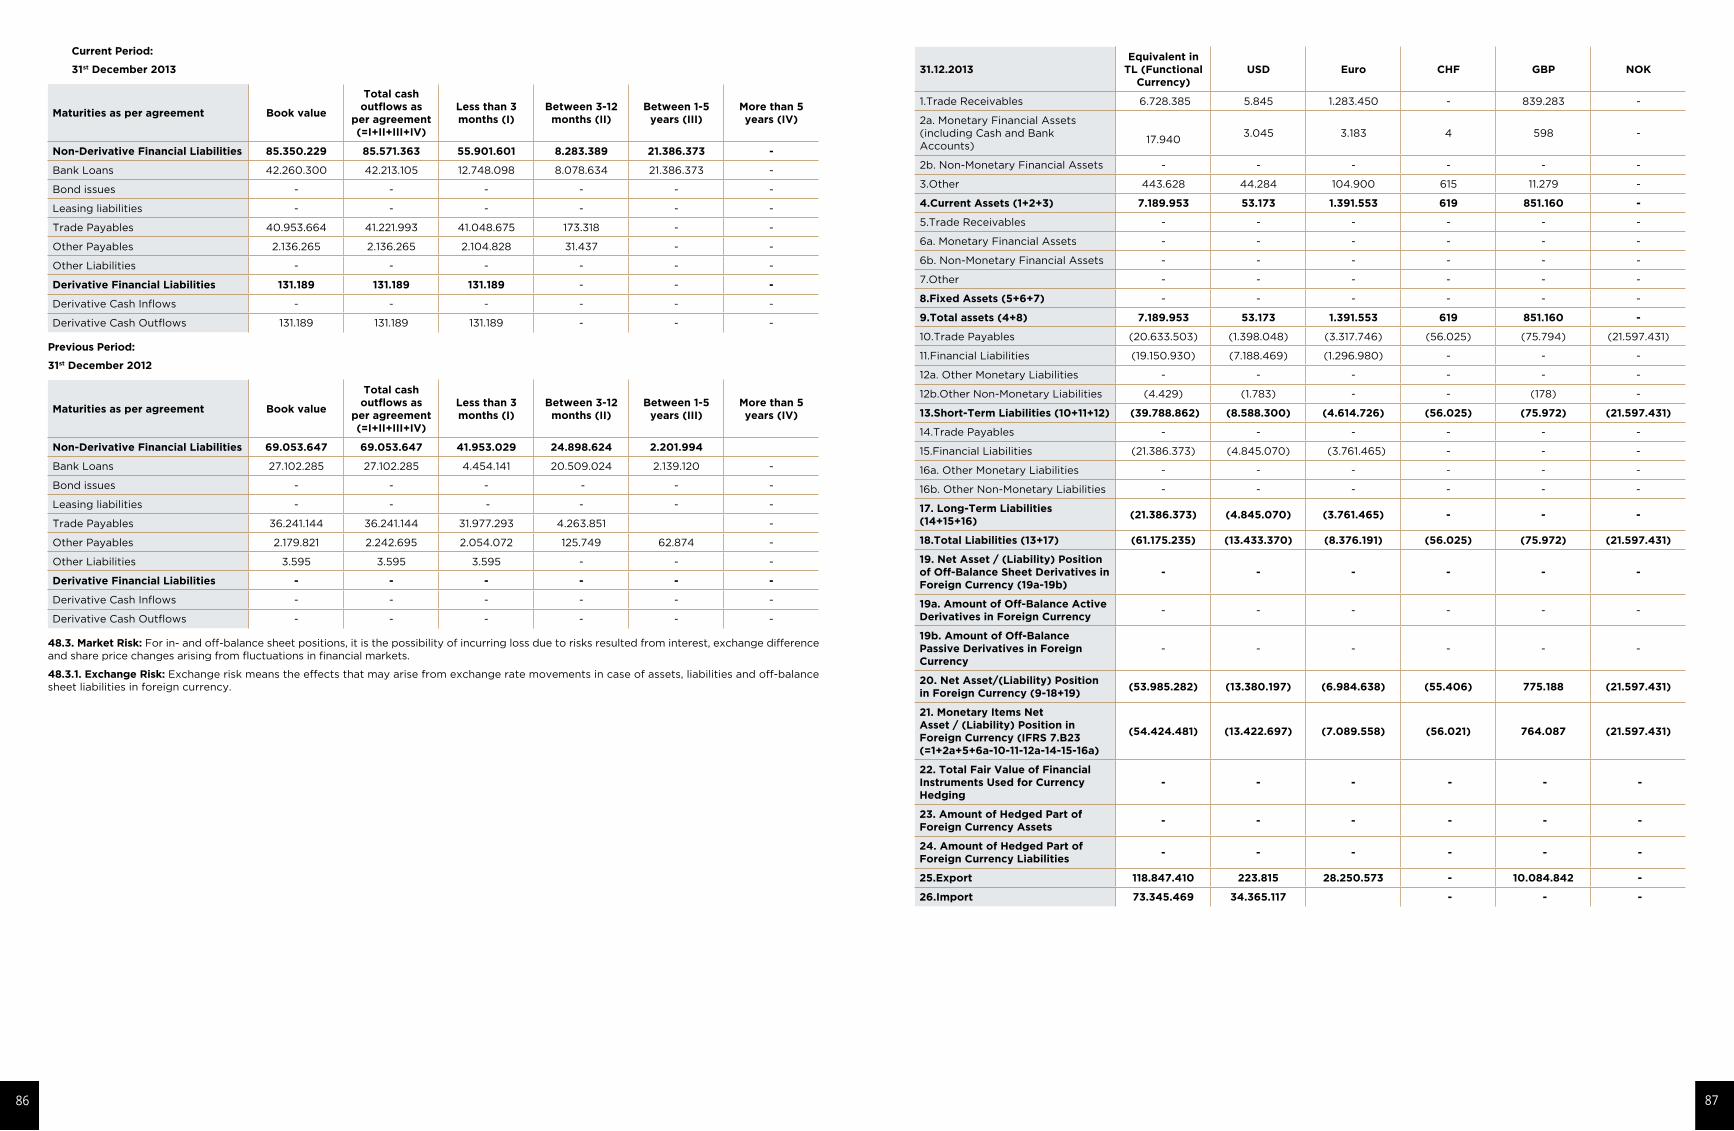
31.12.2013Equivalent in
TL (Functional Currency)
USD Euro CHF GBP NOK
1.Trade Receivables 6.728.385 5.845 1.283.450 - 839.283 -
2a. Monetary Financial Assets (including Cash and Bank Accounts)
17.940
3.045 3.183 4 598 -
2b. Non-Monetary Financial Assets - - - - - -
3.Other 443.628 44.284 104.900 615 11.279 -
4.Current Assets (1+2+3) 7.189.953 53.173 1.391.553 619 851.160 -
5.Trade Receivables - - - - - -
6a. Monetary Financial Assets - - - - - -
6b. Non-Monetary Financial Assets - - - - - -
7.Other - - - - - -
8.Fixed Assets (5+6+7) - - - - - -
9.Total assets (4+8) 7.189.953 53.173 1.391.553 619 851.160 -
10.Trade Payables (20.633.503) (1.398.048) (3.317.746) (56.025) (75.794) (21.597.431)
11.Financial Liabilities (19.150.930) (7.188.469) (1.296.980) - - -
12a. Other Monetary Liabilities - - - - - -
12b.Other Non-Monetary Liabilities (4.429) (1.783) - - (178) -
13.Short-Term Liabilities (10+11+12) (39.788.862) (8.588.300) (4.614.726) (56.025) (75.972) (21.597.431)
14.Trade Payables - - - - - -
15.Financial Liabilities (21.386.373) (4.845.070) (3.761.465) - - -
16a. Other Monetary Liabilities - - - - - -
16b. Other Non-Monetary Liabilities - - - - - -
17. Long-Term Liabilities (14+15+16)
(21.386.373) (4.845.070) (3.761.465) - - -
18.Total Liabilities (13+17) (61.175.235) (13.433.370) (8.376.191) (56.025) (75.972) (21.597.431)
19. Net Asset / (Liability) Position of Off-Balance Sheet Derivatives in Foreign Currency (19a-19b)
- - - - - -
19a. Amount of Off-Balance Active Derivatives in Foreign Currency
- - - - - -
19b. Amount of Off-Balance Passive Derivatives in Foreign Currency
- - - - - -
20. Net Asset/(Liability) Position in Foreign Currency (9-18+19)
(53.985.282) (13.380.197) (6.984.638) (55.406) 775.188 (21.597.431)
21. Monetary Items Net Asset / (Liability) Position in Foreign Currency (IFRS 7.B23 (=1+2a+5+6a-10-11-12a-14-15-16a)
(54.424.481) (13.422.697) (7.089.558) (56.021) 764.087 (21.597.431)
22. Total Fair Value of Financial Instruments Used for Currency Hedging
- - - - - -
23. Amount of Hedged Part of Foreign Currency Assets
- - - - - -
24. Amount of Hedged Part of Foreign Currency Liabilities
- - - - - -
25.Export 118.847.410 223.815 28.250.573 - 10.084.842 -
26.Import 73.345.469 34.365.117 - - -
Current Period:
31st December 2013
Maturities as per agreement Book value
Total cash outflows as
per agreement (=I+II+III+IV)
Less than 3 months (I)
Between 3-12 months (II)
Between 1-5 years (III)
More than 5 years (IV)
Non-Derivative Financial Liabilities 85.350.229 85.571.363 55.901.601 8.283.389 21.386.373 -
Bank Loans 42.260.300 42.213.105 12.748.098 8.078.634 21.386.373 -
Bond issues - - - - - -
Leasing liabilities - - - - - -
Trade Payables 40.953.664 41.221.993 41.048.675 173.318 - -
Other Payables 2.136.265 2.136.265 2.104.828 31.437 - -
Other Liabilities - - - - - -
Derivative Financial Liabilities 131.189 131.189 131.189 - - -
Derivative Cash Inflows - - - - - -
Derivative Cash Outflows 131.189 131.189 131.189 - - -
Previous Period:
31st December 2012
Maturities as per agreement Book value
Total cash outflows as
per agreement (=I+II+III+IV)
Less than 3 months (I)
Between 3-12 months (II)
Between 1-5 years (III)
More than 5 years (IV)
Non-Derivative Financial Liabilities 69.053.647 69.053.647 41.953.029 24.898.624 2.201.994
Bank Loans 27.102.285 27.102.285 4.454.141 20.509.024 2.139.120 -
Bond issues - - - - - -
Leasing liabilities - - - - - -
Trade Payables 36.241.144 36.241.144 31.977.293 4.263.851 -
Other Payables 2.179.821 2.242.695 2.054.072 125.749 62.874 -
Other Liabilities 3.595 3.595 3.595 - - -
Derivative Financial Liabilities - - - - - -
Derivative Cash Inflows - - - - - -
Derivative Cash Outflows - - - - - -
48.3. Market Risk: For in- and off-balance sheet positions, it is the possibility of incurring loss due to risks resulted from interest, exchange difference and share price changes arising from fluctuations in financial markets.
48.3.1. Exchange Risk: Exchange risk means the effects that may arise from exchange rate movements in case of assets, liabilities and off-balance sheet liabilities in foreign currency.
86 87
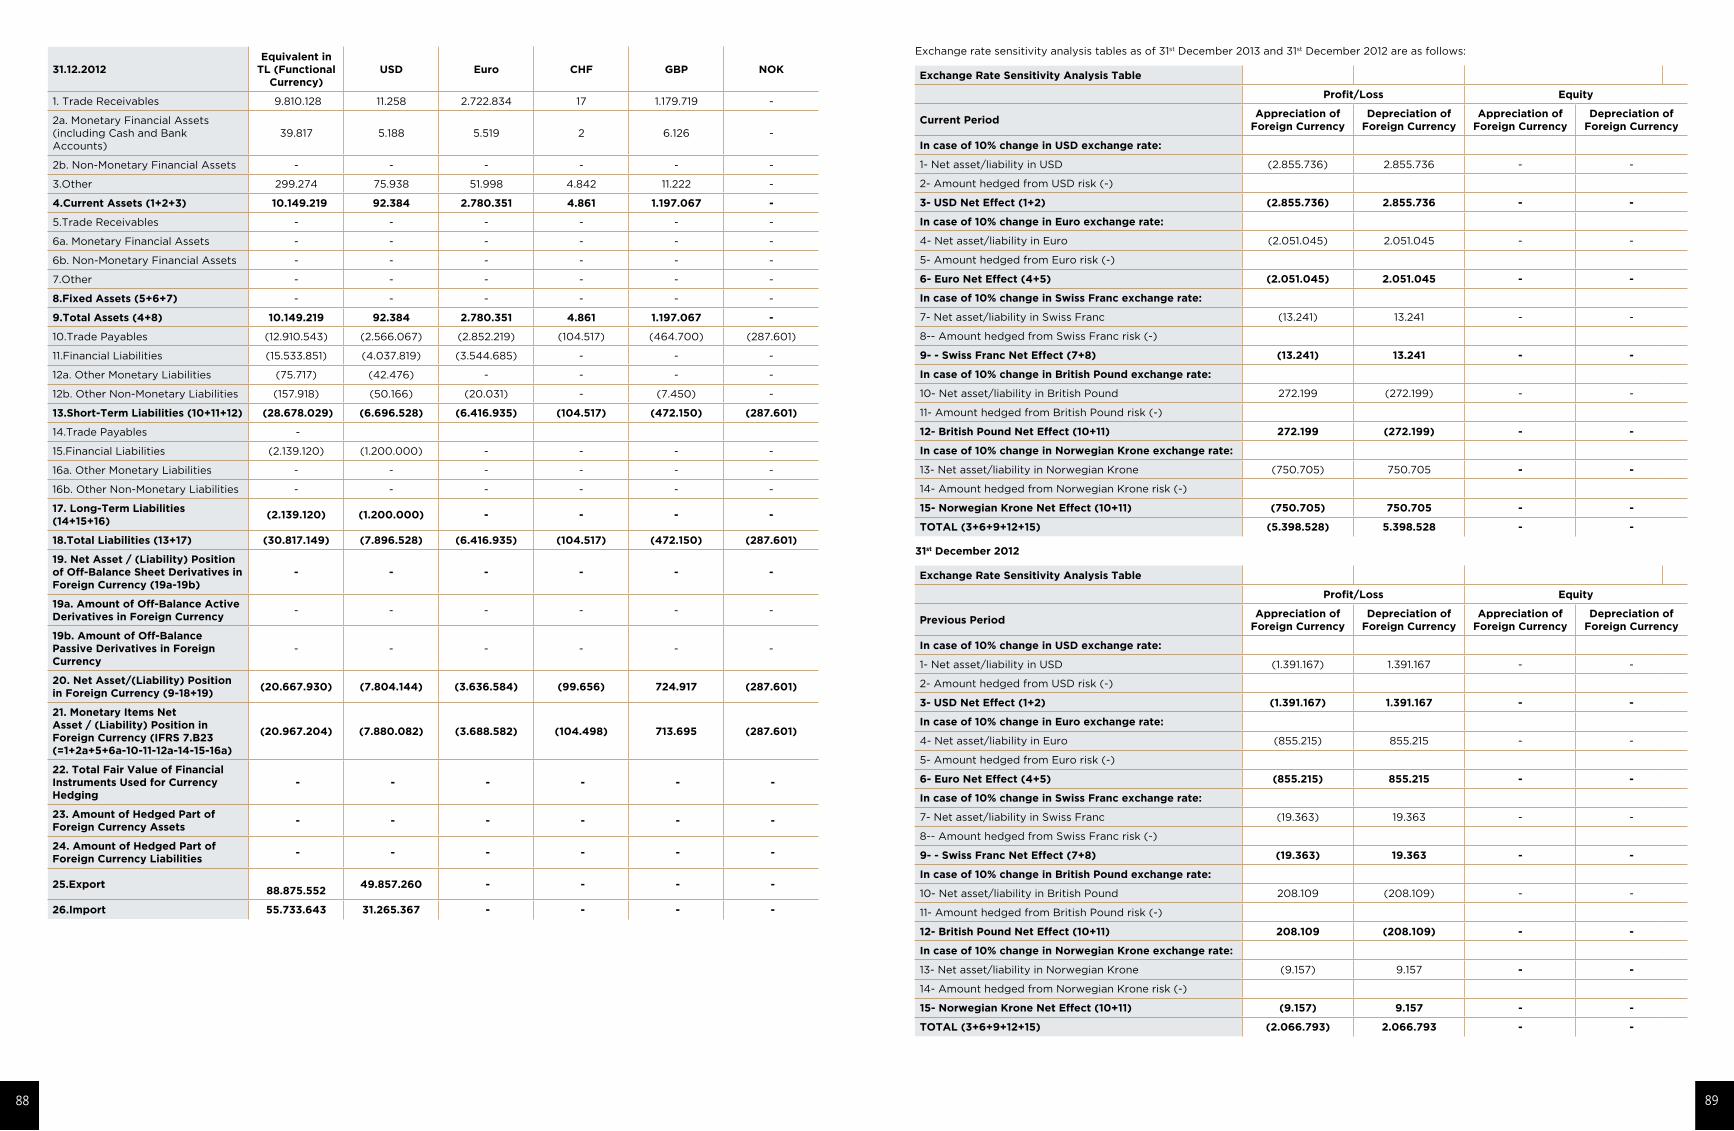
Exchange rate sensitivity analysis tables as of 31st December 2013 and 31st December 2012 are as follows:
Exchange Rate Sensitivity Analysis Table
Profit/Loss Equity
Current PeriodAppreciation of
Foreign CurrencyDepreciation of
Foreign CurrencyAppreciation of
Foreign CurrencyDepreciation of
Foreign Currency
In case of 10% change in USD exchange rate:
1- Net asset/liability in USD (2.855.736) 2.855.736 - -
2- Amount hedged from USD risk (-)
3- USD Net Effect (1+2) (2.855.736) 2.855.736 - -
In case of 10% change in Euro exchange rate:
4- Net asset/liability in Euro (2.051.045) 2.051.045 - -
5- Amount hedged from Euro risk (-)
6- Euro Net Effect (4+5) (2.051.045) 2.051.045 - -
In case of 10% change in Swiss Franc exchange rate:
7- Net asset/liability in Swiss Franc (13.241) 13.241 - -
8-- Amount hedged from Swiss Franc risk (-)
9- - Swiss Franc Net Effect (7+8) (13.241) 13.241 - -
In case of 10% change in British Pound exchange rate:
10- Net asset/liability in British Pound 272.199 (272.199) - -
11- Amount hedged from British Pound risk (-)
12- British Pound Net Effect (10+11) 272.199 (272.199) - -
In case of 10% change in Norwegian Krone exchange rate:
13- Net asset/liability in Norwegian Krone (750.705) 750.705 - -
14- Amount hedged from Norwegian Krone risk (-)
15- Norwegian Krone Net Effect (10+11) (750.705) 750.705 - -
TOTAL (3+6+9+12+15) (5.398.528) 5.398.528 - -
31st December 2012
Exchange Rate Sensitivity Analysis Table
Profit/Loss Equity
Previous PeriodAppreciation of
Foreign CurrencyDepreciation of
Foreign CurrencyAppreciation of
Foreign CurrencyDepreciation of
Foreign Currency
In case of 10% change in USD exchange rate:
1- Net asset/liability in USD (1.391.167) 1.391.167 - -
2- Amount hedged from USD risk (-)
3- USD Net Effect (1+2) (1.391.167) 1.391.167 - -
In case of 10% change in Euro exchange rate:
4- Net asset/liability in Euro (855.215) 855.215 - -
5- Amount hedged from Euro risk (-)
6- Euro Net Effect (4+5) (855.215) 855.215 - -
In case of 10% change in Swiss Franc exchange rate:
7- Net asset/liability in Swiss Franc (19.363) 19.363 - -
8-- Amount hedged from Swiss Franc risk (-)
9- - Swiss Franc Net Effect (7+8) (19.363) 19.363 - -
In case of 10% change in British Pound exchange rate:
10- Net asset/liability in British Pound 208.109 (208.109) - -
11- Amount hedged from British Pound risk (-)
12- British Pound Net Effect (10+11) 208.109 (208.109) - -
In case of 10% change in Norwegian Krone exchange rate:
13- Net asset/liability in Norwegian Krone (9.157) 9.157 - -
14- Amount hedged from Norwegian Krone risk (-)
15- Norwegian Krone Net Effect (10+11) (9.157) 9.157 - -
TOTAL (3+6+9+12+15) (2.066.793) 2.066.793 - -
31.12.2012Equivalent in
TL (Functional Currency)
USD Euro CHF GBP NOK
1. Trade Receivables 9.810.128 11.258 2.722.834 17 1.179.719 -
2a. Monetary Financial Assets (including Cash and Bank Accounts)
39.817 5.188 5.519 2 6.126 -
2b. Non-Monetary Financial Assets - - - - - -
3.Other 299.274 75.938 51.998 4.842 11.222 -
4.Current Assets (1+2+3) 10.149.219 92.384 2.780.351 4.861 1.197.067 -
5.Trade Receivables - - - - - -
6a. Monetary Financial Assets - - - - - -
6b. Non-Monetary Financial Assets - - - - - -
7.Other - - - - - -
8.Fixed Assets (5+6+7) - - - - - -
9.Total Assets (4+8) 10.149.219 92.384 2.780.351 4.861 1.197.067 -
10.Trade Payables (12.910.543) (2.566.067) (2.852.219) (104.517) (464.700) (287.601)
11.Financial Liabilities (15.533.851) (4.037.819) (3.544.685) - - -
12a. Other Monetary Liabilities (75.717) (42.476) - - - -
12b. Other Non-Monetary Liabilities (157.918) (50.166) (20.031) - (7.450) -
13.Short-Term Liabilities (10+11+12) (28.678.029) (6.696.528) (6.416.935) (104.517) (472.150) (287.601)
14.Trade Payables -
15.Financial Liabilities (2.139.120) (1.200.000) - - - -
16a. Other Monetary Liabilities - - - - - -
16b. Other Non-Monetary Liabilities - - - - - -
17. Long-Term Liabilities (14+15+16)
(2.139.120) (1.200.000) - - - -
18.Total Liabilities (13+17) (30.817.149) (7.896.528) (6.416.935) (104.517) (472.150) (287.601)
19. Net Asset / (Liability) Position of Off-Balance Sheet Derivatives in Foreign Currency (19a-19b)
- - - - - -
19a. Amount of Off-Balance Active Derivatives in Foreign Currency
- - - - - -
19b. Amount of Off-Balance Passive Derivatives in Foreign Currency
- - - - - -
20. Net Asset/(Liability) Position in Foreign Currency (9-18+19)
(20.667.930) (7.804.144) (3.636.584) (99.656) 724.917 (287.601)
21. Monetary Items Net Asset / (Liability) Position in Foreign Currency (IFRS 7.B23 (=1+2a+5+6a-10-11-12a-14-15-16a)
(20.967.204) (7.880.082) (3.688.582) (104.498) 713.695 (287.601)
22. Total Fair Value of Financial Instruments Used for Currency Hedging
- - - - - -
23. Amount of Hedged Part of Foreign Currency Assets
- - - - - -
24. Amount of Hedged Part of Foreign Currency Liabilities
- - - - - -
25.Export
88.875.552 49.857.260 - - - -
26.Import 55.733.643 31.265.367 - - - -
88 89
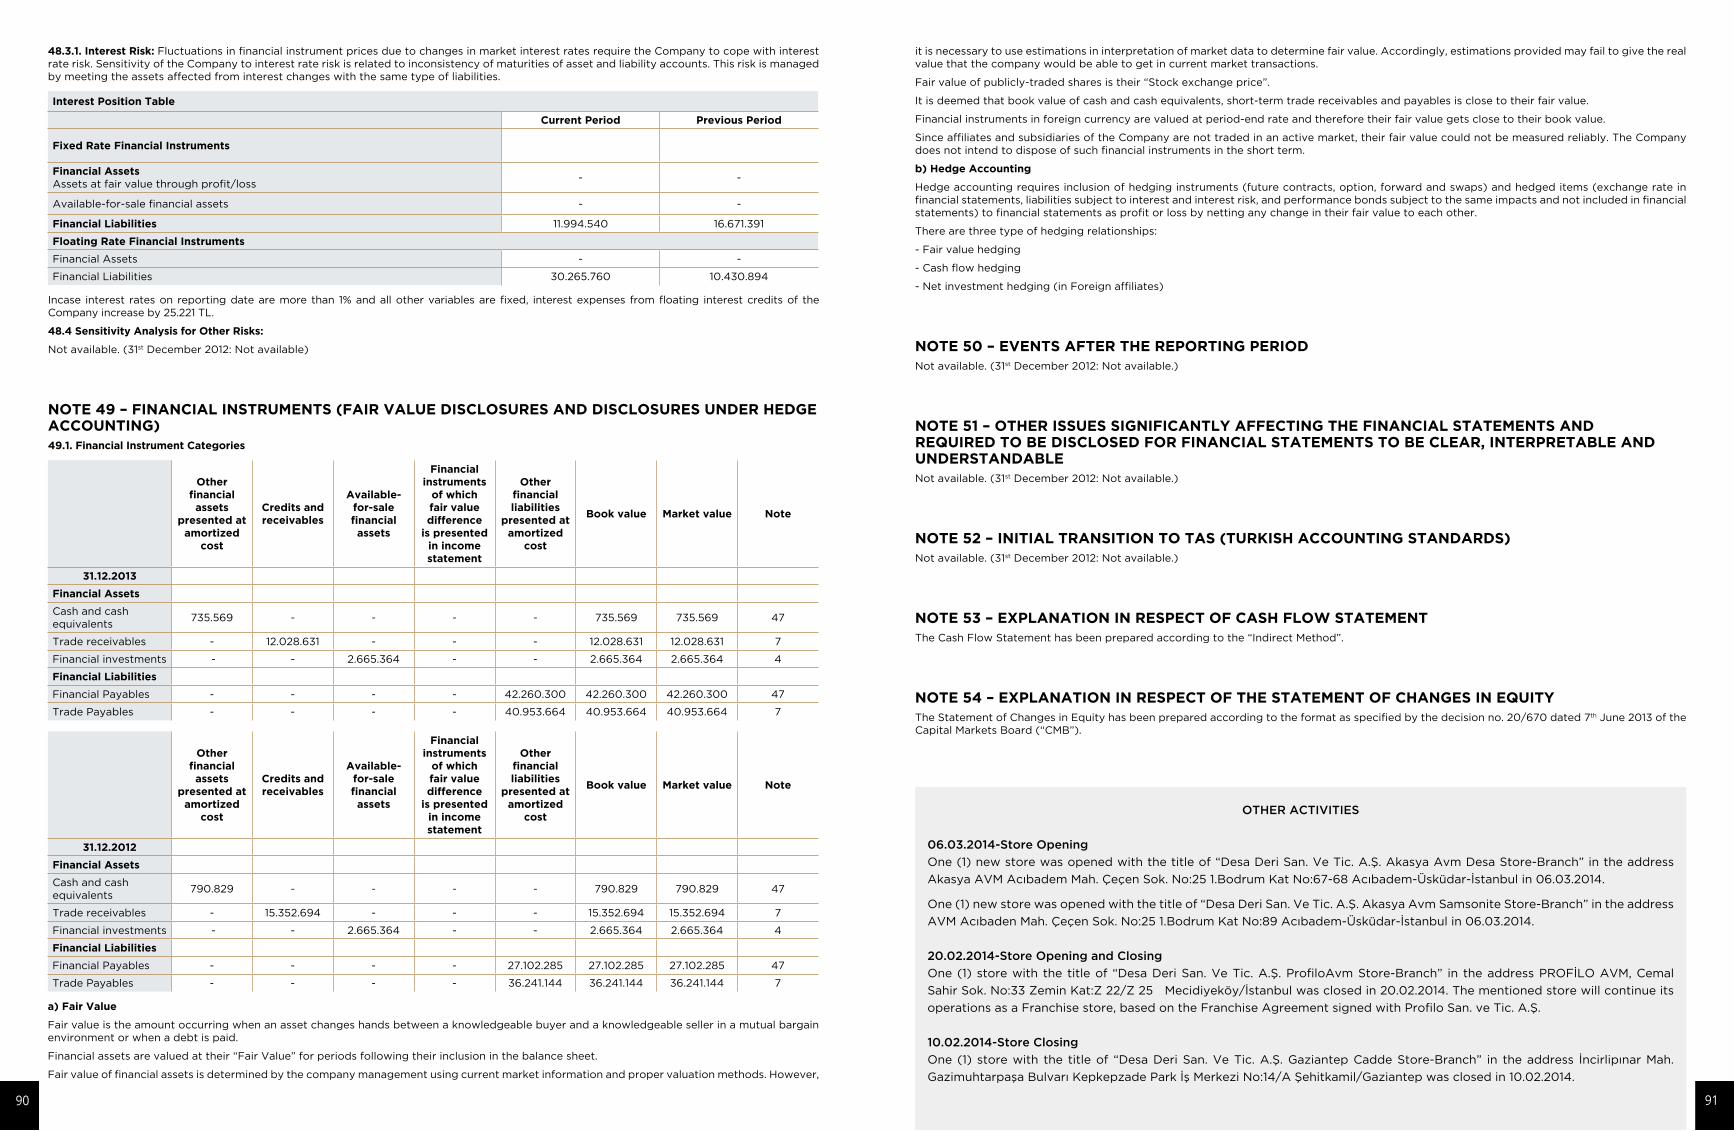
it is necessary to use estimations in interpretation of market data to determine fair value. Accordingly, estimations provided may fail to give the real value that the company would be able to get in current market transactions.
Fair value of publicly-traded shares is their “Stock exchange price”.
It is deemed that book value of cash and cash equivalents, short-term trade receivables and payables is close to their fair value.
Financial instruments in foreign currency are valued at period-end rate and therefore their fair value gets close to their book value.
Since affiliates and subsidiaries of the Company are not traded in an active market, their fair value could not be measured reliably. The Company does not intend to dispose of such financial instruments in the short term.
b) Hedge Accounting
Hedge accounting requires inclusion of hedging instruments (future contracts, option, forward and swaps) and hedged items (exchange rate in financial statements, liabilities subject to interest and interest risk, and performance bonds subject to the same impacts and not included in financial statements) to financial statements as profit or loss by netting any change in their fair value to each other.
There are three type of hedging relationships:
- Fair value hedging
- Cash flow hedging
- Net investment hedging (in Foreign affiliates)
NOTE 50 – EVENTS AFTER THE REPORTING PERIOD Not available. (31st December 2012: Not available.)
NOTE 51 – OTHER ISSUES SIGNIFICANTLY AFFECTING THE FINANCIAL STATEMENTS AND REQUIRED TO BE DISCLOSED FOR FINANCIAL STATEMENTS TO BE CLEAR, INTERPRETABLE AND UNDERSTANDABLENot available. (31st December 2012: Not available.)
NOTE 52 – INITIAL TRANSITION TO TAS (TURKISH ACCOUNTING STANDARDS) Not available. (31st December 2012: Not available.)
NOTE 53 – EXPLANATION IN RESPECT OF CASH FLOW STATEMENT The Cash Flow Statement has been prepared according to the “Indirect Method”.
NOTE 54 – EXPLANATION IN RESPECT OF THE STATEMENT OF CHANGES IN EQUITY The Statement of Changes in Equity has been prepared according to the format as specified by the decision no. 20/670 dated 7th June 2013 of the Capital Markets Board (“CMB”).
OTHER ACTIVITIES
06.03.2014-Store Opening
One (1) new store was opened with the title of “Desa Deri San. Ve Tic. A.Ş. Akasya Avm Desa Store-Branch” in the address
Akasya AVM Acıbadem Mah. Çeçen Sok. No:25 1.Bodrum Kat No:67-68 Acıbadem-Üsküdar-İstanbul in 06.03.2014.
One (1) new store was opened with the title of “Desa Deri San. Ve Tic. A.Ş. Akasya Avm Samsonite Store-Branch” in the address
AVM Acıbaden Mah. Çeçen Sok. No:25 1.Bodrum Kat No:89 Acıbadem-Üsküdar-İstanbul in 06.03.2014.
20.02.2014-Store Opening and Closing
One (1) store with the title of “Desa Deri San. Ve Tic. A.Ş. ProfiloAvm Store-Branch” in the address PROFİLO AVM, Cemal
Sahir Sok. No:33 Zemin Kat:Z 22/Z 25 Mecidiyeköy/İstanbul was closed in 20.02.2014. The mentioned store will continue its
operations as a Franchise store, based on the Franchise Agreement signed with Profilo San. ve Tic. A.Ş.
10.02.2014-Store Closing
One (1) store with the title of “Desa Deri San. Ve Tic. A.Ş. Gaziantep Cadde Store-Branch” in the address İncirlipınar Mah.
Gazimuhtarpaşa Bulvarı Kepkepzade Park İş Merkezi No:14/A Şehitkamil/Gaziantep was closed in 10.02.2014.
48.3.1. Interest Risk: Fluctuations in financial instrument prices due to changes in market interest rates require the Company to cope with interest rate risk. Sensitivity of the Company to interest rate risk is related to inconsistency of maturities of asset and liability accounts. This risk is managed by meeting the assets affected from interest changes with the same type of liabilities.
Interest Position Table
Current Period Previous Period
Fixed Rate Financial Instruments
Financial AssetsAssets at fair value through profit/loss
- -
Available-for-sale financial assets - -
Financial Liabilities 11.994.540 16.671.391
Floating Rate Financial Instruments
Financial Assets - -
Financial Liabilities 30.265.760 10.430.894
Incase interest rates on reporting date are more than 1% and all other variables are fixed, interest expenses from floating interest credits of the Company increase by 25.221 TL.
48.4 Sensitivity Analysis for Other Risks:
Not available. (31st December 2012: Not available)
NOTE 49 – FINANCIAL INSTRUMENTS (FAIR VALUE DISCLOSURES AND DISCLOSURES UNDER HEDGE ACCOUNTING)49.1. Financial Instrument Categories
Other financial assets
presented at amortized
cost
Credits and receivables
Available-for-sale financial assets
Financial instruments
of which fair value difference
is presented in income statement
Other financial liabilities
presented at amortized
cost
Book value Market value Note
31.12.2013
Financial Assets
Cash and cash equivalents
735.569 - - - - 735.569 735.569 47
Trade receivables - 12.028.631 - - - 12.028.631 12.028.631 7
Financial investments - - 2.665.364 - - 2.665.364 2.665.364 4
Financial Liabilities
Financial Payables - - - - 42.260.300 42.260.300 42.260.300 47
Trade Payables - - - - 40.953.664 40.953.664 40.953.664 7
Other financial assets
presented at amortized
cost
Credits and receivables
Available-for-sale financial assets
Financial instruments
of which fair value difference
is presented in income statement
Other financial liabilities
presented at amortized
cost
Book value Market value Note
31.12.2012
Financial Assets
Cash and cash equivalents
790.829 - - - - 790.829 790.829 47
Trade receivables - 15.352.694 - - - 15.352.694 15.352.694 7
Financial investments - - 2.665.364 - - 2.665.364 2.665.364 4
Financial Liabilities
Financial Payables - - - - 27.102.285 27.102.285 27.102.285 47
Trade Payables - - - - 36.241.144 36.241.144 36.241.144 7
a) Fair Value
Fair value is the amount occurring when an asset changes hands between a knowledgeable buyer and a knowledgeable seller in a mutual bargain environment or when a debt is paid.
Financial assets are valued at their “Fair Value” for periods following their inclusion in the balance sheet.
Fair value of financial assets is determined by the company management using current market information and proper valuation methods. However,
90 91
ADANA
Desa Seyhan
Desa Real
ANKARA
Desa Migros
Desa Cepa
Desa Panora
Desa Optimum
Desa Kentpark
Desa Armada
Desa Kızılay
Desa Esenboğa
ANTALYA
Desa Migros
Desa Deepo
AYDIN
Desa Söke
AFYON
Desa İkbal
BALIKESİR
Desa Susurluk
BOLU
Desa Highway
BİLECİK
Desa Bozöyük
BURSA
Desa Korupark
Desa Anatolium
DENİZLİ
Desa Forum
ESKİŞEHİR
Desa Espark
Desa Neo
GAZİANTEP
Desa Real
Desa Cadde
Desa Sankopark
Desa Forum
İSKENDERUN
Desa PrimeMall
İSTANBUL
Desa Ataköy Galeria
Desa Beylikdüzü Migros
Desa Beyoğlu
Desa Capitol
Desa Nişantaşı Abdi İpekçi
Desa Profilo
Desa Suadiye
Desa Olivium
Desa Fabrika
Desa Metrocity
Desa Maltepe Carrefour
Desa İçerenköy Carrefour
Desa Carreusel
Desa İdealtepe
Desa Astoria
Desa Kartal M1 Tepe
Desa Nautilius
Desa Palladium
Desa İstinyepark
Desa Optimum
Desa Viaport
Desa Ataköy Konakları
Desa Torium
Desa Marmara Forum
Desa Airport
Desa Starcity
Desa Forum
Desa Göztepe
Desa Buyaka
Desa Cevahir
Desa Vialand
Desa Hilton
Desa Akbatı
İZMİR
Desa Egs
Desa Agora
Desa Forum
Desa Selway
Desa Bornova
Desa Optimum
KAYSERİ
Desa Forum
KONYA
Desa Kulecity
Desa Kentpark
MALATYA
Desa Malatyapark
MARDİN
Desa Movapark
MERSİN
Desa Forum
SAMSUN
Desa Lovalet
TEKİRDAĞ
Desa Çorlu Avantaj
Desa Orion
DESA FRANCHİSE
Desa Go Muğla
Desa Go Marmaris
Desa Go Alanya
Desa Go Ordu
Desa Go Şanlıurfa
İNGİLTERE
Desa Covent Garden
Desa Hampstead
DESA SAMSONİTE
Ankara, AnkaMall Samsonite
Ankara, Kentpark Samsonite
Ankara, Esenboğa Samsonite
Antalya, Havalimanı Samsonite
Gaziantep, Sankopark Samsonite
Gaziantep, Forum Samsonite
İstanbul Forum Samsonite
İstanbul, Ataköy Konakları Samsonite
İstanbul, İstinye Park Samsonite
İstanbul Palladium Samsonite
İstanbul, Göztepe Samsonite
İstanbul, Akbatı Samsonite
Istanbul, City’s Samsonite
İstanbul, Vialand Samsonite
İstanbul, İdo Yenikapı Samsonite
İzmir, Optımum Samsonite
İzmir, Agora Samsonite
Konya, Kentpark Plaza Samsonite
SAMSONİTE JV
İstanbul, Kanyon
İstanbul, Cevahir
İstanbul, Atatürk Havalimanı
İstanbul, Viaport
İstanbul, Buyaka
İstanbul, Marmara Forum
Bursa, Carrefour
Ankara, Armada
Muğla, Dalaman Havalimanı
İzmir, Adnan Menderes Havalimanı
Headquarter and Production Facility
Halkalı Cad. No:208 34295
Sefaköy/İstanbul /Türkiye
(0212) 473 18 00(pbx) (0212) 698 98 12 -697 57 96
Çorlu Tannery
Tabakhaneler Mevkii Kuzey Cad. 2.Sok. No:14 Ergene-Tekirdağ
(0282) 686 31 39-40 (0282) 686 40 11
Düzce Facility
1.Organize Sanayi Bölgesi 250 Ada
4 Parsel Beykoz-Düzce-Türkiye
(0380) 553 73 01(7 Hat) (0380) 553 73 08
Desa Information
444 Desa - 444 33 72
www.desa.com.tr- [email protected]
92