Embed Size (px)
Citation preview
building on a
proven strategy
C O R P O R AT E U P D AT E
JULY 2015
Forward Looking Statements
This presentation contains “forward-looking statements”, within the meaning of the United States Private Securities Litigation Reform Act of 1995 and
applicable Canadian securities legislation, concerning the business, operations and financial performance and condition of Goldcorp Inc. (“Goldcorp or “The
Company”). Forward-looking statements include, but are not limited to, statements with respect to the future price of gold, silver, copper, lead and zinc, the
estimation of mineral reserves and resources, the realization of mineral reserve estimates, the timing and amount of estimated future production, costs of
production, capital expenditures, costs and timing of the development of new deposits, success of exploration activities, permitting time lines, hedging
practices, currency exchange rate fluctuations, requirements for additional capital, government regulation of mining operations, environmental risks,
unanticipated reclamation expenses, timing and possible outcome of pending litigation, title disputes or claims and limitations on insurance
coverage. Generally, these forward-looking statements can be identified by the use of forward-looking terminology such as “plans”, “expects” or “does not
expect”, “is expected”, “budget”, “scheduled”, “estimates”, “forecasts”, “intends”, “anticipates” or “does not anticipate”, “believes” or variations of such words
and phrases or statements that certain actions, events or results “may”, “could”, “would”, “might” or “will be taken”, “occur” or “be achieved”. Forward-looking
statements are made based upon certain assumptions and other important factors that, if untrue, could cause the actual results, performances or
achievements of Goldcorp to be materially different from future results, performances or achievements expressed or implied by such statements. Such
statements and information are based on numerous assumptions regarding present and future business strategies and the environment in which Goldcorp will
operate in the future, including the price of gold, anticipated costs and ability to achieve goals. Certain important factors that could cause actual results,
performances or achievements to differ materially from those in the forward-looking statements include, among others, gold price volatility, discrepancies
between actual and estimated production, mineral reserves and mineral resources and metallurgical recoveries, mining operational and development risks,
litigation risks, regulatory restrictions (including environmental regulatory restrictions and liability), activities by governmental authorities (including changes in
taxation), currency fluctuations, the speculative nature of gold exploration, the global economic climate, dilution, share price volatility, competition, loss of key
employees, additional funding requirements and defective title to mineral claims or property. Although Goldcorp believes its expectations are based upon
reasonable assumptions and has attempted to identify important factors that could cause actual actions, events or results to differ materially from those
described in forward-looking statements, there may be other factors that cause actions, events or results not to be as anticipated, estimated or intended.
Forward-looking statements are subject to known and unknown risks, uncertainties and other factors that may cause the actual results, level of activity,
performance or achievements of Goldcorp to be materially different from those expressed or implied by such forward-looking statements, including but not
limited to: risks related to the integration of acquisitions; risks related to international operations; risks related to joint venture operations; actual results of
current exploration activities; actual results of current reclamation activities; conclusions of economic evaluations; changes in project parameters as plans
continue to be refined; future prices of gold, silver, copper, lead and zinc; possible variations in ore reserves, grade or recovery rates; failure of plant,
equipment or processes to operate as anticipated; accidents, labour disputes; delays in obtaining governmental approvals or financing or in the completion of
development or construction activities and other risks of the mining industry, as well as those factors discussed in the section entitled “Description of the
Business – Risk Factors” in Goldcorp’s annual information form for the year ended December 31, 2014 available at www.sedar.com. Although Goldcorp has
attempted to identify important factors that could cause actual results to differ materially from those contained in forward-looking statements, there may be
other factors that cause results not to be as anticipated, estimated or intended. There can be no assurance that such statements will prove to be accurate, as
actual results and future events could differ materially from those anticipated in such statements. Accordingly, readers should not place undue reliance on
forward-looking statements. Goldcorp does not undertake to update any forward-looking statements that are included in this document, except in accordance
with applicable securities laws.
All amounts are in U.S. dollars, unless otherwise stated.2
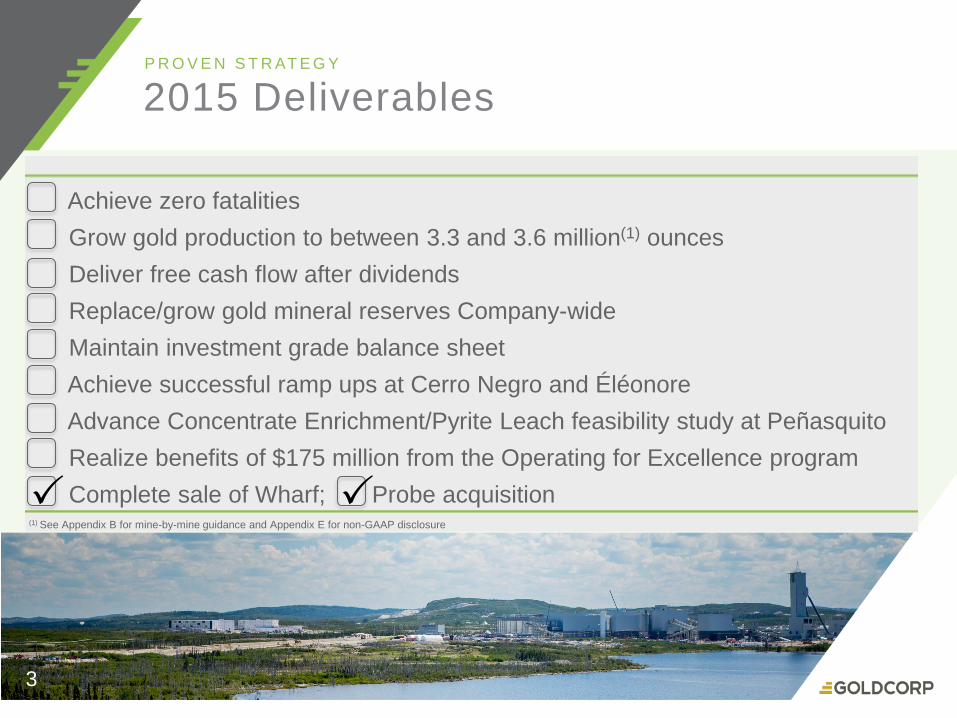
2015 DeliverablesP R O V E N S T R AT E G Y
Achieve zero fatalities
Grow gold production to between 3.3 and 3.6 million(1) ounces
Deliver free cash flow after dividends
Replace/grow gold mineral reserves Company-wide
Maintain investment grade balance sheet
Achieve successful ramp ups at Cerro Negro and Éléonore
Advance Concentrate Enrichment/Pyrite Leach feasibility study at Peñasquito
Realize benefits of $175 million from the Operating for Excellence program
Complete sale of Wharf; Probe acquisition
3
(1) See Appendix B for mine-by-mine guidance and Appendix E for non-GAAP disclosure
4
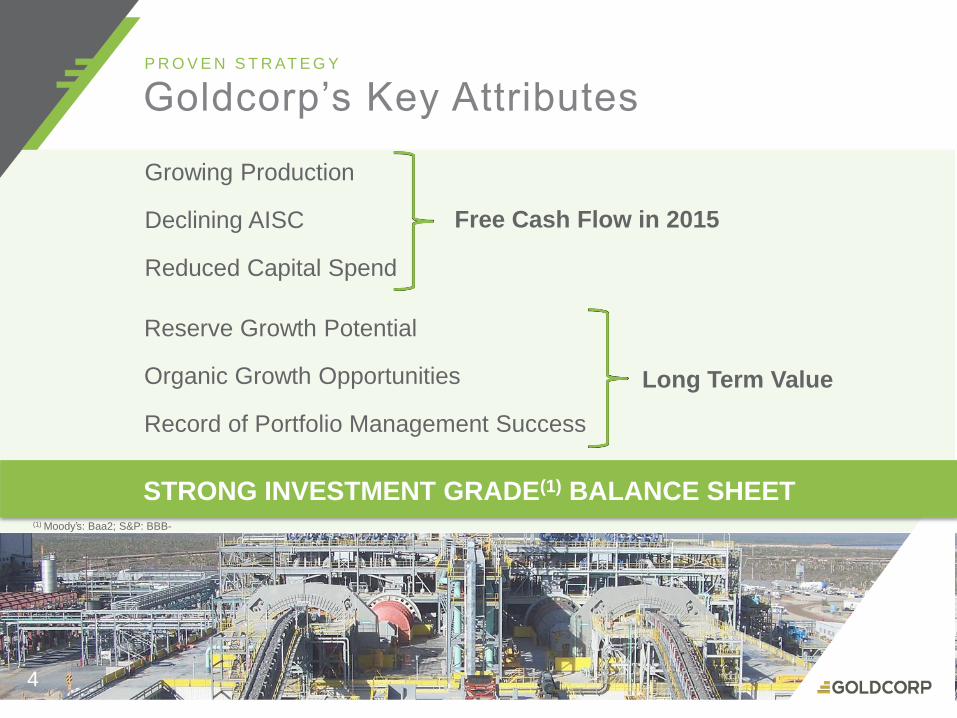
Goldcorp’s Key AttributesP R O V E N S T R AT E G Y
Growing Production
Declining AISC
Reduced Capital Spend
Reserve Growth Potential
Organic Growth Opportunities
Record of Portfolio Management Success
Free Cash Flow in 2015
Long Term Value
STRONG INVESTMENT GRADE(1) BALANCE SHEET
4
(1) Moody’s: Baa2; S&P: BBB-
5
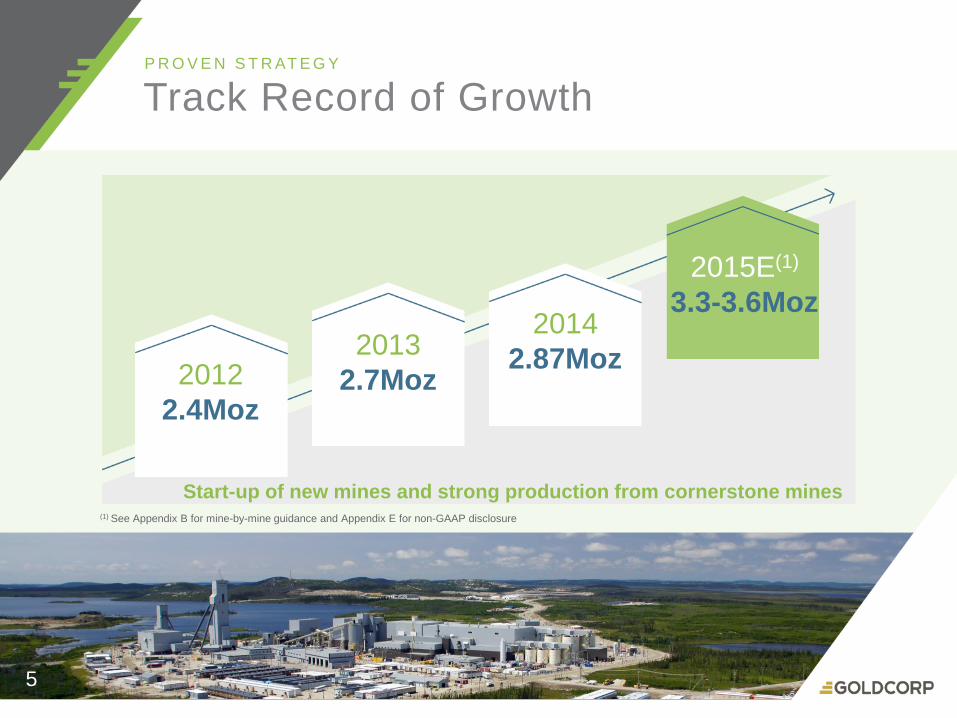
Track Record of GrowthP R O V E N S T R AT E G Y
2012
2.4Moz
2013
2.7Moz
2014
2.87Moz
2015E(1)
3.3-3.6Moz
Start-up of new mines and strong production from cornerstone mines(1) See Appendix B for mine-by-mine guidance and Appendix E for non-GAAP disclosure
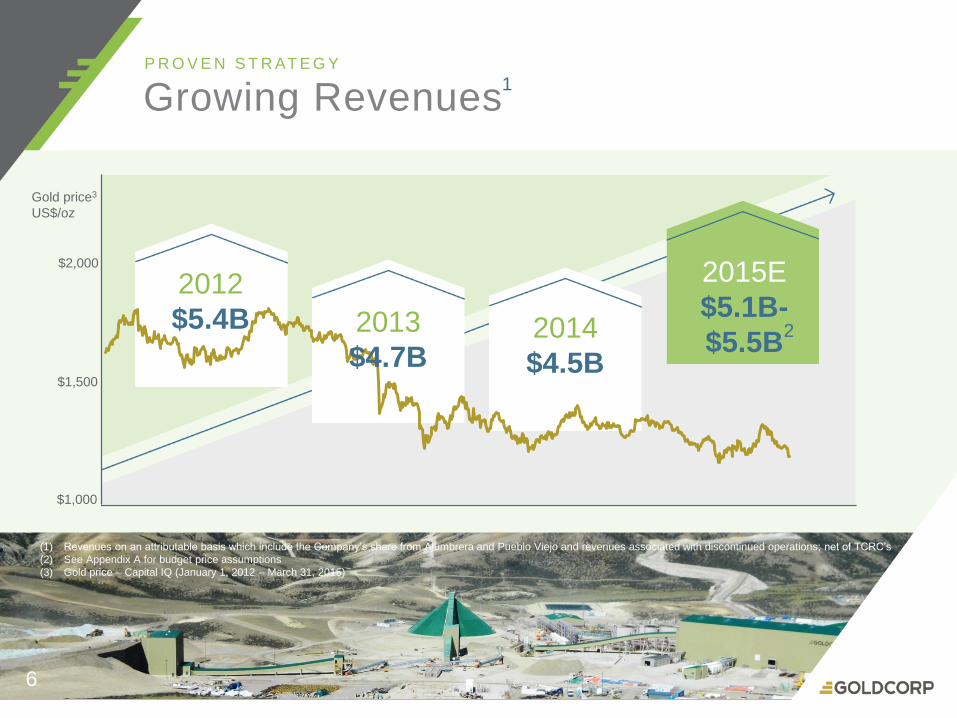
Growing RevenuesP R O V E N S T R AT E G Y
(1) Revenues on an attributable basis which include the Company’s share from Alumbrera and Pueblo Viejo and revenues associated with discontinued operations; net of TCRC’s
(2) See Appendix A for budget price assumptions
(3) Gold price – Capital IQ (January 1, 2012 – March 31, 2015)
2
1
2012
$5.4B 2013
$4.7B2014
$4.5B
2015E
$5.1B-
$5.5B
$1,000
$1,500
$2,000
Gold price3
US$/oz
6
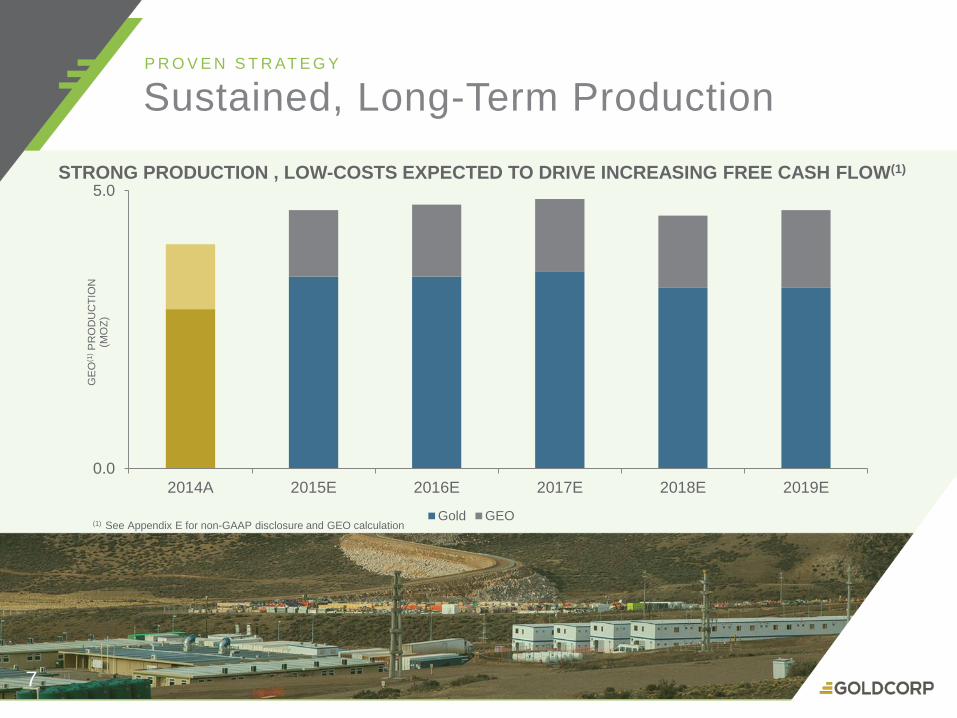
P R O V E N S T R AT E G Y
Sustained, Long-Term Production
STRONG PRODUCTION , LOW-COSTS EXPECTED TO DRIVE INCREASING FREE CASH FLOW(1)
0.0
5.0
2014A 2015E 2016E 2017E 2018E 2019E
GE
O(1
)P
RO
DU
CT
ION
(MO
Z)
Gold GEO(1) See Appendix E for non-GAAP disclosure and GEO calculation
7
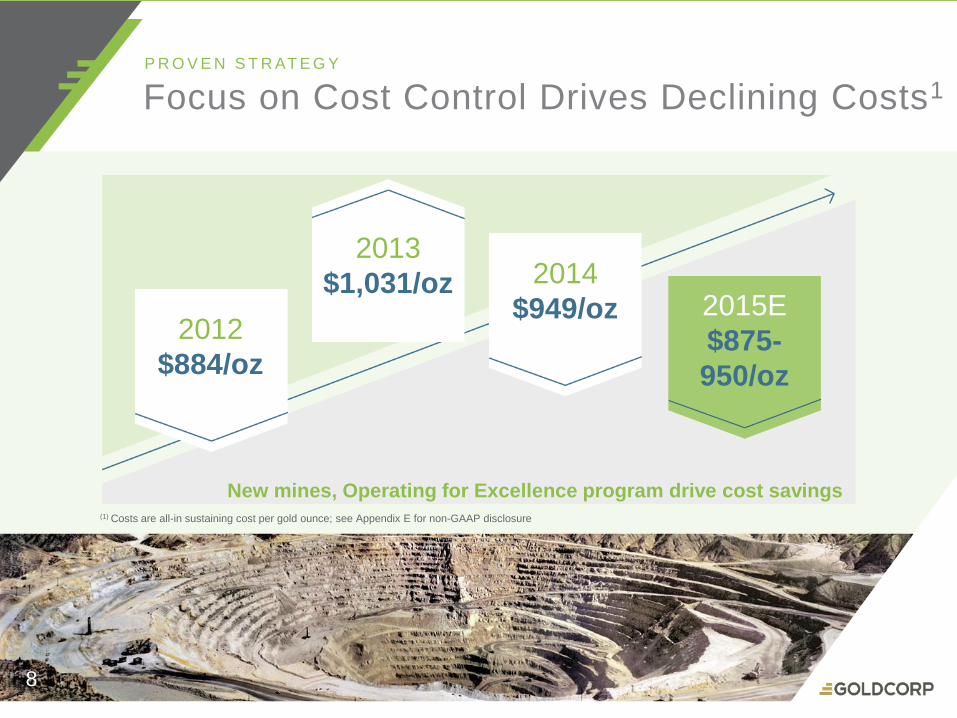
P R O V E N S T R AT E G Y
2012
$884/oz
2013
$1,031/oz 2014
$949/oz
Focus on Cost Control Drives Declining Costs1
8
2015E
$875-
950/oz
New mines, Operating for Excellence program drive cost savings(1) Costs are all-in sustaining cost per gold ounce; see Appendix E for non-GAAP disclosure
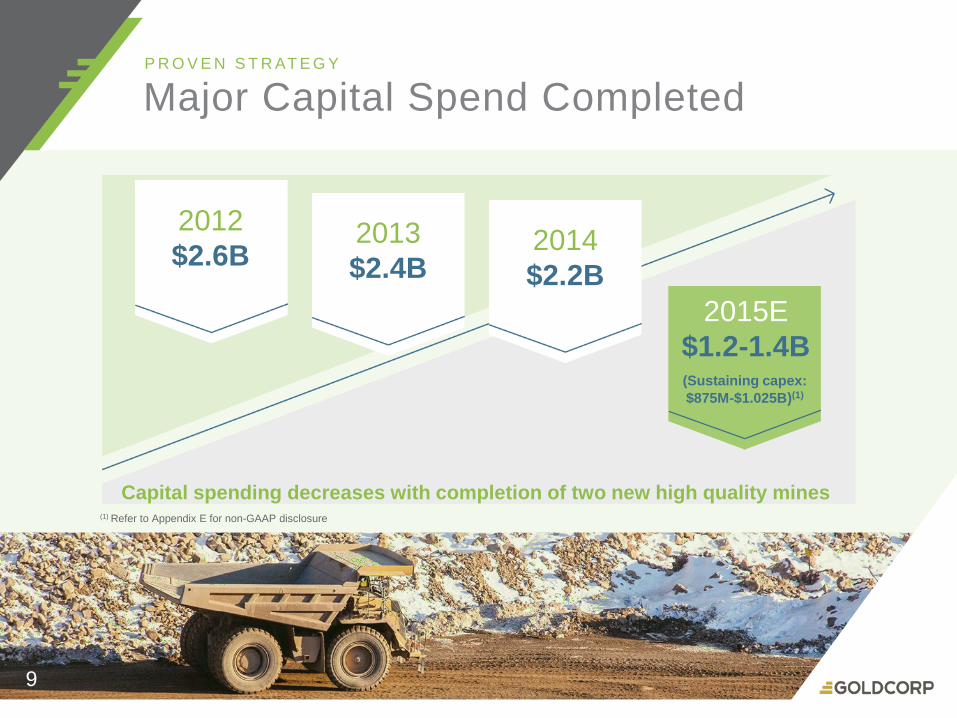
Major Capital Spend CompletedP R O V E N S T R AT E G Y
2012
$2.6B
Capital spending decreases with completion of two new high quality mines
2013
$2.4B2014
$2.2B
2015E
$1.2-1.4B(Sustaining capex:
$875M-$1.025B)(1)
9
(1) Refer to Appendix E for non-GAAP disclosure
10
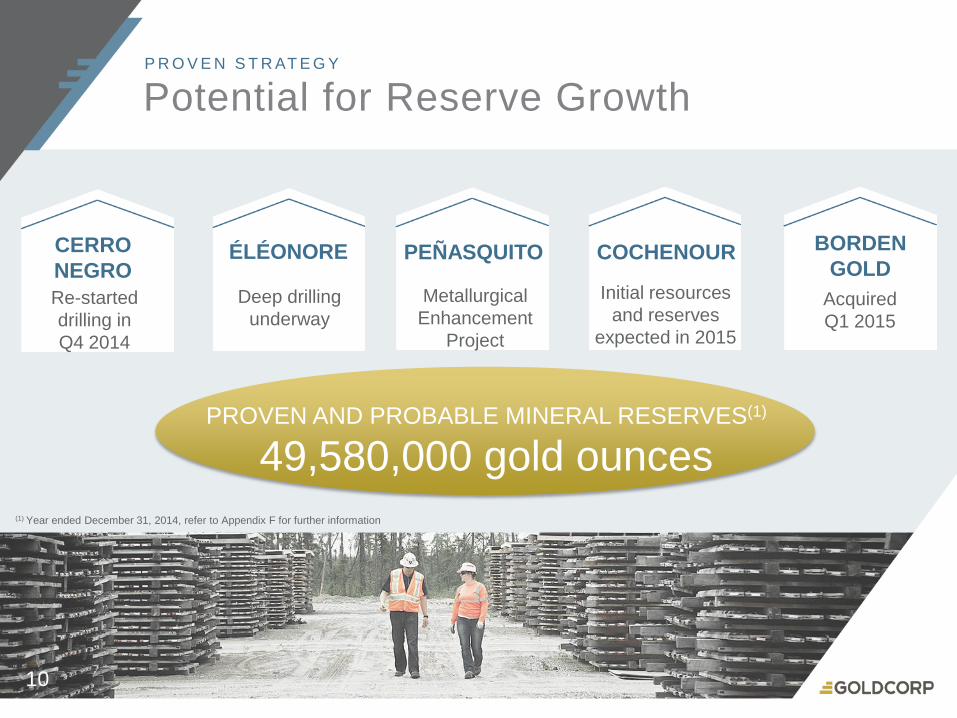
Potential for Reserve GrowthP R O V E N S T R AT E G Y
CERRO
NEGROÉLÉONORE PEÑASQUITO COCHENOUR BORDEN
GOLD
Re-started
drilling in
Q4 2014
Deep drilling
underway
Metallurgical
Enhancement
Project
Initial resources
and reserves
expected in 2015
Acquired
Q1 2015
PROVEN AND PROBABLE MINERAL RESERVES(1)
49,580,000 gold ounces
(1) Year ended December 31, 2014, refer to Appendix F for further information
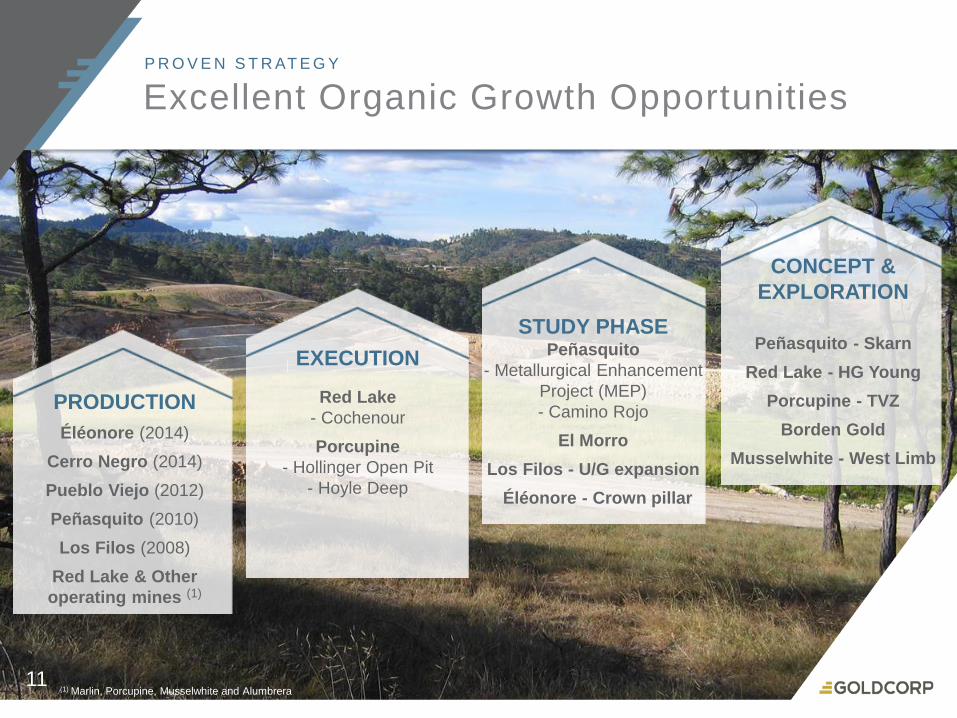
11
PRODUCTION
Éléonore (2014)
Cerro Negro (2014)
Pueblo Viejo (2012)
Peñasquito (2010)
Los Filos (2008)
Red Lake & Other
operating mines (1)
STUDY PHASEPeñasquito
- Metallurgical Enhancement
Project (MEP)
- Camino Rojo
El Morro
Los Filos - U/G expansion
Éléonore - Crown pillar
CONCEPT &
EXPLORATION
Peñasquito - Skarn
Red Lake - HG Young
Porcupine - TVZ
Borden Gold
Musselwhite - West Limb
EXECUTION
Red Lake
- Cochenour
Porcupine
- Hollinger Open Pit
- Hoyle Deep
(1) Marlin, Porcupine, Musselwhite and Alumbrera,
Excellent Organic Growth OpportunitiesP R O V E N S T R AT E G Y
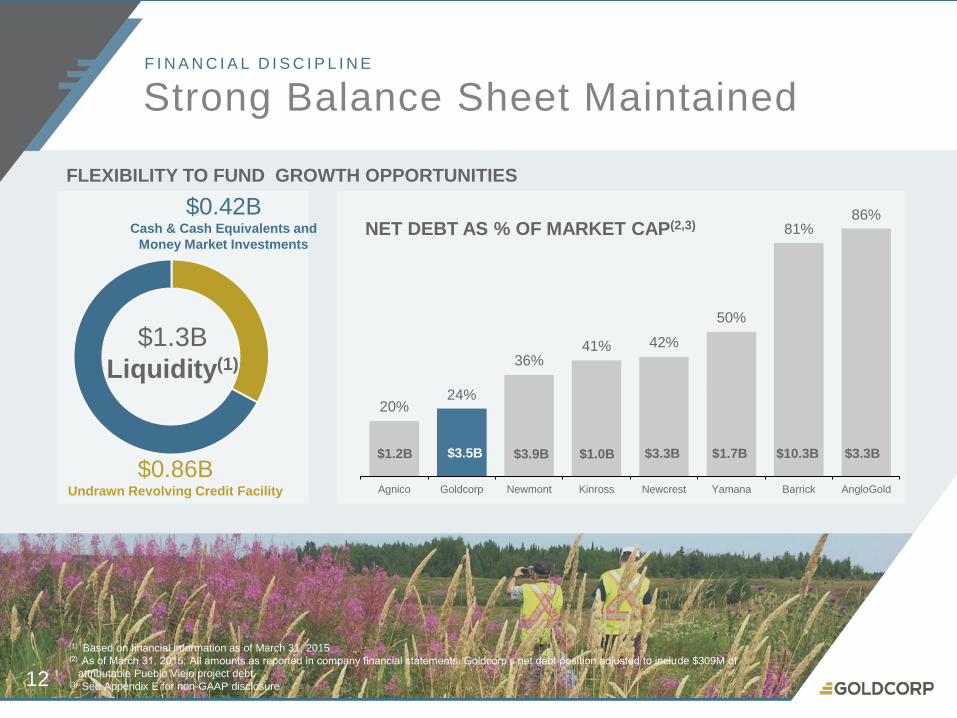
Strong Balance Sheet MaintainedF I N A N C I A L D I S C I P L I N E
$1.3B
Liquidity(1)
$0.42BCash & Cash Equivalents and
Money Market Investments
$0.86BUndrawn Revolving Credit Facility
NET DEBT AS % OF MARKET CAP(2,3)
FLEXIBILITY TO FUND GROWTH OPPORTUNITIES
(1) Based on financial information as of March 31, 2015(2) As of March 31, 2015; All amounts as reported in company financial statements. Goldcorp’s net debt position adjusted to include $309M of
attributable Pueblo Viejo project debt. (3) See Appendix E for non-GAAP disclosure12
20% 24%
36% 41% 42%
50%
81% 86%
Agnico Goldcorp Newmont Kinross Newcrest Yamana Barrick AngloGold
$3.3B$10.3B$1.7B$3.3B$1.0B$3.9B$3.5B$1.2B
13
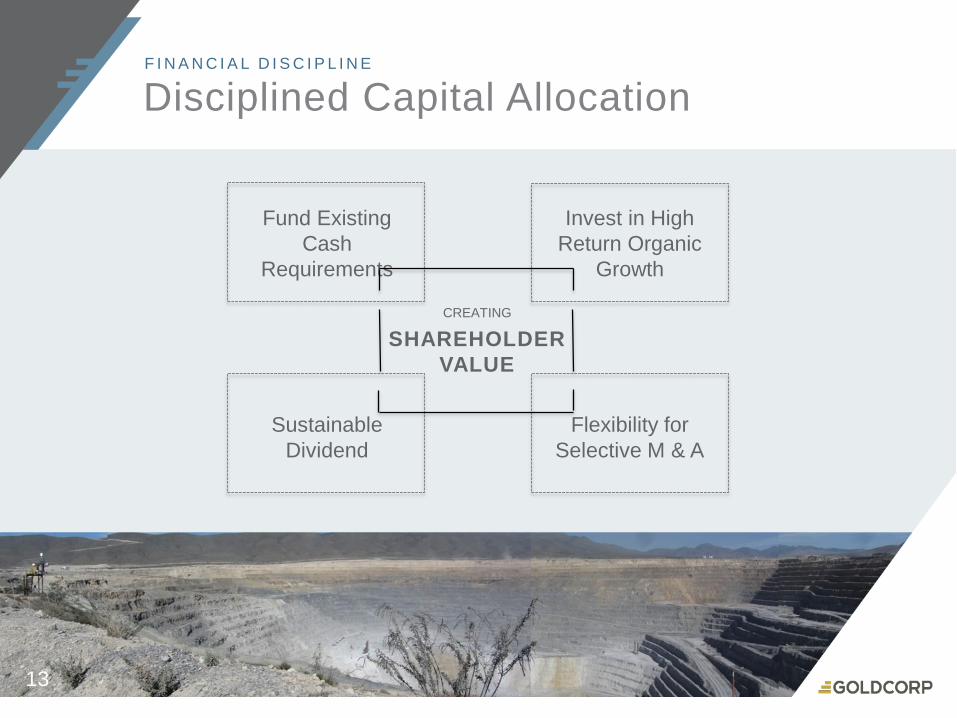
Disciplined Capital AllocationF I N A N C I A L D I S C I P L I N E
CREATING
SHAREHOLDER
VALUE
Fund Existing
Cash
Requirements
Invest in High
Return Organic
Growth
Sustainable
Dividend
Flexibility for
Selective M & A
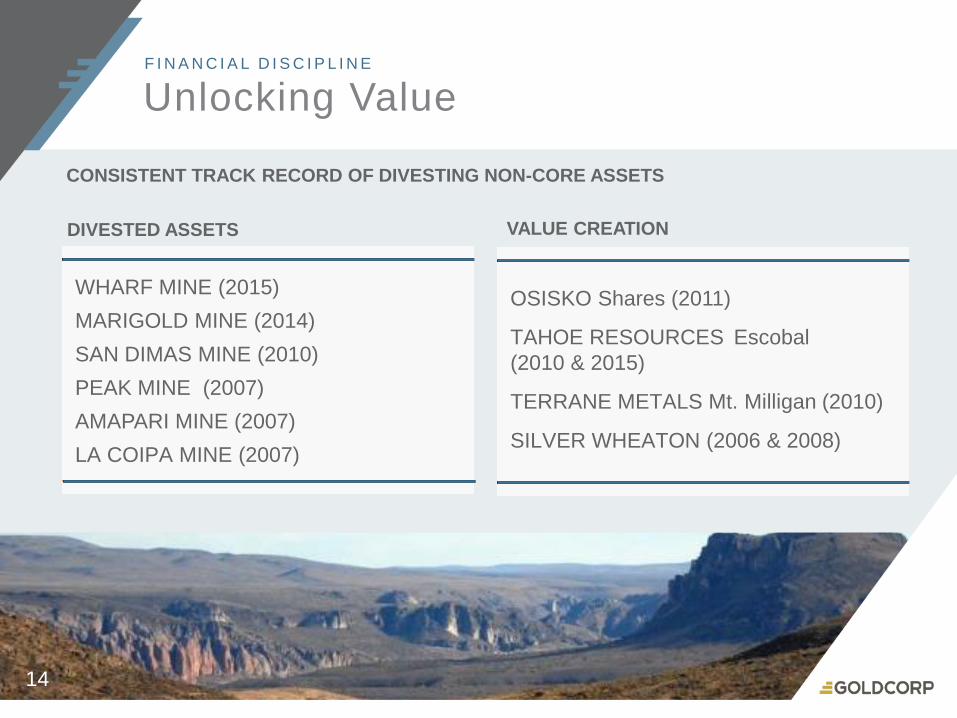
Unlocking ValueF I N A N C I A L D I S C I P L I N E
14
WHARF MINE (2015)
MARIGOLD MINE (2014)
SAN DIMAS MINE (2010)
PEAK MINE (2007)
AMAPARI MINE (2007)
LA COIPA MINE (2007)
OSISKO Shares (2011)
TAHOE RESOURCES Escobal
(2010 & 2015)
TERRANE METALS Mt. Milligan (2010)
SILVER WHEATON (2006 & 2008)
DIVESTED ASSETS VALUE CREATION
CONSISTENT TRACK RECORD OF DIVESTING NON-CORE ASSETS
Operating mines
Development projects
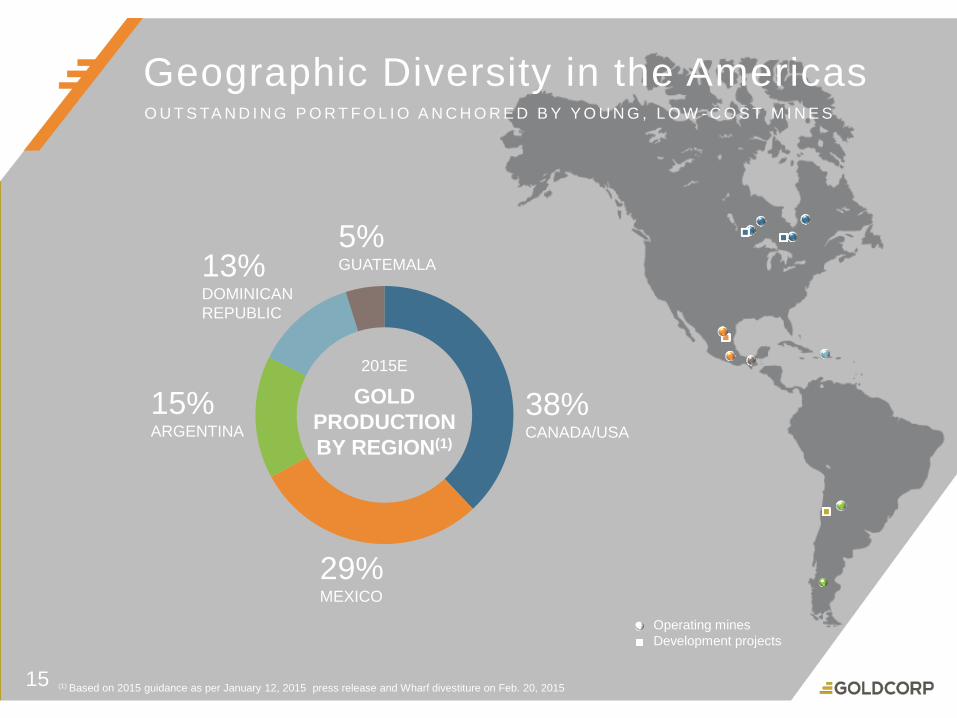
15 (1) Based on 2015 guidance as per January 12, 2015 press release and Wharf divestiture on Feb. 20, 2015
2015E
GOLD
PRODUCTION
BY REGION(1)
38%CANADA/USA
Geographic Diversity in the AmericasO U T S TA N D I N G P O R T F O L I O A N C H O R E D B Y Y O U N G , L O W - C O S T M I N E S
29%MEXICO
13%DOMINICAN
REPUBLIC
15%ARGENTINA
5%GUATEMALA
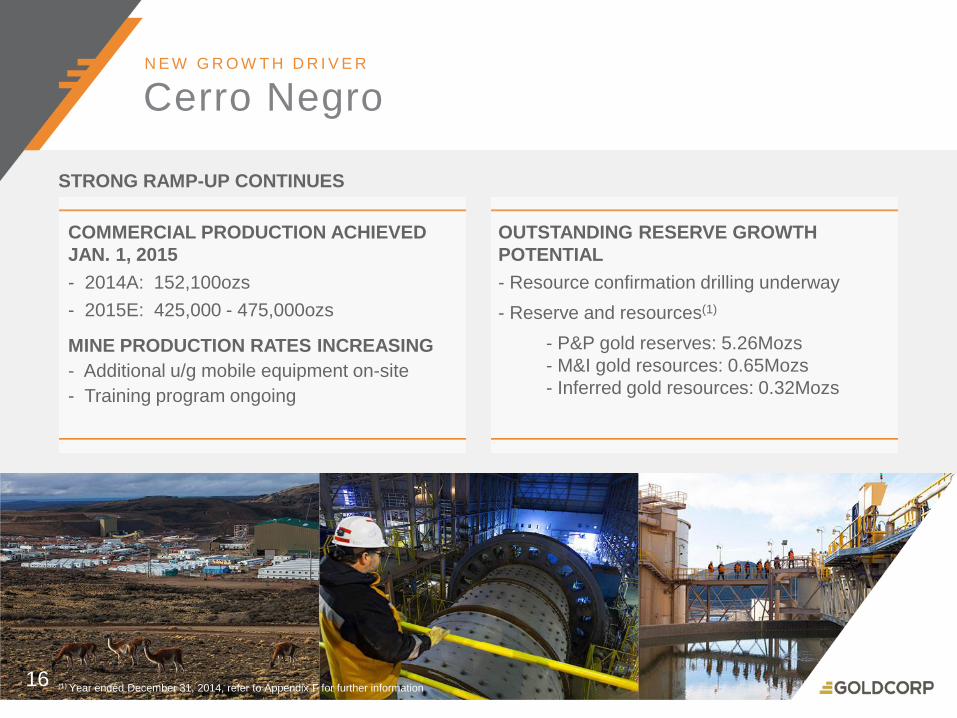
Cerro NegroN E W G R O W T H D R I V E R
COMMERCIAL PRODUCTION ACHIEVED
JAN. 1, 2015
- 2014A: 152,100ozs
- 2015E: 425,000 - 475,000ozs
MINE PRODUCTION RATES INCREASING
- Additional u/g mobile equipment on-site
- Training program ongoing
STRONG RAMP-UP CONTINUES
OUTSTANDING RESERVE GROWTH
POTENTIAL
- Resource confirmation drilling underway
- Reserve and resources(1)
- P&P gold reserves: 5.26Mozs
- M&I gold resources: 0.65Mozs
- Inferred gold resources: 0.32Mozs
16 (1) Year ended December 31, 2014, refer to Appendix F for further information
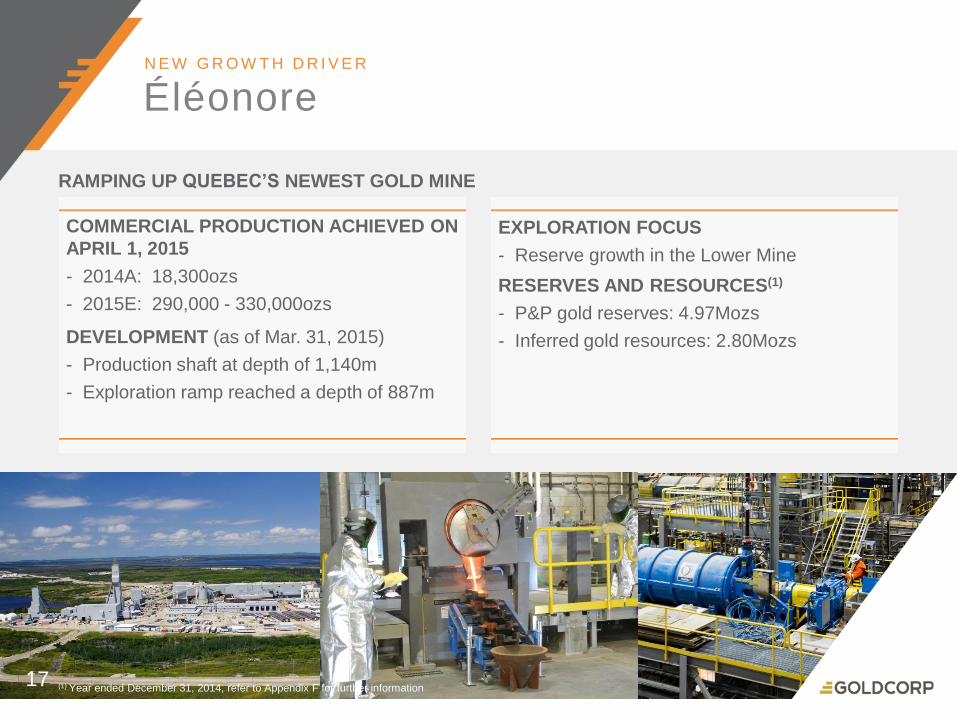
Éléonore N E W G R O W T H D R I V E R
COMMERCIAL PRODUCTION ACHIEVED ON
APRIL 1, 2015
- 2014A: 18,300ozs
- 2015E: 290,000 - 330,000ozs
DEVELOPMENT (as of Mar. 31, 2015)
- Production shaft at depth of 1,140m
- Exploration ramp reached a depth of 887m
RAMPING UP QUEBEC’S NEWEST GOLD MINE
EXPLORATION FOCUS
- Reserve growth in the Lower Mine
RESERVES AND RESOURCES(1)
- P&P gold reserves: 4.97Mozs
- Inferred gold resources: 2.80Mozs
17 (1) Year ended December 31, 2014, refer to Appendix F for further information
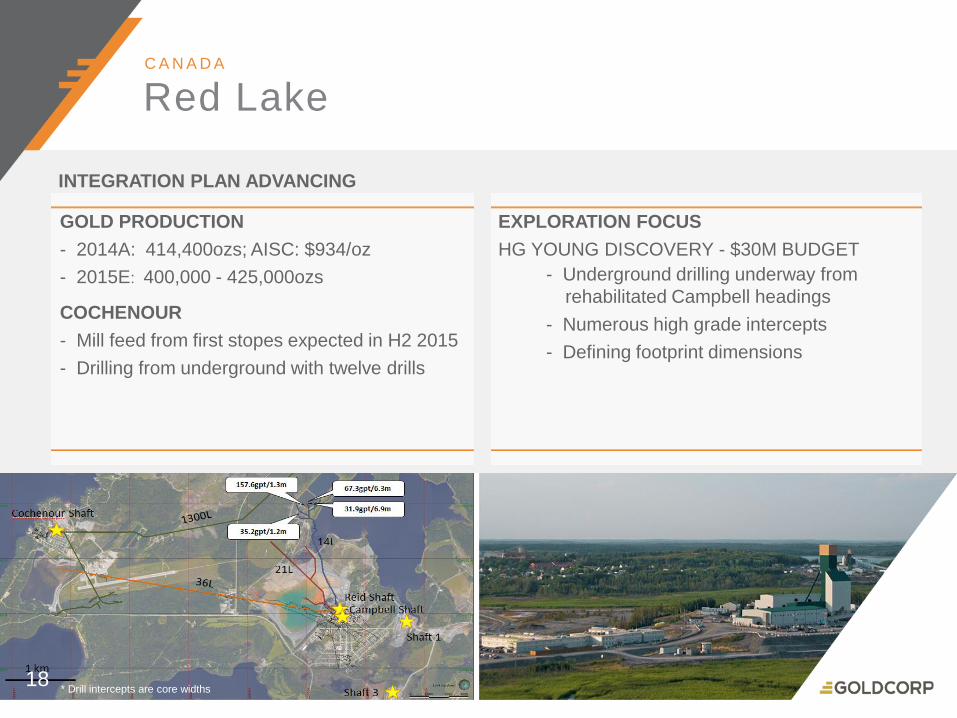
Red Lake C A N A D A
GOLD PRODUCTION
- 2014A: 414,400ozs; AISC: $934/oz
- 2015E: 400,000 - 425,000ozs
COCHENOUR
- Mill feed from first stopes expected in H2 2015
- Drilling from underground with twelve drills
INTEGRATION PLAN ADVANCING
EXPLORATION FOCUS
HG YOUNG DISCOVERY - $30M BUDGET
- Underground drilling underway from
rehabilitated Campbell headings
- Numerous high grade intercepts
- Defining footprint dimensions
18* Drill intercepts are core widths
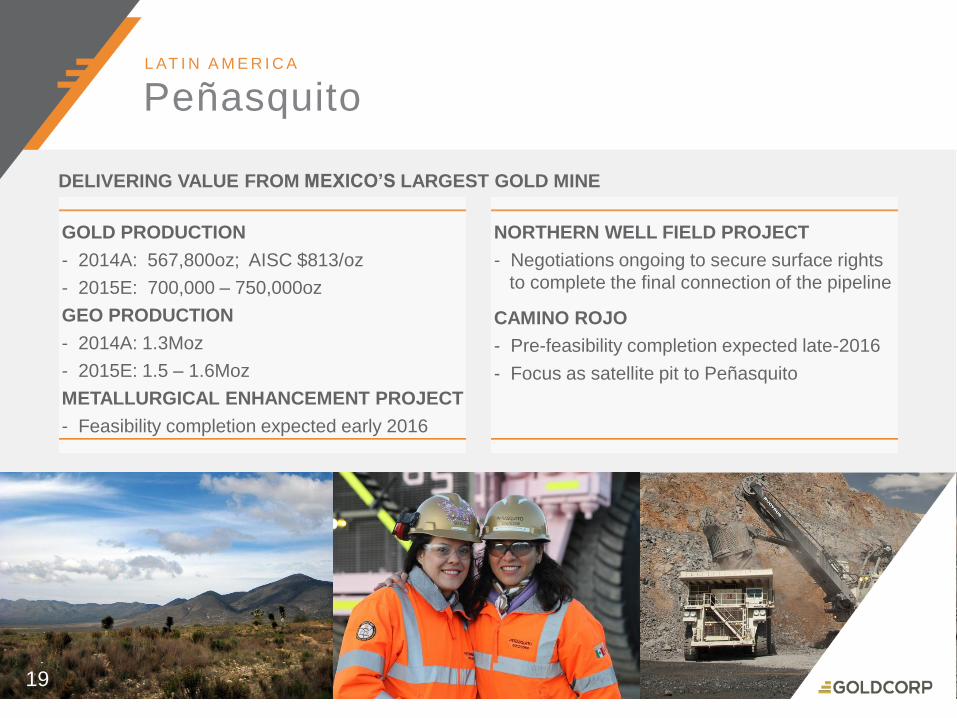
Peñasquito L AT I N A M E R I C A
DELIVERING VALUE FROM MEXICO’S LARGEST GOLD MINE
GOLD PRODUCTION
- 2014A: 567,800oz; AISC $813/oz
- 2015E: 700,000 – 750,000oz
GEO PRODUCTION
- 2014A: 1.3Moz
- 2015E: 1.5 – 1.6Moz
METALLURGICAL ENHANCEMENT PROJECT
- Feasibility completion expected early 2016
NORTHERN WELL FIELD PROJECT
- Negotiations ongoing to secure surface rights
to complete the final connection of the pipeline
CAMINO ROJO
- Pre-feasibility completion expected late-2016
- Focus as satellite pit to Peñasquito
19
Text line 1T E X T L I N E 2
20
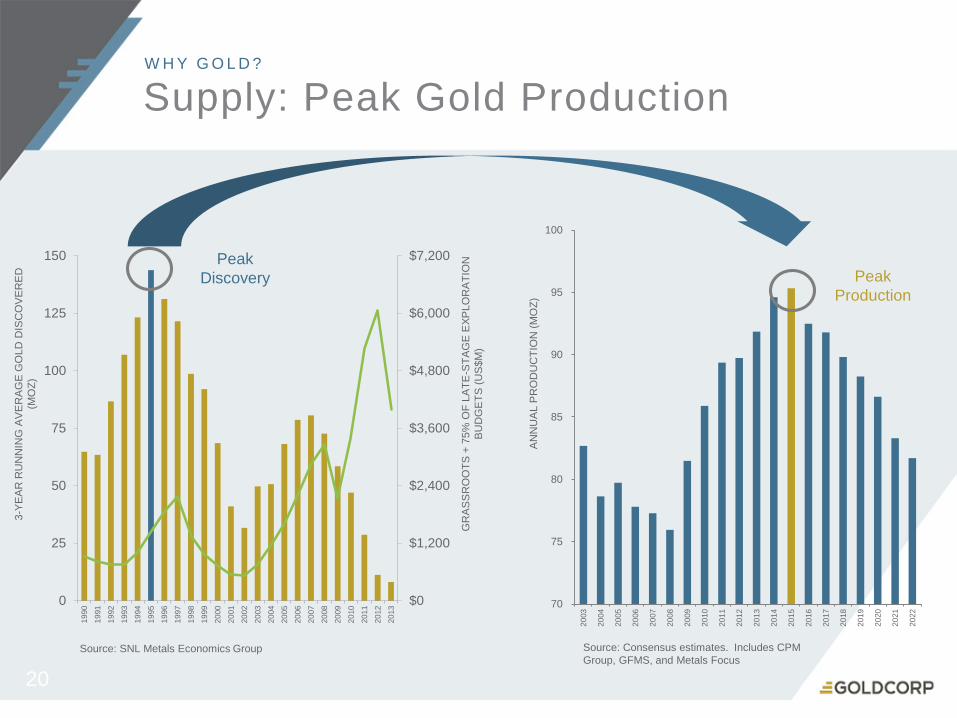
Supply: Peak Gold ProductionW H Y G O L D ?
$0
$1,200
$2,400
$3,600
$4,800
$6,000
$7,200
0
25
50
75
100
125
150
19
90
19
91
19
92
19
93
19
94
19
95
19
96
19
97
19
98
19
99
20
00
20
01
20
02
20
03
20
04
20
05
20
06
20
07
20
08
20
09
20
10
20
11
20
12
20
13 70
75
80
85
90
95
100
20
03
20
04
20
05
20
06
20
07
20
08
20
09
20
10
20
11
20
12
20
13
20
14
20
15
20
16
20
17
20
18
20
19
20
20
20
21
20
22
AN
NU
AL P
RO
DU
CT
ION
(M
OZ
)
Source: Consensus estimates. Includes CPM
Group, GFMS, and Metals FocusSource: SNL Metals Economics Group
Peak
Discovery Peak
Production
3-Y
EA
R R
UN
NIN
G A
VE
RA
GE
GO
LD
DIS
CO
VE
RE
D
(MO
Z)
GR
AS
SR
OO
TS
+ 7
5%
OF
LA
TE
-ST
AG
E E
XP
LO
RA
TIO
N
BU
DG
ET
S (
US
$M
)
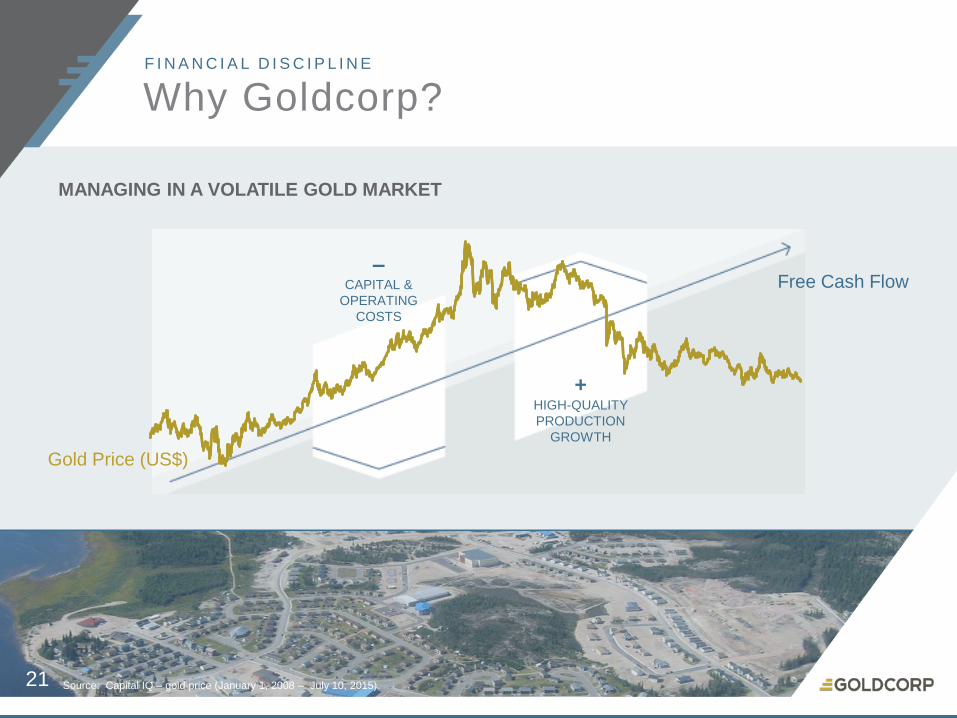
Why Goldcorp?F I N A N C I A L D I S C I P L I N E
MANAGING IN A VOLATILE GOLD MARKET
Gold Price (US$)
Free Cash Flow
21 Source: Capital IQ – gold price (January 1, 2008 – July 10, 2015)
+HIGH-QUALITY
PRODUCTION
GROWTH
–CAPITAL &
OPERATING
COSTS
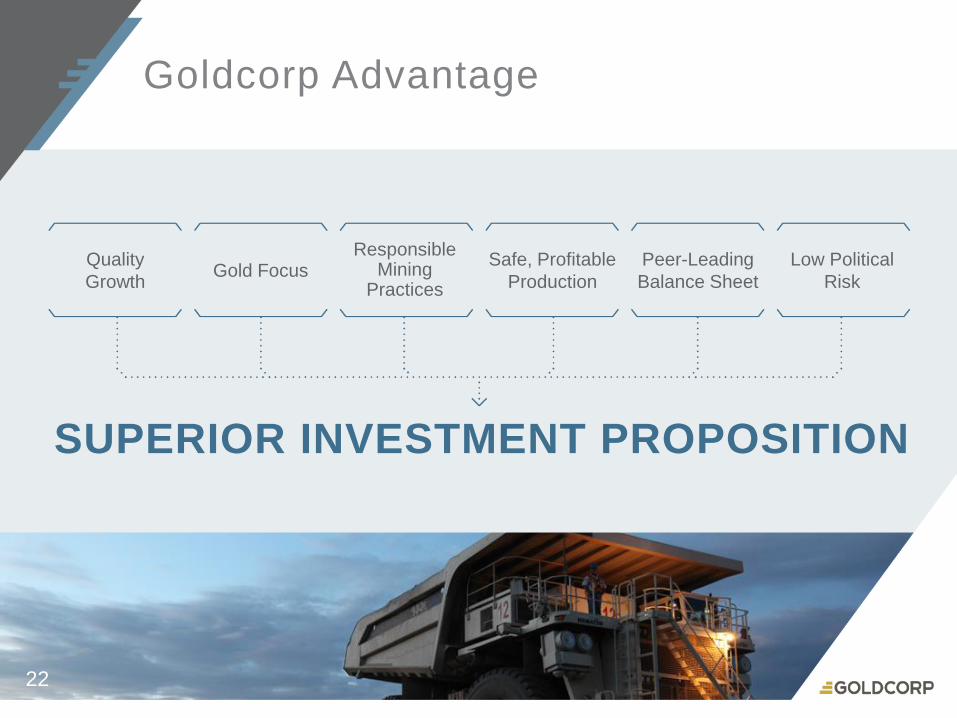
Goldcorp Advantage
SUPERIOR INVESTMENT PROPOSITION
22
Quality
GrowthGold Focus
ResponsibleMining
Practices
Safe, Profitable
Production
Peer-Leading
Balance Sheet
Low Political
Risk

(1) 2015 price assumptions: Au=$1,200/oz, Ag=$18.00/oz, Cu=$3.00/lb, Zn=$1.00/lb, Pb=$0.95/lb; (2) See Appendix E for non-GAAP disclosure (3) Includes capitalized exploration; (4) Includes stock-based compensation; (5) Tax rate re-guided on April 30, 2015, previously overall guidance for 2015 was 35%
2014 Actual 2015 Guidance(1)
Gold Production (oz) 2.87M 3.3 - 3.6M
Cash costs(2) $ / oz
All-in sustaining
By-product
Co-product
$949
$542
$668
$875 - $950
$500 - $550
$625 - $675
Capital expenditures(2)(3) $2.2B $1.2B - $1.4B
Exploration expenditures(3) $152M $170M
Corporate administration(4) $175M $185M
Depreciation / oz(2) $336 $390
Tax rate(2) 23% 45%(5)
23
2015 GuidanceA P P E N D I X A
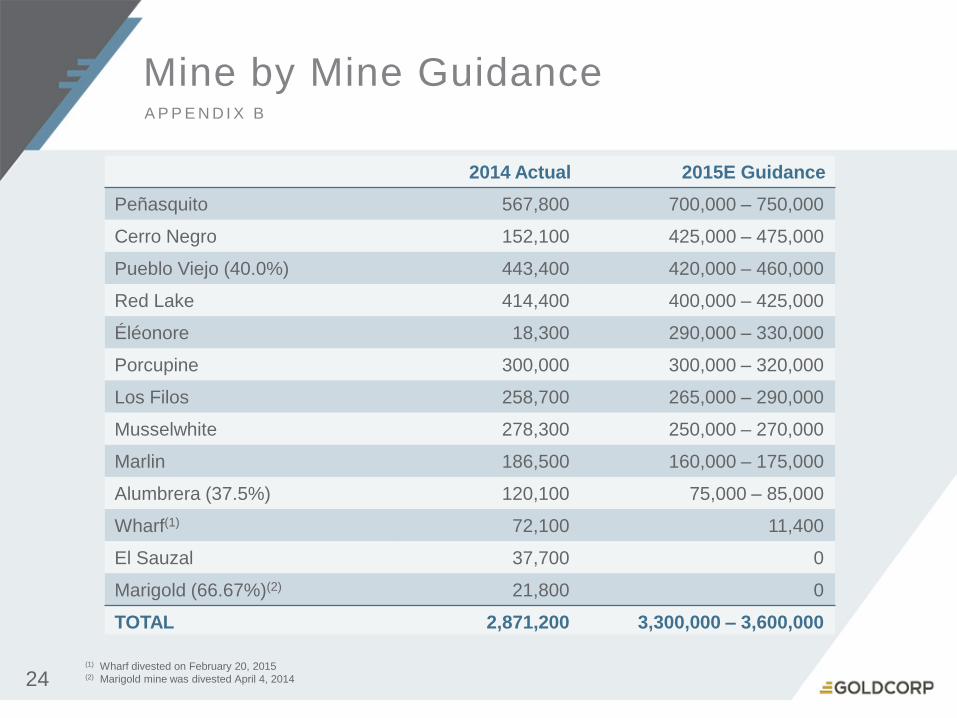
(1) Wharf divested on February 20, 2015(2) Marigold mine was divested April 4, 201424
2014 Actual 2015E Guidance
Peñasquito 567,800 700,000 – 750,000
Cerro Negro 152,100 425,000 – 475,000
Pueblo Viejo (40.0%) 443,400 420,000 – 460,000
Red Lake 414,400 400,000 – 425,000
Éléonore 18,300 290,000 – 330,000
Porcupine 300,000 300,000 – 320,000
Los Filos 258,700 265,000 – 290,000
Musselwhite 278,300 250,000 – 270,000
Marlin 186,500 160,000 – 175,000
Alumbrera (37.5%) 120,100 75,000 – 85,000
Wharf(1) 72,100 11,400
El Sauzal 37,700 0
Marigold (66.67%)(2) 21,800 0
TOTAL 2,871,200 3,300,000 – 3,600,000
Mine by Mine GuidanceA P P E N D I X B
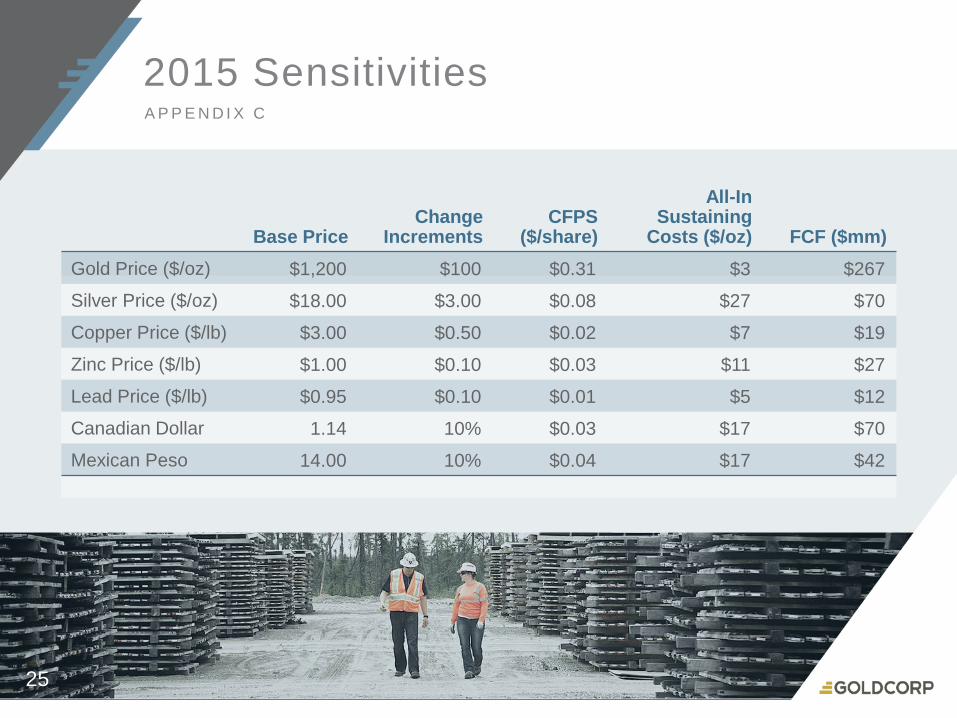
2015 SensitivitiesA P P E N D I X C
Base PriceChange
IncrementsCFPS
($/share)
All-In Sustaining
Costs ($/oz) FCF ($mm)
Gold Price ($/oz) $1,200 $100 $0.31 $3 $267
Silver Price ($/oz) $18.00 $3.00 $0.08 $27 $70
Copper Price ($/lb) $3.00 $0.50 $0.02 $7 $19
Zinc Price ($/lb) $1.00 $0.10 $0.03 $11 $27
Lead Price ($/lb) $0.95 $0.10 $0.01 $5 $12
Canadian Dollar 1.14 10% $0.03 $17 $70
Mexican Peso 14.00 10% $0.04 $17 $42
25
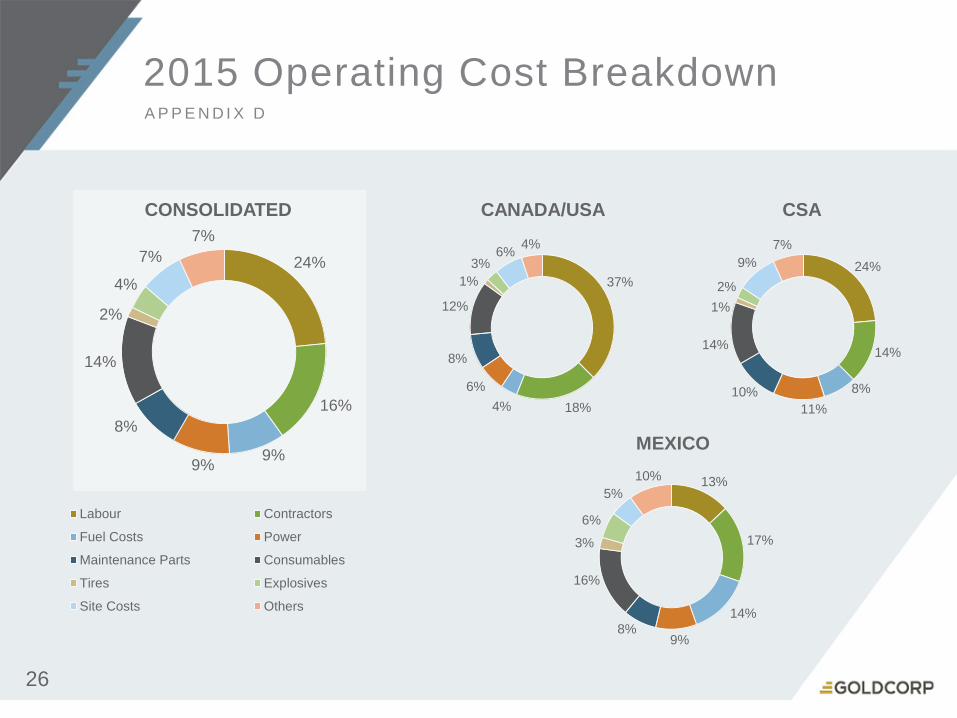
24%
16%
9%9%
8%
14%
2%
4%
7%
7%
Labour Contractors
Fuel Costs Power
Maintenance Parts Consumables
Tires Explosives
Site Costs Others
2015 Operating Cost BreakdownA P P E N D I X D
CONSOLIDATED CANADA/USA CSA
MEXICO
26
37%
18%4%
6%
8%
12%
1%
3%6%
4%
13%
17%
14%
9%8%
16%
3%
6%
5%
10%
24%
14%
8%
11%
10%
14%
1%
2%
9%
7%
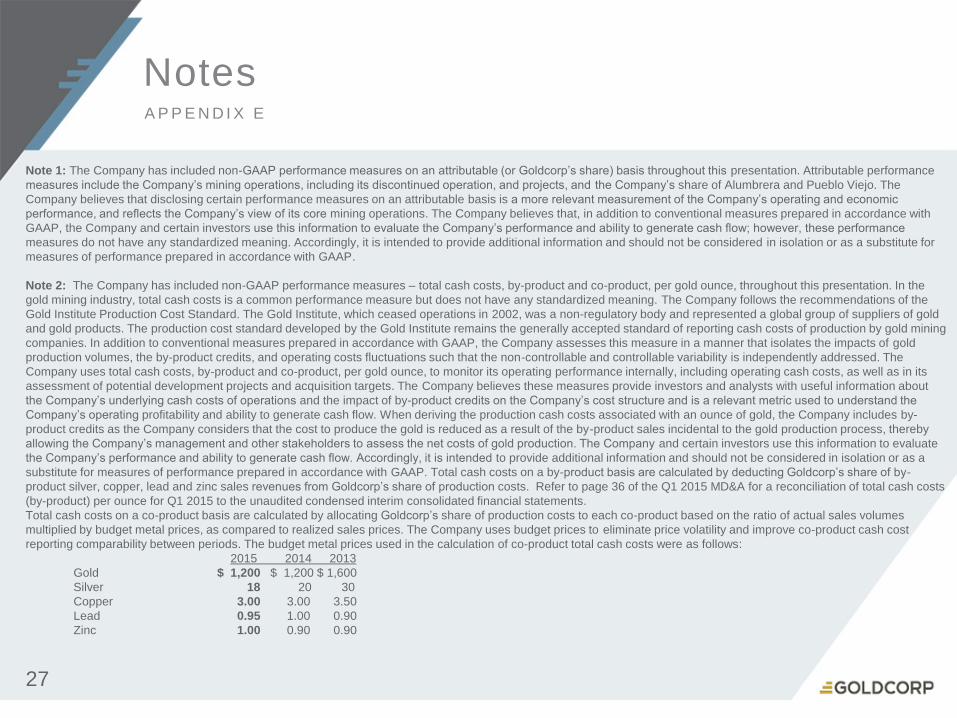
Notes
Note 1: The Company has included non-GAAP performance measures on an attributable (or Goldcorp’s share) basis throughout this presentation. Attributable performance
measures include the Company’s mining operations, including its discontinued operation, and projects, and the Company’s share of Alumbrera and Pueblo Viejo. The
Company believes that disclosing certain performance measures on an attributable basis is a more relevant measurement of the Company’s operating and economic
performance, and reflects the Company’s view of its core mining operations. The Company believes that, in addition to conventional measures prepared in accordance with
GAAP, the Company and certain investors use this information to evaluate the Company’s performance and ability to generate cash flow; however, these performance
measures do not have any standardized meaning. Accordingly, it is intended to provide additional information and should not be considered in isolation or as a substitute for
measures of performance prepared in accordance with GAAP.
Note 2: The Company has included non-GAAP performance measures – total cash costs, by-product and co-product, per gold ounce, throughout this presentation. In the
gold mining industry, total cash costs is a common performance measure but does not have any standardized meaning. The Company follows the recommendations of the
Gold Institute Production Cost Standard. The Gold Institute, which ceased operations in 2002, was a non-regulatory body and represented a global group of suppliers of gold
and gold products. The production cost standard developed by the Gold Institute remains the generally accepted standard of reporting cash costs of production by gold mining
companies. In addition to conventional measures prepared in accordance with GAAP, the Company assesses this measure in a manner that isolates the impacts of gold
production volumes, the by-product credits, and operating costs fluctuations such that the non-controllable and controllable variability is independently addressed. The
Company uses total cash costs, by-product and co-product, per gold ounce, to monitor its operating performance internally, including operating cash costs, as well as in its
assessment of potential development projects and acquisition targets. The Company believes these measures provide investors and analysts with useful information about
the Company’s underlying cash costs of operations and the impact of by-product credits on the Company’s cost structure and is a relevant metric used to understand the
Company’s operating profitability and ability to generate cash flow. When deriving the production cash costs associated with an ounce of gold, the Company includes by-
product credits as the Company considers that the cost to produce the gold is reduced as a result of the by-product sales incidental to the gold production process, thereby
allowing the Company’s management and other stakeholders to assess the net costs of gold production. The Company and certain investors use this information to evaluate
the Company’s performance and ability to generate cash flow. Accordingly, it is intended to provide additional information and should not be considered in isolation or as a
substitute for measures of performance prepared in accordance with GAAP. Total cash costs on a by-product basis are calculated by deducting Goldcorp’s share of by-
product silver, copper, lead and zinc sales revenues from Goldcorp’s share of production costs. Refer to page 36 of the Q1 2015 MD&A for a reconciliation of total cash costs
(by-product) per ounce for Q1 2015 to the unaudited condensed interim consolidated financial statements.
Total cash costs on a co-product basis are calculated by allocating Goldcorp’s share of production costs to each co-product based on the ratio of actual sales volumes
multiplied by budget metal prices, as compared to realized sales prices. The Company uses budget prices to eliminate price volatility and improve co-product cash cost
reporting comparability between periods. The budget metal prices used in the calculation of co-product total cash costs were as follows:
2015 2014 2013
Gold $ 1,200 $ 1,200 $ 1,600
Silver 18 20 30
Copper 3.00 3.00 3.50
Lead 0.95 1.00 0.90
Zinc 1.00 0.90 0.90
A P P E N D I X E
27
NotesA P P E N D I X E ( C O N T ’ D )
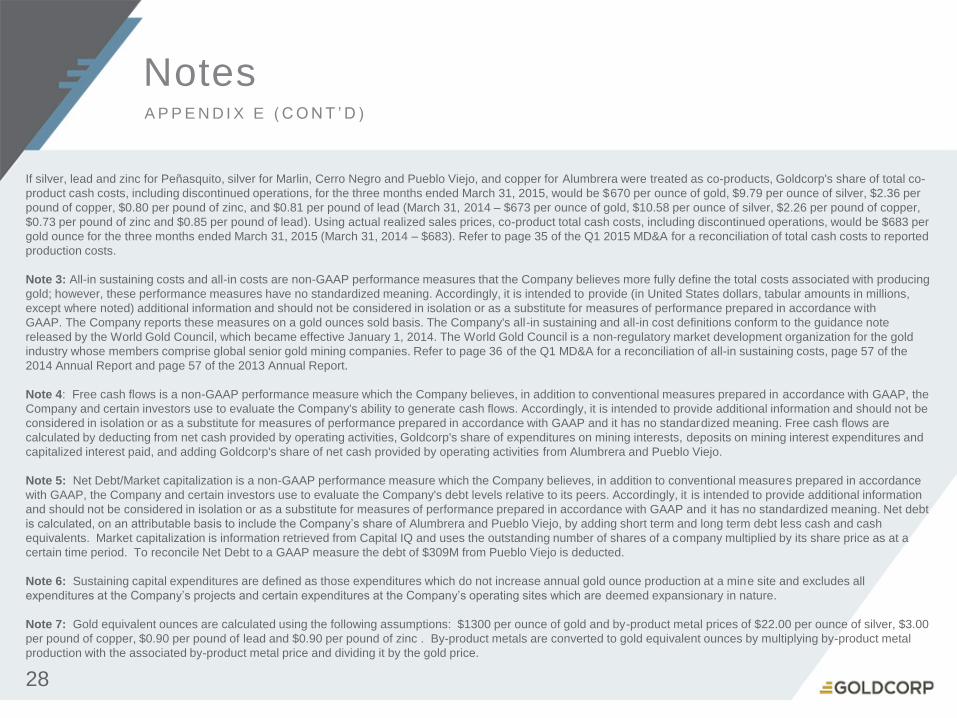
If silver, lead and zinc for Peñasquito, silver for Marlin, Cerro Negro and Pueblo Viejo, and copper for Alumbrera were treated as co-products, Goldcorp's share of total co-
product cash costs, including discontinued operations, for the three months ended March 31, 2015, would be $670 per ounce of gold, $9.79 per ounce of silver, $2.36 per
pound of copper, $0.80 per pound of zinc, and $0.81 per pound of lead (March 31, 2014 – $673 per ounce of gold, $10.58 per ounce of silver, $2.26 per pound of copper,
$0.73 per pound of zinc and $0.85 per pound of lead). Using actual realized sales prices, co-product total cash costs, including discontinued operations, would be $683 per
gold ounce for the three months ended March 31, 2015 (March 31, 2014 – $683). Refer to page 35 of the Q1 2015 MD&A for a reconciliation of total cash costs to reported
production costs.
Note 3: All-in sustaining costs and all-in costs are non-GAAP performance measures that the Company believes more fully define the total costs associated with producing
gold; however, these performance measures have no standardized meaning. Accordingly, it is intended to provide (in United States dollars, tabular amounts in millions,
except where noted) additional information and should not be considered in isolation or as a substitute for measures of performance prepared in accordance with
GAAP. The Company reports these measures on a gold ounces sold basis. The Company's all-in sustaining and all-in cost definitions conform to the guidance note
released by the World Gold Council, which became effective January 1, 2014. The World Gold Council is a non-regulatory market development organization for the gold
industry whose members comprise global senior gold mining companies. Refer to page 36 of the Q1 MD&A for a reconciliation of all-in sustaining costs, page 57 of the
2014 Annual Report and page 57 of the 2013 Annual Report.
Note 4: Free cash flows is a non-GAAP performance measure which the Company believes, in addition to conventional measures prepared in accordance with GAAP, the
Company and certain investors use to evaluate the Company's ability to generate cash flows. Accordingly, it is intended to provide additional information and should not be
considered in isolation or as a substitute for measures of performance prepared in accordance with GAAP and it has no standardized meaning. Free cash flows are
calculated by deducting from net cash provided by operating activities, Goldcorp's share of expenditures on mining interests, deposits on mining interest expenditures and
capitalized interest paid, and adding Goldcorp's share of net cash provided by operating activities from Alumbrera and Pueblo Viejo.
Note 5: Net Debt/Market capitalization is a non-GAAP performance measure which the Company believes, in addition to conventional measures prepared in accordance
with GAAP, the Company and certain investors use to evaluate the Company's debt levels relative to its peers. Accordingly, it is intended to provide additional information
and should not be considered in isolation or as a substitute for measures of performance prepared in accordance with GAAP and it has no standardized meaning. Net debt
is calculated, on an attributable basis to include the Company’s share of Alumbrera and Pueblo Viejo, by adding short term and long term debt less cash and cash
equivalents. Market capitalization is information retrieved from Capital IQ and uses the outstanding number of shares of a company multiplied by its share price as at a
certain time period. To reconcile Net Debt to a GAAP measure the debt of $309M from Pueblo Viejo is deducted.
Note 6: Sustaining capital expenditures are defined as those expenditures which do not increase annual gold ounce production at a mine site and excludes all
expenditures at the Company’s projects and certain expenditures at the Company’s operating sites which are deemed expansionary in nature.
Note 7: Gold equivalent ounces are calculated using the following assumptions: $1300 per ounce of gold and by-product metal prices of $22.00 per ounce of silver, $3.00
per pound of copper, $0.90 per pound of lead and $0.90 per pound of zinc . By-product metals are converted to gold equivalent ounces by multiplying by-product metal
production with the associated by-product metal price and dividing it by the gold price.
28
Reserves & Resources A P P E N D I X F
29
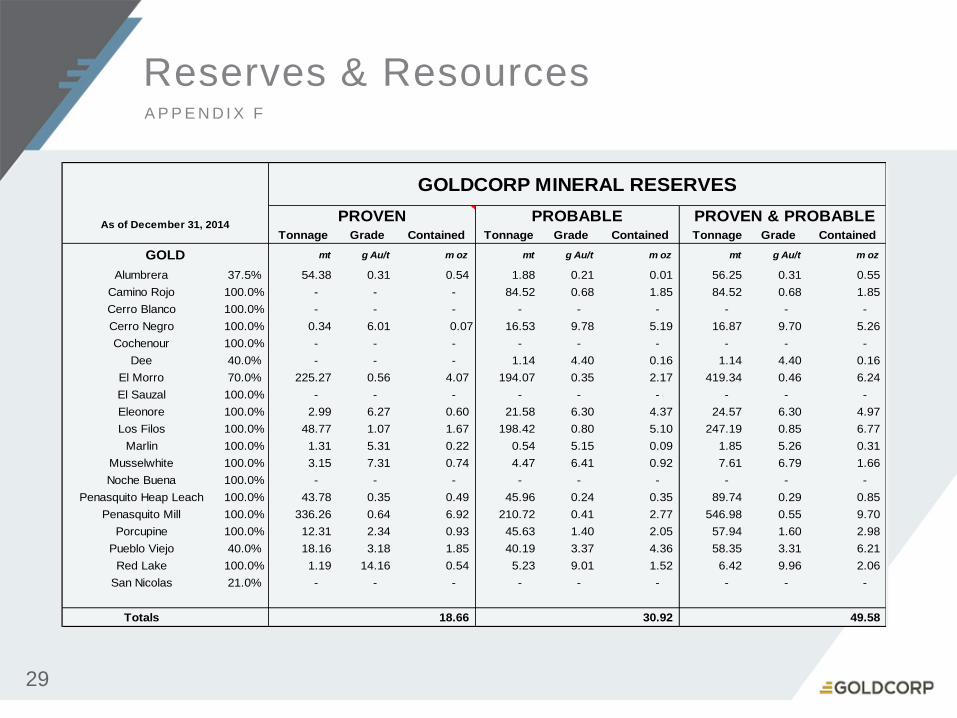
Tonnage Grade Contained Tonnage Grade Contained Tonnage Grade Contained
mt g Au/t m oz mt g Au/t m oz mt g Au/t m oz
Alumbrera 37.5% 54.38 0.31 0.54 1.88 0.21 0.01 56.25 0.31 0.55
Camino Rojo 100.0% - - - 84.52 0.68 1.85 84.52 0.68 1.85
Cerro Blanco 100.0% - - - - - - - - -
Cerro Negro 100.0% 0.34 6.01 0.07 16.53 9.78 5.19 16.87 9.70 5.26
Cochenour 100.0% - - - - - - - - -
Dee 40.0% - - - 1.14 4.40 0.16 1.14 4.40 0.16
El Morro 70.0% 225.27 0.56 4.07 194.07 0.35 2.17 419.34 0.46 6.24
El Sauzal 100.0% - - - - - - - - -
Eleonore 100.0% 2.99 6.27 0.60 21.58 6.30 4.37 24.57 6.30 4.97
Los Filos 100.0% 48.77 1.07 1.67 198.42 0.80 5.10 247.19 0.85 6.77
Marlin 100.0% 1.31 5.31 0.22 0.54 5.15 0.09 1.85 5.26 0.31
Musselwhite 100.0% 3.15 7.31 0.74 4.47 6.41 0.92 7.61 6.79 1.66
Noche Buena 100.0% - - - - - - - - -
Penasquito Heap Leach 100.0% 43.78 0.35 0.49 45.96 0.24 0.35 89.74 0.29 0.85
Penasquito Mill 100.0% 336.26 0.64 6.92 210.72 0.41 2.77 546.98 0.55 9.70
Porcupine 100.0% 12.31 2.34 0.93 45.63 1.40 2.05 57.94 1.60 2.98
Pueblo Viejo 40.0% 18.16 3.18 1.85 40.19 3.37 4.36 58.35 3.31 6.21
Red Lake 100.0% 1.19 14.16 0.54 5.23 9.01 1.52 6.42 9.96 2.06
San Nicolas 21.0% - - - - - - - - -
Totals 18.66 30.92 49.58
GOLDCORP MINERAL RESERVES
As of December 31, 2014PROVEN PROBABLE PROVEN & PROBABLE
GOLD
Reserves & ResourcesA P P E N D I X F ( C O N T ’ D )
30
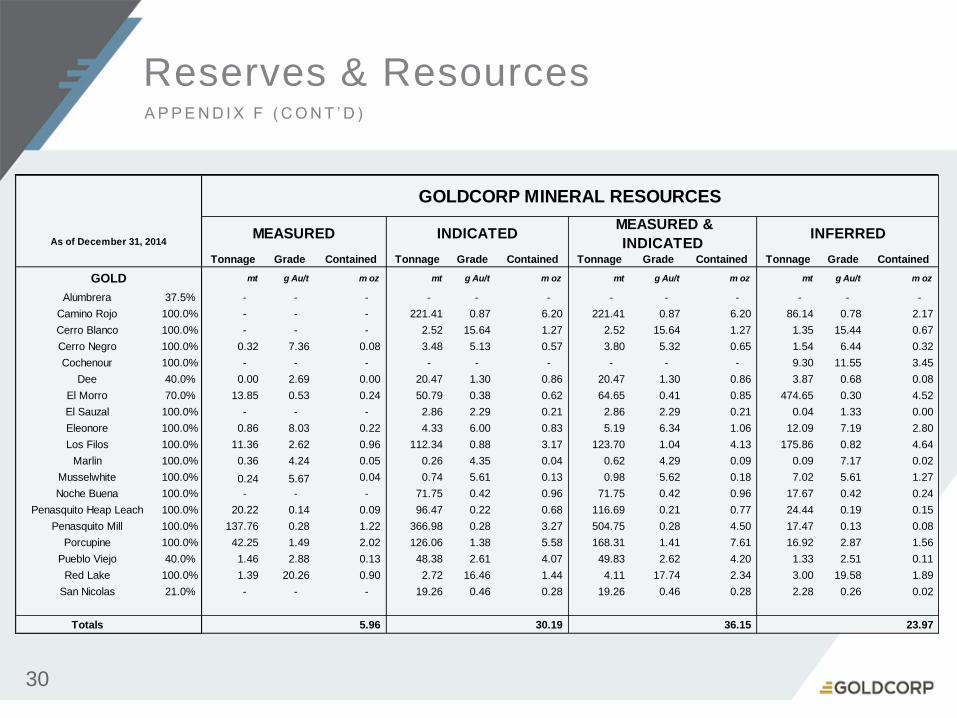
Tonnage Grade Contained Tonnage Grade Contained Tonnage Grade Contained Tonnage Grade Contained
mt g Au/t m oz mt g Au/t m oz mt g Au/t m oz mt g Au/t m oz
Alumbrera 37.5% - - - - - - - - - - - -
Camino Rojo 100.0% - - - 221.41 0.87 6.20 221.41 0.87 6.20 86.14 0.78 2.17
Cerro Blanco 100.0% - - - 2.52 15.64 1.27 2.52 15.64 1.27 1.35 15.44 0.67
Cerro Negro 100.0% 0.32 7.36 0.08 3.48 5.13 0.57 3.80 5.32 0.65 1.54 6.44 0.32
Cochenour 100.0% - - - - - - - - - 9.30 11.55 3.45
Dee 40.0% 0.00 2.69 0.00 20.47 1.30 0.86 20.47 1.30 0.86 3.87 0.68 0.08
El Morro 70.0% 13.85 0.53 0.24 50.79 0.38 0.62 64.65 0.41 0.85 474.65 0.30 4.52
El Sauzal 100.0% - - - 2.86 2.29 0.21 2.86 2.29 0.21 0.04 1.33 0.00
Eleonore 100.0% 0.86 8.03 0.22 4.33 6.00 0.83 5.19 6.34 1.06 12.09 7.19 2.80
Los Filos 100.0% 11.36 2.62 0.96 112.34 0.88 3.17 123.70 1.04 4.13 175.86 0.82 4.64
Marlin 100.0% 0.36 4.24 0.05 0.26 4.35 0.04 0.62 4.29 0.09 0.09 7.17 0.02
Musselwhite 100.0% 0.24 5.67 0.04 0.74 5.61 0.13 0.98 5.62 0.18 7.02 5.61 1.27
Noche Buena 100.0% - - - 71.75 0.42 0.96 71.75 0.42 0.96 17.67 0.42 0.24
Penasquito Heap Leach 100.0% 20.22 0.14 0.09 96.47 0.22 0.68 116.69 0.21 0.77 24.44 0.19 0.15
Penasquito Mill 100.0% 137.76 0.28 1.22 366.98 0.28 3.27 504.75 0.28 4.50 17.47 0.13 0.08
Porcupine 100.0% 42.25 1.49 2.02 126.06 1.38 5.58 168.31 1.41 7.61 16.92 2.87 1.56
Pueblo Viejo 40.0% 1.46 2.88 0.13 48.38 2.61 4.07 49.83 2.62 4.20 1.33 2.51 0.11
Red Lake 100.0% 1.39 20.26 0.90 2.72 16.46 1.44 4.11 17.74 2.34 3.00 19.58 1.89
San Nicolas 21.0% - - - 19.26 0.46 0.28 19.26 0.46 0.28 2.28 0.26 0.02
Totals 5.96 30.19 36.15 23.97
GOLDCORP MINERAL RESOURCES
As of December 31, 2014MEASURED INDICATED
MEASURED &
INDICATED INFERRED
GOLD
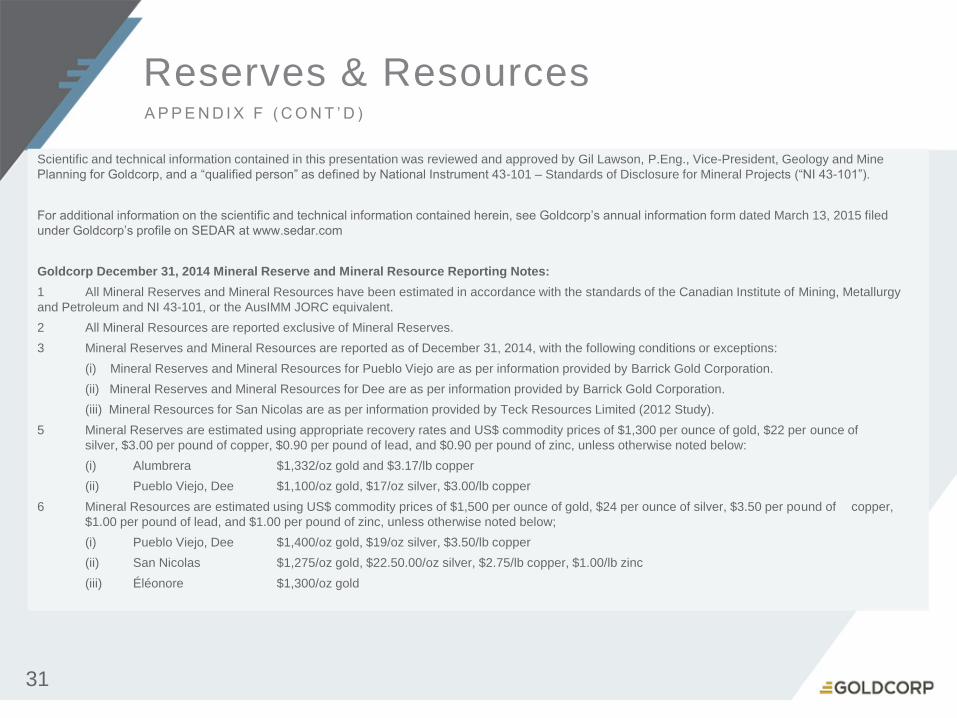
Scientific and technical information contained in this presentation was reviewed and approved by Gil Lawson, P.Eng., Vice-President, Geology and Mine
Planning for Goldcorp, and a “qualified person” as defined by National Instrument 43-101 – Standards of Disclosure for Mineral Projects (“NI 43-101”).
For additional information on the scientific and technical information contained herein, see Goldcorp’s annual information form dated March 13, 2015 filed
under Goldcorp’s profile on SEDAR at www.sedar.com
Goldcorp December 31, 2014 Mineral Reserve and Mineral Resource Reporting Notes:
1 All Mineral Reserves and Mineral Resources have been estimated in accordance with the standards of the Canadian Institute of Mining, Metallurgy
and Petroleum and NI 43-101, or the AusIMM JORC equivalent.
2 All Mineral Resources are reported exclusive of Mineral Reserves.
3 Mineral Reserves and Mineral Resources are reported as of December 31, 2014, with the following conditions or exceptions:
(i) Mineral Reserves and Mineral Resources for Pueblo Viejo are as per information provided by Barrick Gold Corporation.
(ii) Mineral Reserves and Mineral Resources for Dee are as per information provided by Barrick Gold Corporation.
(iii) Mineral Resources for San Nicolas are as per information provided by Teck Resources Limited (2012 Study).
5 Mineral Reserves are estimated using appropriate recovery rates and US$ commodity prices of $1,300 per ounce of gold, $22 per ounce of
silver, $3.00 per pound of copper, $0.90 per pound of lead, and $0.90 per pound of zinc, unless otherwise noted below:
(i) Alumbrera $1,332/oz gold and $3.17/lb copper
(ii) Pueblo Viejo, Dee $1,100/oz gold, $17/oz silver, $3.00/lb copper
6 Mineral Resources are estimated using US$ commodity prices of $1,500 per ounce of gold, $24 per ounce of silver, $3.50 per pound of copper,
$1.00 per pound of lead, and $1.00 per pound of zinc, unless otherwise noted below;
(i) Pueblo Viejo, Dee $1,400/oz gold, $19/oz silver, $3.50/lb copper
(ii) San Nicolas $1,275/oz gold, $22.50.00/oz silver, $2.75/lb copper, $1.00/lb zinc
(iii) Éléonore $1,300/oz gold
Reserves & ResourcesA P P E N D I X F ( C O N T ’ D )
31
Cautionary Note to United States Investors Concerning Estimates of Measured, Indicated and Inferred Resources:
These tables have been prepared in accordance with the requirements of the securities laws in effect in Canada, which differ from the requirements of United
States securities laws and uses terms that are not recognized by the United States Securities and Exchange Commission (“SEC”). The terms “Mineral Reserve”,
“Proven Mineral Reserve” and “Probable Mineral Reserve” are Canadian mining terms as defined in accordance with the Canadian Institute of Mining, Metallurgy
and Petroleum (“CIM”) — Definition Standards adopted by CIM Council on May 10, 2014 (the “CIM Definition Standards”) which were incorporated by reference in
the Canadian Securities Administrators’ NI 43-101 . These definitions differ from the definitions in SEC Industry Guide 7 (“SEC Industry Guide 7”) under United
States securities laws. Under SEC Industry Guide 7 standards, a “final” or “bankable” feasibility study is required to report reserves or cash flow analysis to
designate reserves and the primary environmental analysis or report must be filed with the appropriate governmental authority.
In addition, the terms “Mineral Resource”, “Measured Mineral Resource”, “Indicated Mineral Resource” and “Inferred Mineral Resource” are defined in and
required to be disclosed by NI 43-101; however, these terms are not defined terms under SEC Industry Guide 7 and are normally not permitted to be used in
reports and registration statements filed with the SEC. United States investors are cautioned not to assume that any part or all of mineral deposits in these
categories will ever be converted into reserves. “Inferred Mineral Resources” have a great amount of uncertainty as to their existence, and great uncertainty as to
their economic and legal feasibility. It cannot be assumed that all or any part of an Inferred Mineral Resource will ever be upgraded to a higher category. Under
Canadian regulations, estimates of Inferred Mineral Resources may not form the basis of feasibility or pre-feasibility studies, except in rare cases. United States
investors are cautioned not to assume that all or any part of an Inferred Mineral Resource exists or is economically or legally mineable. Disclosure of “contained
ounces” in a resource is permitted disclosure under Canadian regulations if such disclosure includes the grade or quality and the quantity for each category of
Mineral Resource and Mineral Reserve; however, the SEC normally only permits issuers to report mineralization that does not constitute “reserves” by SEC
standards as in place tonnage and grade without reference to unit measures.
Accordingly, information contained in this presentation containing descriptions of the Company’s mineral deposits may not be comparable to similar information
made public by United States companies subject to the reporting and disclosure requirements under the United States federal securities laws and the rules and
regulations thereunder.
Reserves & ResourcesA P P E N D I X F ( C O N T ’ D )
32