Embed Size (px)
Citation preview
Integrated Approaches to On-line Process Monitoring and Control of Upstream & Downstream Operations
Julian Morris
Centre for Process Analytics & Control Technology Newcastle University & Strathclyde University, UK
www.cpact.com
gbx 9th Annual Bioinnovation Summit Berlin 10th and 11th February 2016
CPACT Member Companies
Plus 8 Universities/Research Institutes
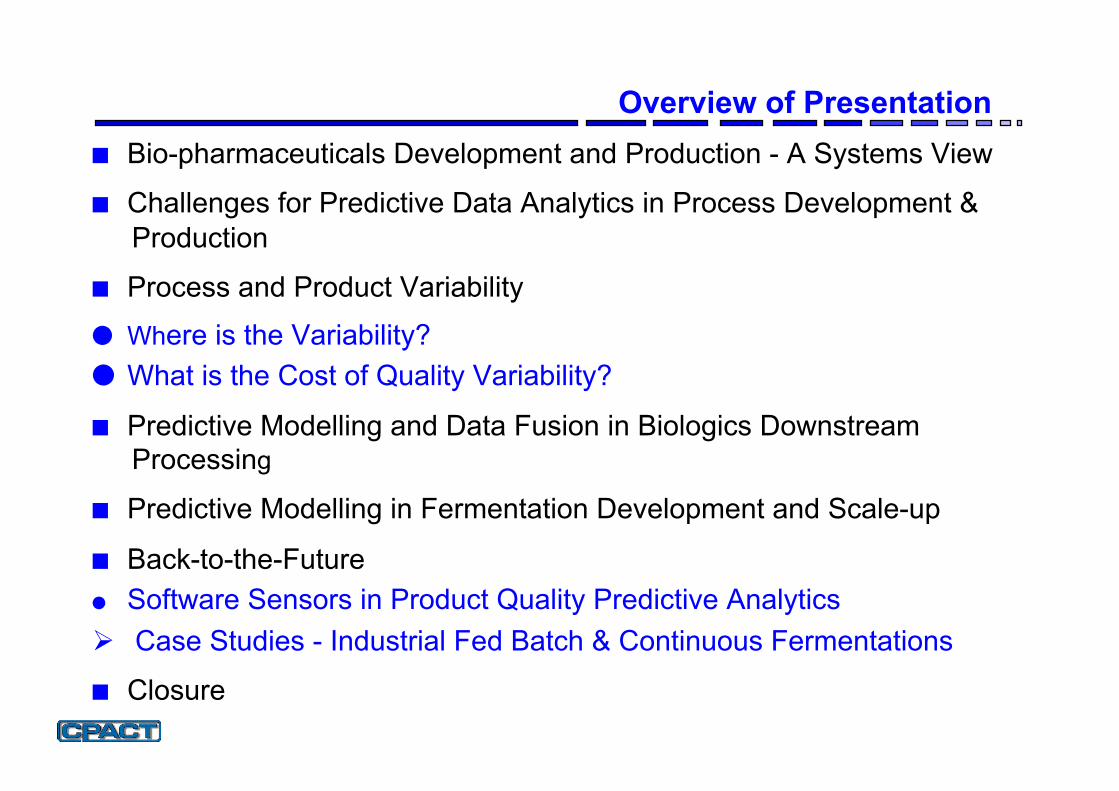
Overview of Presentation ■ Bio-pharmaceuticals Development and Production - A Systems View
■ Challenges for Predictive Data Analytics in Process Development & Production
■ Process and Product Variability
● Where is the Variability? ● What is the Cost of Quality Variability?
■ Predictive Modelling and Data Fusion in Biologics Downstream Processing
■ Predictive Modelling in Fermentation Development and Scale-up
■ Back-to-the-Future ● Software Sensors in Product Quality Predictive Analytics ! Case Studies - Industrial Fed Batch & Continuous Fermentations
■ Closure
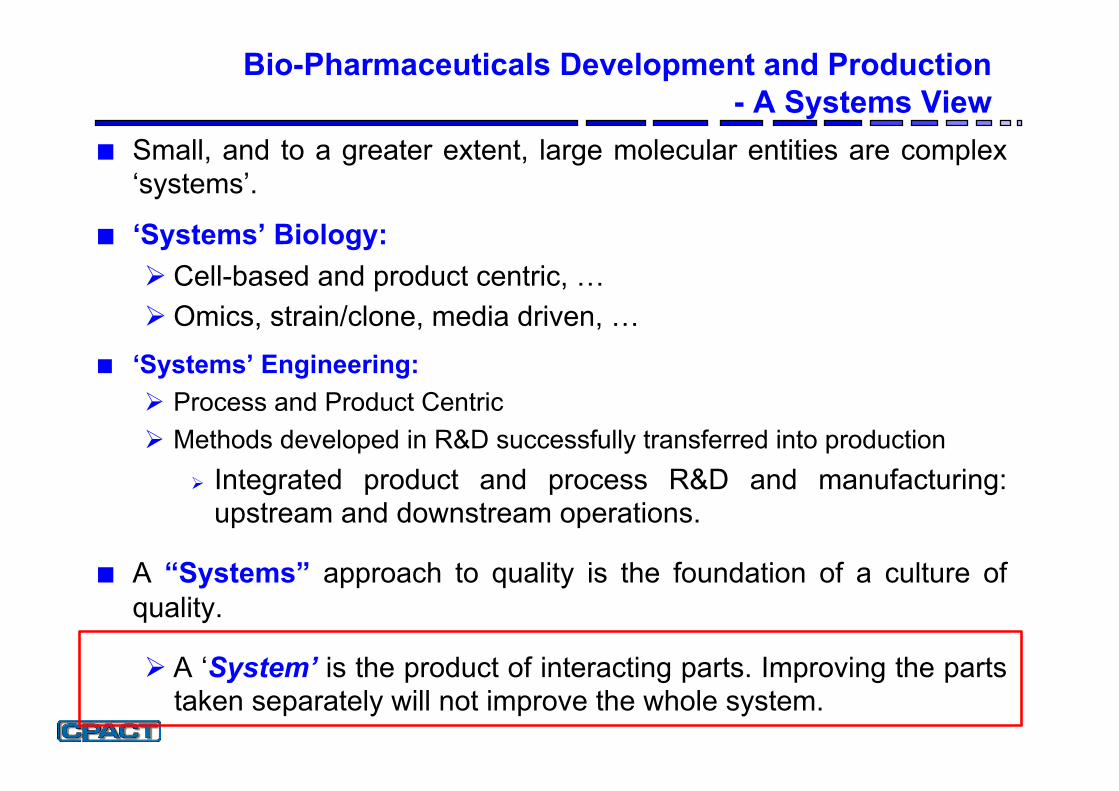
Bio-Pharmaceuticals Development and Production - A Systems View
■ Small, and to a greater extent, large molecular entities are complex ‘systems’.
■ ‘Systems’ Biology: ! Cell-based and product centric, … ! Omics, strain/clone, media driven, …
■ ‘Systems’ Engineering: ! Process and Product Centric ! Methods developed in R&D successfully transferred into production
! Integrated product and process R&D and manufacturing: upstream and downstream operations.
■ A “Systems” approach to quality is the foundation of a culture of quality.
! A ‘System’ is the product of interacting parts. Improving the parts taken separately will not improve the whole system.
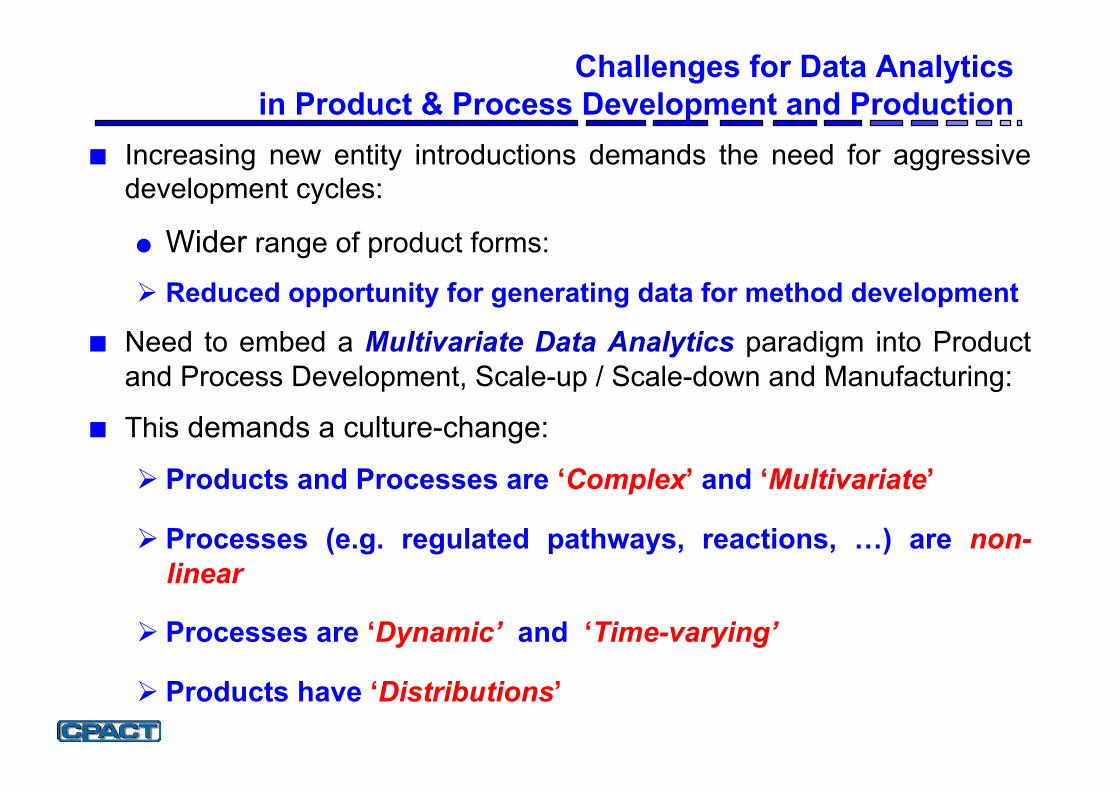
Challenges for Data Analytics in Product & Process Development and Production
■ Increasing new entity introductions demands the need for aggressive development cycles:
● Wider range of product forms:
! Reduced opportunity for generating data for method development
■ Need to embed a Multivariate Data Analytics paradigm into Product and Process Development, Scale-up / Scale-down and Manufacturing:
■ This demands a culture-change:
! Products and Processes are ‘Complex’ and ‘Multivariate’
! Processes (e.g. regulated pathways, reactions, …) are non-linear
! Processes are ‘Dynamic’ and ‘Time-varying’
! Products have ‘Distributions’
Process and Product Variability
The Impact on Product Quality
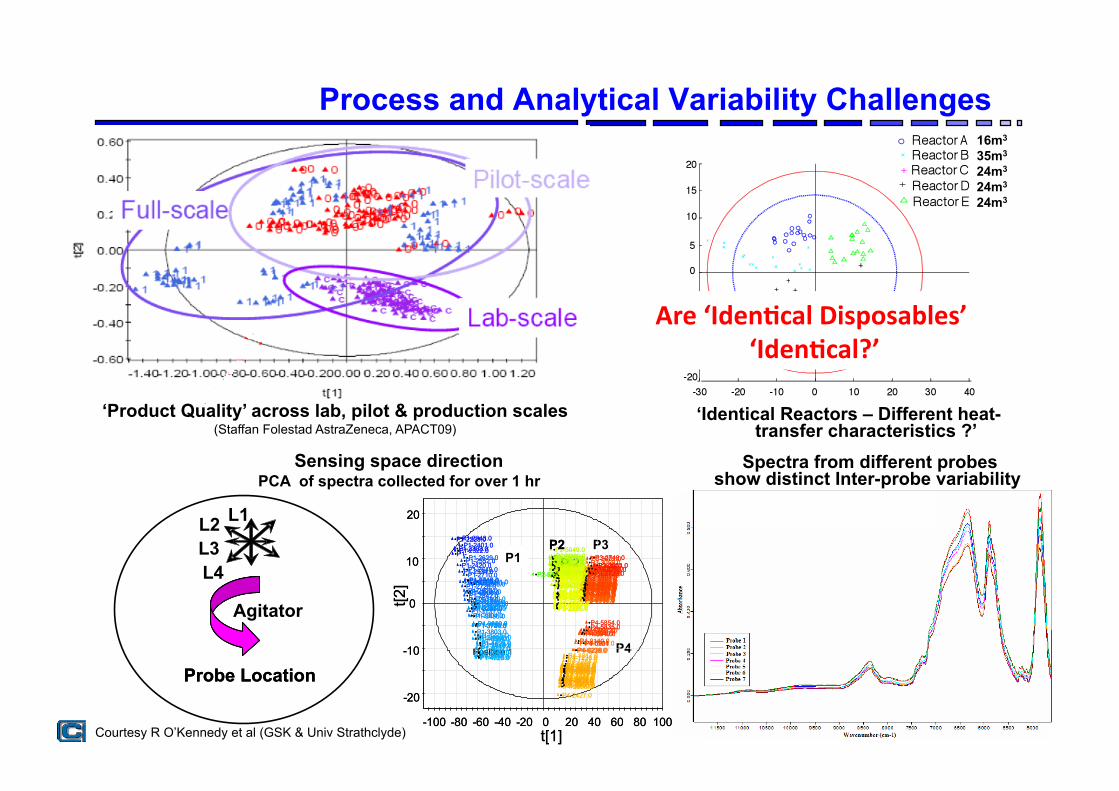
Process and Analytical Variability Challenges
‘Product Quality’ across lab, pilot & production scales (Staffan Folestad AstraZeneca, APACT09)
Spectra from different probes show distinct Inter-probe variability
Position 1
P 2 P3
P4
- 20 - 10
0 10
20
t[2]
t[1]
• P1 - 2225.0 • P1 - • P1 - 2303.0 • P1 - 2322.0 • P1 - 2343.0
• P1 - 2401.0 • P1 - 2420.0 • P1 - 2552.0 • P1 - 2611.0 • P1 - 2534.0 • P1 - 2648.0 • P1 - 2710.0 • P1 - 2728.0 • P1 - 2629.0 • P1 - 2842.0 • P1 - 2919.0 • P1 - 2746.0 • P1 - 2805.0 • P1 - 2823.0 • P1 - 2900.0 • P1 - 3014.0
• P1 - 3245.0 • P1 - 3131.0 • P1 - 3726.0 • P1 - 3341.0
• P1 - 3418.0 • P1 - 2956.0 • P1 - 3304.0 • P1 - 3150.0 • P1 - 3208.0
• P1 - 3840.0 • P1 - 3744.0 • P1 - 3803.0
• P1 - 4628.0 • P1 - 3437.0 • P1 - 3455.0 • P1 - 3514.0 • P1 - 3400.0 • P1 - 3708.0
• P1 - 3227.0 • P1 - 4225.0 • P1 - 4244.0 • P1 - 3859.0
• P1 - 4015.0 • P1 - 4609.0 • P1 - 4646.0 • P1 - 4514.0 • P1 - 4551.0 • P1 - 4819.0 • P1 - 4837.0 • P1 - 4705.0 • P1 - 4723.0 • P1 - 4742.0
• P1 - 3532.0 • P1 - 4532.0 • P1 - 4800.0
• P2 - 5400.0 • P2 - 5537.0 • P2 - 5746.0 • P2 - 5708.0 • P2 - 5919.0 • P2 - 5937.0 • P2 - 5900.0 • P2 - 0033.0 • P2 - 5805.0 • P2 - 5507.0 • P2 - 5440.0 • P2 - 5420.0 • P2 - 5610.0 • P2 - 5727.0 • P2 - 5629.0 • P2 - 5649.0 • P2 - 0150.0 • P2 - 0245.0
• P2 - 2053.0 • P2 - 0707.0
• P2 - 0630.0 • P2 - 0612.0 • P2 - 0322.0 • P2 - 0208.0 • P2 - 0227.0 • P2 - 0437.0 • P2 - 0418.0 • P2 - 1440.0 • P2 - 1147.0 • P2 - 2206.0 • P2 - 2111.0 • P2 - 2225.0 • P2 - 2342.0 • P2 - 2244.0 • P2 - 1806.0 • P2 - 1727.0 • P2 - 1939.0 • P2 - 0649.0 • P2 - 0553.0 • P2 - 0725.0 • P2 - 0839.0 • P2 - 0821.0 • P2 - 0744.0 • P2 - 0803.0 • P2 - 0534.0 • P2 - 0304.0 • P2 - 0359.0 • P2 - 1421.0 • P2 - 1206.0 • P2 - 1129.0 • P2 - 1650.0 • P2 - 2148.0 • P2 - 2129.0 • P2 - 2400.0 • P2 - 2323.0 • P2 - 2305.0 • P2 - 2034.0 • P2 - 1825.0 • P2 - 1748.0 • P2 - 1708.0 • P2 - 1843.0 • P2 - 1957.0 • P2 - 2015.0 • P2 - 1902.0 • P2 - 1920.0 • P2 - 0916.0 • P2 - 0858.0
• P4 - 2006.0 • P4 - 2348.0 • P4 - 1849.0 • P4 - 1658.0 • P4 - 1409.0 • P4 - 1427.0 • P4 - 1331.0 • P4 - 1254.0 • P4 - 1313.0 • P4 - 1603.0 • P4 - 1621.0
• P4 - 1640.0 • P4 - 3040.0 • P4 - 2311.0 • P4 - 2253.0 • P4 - 2157.0 • P4 - 2216.0 • P4 - 2234.0
• P4 - 2600.0 • P4 - 2427.0 • P4 - 2446.0 • P4 - 1217.0 • P4 - 1831.0 • P4 - 1350.0
• P4 - 1236.0 • P4 - 1544.0 • P4 - 2945.0 • P4 - 2849.0 • P4 - 2908.0 • P4 - 2926.0 • P4 - 2619.0 • P4 - 2330.0 • P4 - 2523.0 • P4 - 2542.0 • P4 - 2504.0 • P4 - 2409.0
• P3 - 4438.0 • P3 - 5058.0 • P3 - 5019.0 • P3 - 4941.0 • P3 - 5232.0 • P3 - 5154.0
• P3 - 5117.0 • P3 - 5135.0 • P3 - 4650.0 • P3 - 4631.0 • P3 - 4845.0
• P4 - 0158.0 • P4 - 0220.0 • P4 - 0238.0
• P3 - 4242.0 • P3 - 4516.0 • P3 - 4535.0 • P3 - 4457.0 • P3 - 4127.0 • P3 - 4050.0 • P3 - 5038.0
• P3 - 5000.0 • P3 - 5213.0
• P3 - 4922.0 • P3 - 4708.0 • P3 - 4730.0 • P3 - 4612.0
• P3 - 3137.0 • P3 - 3640.0 • P3 - 3701.0 • P3 - 3621.0 • P3 - 3835.0 • P3 - 3446.0 • P3 - 3505.0 • P3 - 3427.0 • P3 - 3350.0 • P3 - 3408.0
• P4 - 0026.0 • P4 - 0140.0 • P4 - 0044.0
• P3 - 4340.0 • P3 - 4321.0 • P3 - 4301.0 • P3 - 4420.0 • P3 - 4109.0 • P3 - 4554.0 • P3 - 3002.0 • P3 - 2921.0
• P3 - 3118.0 • P3 - 3059.0 • P3 - 3020.0 • P3 - 3039.0 • P3 - 3155.0
• P3 - 3544.0 • P3 - 3603.0 • P3 - 3816.0 • P3 - 3233.0
• P4 - 0007.0 • P4 - 5912.0
• P3 - 4401.0 • P3 - 2940.0 • P3 - 2844.0 • P3 - 2902.0
• P4 - 5949.0 • P4 - 5931.0
• P4 - 5854.0
• P3 - 2748.0 • P3 - 2806.0 • P3 - 2729.0 • P3 - 2710.0
• P4 - 5835.0
• P3 - 2651.0
- 100 - 80 - 60 - 40 - 20 0 20 40 60 80 100
P2 P1
Sensing space direction PCA of spectra collected for over 1 hr
Courtesy R O’Kennedy et al (GSK & Univ Strathclyde)
Agitator
L1 L2 L3 L4
Probe Location
L2 L3 L4
Probe Location
‘Identical Reactors – Different heat-transfer characteristics ?’
16m3
35m3
24m3
24m3
24m3
Are ‘Iden)cal Disposables’ ‘Iden)cal?’
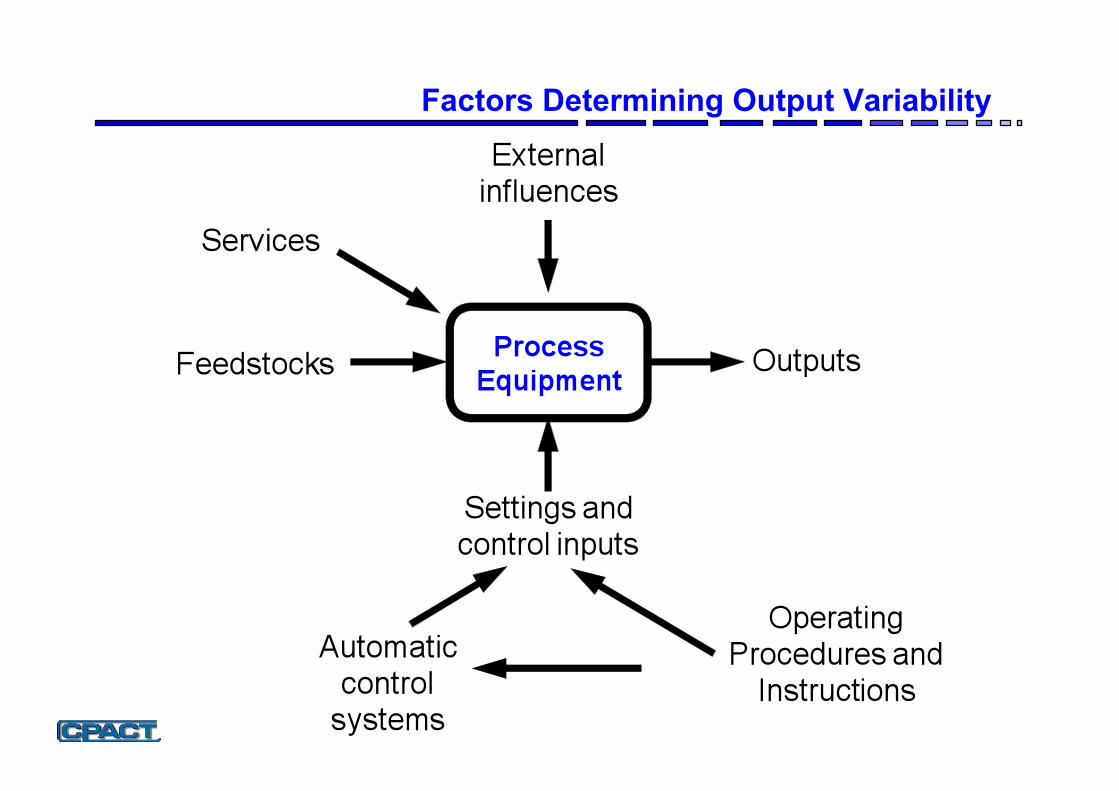
Factors Determining Output Variability
Process Variability
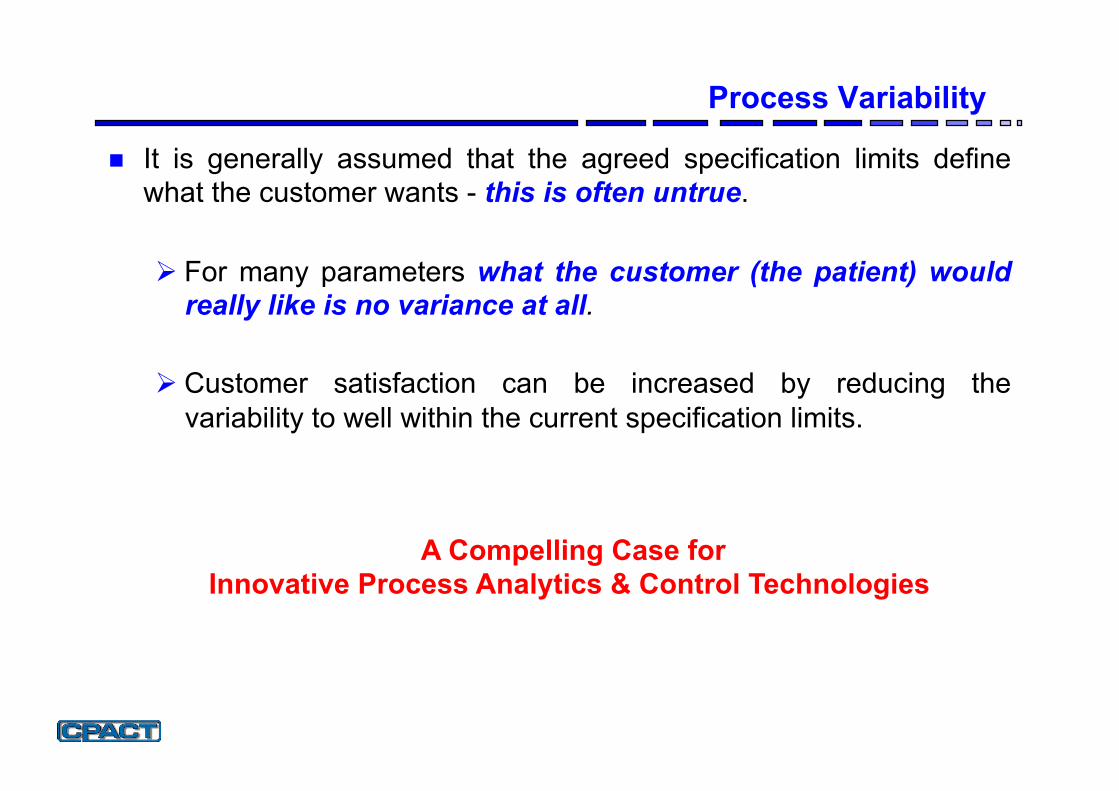
" It is generally assumed that the agreed specification limits define what the customer wants - this is often untrue.
! For many parameters what the customer (the patient) would really like is no variance at all.
! Customer satisfaction can be increased by reducing the variability to well within the current specification limits.
A Compelling Case for Innovative Process Analytics & Control Technologies
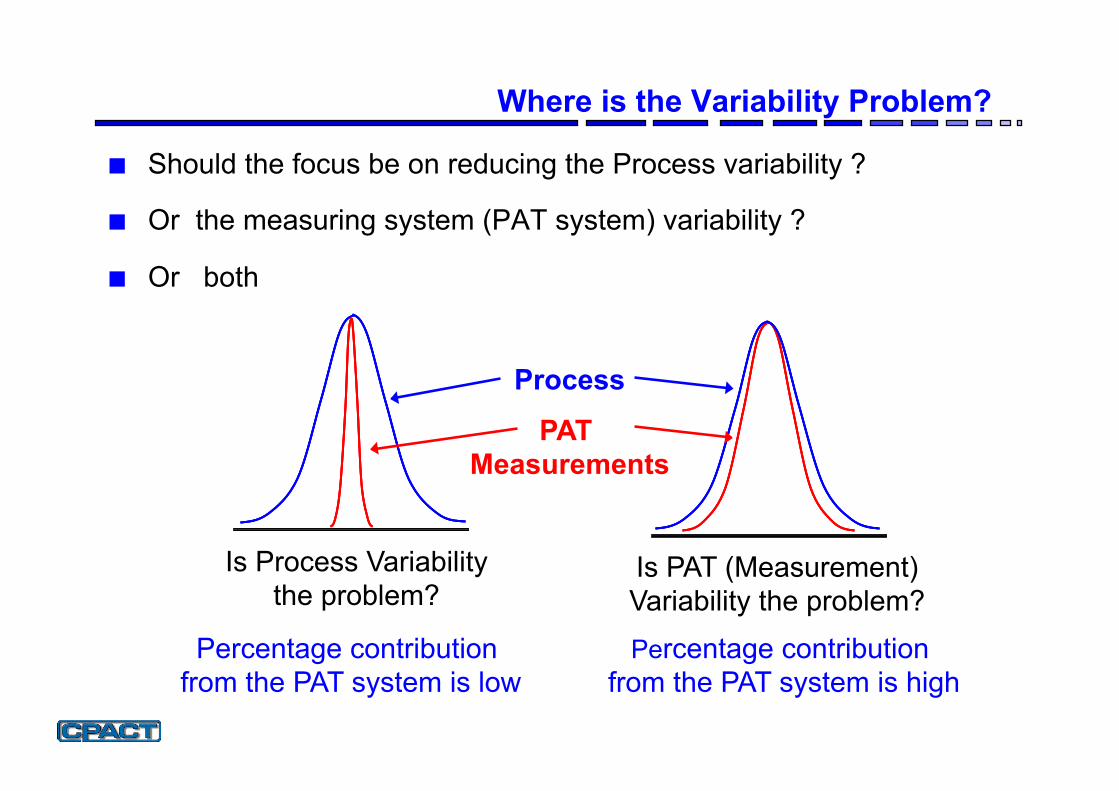
Where is the Variability Problem?
■ Should the focus be on reducing the Process variability ?
■ Or the measuring system (PAT system) variability ?
■ Or both
Percentage contribution from the PAT system is low
Percentage contribution from the PAT system is high
Is Process Variability the problem?
Is PAT (Measurement) Variability the problem?
Process
PAT Measurements
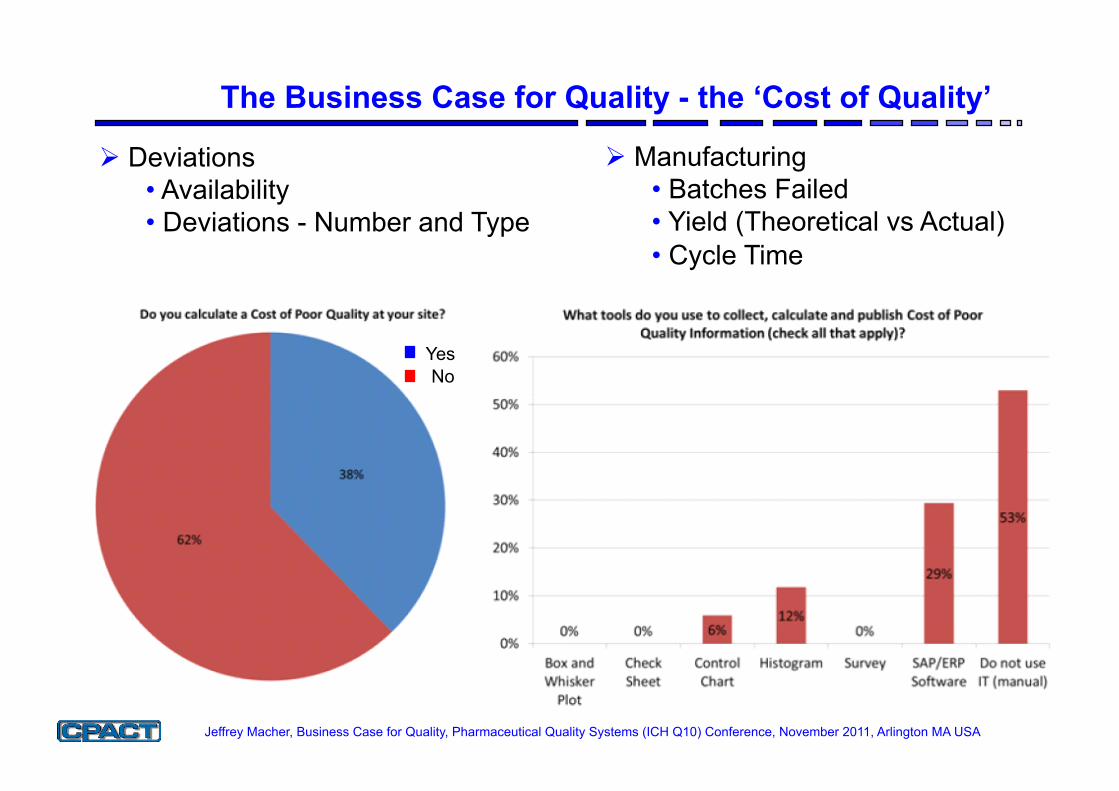
The Business Case for Quality - the ‘Cost of Quality’
Jeffrey Macher, Business Case for Quality, Pharmaceutical Quality Systems (ICH Q10) Conference, November 2011, Arlington MA USA
! Deviations • Availability • Deviations - Number and Type
! Manufacturing • Batches Failed • Yield (Theoretical vs Actual) • Cycle Time
Yes No
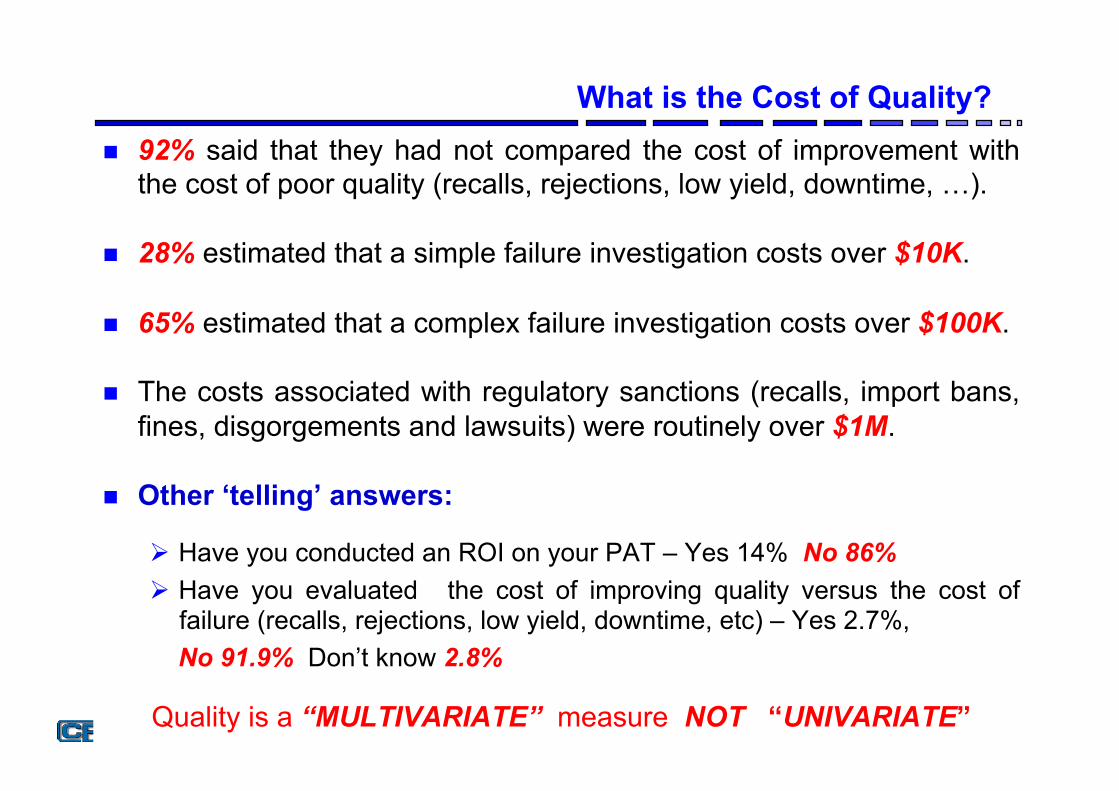
What is the Cost of Quality? " 92% said that they had not compared the cost of improvement with
the cost of poor quality (recalls, rejections, low yield, downtime, …).
" 28% estimated that a simple failure investigation costs over $10K.
" 65% estimated that a complex failure investigation costs over $100K.
" The costs associated with regulatory sanctions (recalls, import bans, fines, disgorgements and lawsuits) were routinely over $1M.
" Other ‘telling’ answers:
! Have you conducted an ROI on your PAT – Yes 14% No 86% ! Have you evaluated the cost of improving quality versus the cost of
failure (recalls, rejections, low yield, downtime, etc) – Yes 2.7%, No 91.9% Don’t know 2.8%
Quality is a “MULTIVARIATE” measure NOT “UNIVARIATE”
Predictive Modelling and Data Fusion in Biologics Downstream Processing
Real-Time Quantitative Monitoring of Proteins
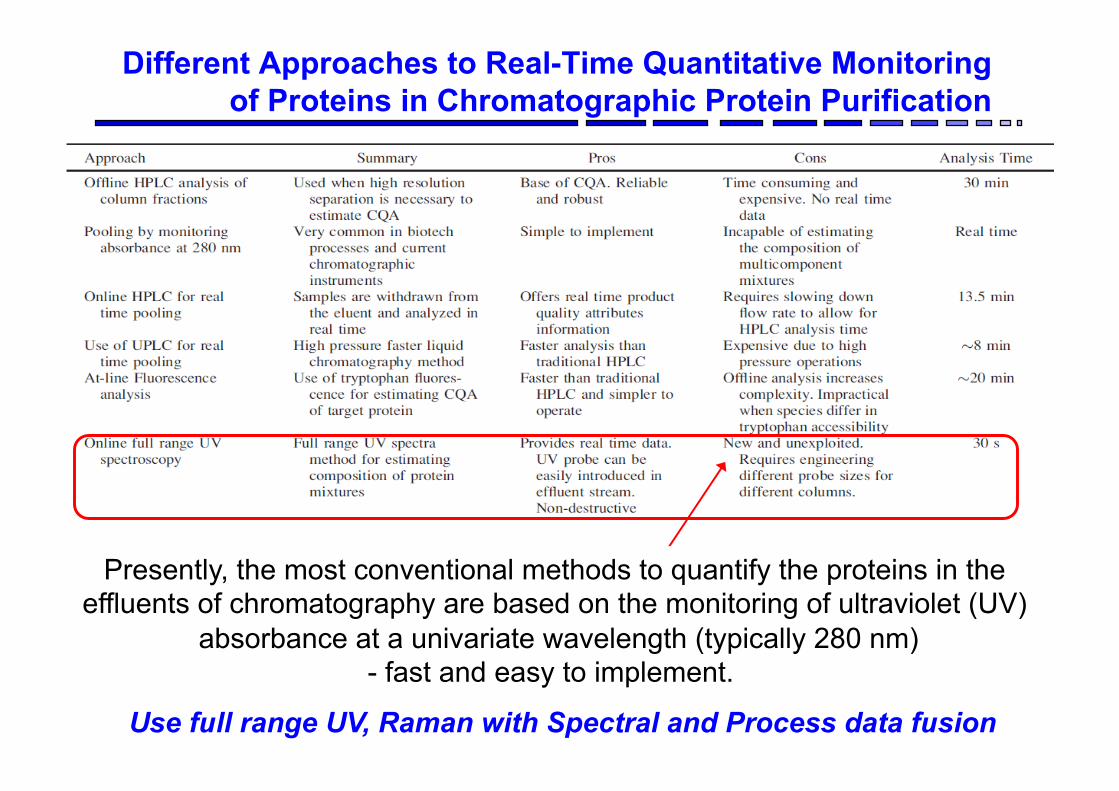
Different Approaches to Real-Time Quantitative Monitoring of Proteins in Chromatographic Protein Purification
Presently, the most conventional methods to quantify the proteins in the effluents of chromatography are based on the monitoring of ultraviolet (UV)
absorbance at a univariate wavelength (typically 280 nm) - fast and easy to implement.
Use full range UV, Raman with Spectral and Process data fusion
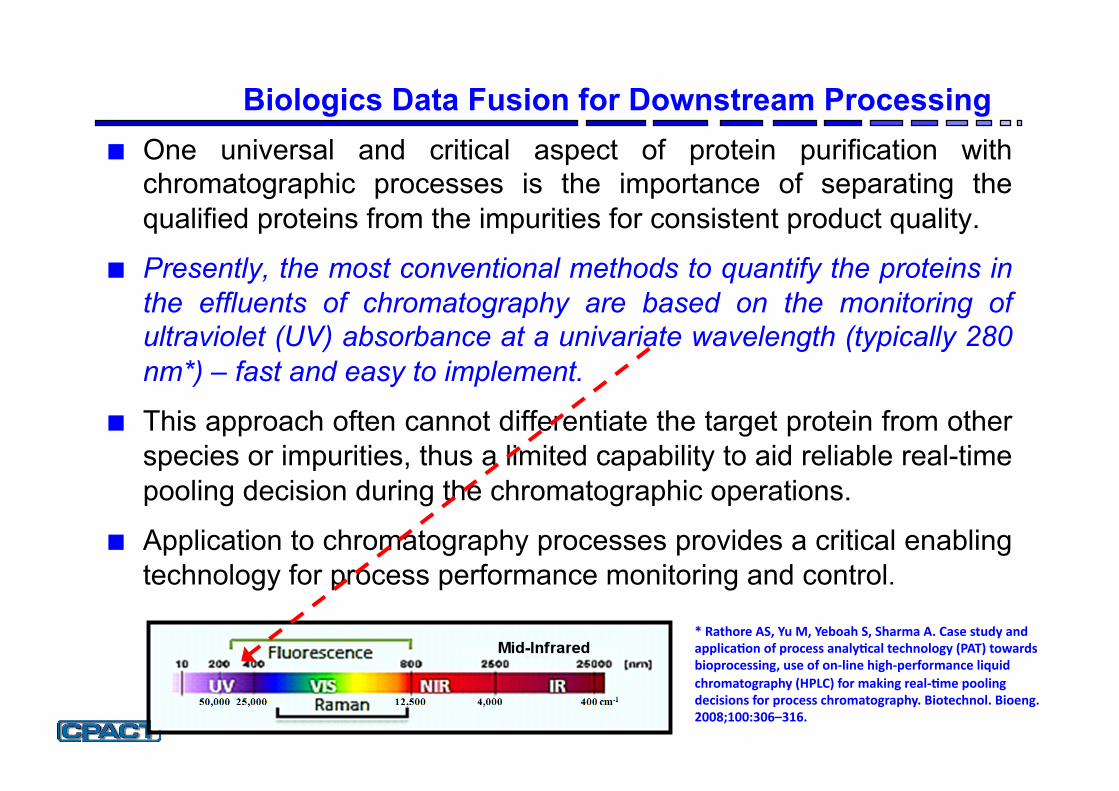
Biologics Data Fusion for Downstream Processing ■ One universal and critical aspect of protein purification with
chromatographic processes is the importance of separating the qualified proteins from the impurities for consistent product quality.
■ Presently, the most conventional methods to quantify the proteins in the effluents of chromatography are based on the monitoring of ultraviolet (UV) absorbance at a univariate wavelength (typically 280 nm*) – fast and easy to implement.
■ This approach often cannot differentiate the target protein from other species or impurities, thus a limited capability to aid reliable real-time pooling decision during the chromatographic operations.
■ Application to chromatography processes provides a critical enabling technology for process performance monitoring and control.
* Rathore AS, Yu M, Yeboah S, Sharma A. Case study and applica)on of process analy)cal technology (PAT) towards bioprocessing, use of on-‐line high-‐performance liquid chromatography (HPLC) for making real-‐)me pooling decisions for process chromatography. Biotechnol. Bioeng. 2008;100:306–316.
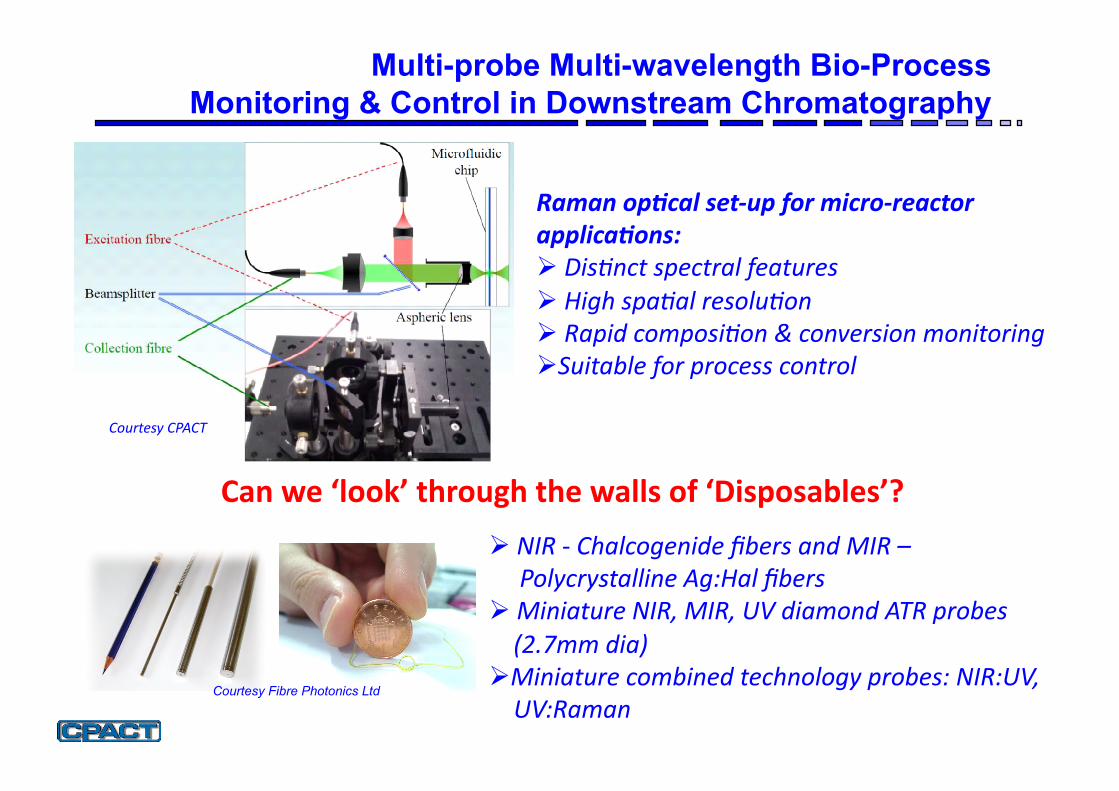
Multi-probe Multi-wavelength Bio-Process Monitoring & Control in Downstream Chromatography
Raman op(cal set-‐up for micro-‐reactor applica(ons: ! Dis%nct spectral features ! High spa%al resolu%on ! Rapid composi%on & conversion monitoring ! Suitable for process control
Courtesy Fibre Photonics Ltd
! NIR -‐ Chalcogenide fibers and MIR – Polycrystalline Ag:Hal fibers ! Miniature NIR, MIR, UV diamond ATR probes (2.7mm dia) ! Miniature combined technology probes: NIR:UV, UV:Raman
Courtesy CPACT
Can we ‘look’ through the walls of ‘Disposables’?
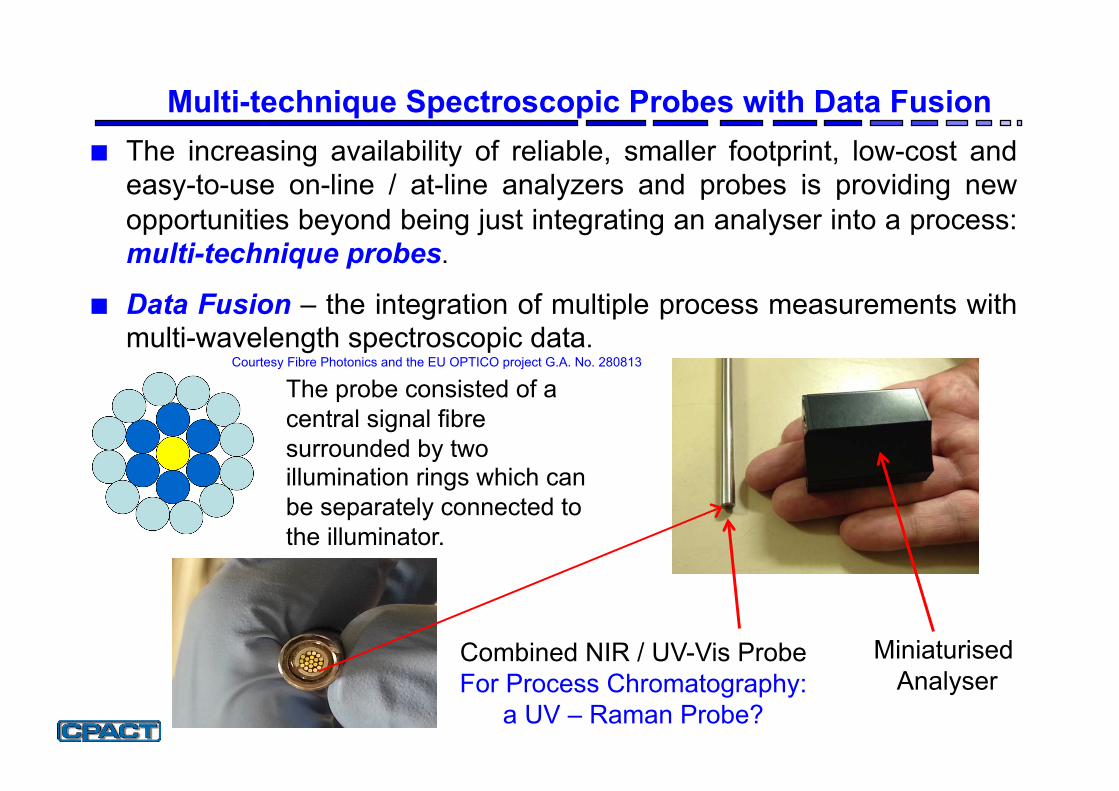
Multi-technique Spectroscopic Probes with Data Fusion ■ The increasing availability of reliable, smaller footprint, low-cost and
easy-to-use on-line / at-line analyzers and probes is providing new opportunities beyond being just integrating an analyser into a process: multi-technique probes.
■ Data Fusion – the integration of multiple process measurements with multi-wavelength spectroscopic data.
Combined NIR / UV-Vis Probe For Process Chromatography:
a UV – Raman Probe?
Miniaturised Analyser
Courtesy Fibre Photonics and the EU OPTICO project G.A. No. 280813
The probe consisted of a central signal fibre surrounded by two illumination rings which can be separately connected to the illuminator.
Pitfalls in Calibration Modelling: The Impact of Fluctuations in External Variables
" Unlike in off-line assays, spectroscopic measurements in on-line/in-line real-time applications are almost inevitably subjected to variations in measurement conditions:
! e.g. temperature, sample physical properties (e.g. cell density, particle size, viscosity, sample compactness, surface texture, etc), ….
! can invalidate the assumption of a linear relationship between the spectroscopic measurements and the concentrations of the target chemical or biological components.
" Variations in ‘external’ variables can have a major impact on predictive ability, the maintenance of the predictive abilities of the multivariate calibration models as well as in their transfer from laboratory/pilot to production plant and across manufacturing sites.
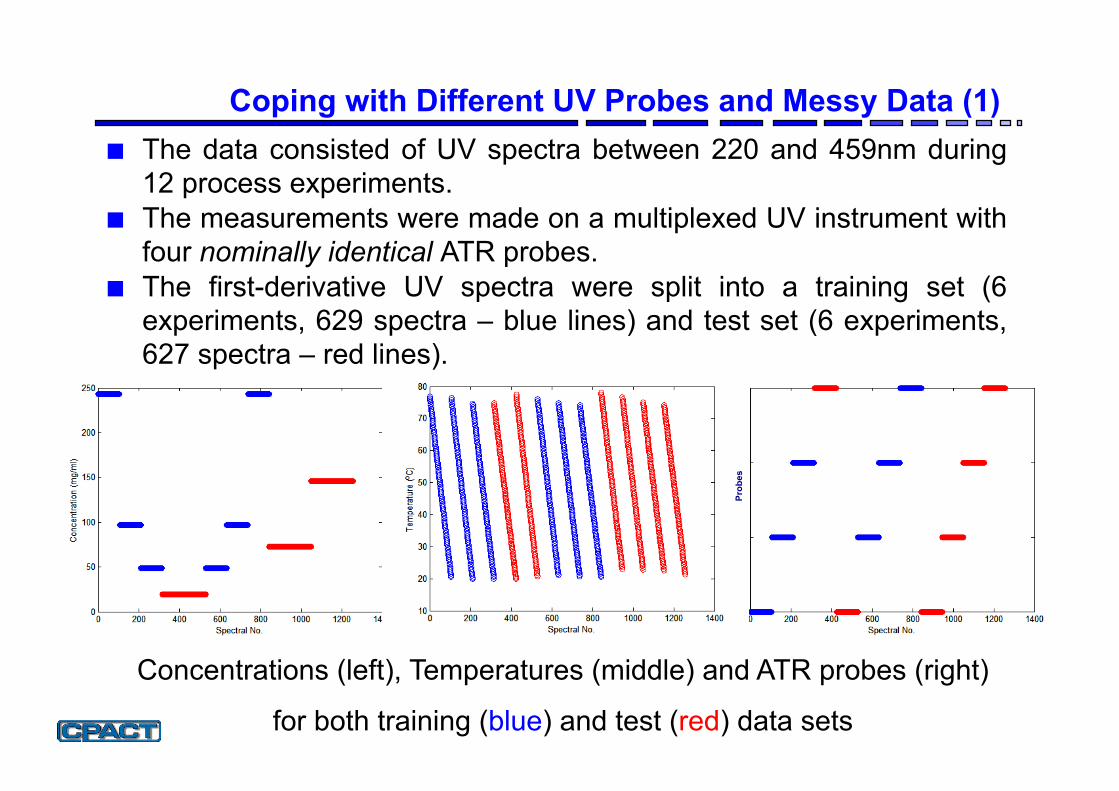
Concentrations (left), Temperatures (middle) and ATR probes (right)
for both training (blue) and test (red) data sets
■ The data consisted of UV spectra between 220 and 459nm during 12 process experiments.
■ The measurements were made on a multiplexed UV instrument with four nominally identical ATR probes.
■ The first-derivative UV spectra were split into a training set (6 experiments, 629 spectra – blue lines) and test set (6 experiments, 627 spectra – red lines).
Coping with Different UV Probes and Messy Data (1)
Prob
es
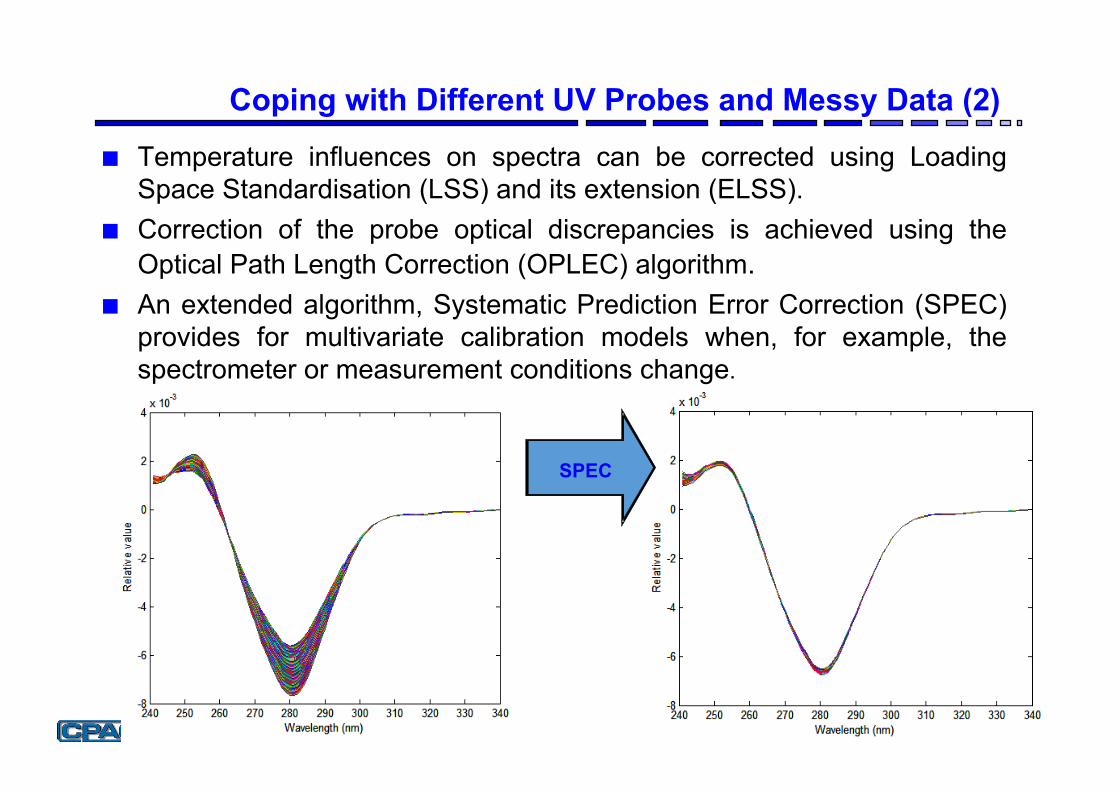
Coping with Different UV Probes and Messy Data (2)
SPEC
■ Temperature influences on spectra can be corrected using Loading Space Standardisation (LSS) and its extension (ELSS).
■ Correction of the probe optical discrepancies is achieved using the Optical Path Length Correction (OPLEC) algorithm.
■ An extended algorithm, Systematic Prediction Error Correction (SPEC) provides for multivariate calibration models when, for example, the spectrometer or measurement conditions change.
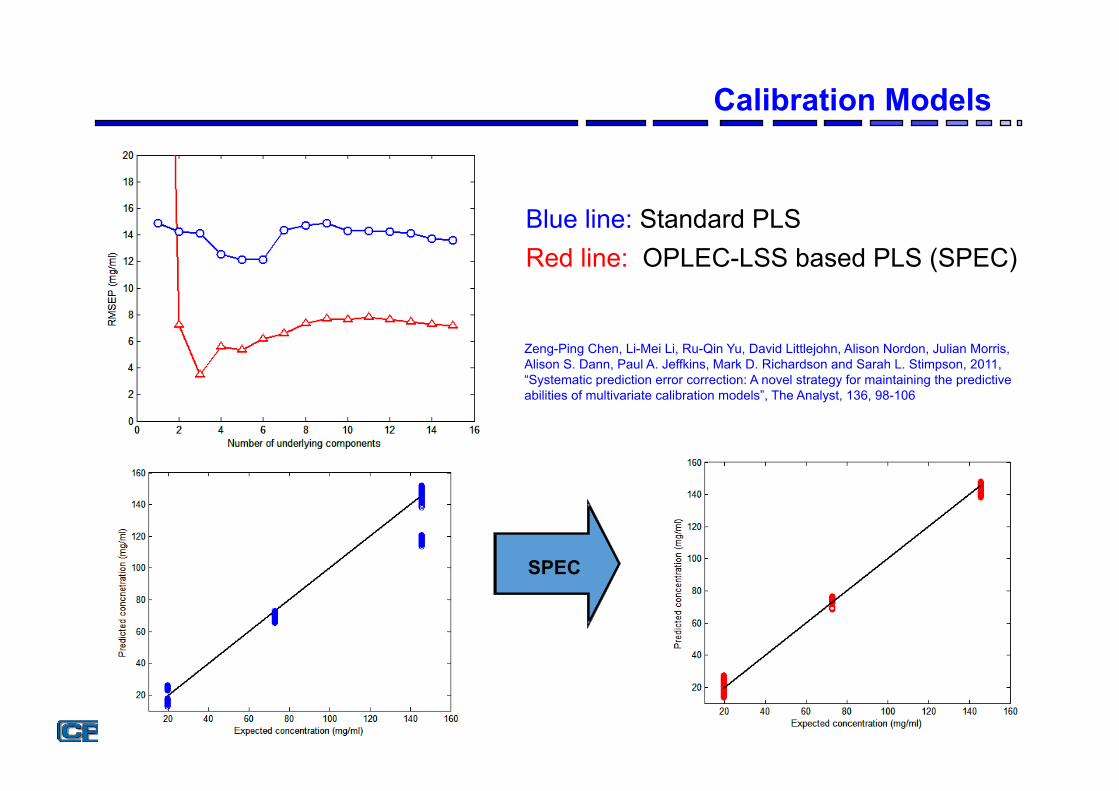
Calibration Models
Blue line: Standard PLS Red line: OPLEC-LSS based PLS (SPEC)
SPEC
Zeng-Ping Chen, Li-Mei Li, Ru-Qin Yu, David Littlejohn, Alison Nordon, Julian Morris, Alison S. Dann, Paul A. Jeffkins, Mark D. Richardson and Sarah L. Stimpson, 2011, “Systematic prediction error correction: A novel strategy for maintaining the predictive abilities of multivariate calibration models”, The Analyst, 136, 98-106
Application to the Predictive Modelling of Fermentation Biomass
Zeng-Ping Chen, Li-Jing Zhong, Alison Nordon, David Littlejohn, Megan Holden, Mariana Fazenda, Linda Harvey, Brian McNeil, Jim Faulkner and Julian Morris, Calibration of Multiplexed Fiber-Optic Spectroscopy, Anal. Chem. 2011, 83, 2655–2659
Zeng-Ping Chen, Li-Mei Li, Ru-Qin Yu, David Littlejohn, Alison Nordon, Julian Morris, Alison S. Dann, Paul A. Jeffkins, Mark D. Richardson and Sarah L. Stimpson, Systematic prediction error correction: A novel strategy for maintaining the predictive abilities of multivariate calibration models, The Analyst, 2011, 36, 98-106
(Zeiss Corona 45 NIR Spectra Measured Every Fifteen Minutes)
■ The process under study was an industrial pilot-plant scale streptomyces fermentation involving a seed stage and a production stage.
■ Biomass was grown in the seed stage and then transferred into the final fed batch stage for the production of the product lasting approximately 140hrs.
■ Two sets of fermentation experiments were carried out. The first set comprised seven batches (calibration batches); the second set was made up of six batches (test batches).
■ The seven calibration batches were run under similar conditions, but natural variation provided some degree of variability.
■ For the test batches, the runs were carried out under different environmental conditions (pH and temperature), feed rates (sugar feed) and feed amounts (oil feed).
Coping with Process Variation [Courtesy GSK]
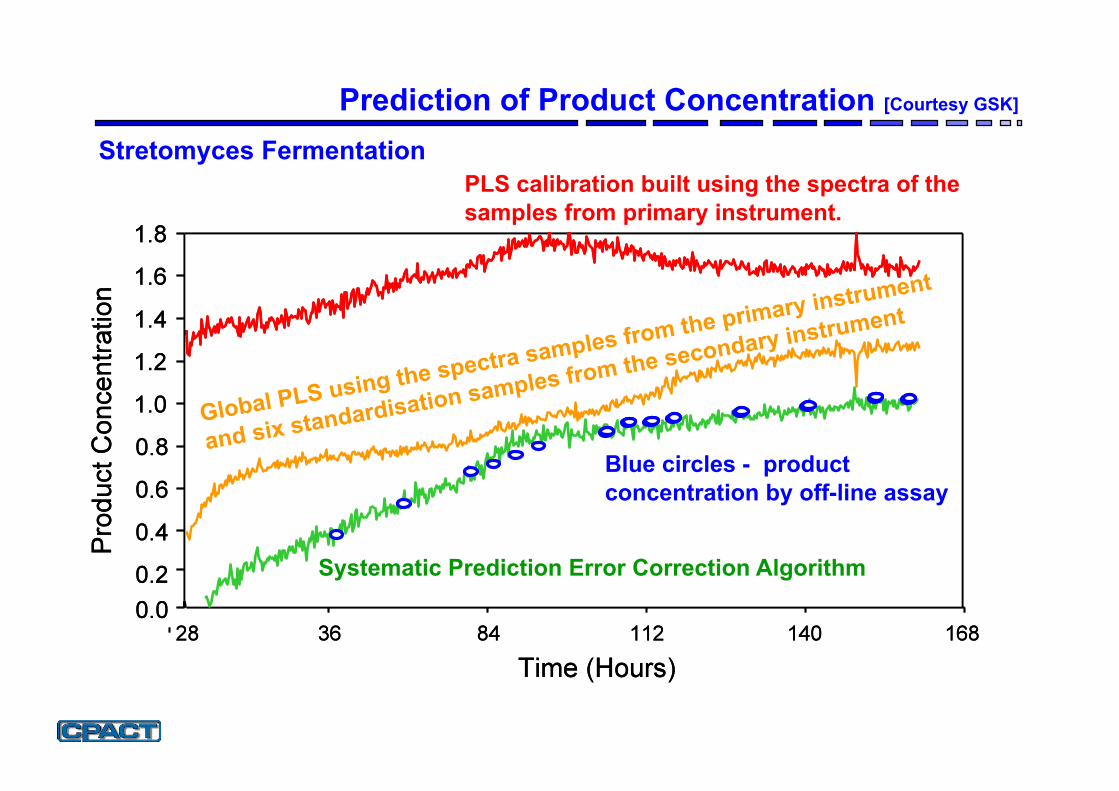
Prediction of Product Concentration [Courtesy GSK]
PLS calibration built using the spectra of the samples from primary instrument.
Global PLS using the spectra samples from the primary instrument
and six standardisation samples from the secondary instrument
Blue circles - product concentration by off-line assay
Systematic Prediction Error Correction Algorithm
Stretomyces Fermentation
The Message
Its not just the installation of Process Analytical Technologies
It is the COMBINED use of the appropriate PAT technologies
along with Smart Modelling and Chemometrics for success to be achieved
Software Sensors (Soft-Sensors) and
Inferential Measurement & Control
Back to the Future
Virtual Measurement through Software Sensors: (Potential for a major impact in bio-pharma)
■ Soft sensors - known also as software sensors or inferential measurements are operators’ and engineers’ virtual eyes and ears.
! Software sensors create windows into your process where physical equivalents are unrealistic or even impossible and where difficulties in measuring quality (primary) variables inevitably mean poor or no control at all:
! e.g. reliance on lab assays/measurements leading to long measurement delays
! lack-of or cost-of or difficulty-of using on-line measurement technologies
! Reliability of existing sensors
0.9
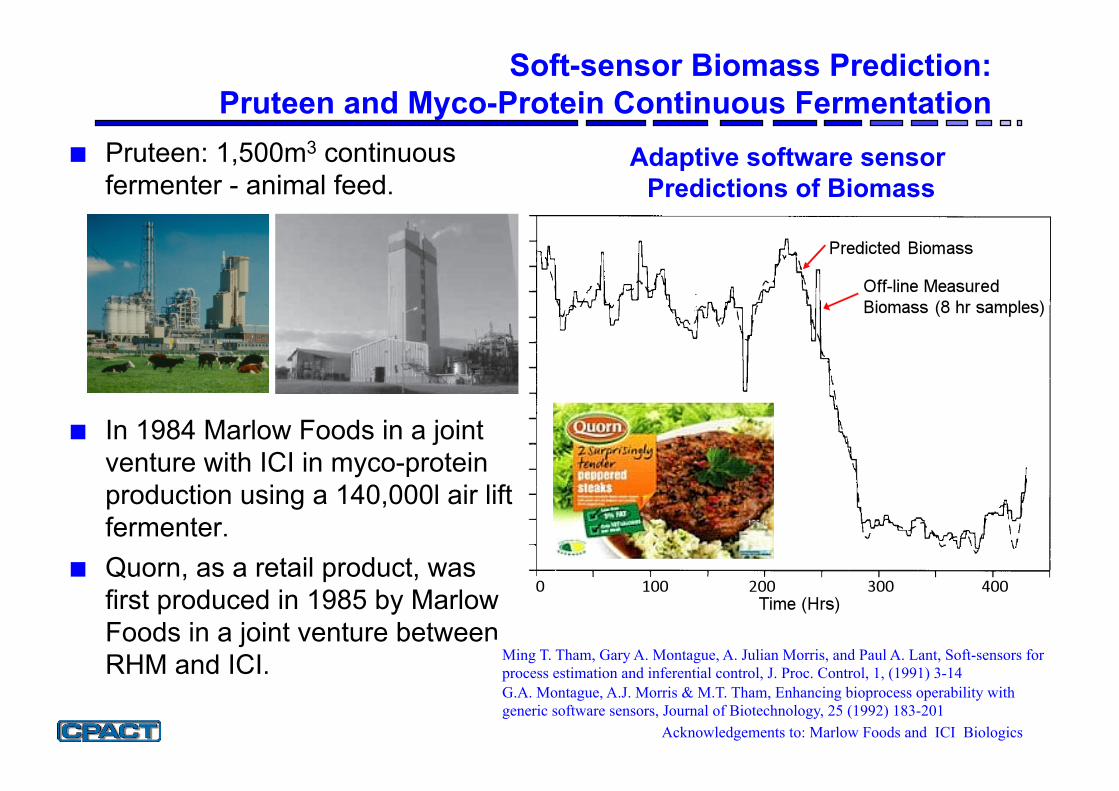
Soft-sensor Biomass Prediction: Pruteen and Myco-Protein Continuous Fermentation
Acknowledgements to: Marlow Foods and ICI Biologics
Adaptive software sensor Predictions of Biomass
■ Pruteen: 1,500m3 continuous fermenter - animal feed.
■ In 1984 Marlow Foods in a joint venture with ICI in myco-protein production using a 140,000l air lift fermenter.
■ Quorn, as a retail product, was first produced in 1985 by Marlow Foods in a joint venture between RHM and ICI. Ming T. Tham, Gary A. Montague, A. Julian Morris, and Paul A. Lant, Soft-sensors for
process estimation and inferential control, J. Proc. Control, 1, (1991) 3-14 G.A. Montague, A.J. Morris & M.T. Tham, Enhancing bioprocess operability with generic software sensors, Journal of Biotechnology, 25 (1992) 183-201
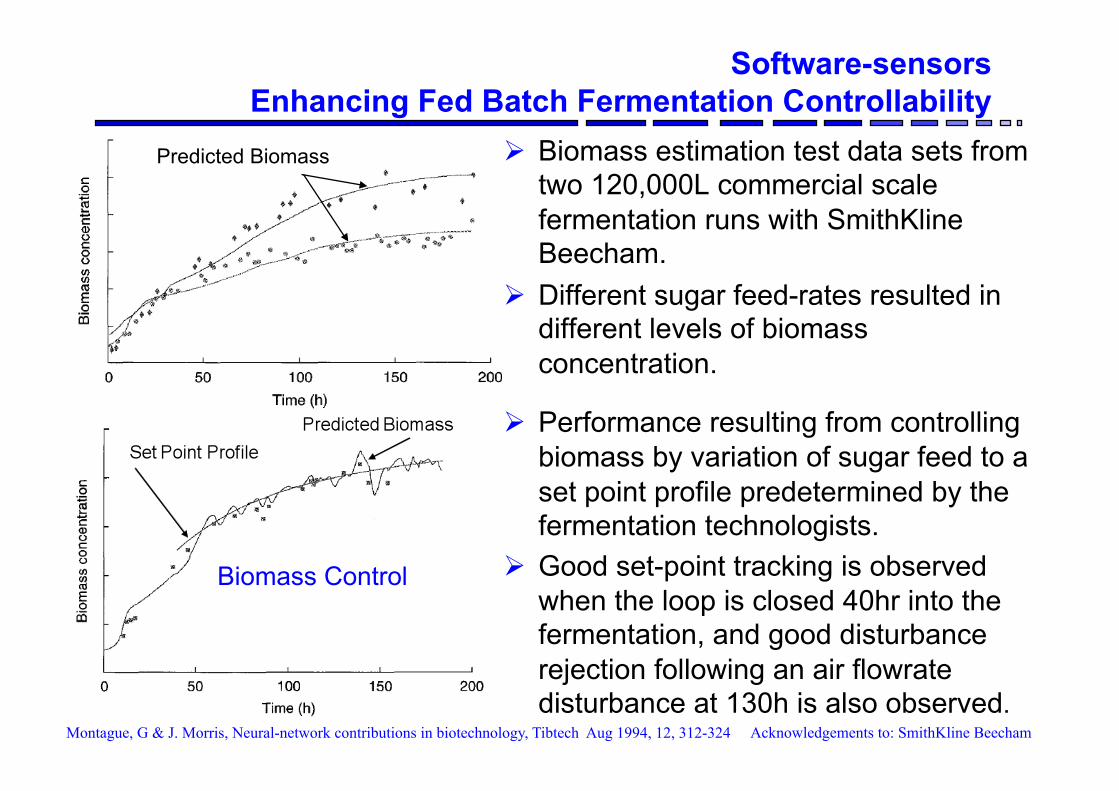
Software-sensors Enhancing Fed Batch Fermentation Controllability
Predicted Biomass
Acknowledgements to: SmithKline Beecham Montague, G & J. Morris, Neural-network contributions in biotechnology, Tibtech Aug 1994, 12, 312-324
! Biomass estimation test data sets from two 120,000L commercial scale fermentation runs with SmithKline Beecham.
! Different sugar feed-rates resulted in different levels of biomass concentration.
! Performance resulting from controlling biomass by variation of sugar feed to a set point profile predetermined by the fermentation technologists.
! Good set-point tracking is observed when the loop is closed 40hr into the fermentation, and good disturbance rejection following an air flowrate disturbance at 130h is also observed.
Biomass Control

Closure
What is the Future for PAT with Smart Data Analytics? ■ Novel process analytical technologies will play a massive role in
providing the right tools for directly controlling quality, not just providing product and process ‘know-how’.
! Configurable modular spectrometers; multi-technique probes; innovative spectroscopy's; very low field NMR – potential for earth-field NMR, …..
! Increasing use of software sensors based on better process understanding and predictive modelling.
■ Linking Process Analytical Technologies with Advanced Process Control systems (APC) is an integral part of PAT and QbD.
! Advanced process control systems are capable of integrating all the information that comes from the production process and adapt the process in real-time to match the desired product quality – Real Time Quality Control.
From ‘Quality by Design’ to ‘Quality by Control’
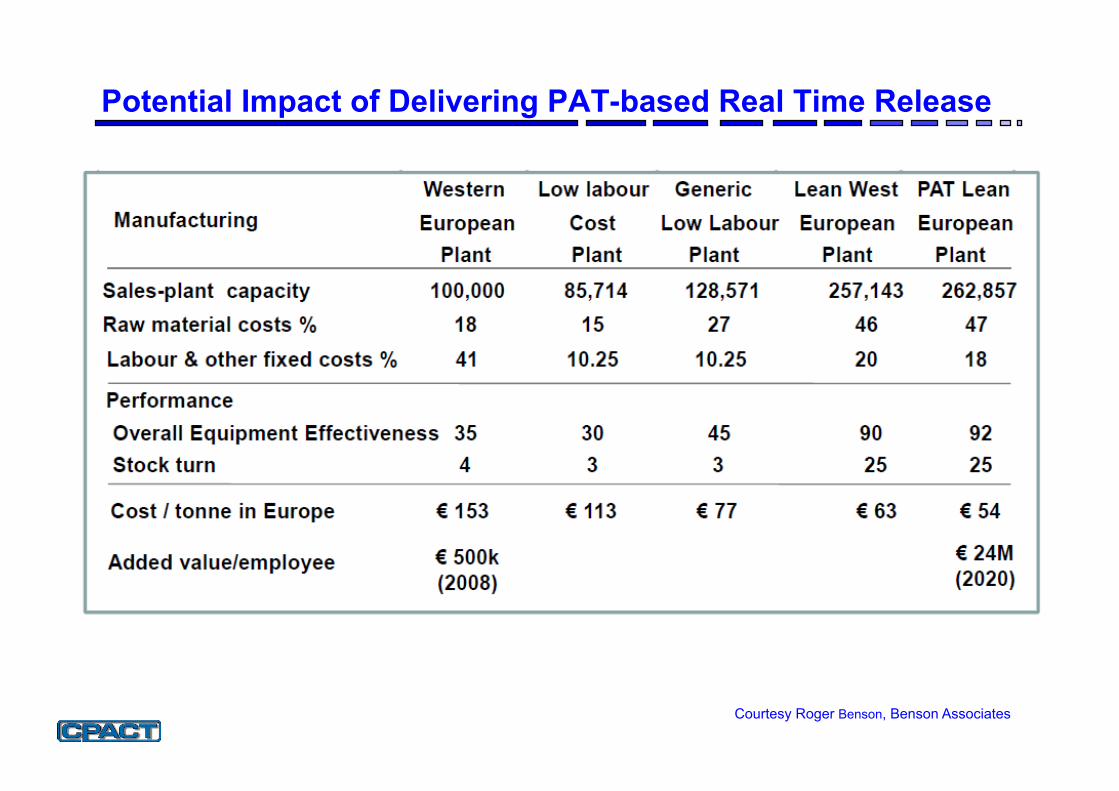
Potential Impact of Delivering PAT-based Real Time Release
Courtesy Roger Benson, Benson Associates

Acknowledgements: My CPACT research colleagues past and present and CPACT member companies for their R&D challenges
and in particular GSK, Pfizer, SmithKline Beecham, and RHM / ICI Biologics for the CASE Studies
Many thanks to gbx Summits for their kind invitation
and of course you for your attention
I will be happy to answer questions
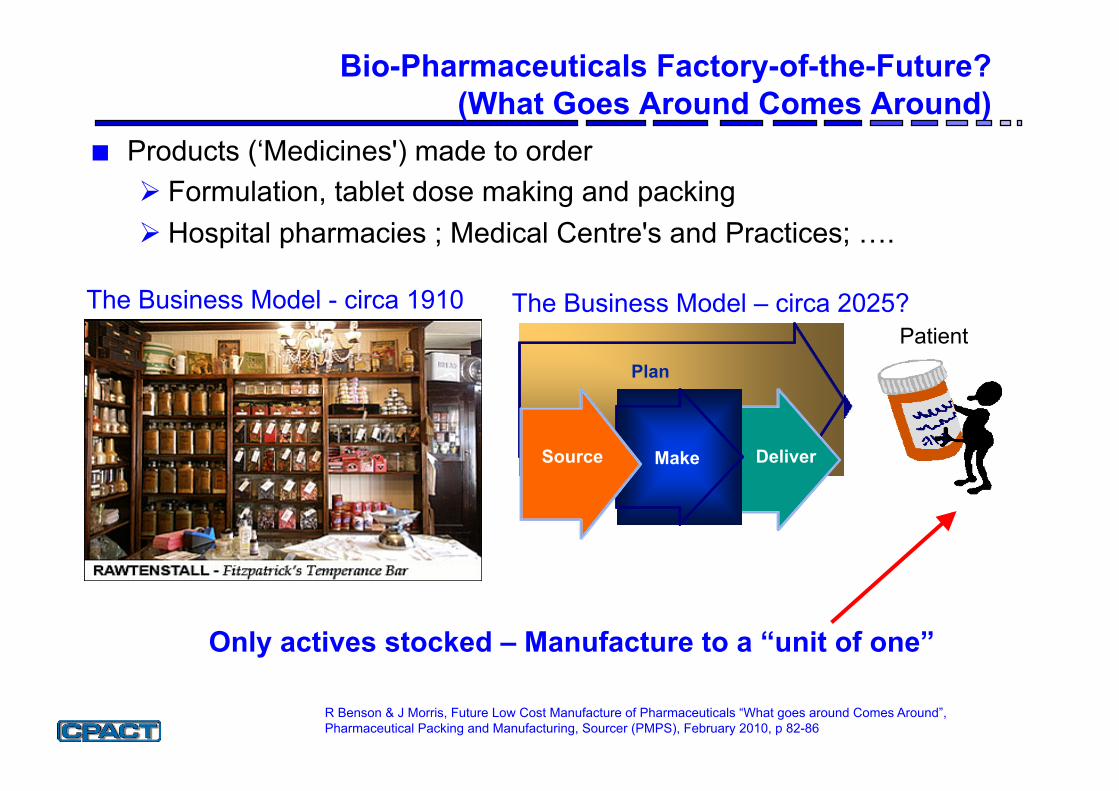
Bio-Pharmaceuticals Factory-of-the-Future? (What Goes Around Comes Around)
■ Products (‘Medicines') made to order ! Formulation, tablet dose making and packing ! Hospital pharmacies ; Medical Centre's and Practices; ….
Only actives stocked – Manufacture to a “unit of one”
R Benson & J Morris, Future Low Cost Manufacture of Pharmaceuticals “What goes around Comes Around”, Pharmaceutical Packing and Manufacturing, Sourcer (PMPS), February 2010, p 82-86
Plan
Deliver Make Source
Patient The Business Model – circa 2025? The Business Model - circa 1910

Additional Slides
CPACT Software Tools " CPACT Software toolboxes available to member companies:
! Data PreScreen: highly visual multivariate data visualisation and data pre-processing toolbox
! BatchDAT: highly visual batch process scale-up multivariate data visualisation and modelling and performance monitoring toolbox
! DoEMan: Design of Experiments and Calibration advisory toolbox
! Spectral Shooter: highly visual user friendly calibration maintenance and calibration transfer toolbox
! Neural Network modelling toolbox
! Software Sensors
! Hybrid Modelling: mechanistic plus data modelling
! NewNet: Neural Network modelling toolbox
Application of Systematic Prediction Error Correction (SPEC) Method
to Calibration Transfer and Maintenance
Zeng-Ping Chen, Li-Mei Li, Ru-Qin Yu, David Littlejohn, Alison Nordon, Julian Morris, Alison S. Dann, Paul A. Jeffkins, Mark D. Richardson and Sarah L. Stimpson, 2011, “Systematic prediction error correction: A novel strategy for maintaining the predictive abilities of multivariate calibration models”, The Analyst, 136, 98-106
Results
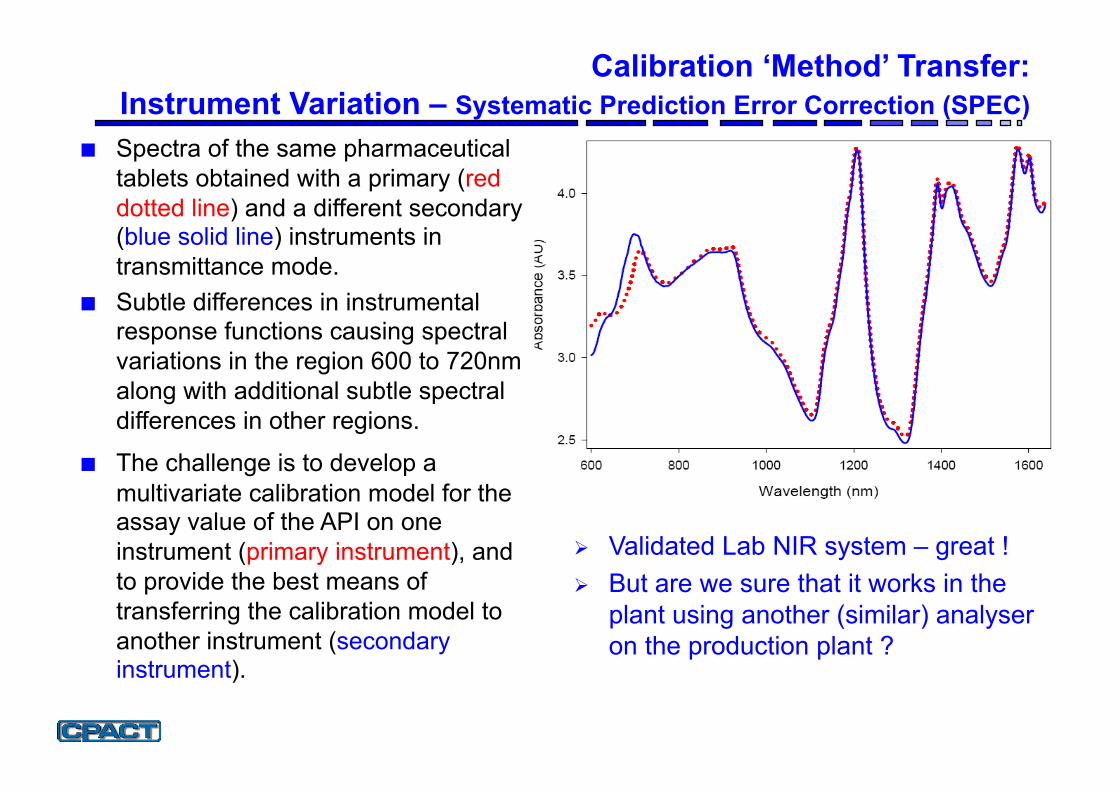
■ Spectra of the same pharmaceutical tablets obtained with a primary (red dotted line) and a different secondary (blue solid line) instruments in transmittance mode.
■ Subtle differences in instrumental response functions causing spectral variations in the region 600 to 720nm along with additional subtle spectral differences in other regions.
■ The challenge is to develop a multivariate calibration model for the assay value of the API on one instrument (primary instrument), and to provide the best means of transferring the calibration model to another instrument (secondary instrument).
Calibration ‘Method’ Transfer: Instrument Variation – Systematic Prediction Error Correction (SPEC)
! Validated Lab NIR system – great ! ! But are we sure that it works in the
plant using another (similar) analyser on the production plant ?
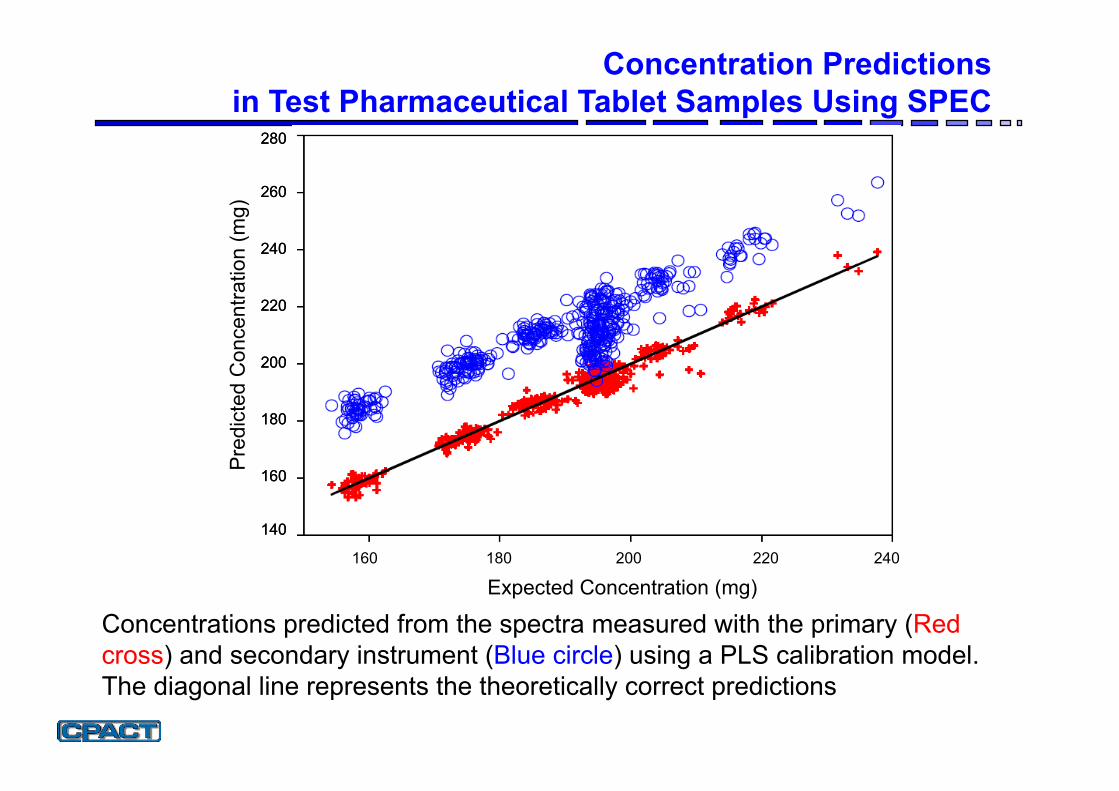
Results
Concentrations predicted from the spectra measured with the primary (Red cross) and secondary instrument (Blue circle) using a PLS calibration model. The diagonal line represents the theoretically correct predictions
Concentration Predictions in Test Pharmaceutical Tablet Samples Using SPEC
160 180 200
280
260
240
220
200
180
160
140
Pre
dict
ed C
once
ntra
tion
(mg)
Expected Concentration (mg) 220 240
280
260
240
220
200
180
160
140