Embed Size (px)
Citation preview

Table of
Contents
Key Statistics for January
Sales 2016 Residential Sales Stats Year-to-Year Total Sales by Map Area Median 2016 Median Sales Stats Year-to-Year Median Sales by Map Area Listings 2016 Active Listings by Map Area 2016 Total Active Listings vs. Total Sales Year-to-Year Active Listings by Map Area Inventory 2016 Months of Inventory by Map Area Year-to-Year Months of Inventory
Summary
About Hady Chahine Contact Information
Key Statistics for January
Back to Table of Contents
= trending positive = trending positive
= trending negative = trending negative
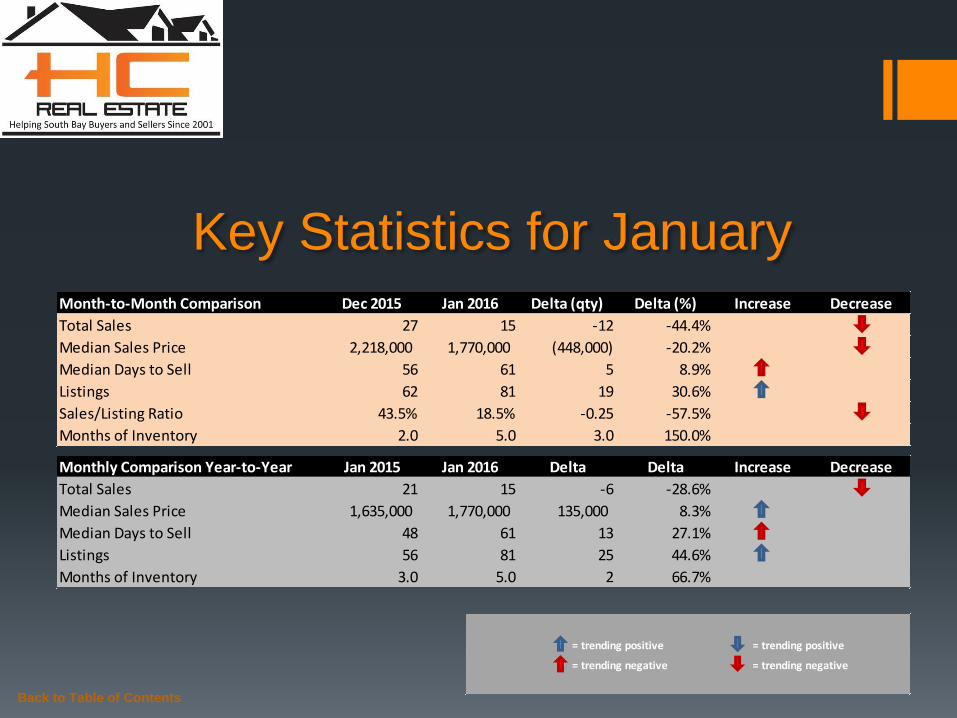
Month-to-Month Comparison Dec 2015 Jan 2016 Delta (qty) Delta (%) Increase Decrease
Total Sales 27 15 -12 -44.4%
Median Sales Price 2,218,000 1,770,000 (448,000) -20.2%
Median Days to Sell 56 61 5 8.9%
Listings 62 81 19 30.6%
Sales/Listing Ratio 43.5% 18.5% -0.25 -57.5%
Months of Inventory 2.0 5.0 3.0 150.0%
Monthly Comparison Year-to-Year Jan 2015 Jan 2016 Delta Delta Increase Decrease
Total Sales 21 15 -6 -28.6%
Median Sales Price 1,635,000 1,770,000 135,000 8.3%
Median Days to Sell 48 61 13 27.1%
Listings 56 81 25 44.6%
Months of Inventory 3.0 5.0 2 66.7%

Back to Table of Contents
-
2
4
6
8
10
12
14
16
Jan Feb Mar
2016 Total Sales Month-to-Month by Map Area
Manhattan Bch Sand
Manhattan Bch Tree
Manhattan Bch Hill
Manhattan Village
Manhattan Bch Heights/Lib Vlg
Manhattan Bch Mira Costa
Total Sales
Total Sales Month-to-Month by Map Area Jan Feb Mar
Manhattan Bch Sand 1
Manhattan Bch Tree 7
Manhattan Bch Hill -
Manhattan Village 1
Manhattan Bch Heights/Lib Vlg 2
Manhattan Bch Mira Costa 4
Total Sales 15
Back to Table of Contents
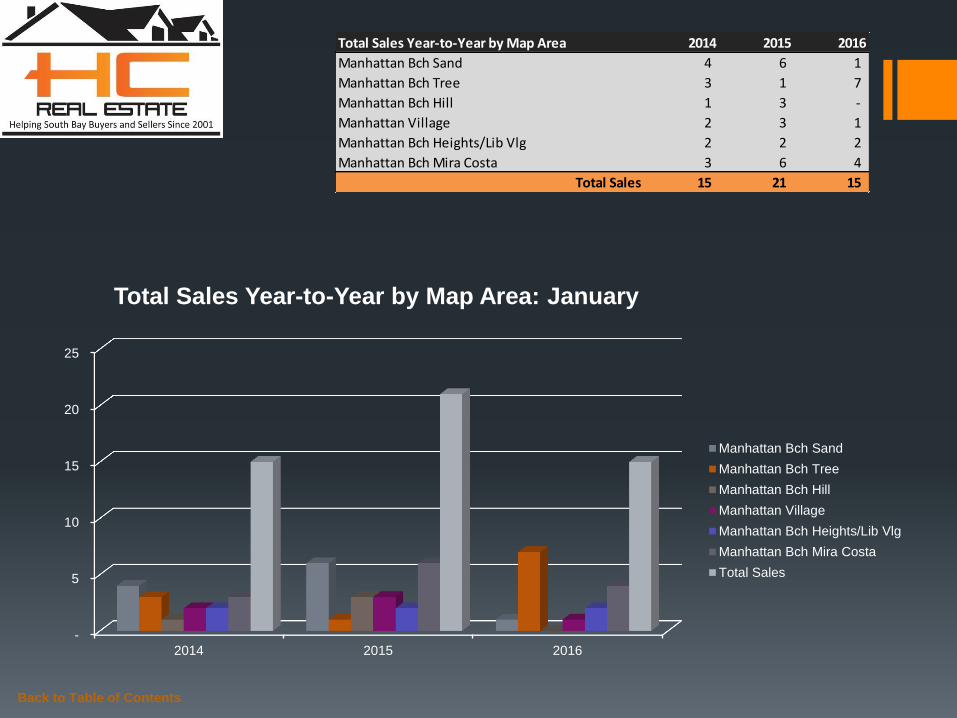
Total Sales Year-to-Year by Map Area 2014 2015 2016
Manhattan Bch Sand 4 6 1
Manhattan Bch Tree 3 1 7
Manhattan Bch Hill 1 3 -
Manhattan Village 2 3 1
Manhattan Bch Heights/Lib Vlg 2 2 2
Manhattan Bch Mira Costa 3 6 4
Total Sales 15 21 15
-
5
10
15
20
25
2014 2015 2016
Total Sales Year-to-Year by Map Area: January
Manhattan Bch Sand
Manhattan Bch Tree
Manhattan Bch Hill
Manhattan Village
Manhattan Bch Heights/Lib Vlg
Manhattan Bch Mira Costa
Total Sales

Back to Table of Contents
Median Sales Price Month-to-Month by Map Area Jan Feb Mar
Manhattan Bch Sand 2,100,000
Manhattan Bch Tree 2,025,000
Manhattan Bch Hill -
Manhattan Village 2,400,000
Manhattan Bch Heights/Lib Vlg 2,130,000
Manhattan Bch Mira Costa 1,352,500
Market Median Sales Price 1,770,000
-
500,000
1,000,000
1,500,000
2,000,000
2,500,000
Jan Feb Mar
2016 Median Sales Price Month-to-Month by Map Area
Manhattan Bch Sand
Manhattan Bch Tree
Manhattan Bch Hill
Manhattan Village
Manhattan Bch Heights/Lib Vlg
Manhattan Bch Mira Costa
Market Median Sales Price
Back to Table of Contents
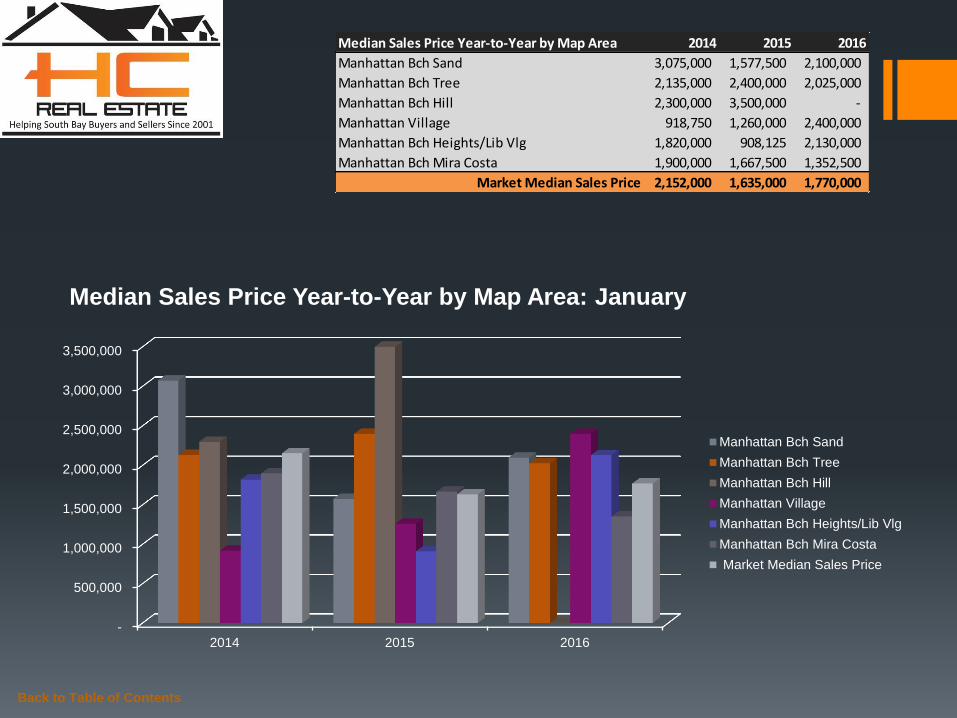
Median Sales Price Year-to-Year by Map Area 2014 2015 2016
Manhattan Bch Sand 3,075,000 1,577,500 2,100,000
Manhattan Bch Tree 2,135,000 2,400,000 2,025,000
Manhattan Bch Hill 2,300,000 3,500,000 -
Manhattan Village 918,750 1,260,000 2,400,000
Manhattan Bch Heights/Lib Vlg 1,820,000 908,125 2,130,000
Manhattan Bch Mira Costa 1,900,000 1,667,500 1,352,500
Market Median Sales Price 2,152,000 1,635,000 1,770,000
-
500,000
1,000,000
1,500,000
2,000,000
2,500,000
3,000,000
3,500,000
2014 2015 2016
Median Sales Price Year-to-Year by Map Area: January
Manhattan Bch Sand
Manhattan Bch Tree
Manhattan Bch Hill
Manhattan Village
Manhattan Bch Heights/Lib Vlg
Manhattan Bch Mira Costa
Market Median Sales Price
Back to Table of Contents
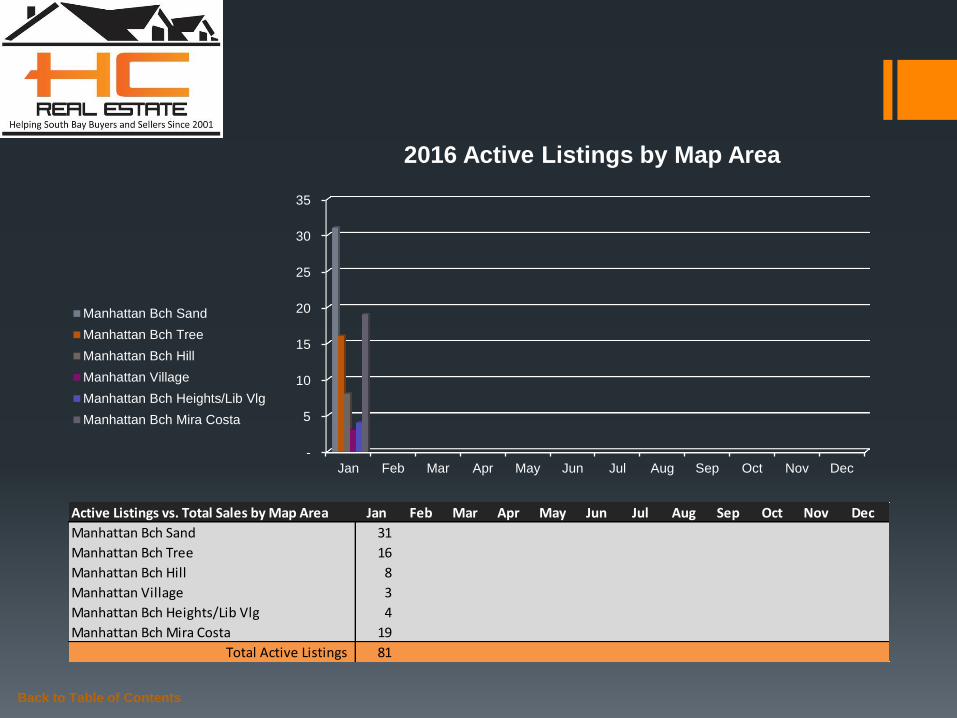
Active Listings vs. Total Sales by Map Area Jan Feb Mar Apr May Jun Jul Aug Sep Oct Nov Dec
Manhattan Bch Sand 31
Manhattan Bch Tree 16
Manhattan Bch Hill 8
Manhattan Village 3
Manhattan Bch Heights/Lib Vlg 4
Manhattan Bch Mira Costa 19
Total Active Listings 81
-
5
10
15
20
25
30
35
Jan Feb Mar Apr May Jun Jul Aug Sep Oct Nov Dec
2016 Active Listings by Map Area
Manhattan Bch Sand
Manhattan Bch Tree
Manhattan Bch Hill
Manhattan Village
Manhattan Bch Heights/Lib Vlg
Manhattan Bch Mira Costa
Back to Table of Contents
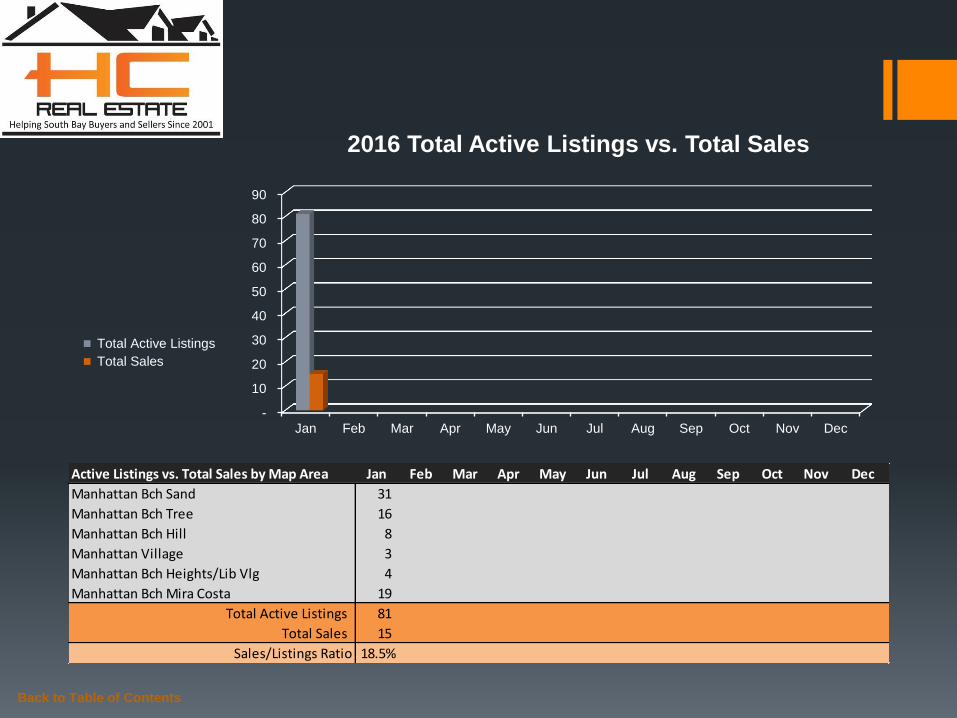
Active Listings vs. Total Sales by Map Area Jan Feb Mar Apr May Jun Jul Aug Sep Oct Nov Dec
Manhattan Bch Sand 31
Manhattan Bch Tree 16
Manhattan Bch Hill 8
Manhattan Village 3
Manhattan Bch Heights/Lib Vlg 4
Manhattan Bch Mira Costa 19
Total Active Listings 81
Total Sales 15
Sales/Listings Ratio 18.5%
-
10
20
30
40
50
60
70
80
90
Jan Feb Mar Apr May Jun Jul Aug Sep Oct Nov Dec
2016 Total Active Listings vs. Total Sales
Total Active Listings
Total Sales
Back to Table of Contents
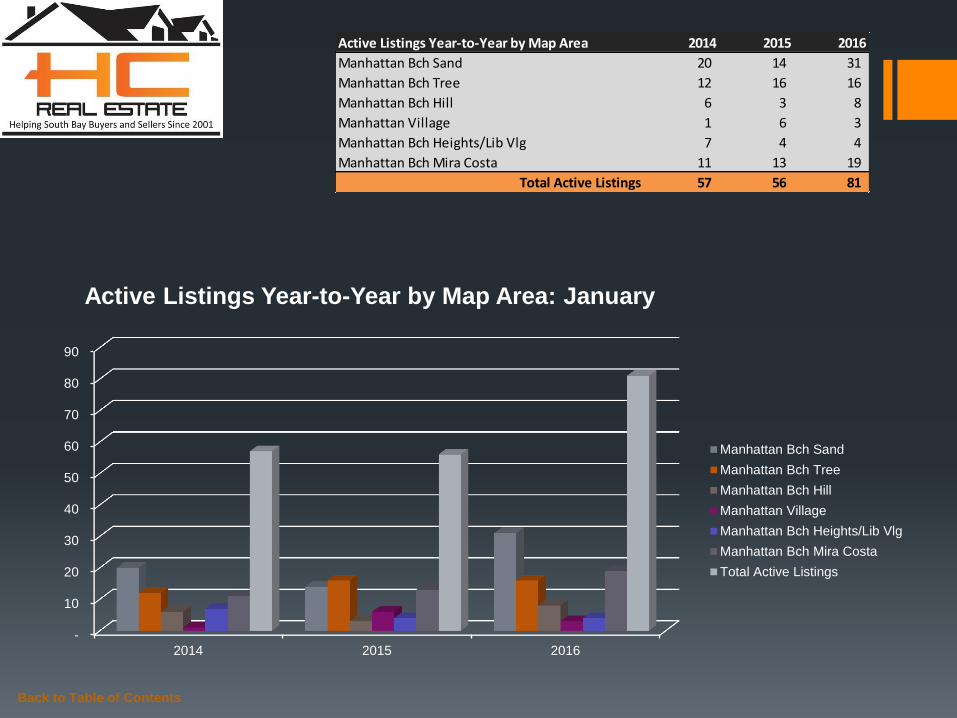
Active Listings Year-to-Year by Map Area 2014 2015 2016
Manhattan Bch Sand 20 14 31
Manhattan Bch Tree 12 16 16
Manhattan Bch Hill 6 3 8
Manhattan Village 1 6 3
Manhattan Bch Heights/Lib Vlg 7 4 4
Manhattan Bch Mira Costa 11 13 19
Total Active Listings 57 56 81
-
10
20
30
40
50
60
70
80
90
2014 2015 2016
Active Listings Year-to-Year by Map Area: January
Manhattan Bch Sand
Manhattan Bch Tree
Manhattan Bch Hill
Manhattan Village
Manhattan Bch Heights/Lib Vlg
Manhattan Bch Mira Costa
Total Active Listings
Back to Table of Contents
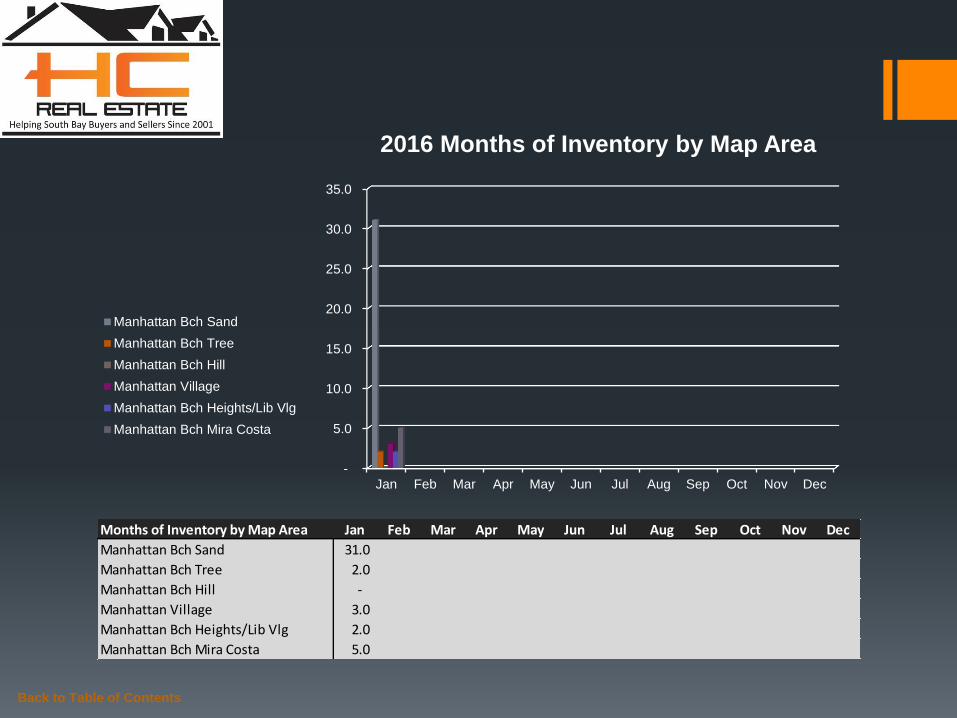
Months of Inventory by Map Area Jan Feb Mar Apr May Jun Jul Aug Sep Oct Nov Dec
Manhattan Bch Sand 31.0
Manhattan Bch Tree 2.0
Manhattan Bch Hill -
Manhattan Village 3.0
Manhattan Bch Heights/Lib Vlg 2.0
Manhattan Bch Mira Costa 5.0
-
5.0
10.0
15.0
20.0
25.0
30.0
35.0
Jan Feb Mar Apr May Jun Jul Aug Sep Oct Nov Dec
2016 Months of Inventory by Map Area
Manhattan Bch Sand
Manhattan Bch Tree
Manhattan Bch Hill
Manhattan Village
Manhattan Bch Heights/Lib Vlg
Manhattan Bch Mira Costa
Back to Table of Contents
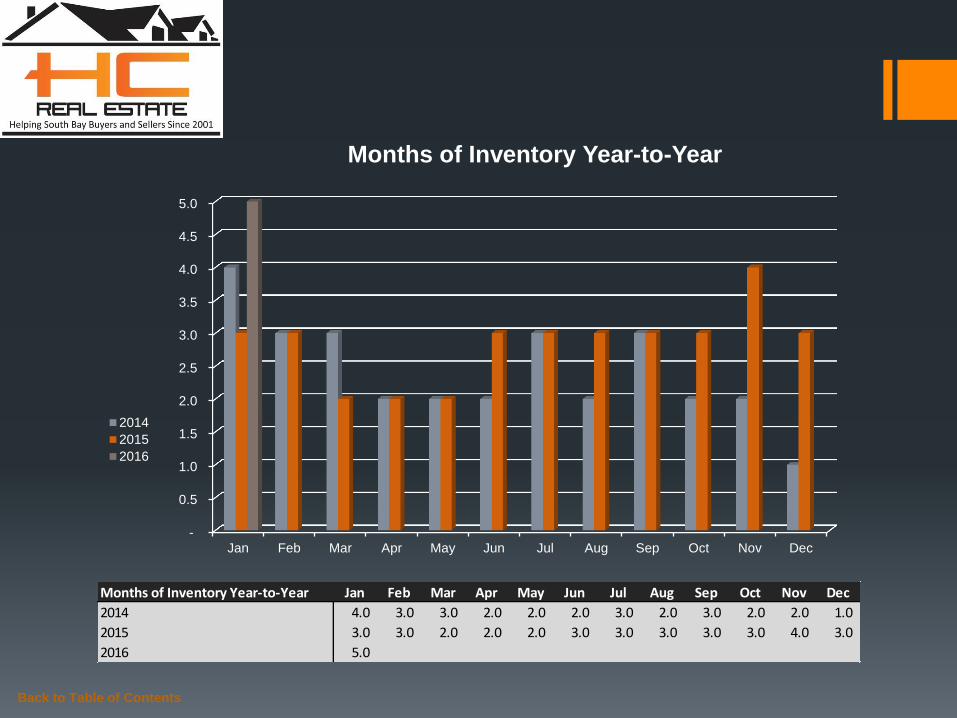
Months of Inventory Year-to-Year Jan Feb Mar Apr May Jun Jul Aug Sep Oct Nov Dec
2014 4.0 3.0 3.0 2.0 2.0 2.0 3.0 2.0 3.0 2.0 2.0 1.0
2015 3.0 3.0 2.0 2.0 2.0 3.0 3.0 3.0 3.0 3.0 4.0 3.0
2016 5.0
-
0.5
1.0
1.5
2.0
2.5
3.0
3.5
4.0
4.5
5.0
Jan Feb Mar Apr May Jun Jul Aug Sep Oct Nov Dec
Months of Inventory Year-to-Year
2014
2015
2016

Summary January was a rough month for Manhattan Beach real estate investing as total sales declined 44.4%, median sales price dropped
$448K, median days to sell bumped 8.9%, and the sales-listing ratio fell 57.5%. Evaluating year-over-year data points revealed the
market median sales price grew $135K and net listings improved 44.6%.
In the news… According to C.A.R., “January’s statewide median home price was $468,330, down 4.3 percent from December
and up 9.2 percent from January 2015.”
http://www.car.org/newsstand/newsreleases/2016releases/january2016sales?view=Standard
For listing or buying guidance, or additional statistics on market trending behavior, please do not hesitate to contact me. - My job
is your future.
Back to Table of Contents
Month-to-Month Comparison Dec 2015 Jan 2016 Delta (qty) Delta (%) Increase Decrease
Total Sales 27 15 -12 -44.4%
Median Sales Price 2,218,000 1,770,000 (448,000) -20.2%
Median Days to Sell 56 61 5 8.9%
Listings 62 81 19 30.6%
Sales/Listing Ratio 43.5% 18.5% -0.25 -57.5%
Months of Inventory 2.0 5.0 3.0 150.0%
Monthly Comparison Year-to-Year Jan 2015 Jan 2016 Delta Delta Increase Decrease
Total Sales 21 15 -6 -28.6%
Median Sales Price 1,635,000 1,770,000 135,000 8.3%
Median Days to Sell 48 61 13 27.1%
Listings 56 81 25 44.6%
Months of Inventory 3.0 5.0 2 66.7%
Serving South Bay Home Buyers and Sellers Since 2001
RE/MAX Top 4 Team in California – 2012
RE/MAX 100% Club - 2011
Shorewood Realtors Top 5% in Overall Sales 2001-2006, 2008-2010
Back to Table of Contents
About
Hady Chahine…

The information being provided by CARETS (CLAW, CRISNet MLS, DAMLS, CRMLS, i-Tech MLS, and/or VCRDS) is for the visitor’s personal, non-commercial use and may not be used for
any purpose other than to identify prospective properties visitor may be interested in purchasing. Any information relating to a property referenced on this web site comes from the Internet
Data Exchange (IDX) program of CARETS. This web site may reference real estate listing(s) held by a brokerage firm other than the broker and/or agent who owns this web site. The accuracy
of all information, regardless of source, including but not limited to square footages and lot sizes, is deemed reliable but not guaranteed and should be personally verified through personal
inspection by and/or with the appropriate professionals.
Back to Table of Contents
Listings MLS BLOG Website
Hady Chahine
• 310-404-5361