Embed Size (px)
Citation preview
A STUDY ON
EFFECT OF WELFARE MEASURES ON EMPLOYEE MORALE
IN JRT ROCK PRODUCTS, CHETTIKULAM
CHALAKKUDY
Project report submitted in partial fulfillment of
the requirements for the award of degree of
B.com Computer Applications
Submitted by
ABIN M.P
(Reg.No:11144501)
Under the guidance of
Asst.Prof. Nithin R
C.E.T College of Management Science &Technology
(Affiliated to Mahatma Gandhi University,Kottayam)
Airapuram, Perumbavoor.
MARCH-2014
C.E.T COLLEGE OF MANAGEMENT SCIENCE AND TECHNOLOGY
AIRAPURAM,PERMBAVOOR ,ERNAKULAM DIST., KERALA
(Affiliated to Mahatma Gandhi University, Kottayam)
CERTIFICATE
This is to certify that the work entitled
A STUDY ON
EFFECT OF WELFARE MEASURES ON EMPLOYEE MORALE
IN JRT ROCK PRODUCTS, CHETTIKULAM
Submitted to Mahatma Gandhi University
in partial fulfillment of the requirements for the award of the degree of
B.COM COMPUTER APPLICATION
is a bonafide record of work done by
ABIN M.P
(Reg. No.11144501 )
NITHIN R (Faculty Guide) CHITHRA (H.O.D)
______________________________
PAUL THOMAS (Principal)
Submitted for the viva – voce examination held on ________________________
DECLARATION
I hereby declare that the Project report entitled EFFECT OF WELFARE MEASURES
ON EMPLOYEE MORALE is a bonafide record work done by me under the
guidance of Asst.Prof. Nithin R and no part of the report has been submitted to any
other university or institution for the award of any degree or diploma.
AIRAPURAM ABIN M.P
ACKNOWLEDGEMENT
I would like to take this opportunity to express my sincere gratitude to all who made
me to complete this project successfully through their timely guidance, help and
support.I wish to express my sincere gratitude to Mr..Paul Thomas (Principal,C.E.T
College of Management Science &Technology,Airapuram) for timely advice and
encouragement. I wish to express my profound thanks to Asst.Prof Nithin R and
Ms.Chithra (Head of the Commerce department) for their valuable instructions,
guidance and support throughout the project work. I am grateful to Mr. Joseph A
Mattam, of JRT ROCK PRODUCTS for permitting me to carry out the study in their
Organization.Above all I am indebted to Almighty God whose blessing have given
me the courage and strength to complete this project.
AIRAPURAM ABIN M.P
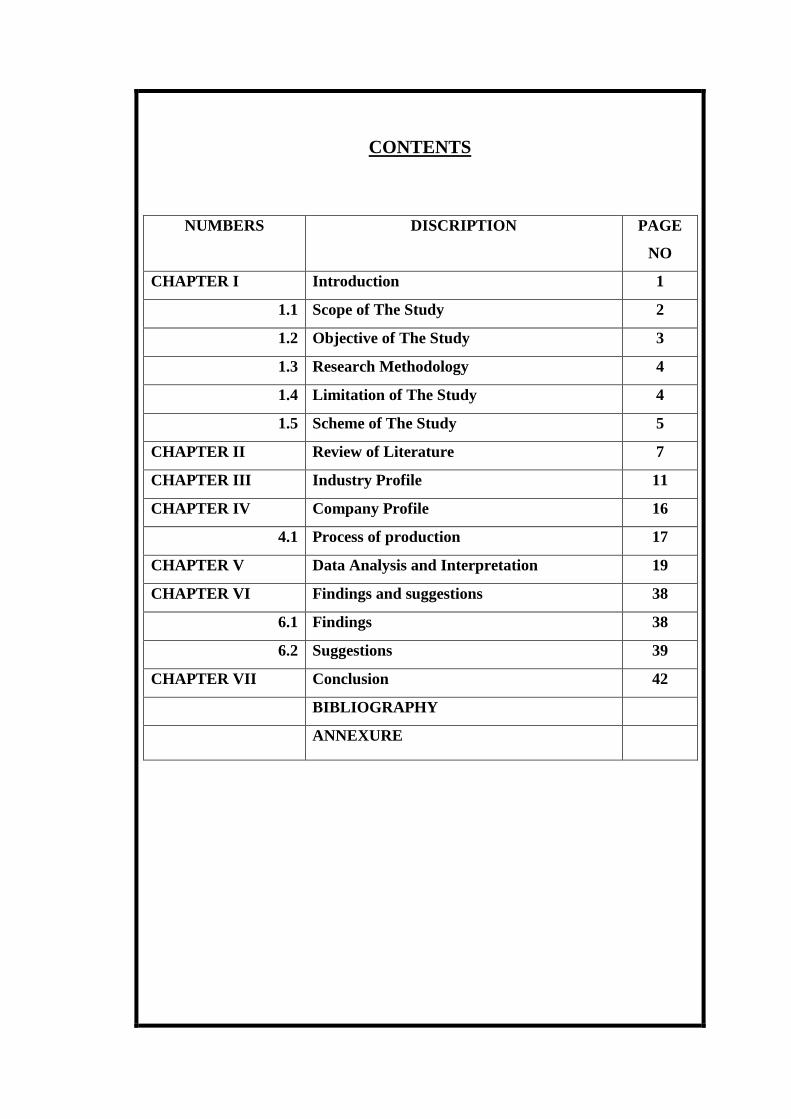
CONTENTS
NUMBERS DISCRIPTION PAGE
NO
CHAPTER I Introduction 1
1.1 Scope of The Study 2
1.2 Objective of The Study 3
1.3 Research Methodology 4
1.4 Limitation of The Study 4
1.5 Scheme of The Study 5
CHAPTER II Review of Literature 7
CHAPTER III Industry Profile 11
CHAPTER IV Company Profile 16
4.1 Process of production 17
CHAPTER V Data Analysis and Interpretation 19
CHAPTER VI Findings and suggestions 38
6.1 Findings 38
6.2 Suggestions 39
CHAPTER VII Conclusion 42
BIBLIOGRAPHY
ANNEXURE
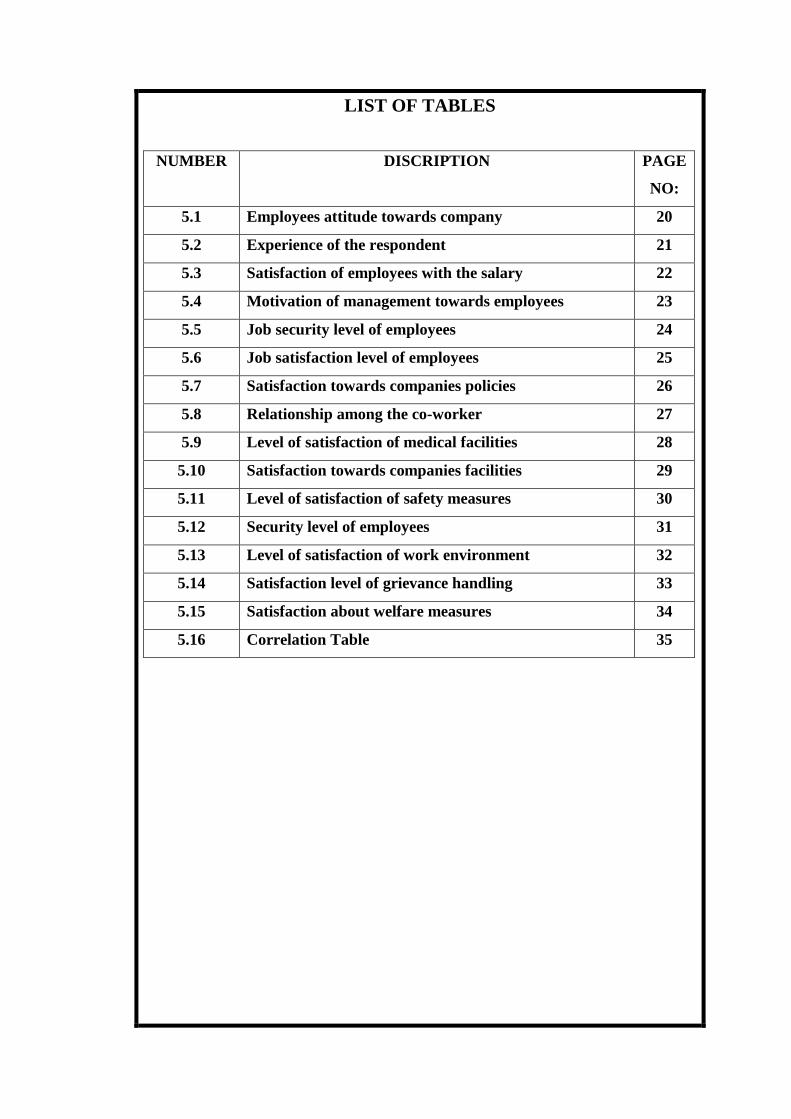
LIST OF TABLES
NUMBER DISCRIPTION PAGE
NO:
5.1 Employees attitude towards company 20
5.2 Experience of the respondent 21
5.3 Satisfaction of employees with the salary 22
5.4 Motivation of management towards employees 23
5.5 Job security level of employees 24
5.6 Job satisfaction level of employees 25
5.7 Satisfaction towards companies policies 26
5.8 Relationship among the co-worker 27
5.9 Level of satisfaction of medical facilities 28
5.10 Satisfaction towards companies facilities 29
5.11 Level of satisfaction of safety measures 30
5.12 Security level of employees 31
5.13 Level of satisfaction of work environment 32
5.14 Satisfaction level of grievance handling 33
5.15 Satisfaction about welfare measures 34
5.16 Correlation Table 35
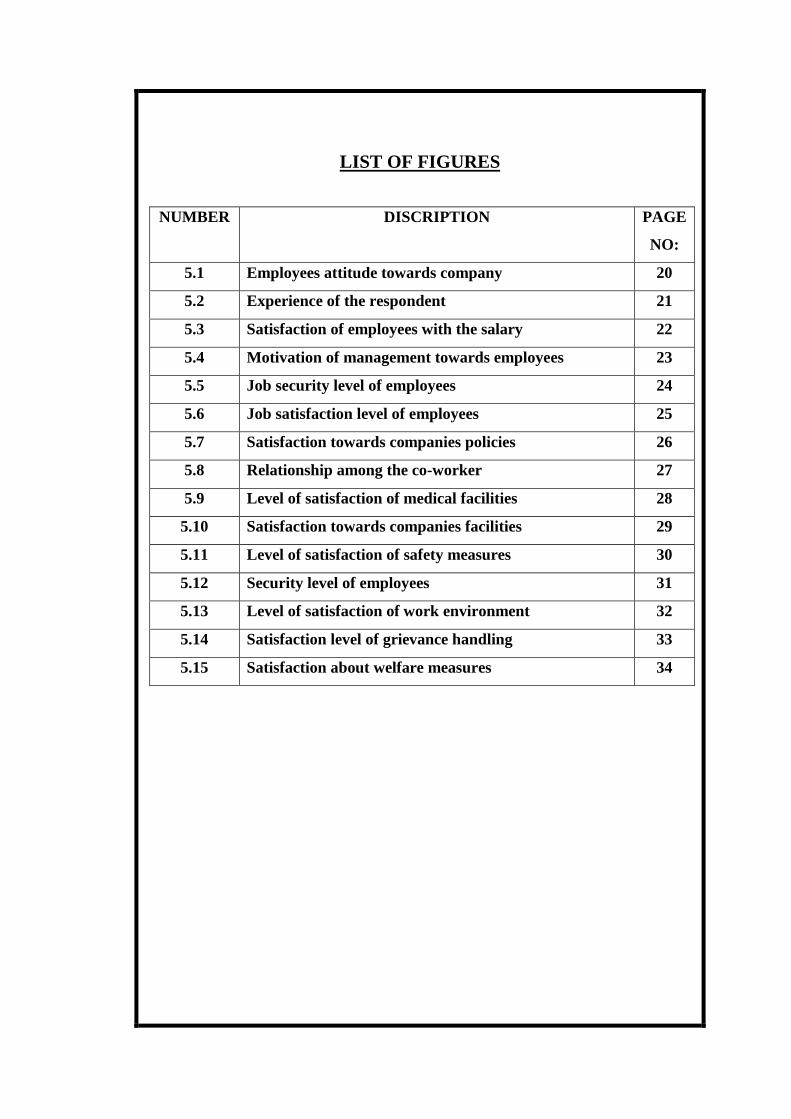
LIST OF FIGURES
NUMBER DISCRIPTION PAGE
NO:
5.1 Employees attitude towards company 20
5.2 Experience of the respondent 21
5.3 Satisfaction of employees with the salary 22
5.4 Motivation of management towards employees 23
5.5 Job security level of employees 24
5.6 Job satisfaction level of employees 25
5.7 Satisfaction towards companies policies 26
5.8 Relationship among the co-worker 27
5.9 Level of satisfaction of medical facilities 28
5.10 Satisfaction towards companies facilities 29
5.11 Level of satisfaction of safety measures 30
5.12 Security level of employees 31
5.13 Level of satisfaction of work environment 32
5.14 Satisfaction level of grievance handling 33
5.15 Satisfaction about welfare measures 34
CHAPTER I
INTRODUCTION
Introduction
Human Resource Management is the process of procuring, developing, maintain and
controlling human resources for effective achievement of organizational goals. This
project is focused on employee welfare measures and employee morale.Employee
welfare means “the effort to make life worth living for workmen”. When all basic
facilities are provided and employees obtain satisfaction then the productivity of the
organization will be possible.
According to Yoder “morale is a feeling, somewhat related to
esprit de corps, enthusiasm or zeal”. Flippo has described morale as “a mental
condition or attitude of individuals and groups which determines their willingness to
co-operate”. Good morale is evidenced by employee enthusiasm, voluntary
conformance with regulations and orders and willingness to co-operate with others in
the accomplishment of an organization’s objectives. The study intends to see the
satisfaction level of the employee on the facilities provided by the company and how
these welfare measures boost the employee morale. The study on effect of welfare
measure on employee morale gives the management an indication of the level of
satisfaction among the employees regarding the general working condition and the
other facilities provided by the organization. This helps the management to know the
general morale of the employees. This project aims at studying and analyzing the
safety and welfare measures of the employee.
1.1 Scope of the study
The welfare measure is “an effort to make life worth living for workmen”. It
motivates employees to a great extent which leads to organizational growth. It is a
major factor which affects the employee morale.The study on effect of welfare
measures on employee morale in JRT ROCK PRODUCTS LTD., CHETTIKULAM
was done to evaluate the level of satisfaction of employees about welfare measures
and its effects on employee morale.The main objective of the study is to measure the
effects of welfare measures on morale, level of satisfaction of employees regarding
Working condition and general attitude of employee towards the organization.
1.2 Objectives of the study
This project aims at studying and analyzing the safety and welfare measures of the
employees. The project objective is to evaluate the effect of the welfare measures on
employee morale and satisfaction level of employee about the work environment.
To study and analyze the safety and welfare measures of the employee.
To evaluate the effects of the welfare measures on employee morale.
To evaluate the satisfactory level of employee about the work environment.
To find the level of satisfaction of employees about the facilities given by the
company.
The study intends to see the satisfaction level of the employees on the facilities
provided by the company and how these welfare measures boost the employee
morale.
To identify the requirements of each employee with respect to their personal
interest and goals.
1.3 Research Methodology
Simple random sampling method is used in the present study. Nearly 40 samples were
collected. A questionnaire of 30 questions was prepared and data were collected from
the employees of JRT ROCK PRODUCTS LTD., CHETTIKULAM.Appropriate
statistical tool such as Correlation Coefficient and Percentage method, Bar Charts, Pie
Charts etc were used to analyze the data.
1.4 Limitation of the study
• Only 40 persons from the total are taken for the study.
• Availability of the time is limited.
• Travelling is difficult.
• Semi literate and illiterate employees.
• Non availability of accurate data.
1.5 Scheme of the study
This is a descriptive research study. The study contains 7 Chapters. First chapter
contain Introduction, Scope and Objective of the study, Research Methodology and
Limitation of the study. Second chapter includes Review of literature, Third chapter
include Industrial profile and Fourth Chapter include Company profile.Fifth section
consists of Data Analysis and Sixth and Seventh chapter contains Findings, Solution
and Conclusion respectively. The last section includes Bibliography and Appendix.
CHAPTER II
REVIEW OF LITERATURE
Review of literature
A review of literature is the summary and critical evaluation of previous
published or unpublished researches done by various scholars and researches. The
sources of review of literature may be newspapers, articles, journals, books etc…also
include discussions of future research. It must be clear, accurate, simple and easily
understandable. It should be used and able for review of study.
Robert. M .Guano, a famous researcher approached morale in a classifiable
way. According to him morale is the extent to which the individual perceives that
satisfaction stemming from total job satisfaction.But Juries Fillipo approached in
psychological way. Morale according to him is a mental condition or attitude of
individual and groups which determine their willingness to cooperate.
For Davis, morale is the attitude of individual and groups
towards their work environment and towards voluntary cooperation to the full extent
of their ability in the best interest at the organization.Employee Morale refers to an
attitude of satisfaction with a desire to continue and strive for attaining the objectives
of a factory. Morale is purely emotional. It is an attitude of an employee towards his
job, his superior and his organization. This is given by Nag raja V Billava.
McFarland identified certain factors affecting morale. They are:
• The attitude of the executives and managers towards their subordinates.
• Working conditions including pay, hours of work and safety rules.
• Effective leadership and an intelligent distribution of authority and
responsibility in the organization.
• The design of the organization’s structure which facilitates the flow of work.
• The size of the organization.
Vroom found that Employee Morale plays a vital role in the organizations success.
High morale leads to success and low morale brings to defeat in its wake. The play of
morale is not less important to an industrial undertaking. The success or failure of the
industry much depends up on the morale of its employees.Lyman Porter says that
morale is a fundamental psychological concept. It is not easy to define. Morale is the
degree of Enthusiasm and willingness with which the members of a group pull
together to achieve group goal.Lawler said that High morale is represented by the use
of such term spirit, zest, enthusiasm, loyalty, dependability and resistance to
frustration. Low morale, on the other hand, is described by such words and phrases as
apathy, bickering, jealousy, pessimism, fighting and disloyalty to the organization,
disobedience of the orders of the leaders, dislike of or lack of interest in one’s job and
laziness.
CHAPTER III
INDUSTRY PROFILE
Industry Profile
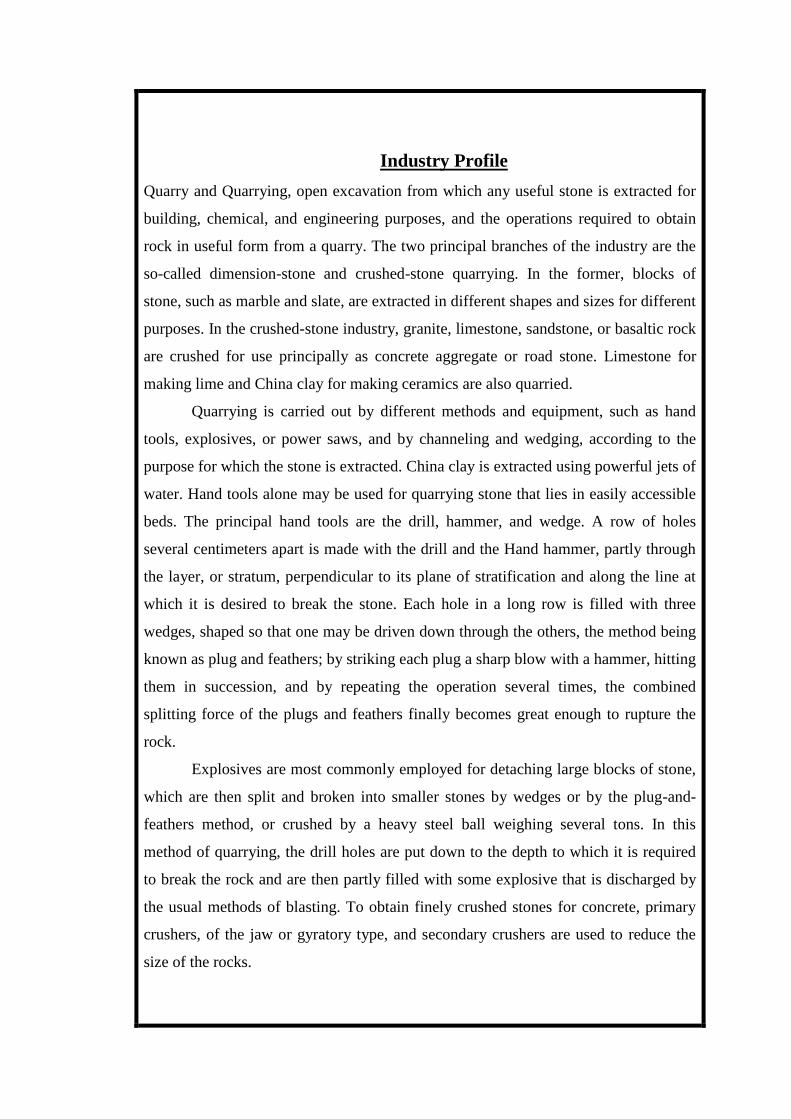
Quarry and Quarrying, open excavation from which any useful stone is extracted for
building, chemical, and engineering purposes, and the operations required to obtain
rock in useful form from a quarry. The two principal branches of the industry are the
so-called dimension-stone and crushed-stone quarrying. In the former, blocks of
stone, such as marble and slate, are extracted in different shapes and sizes for different
purposes. In the crushed-stone industry, granite, limestone, sandstone, or basaltic rock
are crushed for use principally as concrete aggregate or road stone. Limestone for
making lime and China clay for making ceramics are also quarried.
Quarrying is carried out by different methods and equipment, such as hand
tools, explosives, or power saws, and by channeling and wedging, according to the
purpose for which the stone is extracted. China clay is extracted using powerful jets of
water. Hand tools alone may be used for quarrying stone that lies in easily accessible
beds. The principal hand tools are the drill, hammer, and wedge. A row of holes
several centimeters apart is made with the drill and the Hand hammer, partly through
the layer, or stratum, perpendicular to its plane of stratification and along the line at
which it is desired to break the stone. Each hole in a long row is filled with three
wedges, shaped so that one may be driven down through the others, the method being
known as plug and feathers; by striking each plug a sharp blow with a hammer, hitting
them in succession, and by repeating the operation several times, the combined
splitting force of the plugs and feathers finally becomes great enough to rupture the
rock.
Explosives are most commonly employed for detaching large blocks of stone,
which are then split and broken into smaller stones by wedges or by the plug-and-
feathers method, or crushed by a heavy steel ball weighing several tons. In this
method of quarrying, the drill holes are put down to the depth to which it is required
to break the rock and are then partly filled with some explosive that is discharged by
the usual methods of blasting. To obtain finely crushed stones for concrete, primary
crushers, of the jaw or gyratory type, and secondary crushers are used to reduce the
size of the rocks.
Channeling is the process of cutting long, narrow channels in rock to free the sides of
large blocks of stone. Channeling machines, or channellers, formerly steam driven;
have now been generally replaced by petrol engines or electric motors. These are self-
Propelling and move a cutting edge back and forth along the line on a rock bed on
which the channel cut is to be made. The channel cut is sunk deep enough to permit
the insertion of wedges by which the rock is split, cut or groove guiding the fracture.
The channeling and wedging process of quarrying is extensively used in quarrying
marble, sandstone, limestone, and other softer rocks, but is not successful for granite
and other hard rocks.Another method of cutting is by the combination of a power saw,
an abrasive, and water as a lubricant and a coolant. The saw cuts a narrow channel,
the primary or initial cut, which is then either expanded by a wedge or blasted. This
method is used in slate, granite, and limestone quarries.
An automatic channel burner has recently come into commercial
use in dimension-stone quarrying. It resembles a handheld burner held vertically in a
frame, with an electric motor moving the whole unit slowly down a track. It makes a
more even cut, does not require the presence of an operator, and wastes less rock. The
unit is controlled by a computer. In Kerala nearly 400 units of Quarry are there. Rock
products are always essential for different purposes like Building construction, Road
construction etc. So the demand for the Rock Crushing Units is increasing.
CHAPTER IV
COMPANY PROFILE
Company Profile
JRT Rock Products ltd is a Rock crushing unit which spread over 40.5 acres in
Chettikulam, (Thrissur). Late Mr. AVIRACHAN MATTAM, the founder of JRT
established this company on 10th
February 1993. JOSEPH.A.MATTAM,
ROSE MOL BABY MATTAM AND TESSY SEBASTIAN MATTAM is the
Board of Directors of this crushing unit.
They are producing different types of rock products namely
40mm (millimeter), 20mm, 12mm, 6mm, Rock powder and Machine sand. These rock
products are used for different purposes.40mm type of rock product is mainly used for
Road and Railway works. 20mm type of rock is used for Building constructions,
General concreting etc.12mm type of rock is also used for road construction. 6mm
type is used for road work as well as to make Hollow bricks. Now a day’s Rock
powders, Machine sand is used for Building constructions, to make hollow bricks and
So on. Their yearly profit is nearly 20-25 lakhs. They are distributing their products
within Kerala. They have nearly 120 workers (male and female) posted in different
categories. Canteen facilities, Accommodation for the workers and other facilities are
provided to their employees.
4.1 Process of Production
The production process starts with the cleaning of Quarry. Then the workers will
make small holes in the rocks using Tata Hitachi Excavator. Then they break the
rocks using crackers or Tata Hitachi Rock Breaker. The breaked rocks will loaded in
to the tippers using Tata Hitachi Loader. After that the rocks will be dumped into the
Primary Crusher Machine. This machine will crush the rocks in to 15 inches and
then it will automatically move to the Secondary Crusher Machines. Here the
machine will crush the rocks in to 7 inches. Then the rocks will move to the Metal
and Power Converter. Here the rocks will be screened and converted into different
category such as 40mm, 20mm, 12mm, 6mm, rock powder and machine sand and it
will automatically stored in the respective tanks.
CHAPTER V
DATA ANALYSIS AND INTERPRETATION
Data Analysis and Interpretation
Analysis of data is the most skilled task in the research process. Analysis of data
means studying the tabulated material in order to determine inherent facts or
meanings. In other words the analysis means the computation of certain indices or
measure or coefficients along with searching for pattern of relationships that exist
among data groups.
Analysis of data is a process of inspecting, cleaning, transforming, and
modeling data with the goal of highlighting useful information, suggesting
conclusions, and supporting decision making. Data analysis has multiple facets and
approaches, encompassing diverse techniques under a variety of names, in different
business, science, and social science domains.
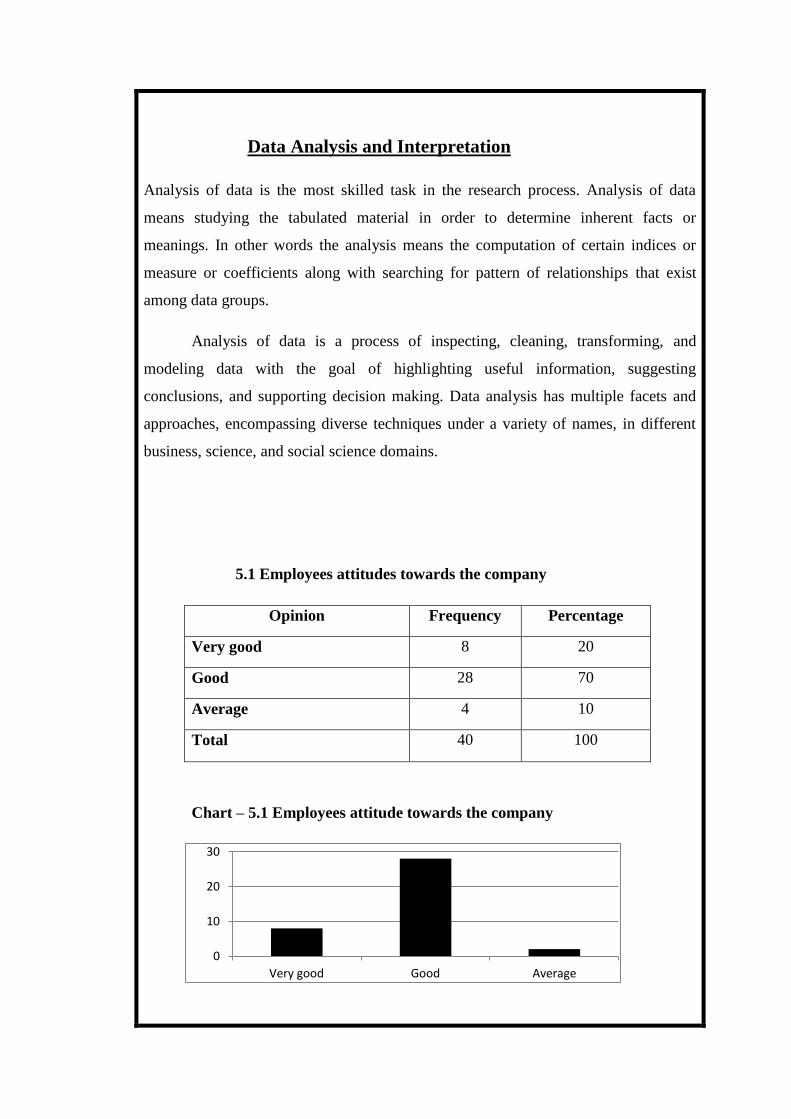
5.1 Employees attitudes towards the company
Opinion Frequency Percentage
Very good 8 20
Good 28 70
Average 4 10
Total 40 100
Chart – 5.1 Employees attitude towards the company
0
10
20
30
Very good Good Average
Interpretation: From the above table it is clear that 70% of employees rated
the company as good. Only 10% opinioned as average.
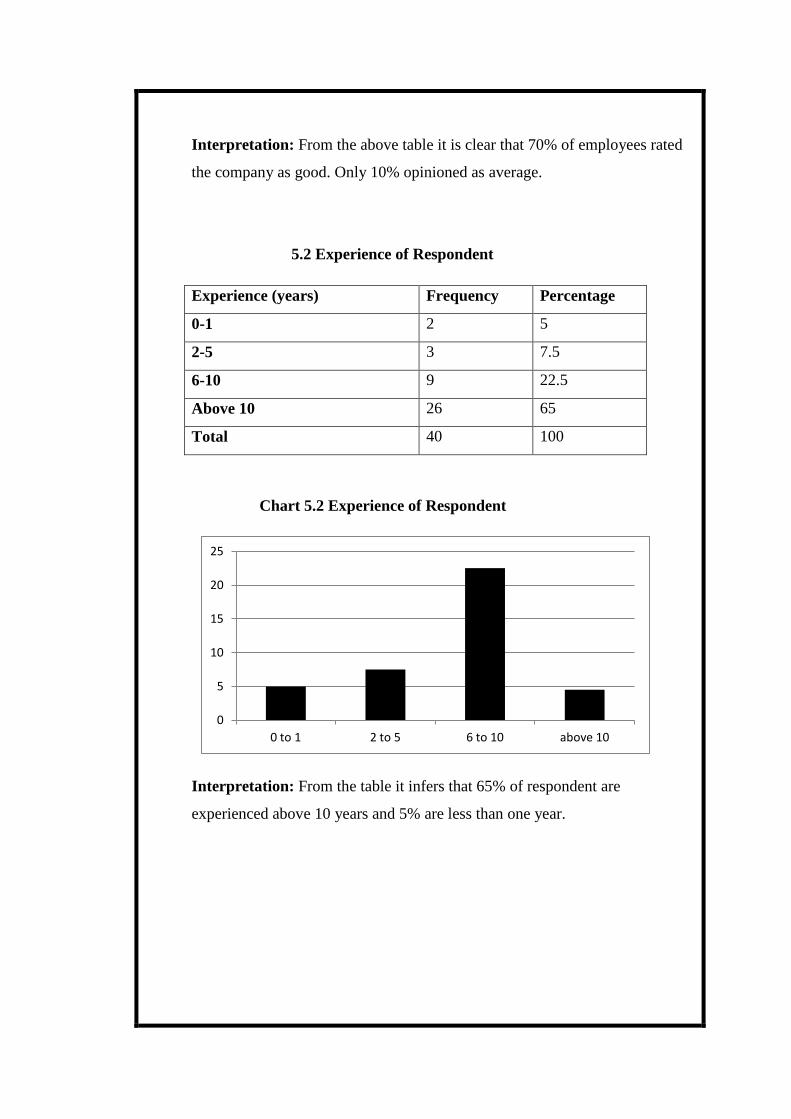
5.2 Experience of Respondent
Experience (years) Frequency Percentage
0-1 2 5
2-5 3 7.5
6-10 9 22.5
Above 10 26 65
Total 40 100
Chart 5.2 Experience of Respondent
Interpretation: From the table it infers that 65% of respondent are
experienced above 10 years and 5% are less than one year.
0
5
10
15
20
25
0 to 1 2 to 5 6 to 10 above 10
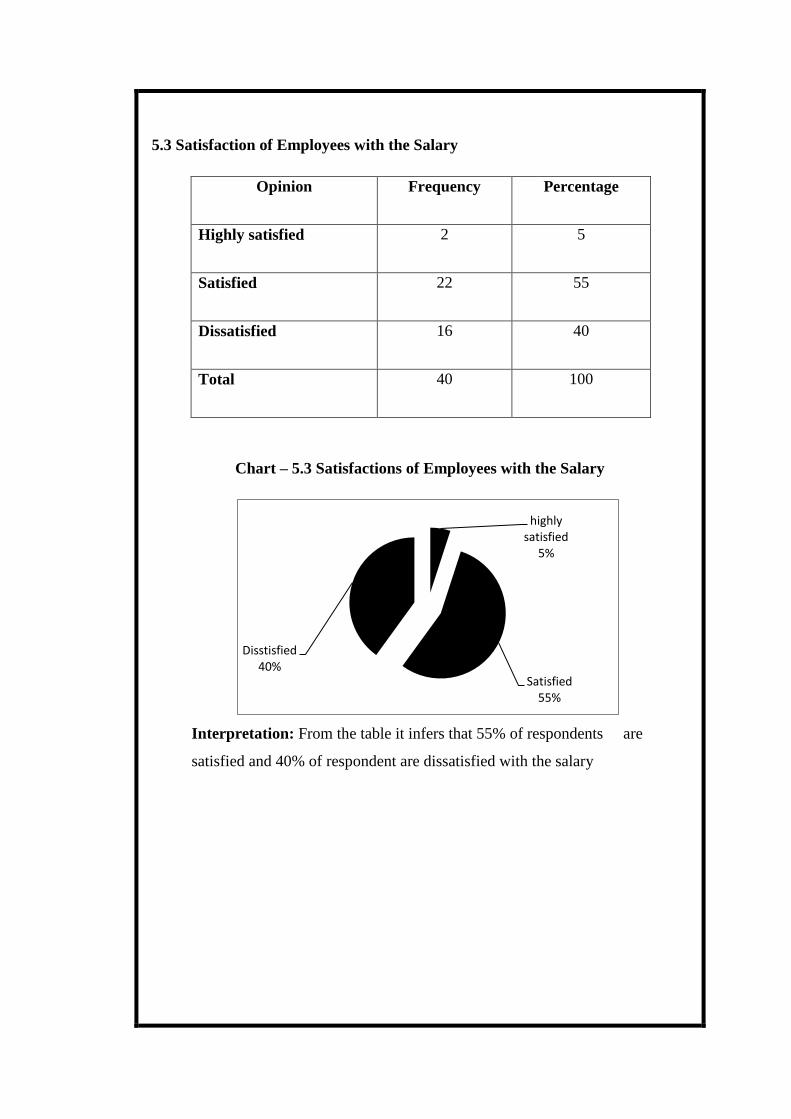
5.3 Satisfaction of Employees with the Salary
Opinion Frequency Percentage
Highly satisfied 2 5
Satisfied 22 55
Dissatisfied 16 40
Total 40 100
Chart – 5.3 Satisfactions of Employees with the Salary
Interpretation: From the table it infers that 55% of respondents are
satisfied and 40% of respondent are dissatisfied with the salary
highly satisfied
5%
Satisfied 55%
Disstisfied 40%
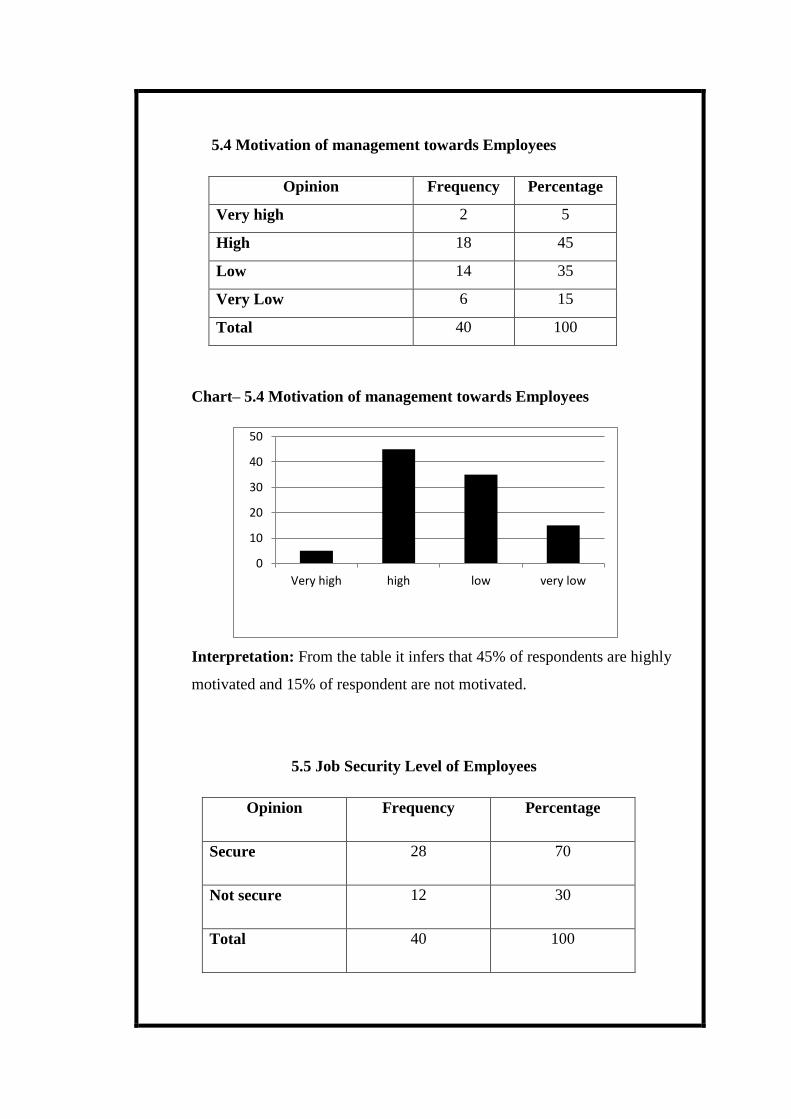
5.4 Motivation of management towards Employees
Opinion Frequency Percentage
Very high 2 5
High 18 45
Low 14 35
Very Low 6 15
Total 40 100
Chart– 5.4 Motivation of management towards Employees
Interpretation: From the table it infers that 45% of respondents are highly
motivated and 15% of respondent are not motivated.
5.5 Job Security Level of Employees
Opinion Frequency Percentage
Secure 28 70
Not secure 12 30
Total 40 100
0
10
20
30
40
50
Very high high low very low
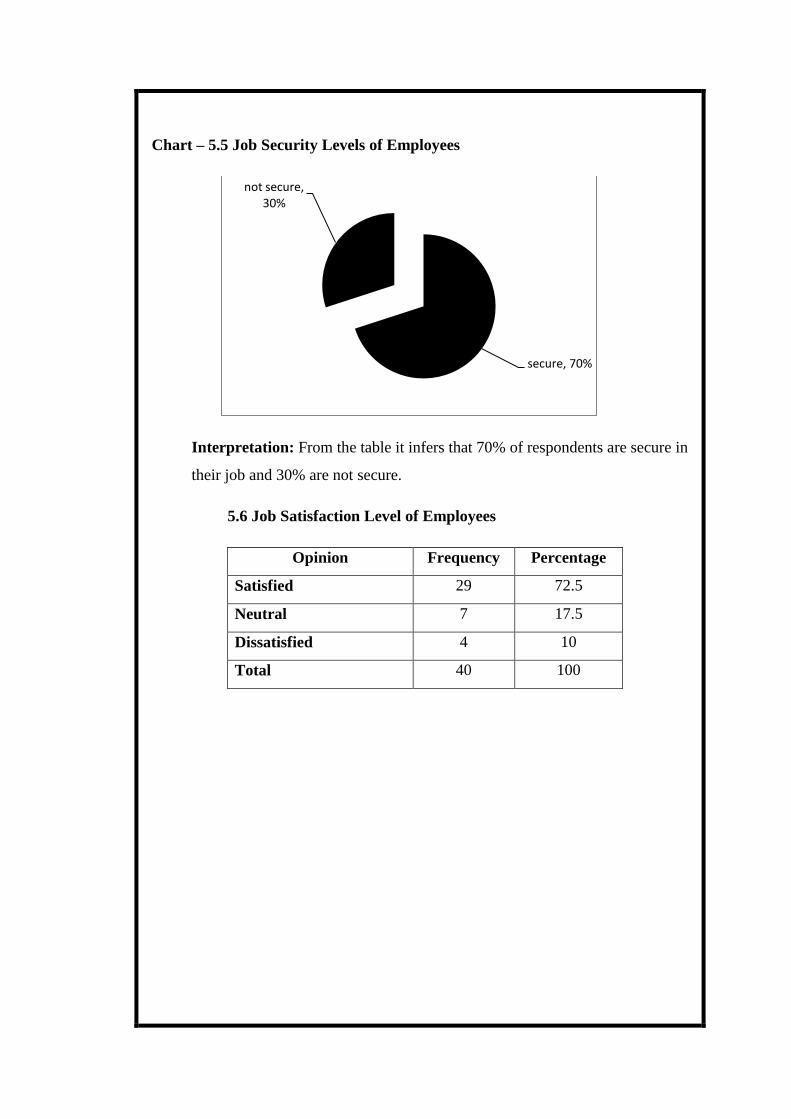
Chart – 5.5 Job Security Levels of Employees
Interpretation: From the table it infers that 70% of respondents are secure in
their job and 30% are not secure.
5.6 Job Satisfaction Level of Employees
Opinion Frequency Percentage
Satisfied 29 72.5
Neutral 7 17.5
Dissatisfied 4 10
Total 40 100
secure, 70%
not secure, 30%
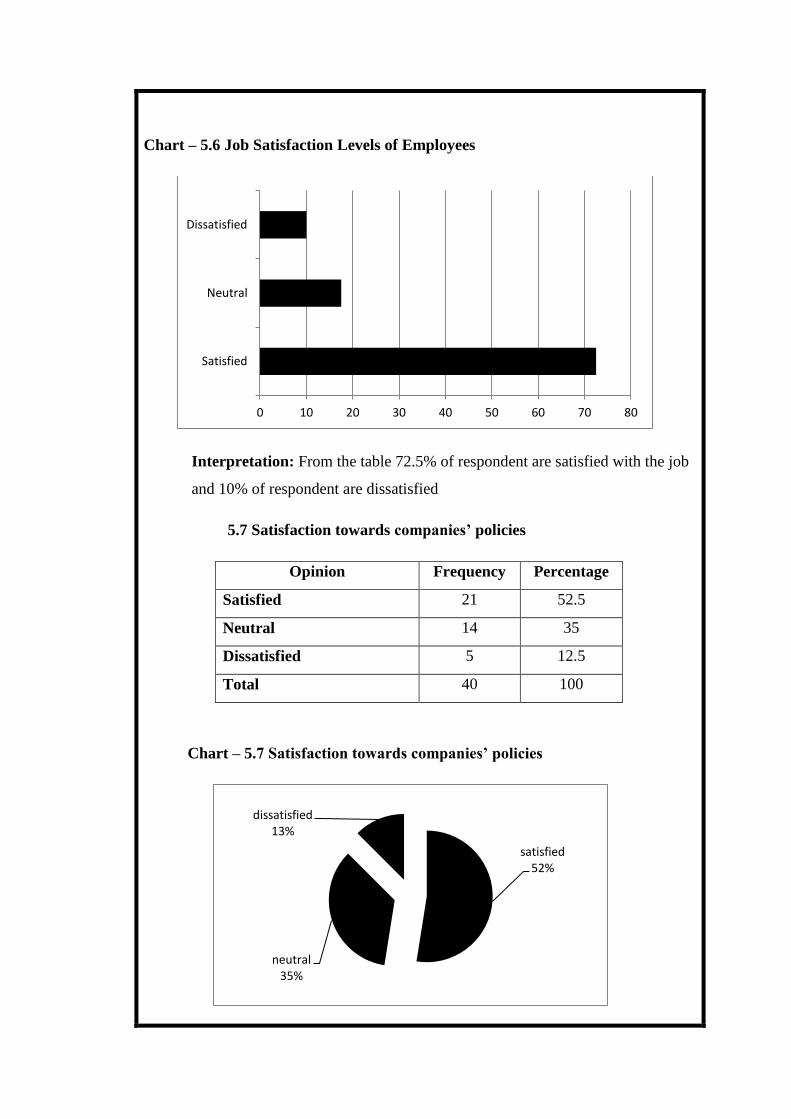
Chart – 5.6 Job Satisfaction Levels of Employees
Interpretation: From the table 72.5% of respondent are satisfied with the job
and 10% of respondent are dissatisfied
5.7 Satisfaction towards companies’ policies
Opinion Frequency Percentage
Satisfied 21 52.5
Neutral 14 35
Dissatisfied 5 12.5
Total 40 100
Chart – 5.7 Satisfaction towards companies’ policies
0 10 20 30 40 50 60 70 80
Satisfied
Neutral
Dissatisfied
satisfied 52%
neutral 35%
dissatisfied 13%
Interpretation: From the table, 52.5% of respondents are satisfied and 12.5%
of respondents are dissatisfied with the companies’ policy.
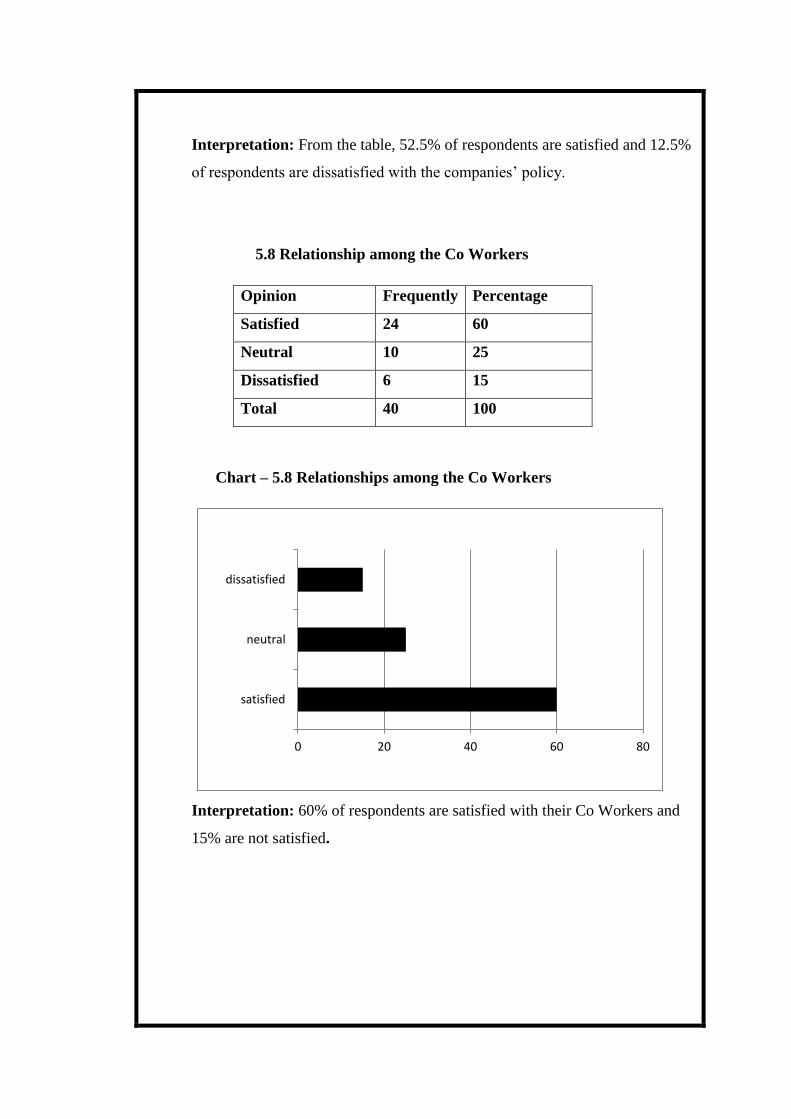
5.8 Relationship among the Co Workers
Opinion Frequently Percentage
Satisfied 24 60
Neutral 10 25
Dissatisfied 6 15
Total 40 100
Chart – 5.8 Relationships among the Co Workers
Interpretation: 60% of respondents are satisfied with their Co Workers and
15% are not satisfied.
0 20 40 60 80
satisfied
neutral
dissatisfied

5.9 Level of Satisfaction of Medical Facilities
Opinion Frequency Percentage
Highly satisfied 9 22.5
Satisfied 26 65
Neutral 3 7.5
Dissatisfied 2 5
Total 40 100
Chart – 5.9 Level of Satisfaction of Medical Facilities
Interpretation: 65% of respondents are satisfied with the Medical Facilities
provided by the company and 55% are dissatisfied.
5.10 Satisfaction towards Company Facilities
Opinion Frequently Percentage
Highly Satisfied 1 2.5
Satisfied 20 50
Neutral 7 17.5
Dissatisfied 12 30
Total 40 100
0 10 20 30 40 50 60 70
Highly satisfied
satisfied
neutral
dissatisfied

Chart – 5.10 Satisfactions towards Company Facilities
Interpretation: About 50% of respondents are satisfied with the Facilities
provided by the company and 30% are dissatisfied.
5.11 Level of satisfaction of Safety Measures
Opinion Frequency Percentage
Highly satisfied 1 2.5
Satisfied 22 55
Neutral 11 27.5
Dissatisfied 6 15
Total 40 100
Highly satisfied
2%
satisfied 50%
neutral 18%
dissatisfied 30%
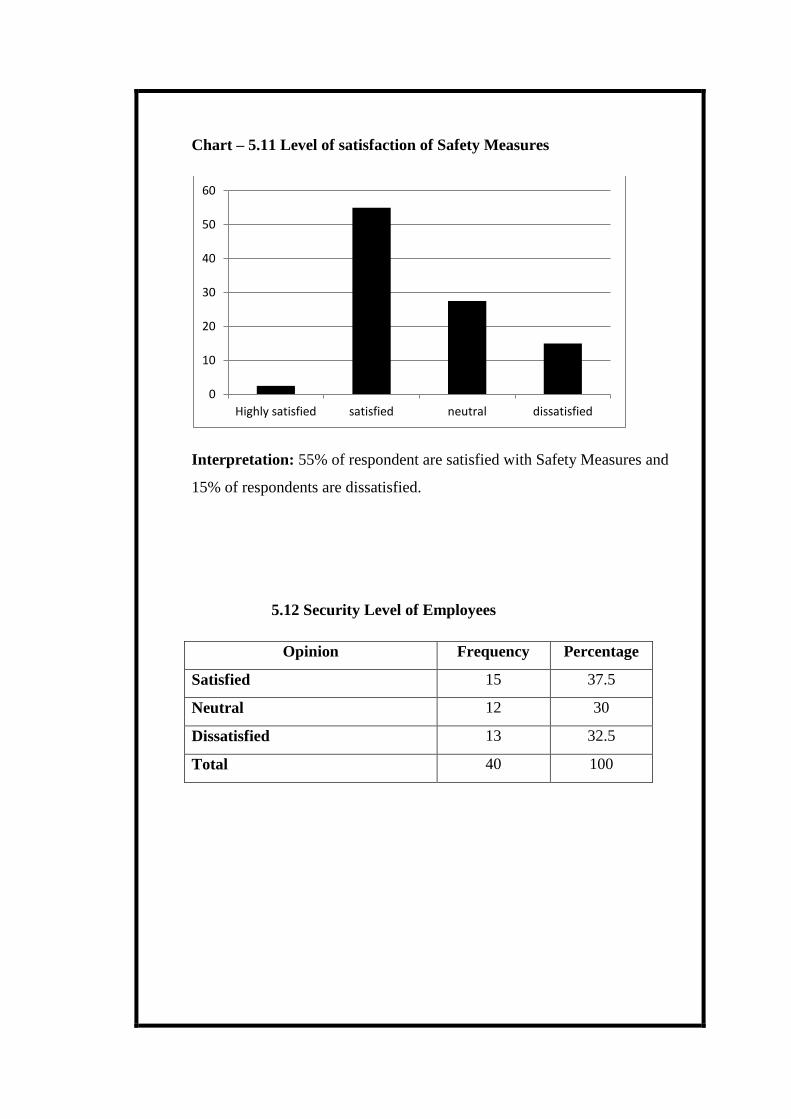
Chart – 5.11 Level of satisfaction of Safety Measures
Interpretation: 55% of respondent are satisfied with Safety Measures and
15% of respondents are dissatisfied.
5.12 Security Level of Employees
Opinion Frequency Percentage
Satisfied 15 37.5
Neutral 12 30
Dissatisfied 13 32.5
Total 40 100
Highly satisfied satisfied neutral dissatisfied
0
10
20
30
40
50
60
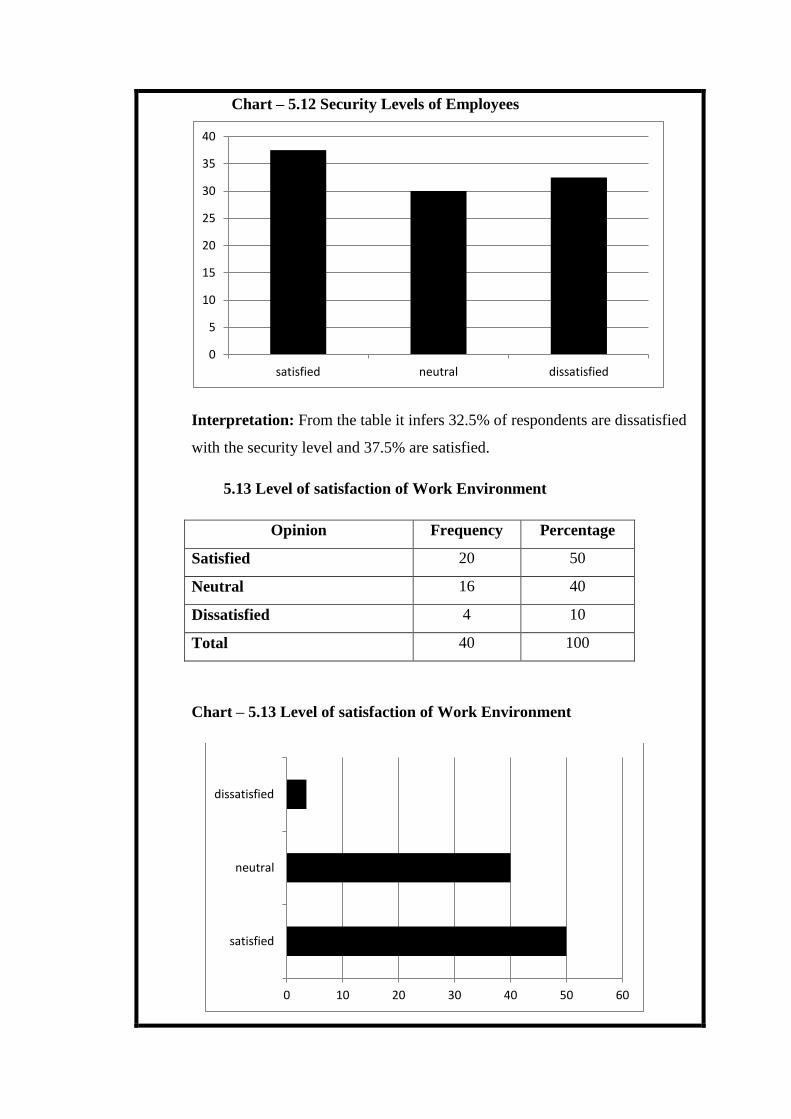
Chart – 5.12 Security Levels of Employees
Interpretation: From the table it infers 32.5% of respondents are dissatisfied
with the security level and 37.5% are satisfied.
5.13 Level of satisfaction of Work Environment
Opinion Frequency Percentage
Satisfied 20 50
Neutral 16 40
Dissatisfied 4 10
Total 40 100
Chart – 5.13 Level of satisfaction of Work Environment
0
5
10
15
20
25
30
35
40
satisfied neutral dissatisfied
0 10 20 30 40 50 60
satisfied
neutral
dissatisfied
Interpretation: About 50% of respondents are satisfied with the work
environment and 10% of respondents are dissatisfied.
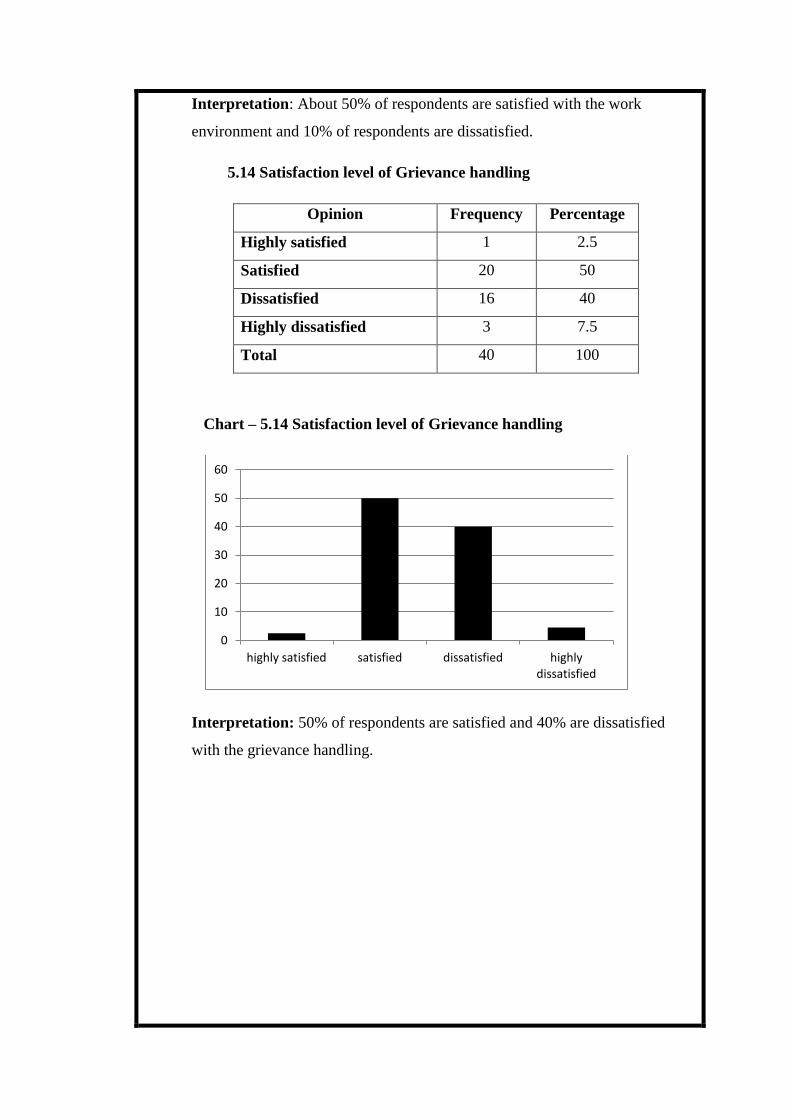
5.14 Satisfaction level of Grievance handling
Opinion Frequency Percentage
Highly satisfied 1 2.5
Satisfied 20 50
Dissatisfied 16 40
Highly dissatisfied 3 7.5
Total 40 100
Chart – 5.14 Satisfaction level of Grievance handling
Interpretation: 50% of respondents are satisfied and 40% are dissatisfied
with the grievance handling.
0
10
20
30
40
50
60
highly satisfied satisfied dissatisfied highly dissatisfied
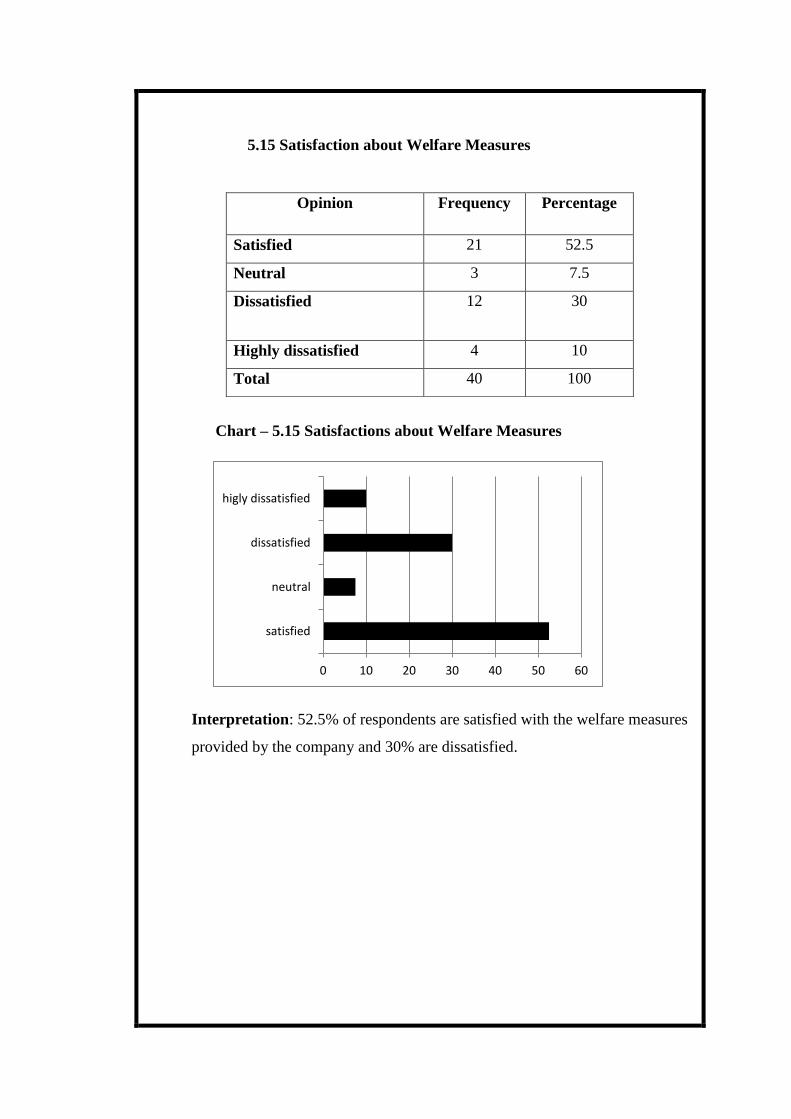
5.15 Satisfaction about Welfare Measures
Chart – 5.15 Satisfactions about Welfare Measures
Interpretation: 52.5% of respondents are satisfied with the welfare measures
provided by the company and 30% are dissatisfied.
0 10 20 30 40 50 60
satisfied
neutral
dissatisfied
higly dissatisfied
Opinion Frequency Percentage
Satisfied 21 52.5
Neutral 3 7.5
Dissatisfied 12 30
Highly dissatisfied 4 10
Total 40 100
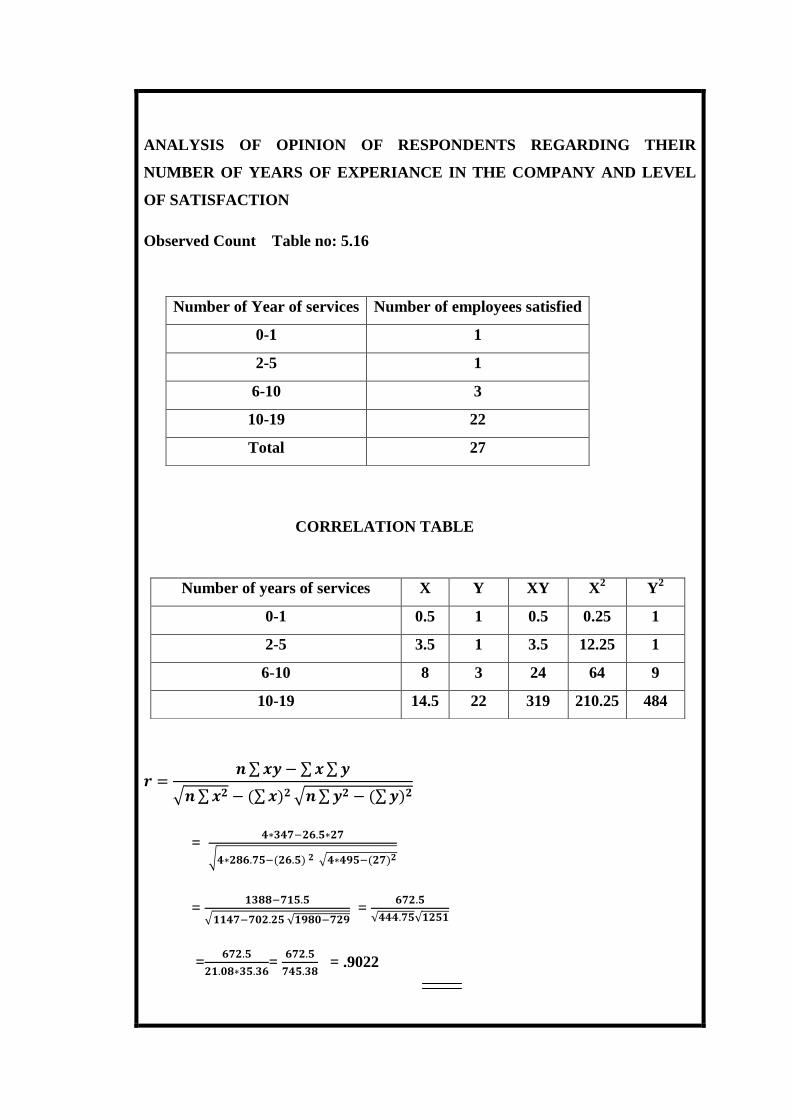
ANALYSIS OF OPINION OF RESPONDENTS REGARDING THEIR
NUMBER OF YEARS OF EXPERIANCE IN THE COMPANY AND LEVEL
OF SATISFACTION
Observed Count Table no: 5.16
CORRELATION TABLE
=
=
=
=
=
= .9022
Number of Year of services Number of employees satisfied
0-1 1
2-5 1
6-10 3
10-19 22
Total 27
Number of years of services X Y XY X2
Y2
0-1 0.5 1 0.5 0.25 1
2-5 3.5 1 3.5 12.25 1
6-10 8 3 24 64 9
10-19 14.5 22 319 210.25 484
Inference: The level of satisfaction is increasing when the number of years of
service increased.
CHAPTER VI
FINDINGS AND SUGGESTIONS
Findings and Suggestions
6.1Findings
It is inferred as most of the employees are working more than 5 years. Almost the
employees are highly satisfied with the medical facilities. Few of the respondents are
dissatisfied with the safety measures and most of them are satisfied.Most of the
employees are satisfied with the working conditions provided by the company. The
respondents are mostly satisfied with the motivation given by the company and also
satisfied with the relation between supervisor and workers. Only few of the
employees are dissatisfied with the relationship between co-workers.
Welfare measures implemented by the company have
impressed most of the employees. Much of the respondents are satisfied with the
canteen facilities and credit facilities provided by the company. The communication
in work place has no effect on work satisfaction.The welfare measures satisfaction has
no effect on work satisfaction. The increase in employee motivation will improve the
productivity and satisfaction in JRT Products. JRT has taken special measures to
relive workers from industrial fatigue and to improve intellectual, cultural and
material conditions of living of the workers.
Labor welfare includes various facilities, services and amenities
provided to workers in order to improve their health, efficiency, economic and social
status.Flexible Labor welfare schemes have been introduced. New welfare measures
are added to the existing ones from time to time. The purpose of labor welfare is to
bring about the development of the whole personality of the workers to improve the
productivity and overall performance.
6.1 Suggestions
1. Management should try to reduce the work load of the employees without
affecting the production capacity or sales volume.
2. To introduce suggestion scheme for the employees that will be highly effective in
improving the morale.
3. It is better if the management should recognize the needs of employees and
encourages employees’ special talents with promotions and salary adjustments.
4. It will be better if the management provides incentives to employees so it will
boost their morale and productivity.
5. Supervisors should maintain coordinal relationship with workers and offers
recognitions of the employees’ efforts and provide needed guidance to workers.
6. It will be better if the management provide performance and potential appraisal in
regularly.
7. Festival allowance is suggested for employees during festival seasons
8. Yearly get together is highly recommendable for up bring employee morale
which will generate more attachment for the company.
9. One of the best employee morale boosters is to know your employees personally.
Be aware if any family member is not well. Inquire about such a member is
particular.
CHAPTER VII
CONCLUSION
Conclusion
Morale is psychological concept. Morale shifts from one person to other person,
industry to industry, level of education, age, nature of work etc. Morale may vary
from very high to very low levels.The study on effect of welfare measures on
employee morale helps the management to know the satisfaction level of the
employees about the welfare measure provided by the company. By this study it is
clear that various factions, who influence morale and productivity of the employees
such as social security measures, welfare facilities, salary status, bonus, health
condition, shift system and recognition of work, are getting much importance.
To conclude employee morale plays very important role in
every organization. Good employee morale helps for the success of every
organization. If an employee has poor morale, there is always a possibility of
employee disharmony and also an effect on the smooth functioning of the
organization.

BIBLOGRAPHY
BOOKS:
Kothari C. R, “Research Methodology”, Published by Tata McGraw-
Hill Publishing Company Ltd, 13th
Edition, 1982.
Gupta S. P etal Gupta M. P, “Business Statistics”, Published by Sultan
Chand & sons, 7th
Edition, 1989.
C. B. Mamoria etal S. V. Gankar, “Personnel Management” Published
by Himalaya Publishing House.
Trevor Marshall, “Boost Employee Morale with an Employee
Incentive Program
WEBSITES:
WWW.JRT ROCK PRODUCTS.COM
http://Ezine Article.com/?expert=Sunil_Walia
http://www.ehow.com/how_4995845_ boost-employee-morale
www.experiment-resources.com/research
methodology.html#ixzz1Fn8oBxqv
APPENDIX
Sir/Madam
I am a management student of C.E.T COLLEGE OF MANAGEMENT SCIENCE
AND TECHNOLOGY,AIRAPURAM conducting a Research on “A STUDY ON
EFFECT OF WELFARE MESURES ON EMPLOYEE MORALE” in partial
fulfillment of the requirement for the award of the degree of B.Com. I would be
grateful if you would kindly spare sometime to answer the queries enclosed here. This
information will be used purely for academic purpose and would be kept confidential.
THE EFFECT OF WELFARE MEASURES ON EMPLOYEE
MORALE IN JRT ROCK PRODUCTS
Name :
Age :
Sex :
Monthly income :
1. How do rate your company
Excellent
Very good
Good
Average
Below average
2. How many years of services you have with this company/
Less than 1 year
Less than 3 years
Less than 5 years
More than 10 years
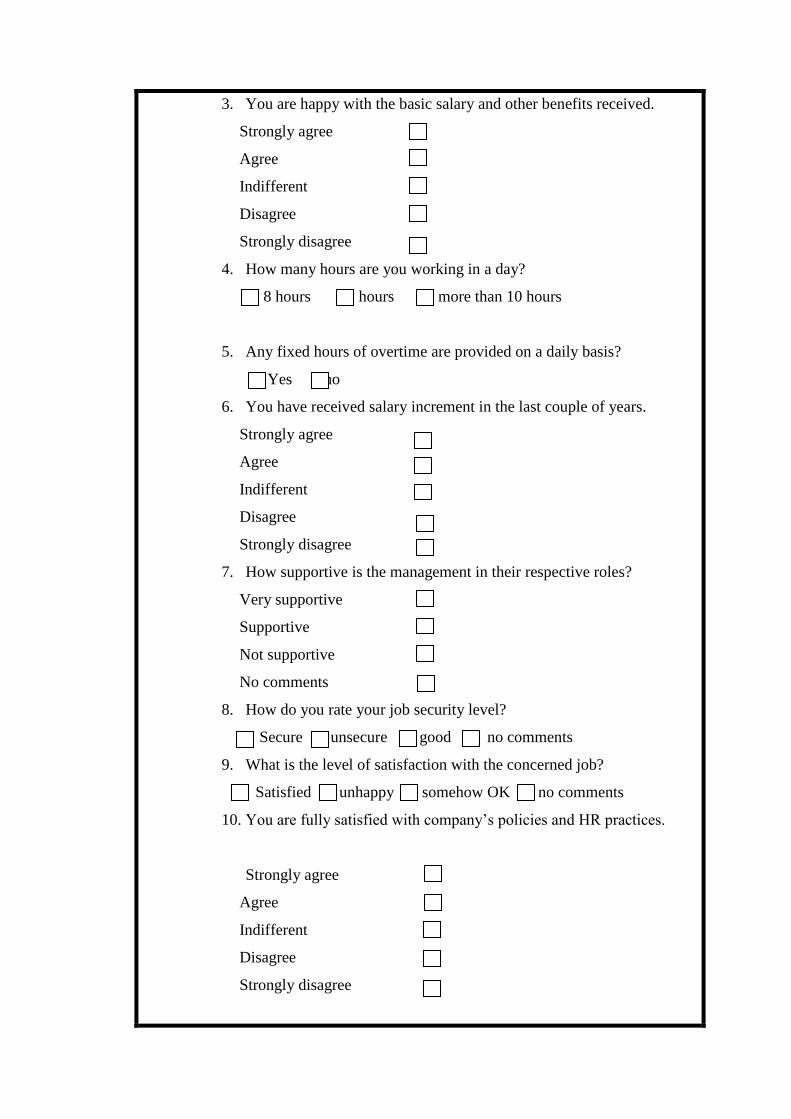
3. You are happy with the basic salary and other benefits received.
Strongly agree
Agree
Indifferent
Disagree
Strongly disagree
4. How many hours are you working in a day?
8 hours 9 hours more than 10 hours
5. Any fixed hours of overtime are provided on a daily basis?
Yes no
6. You have received salary increment in the last couple of years.
Strongly agree
Agree
Indifferent
Disagree
Strongly disagree
7. How supportive is the management in their respective roles?
Very supportive
Supportive
Not supportive
No comments
8. How do you rate your job security level?
Secure unsecure good no comments
9. What is the level of satisfaction with the concerned job?
Satisfied unhappy somehow OK no comments
10. You are fully satisfied with company’s policies and HR practices.
Strongly agree
Agree
Indifferent
Disagree
Strongly disagree
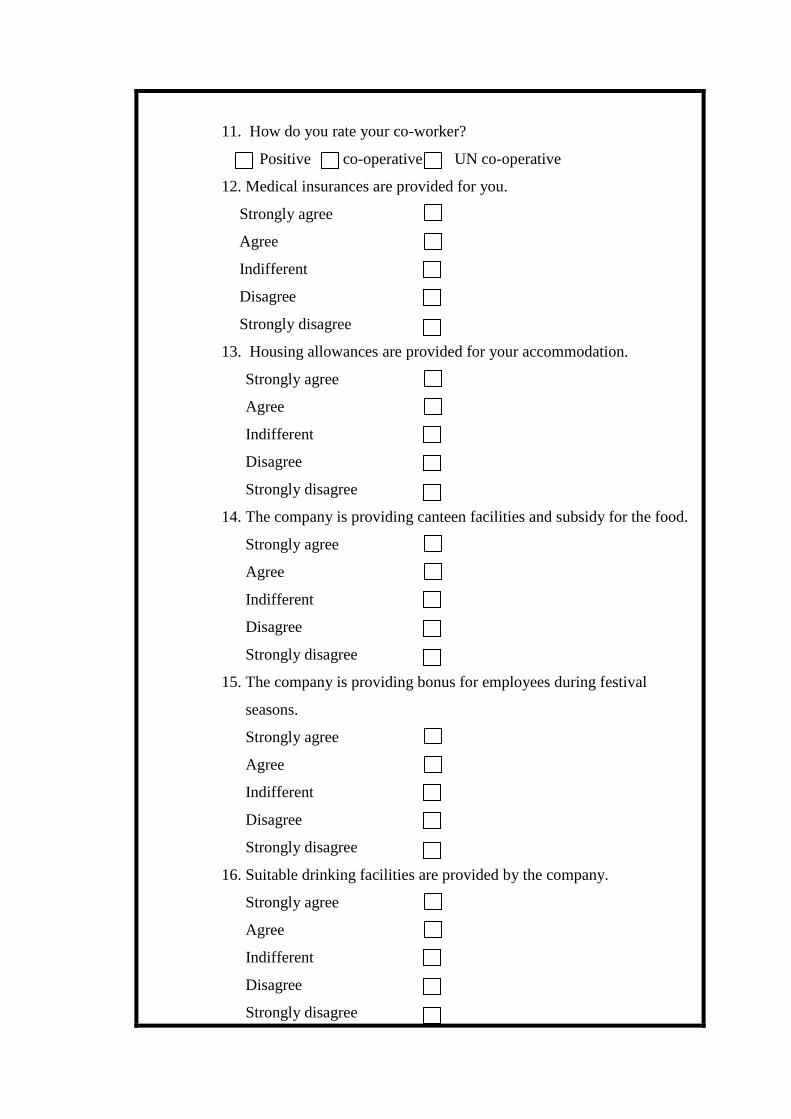
11. How do you rate your co-worker?
Positive co-operative UN co-operative
12. Medical insurances are provided for you.
Strongly agree
Agree
Indifferent
Disagree
Strongly disagree
13. Housing allowances are provided for your accommodation.
Strongly agree
Agree
Indifferent
Disagree
Strongly disagree
14. The company is providing canteen facilities and subsidy for the food.
Strongly agree
Agree
Indifferent
Disagree
Strongly disagree
15. The company is providing bonus for employees during festival
seasons.
Strongly agree
Agree
Indifferent
Disagree
Strongly disagree
16. Suitable drinking facilities are provided by the company.
Strongly agree
Agree
Indifferent
Disagree
Strongly disagree

17. The company has provided separate toilet facilities for men and
women.
Strongly agree
Agree
Indifferent
Disagree
Strongly disagree
18. Is company expecting any target for your work on a daily basis?
Yes no
19. You are happy with the overall performance of the company.
Strongly agree
Agree
Indifferent
Disagree
Strongly disagree
20. You feel secure in your employment.
Strongly agree
Agree
Indifferent
Disagree
Strongly disagree
21. You are provided with a safe working environment-physically &
mentally and are free of harassment.
Strongly agree
Agree
Indifferent
Disagree
Strongly disagree
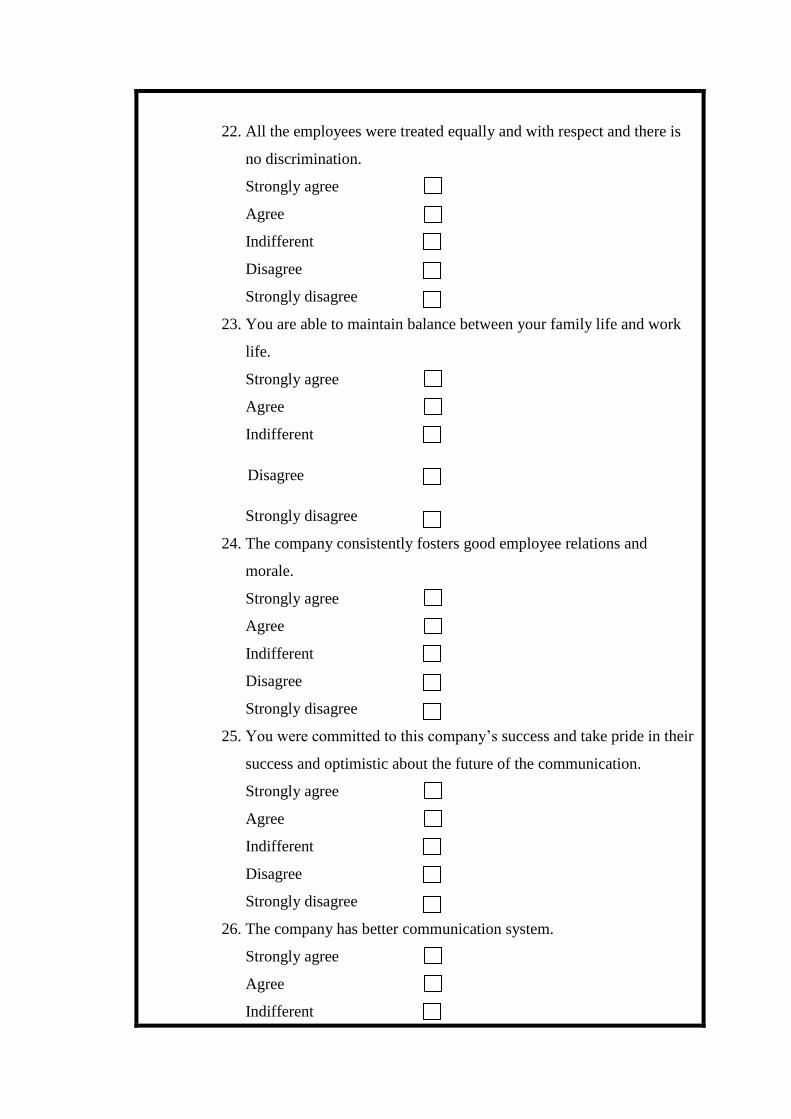
22. All the employees were treated equally and with respect and there is
no discrimination.
Strongly agree
Agree
Indifferent
Disagree
Strongly disagree
23. You are able to maintain balance between your family life and work
life.
Strongly agree
Agree
Indifferent
Disagree
Strongly disagree
24. The company consistently fosters good employee relations and
morale.
Strongly agree
Agree
Indifferent
Disagree
Strongly disagree
25. You were committed to this company’s success and take pride in their
success and optimistic about the future of the communication.
Strongly agree
Agree
Indifferent
Disagree
Strongly disagree
26. The company has better communication system.
Strongly agree
Agree
Indifferent
Disagree
Strongly disagree
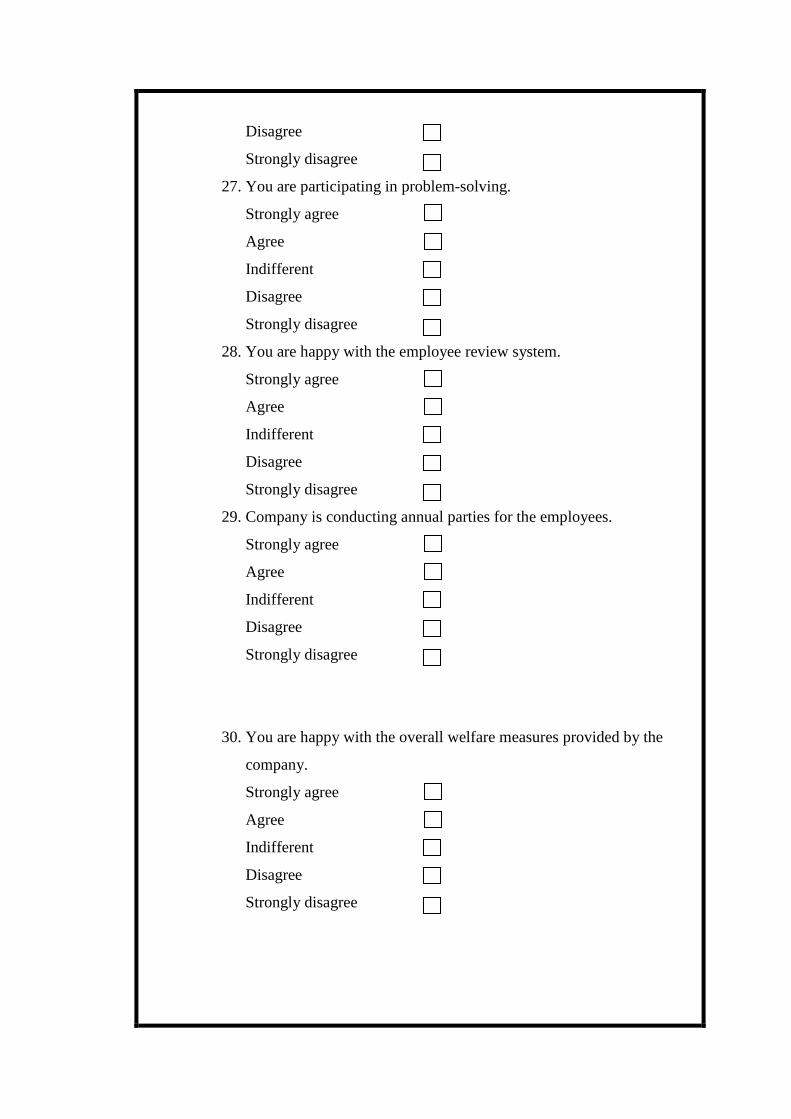
27. You are participating in problem-solving.
Strongly agree
Agree
Indifferent
Disagree
Strongly disagree
28. You are happy with the employee review system.
Strongly agree
Agree
Indifferent
Disagree
Strongly disagree
29. Company is conducting annual parties for the employees.
Strongly agree
Agree
Indifferent
Disagree
Strongly disagree
30. You are happy with the overall welfare measures provided by the
company.
Strongly agree
Agree
Indifferent
Disagree
Strongly disagree

![[9] Health Care and Welfare Measures for Persons with ... [9] Health Care and Welfare Measures for Persons with Disabilities Benefits for Welfare Services and Supports for Persons](https://img.pdfslide.net/doc/110x75/5adaf6a97f8b9a6d318d79fb/9-health-care-and-welfare-measures-for-persons-with-9-health-care-and-welfare.jpg)