Embed Size (px)
Citation preview

Coastal vulnerability to climate change-induced sea-level rise may be increased by land motion and
human factors Ballu, V., S. Calmant, J. Aucan, V. Duvat-
Magnan, B. Pelletier, M. Becker, M. Gravelle, M. Karpytchev, P. Valty, L. Testut, CK. Shum, F. Hossain, Z. Khan, P. Simeoni and T. Kanas
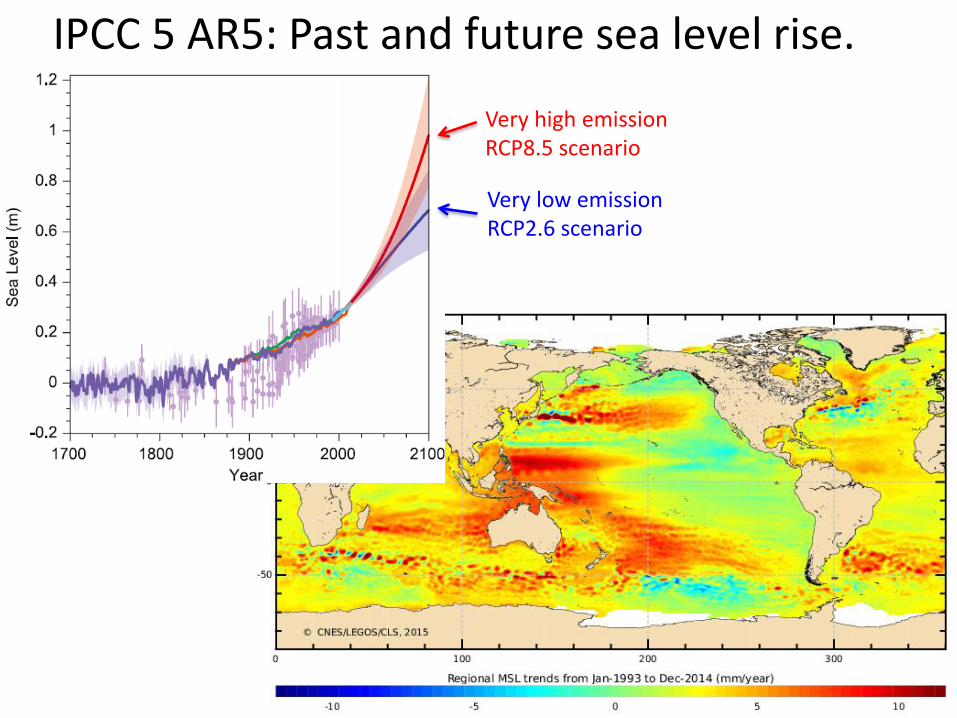
IPCC 5 AR5: Past and future sea level rise.
Very high emission RCP8.5 scenario
Very low emission RCP2.6 scenario

Vertical land motion and sea-level altimetric trends
1 cm/yr land uplift
1 cm/yr land subsidence
1 cm/yr « absolute » sea-level rise derived from altimetry
Velocities field is from ULR6 solution prepared for IGS2 reprocessing See www.sonel.org

Relative and « absolute » sea- level variations sea-level altimetric trends – vertical land contribution
1 cm/yr relative SLR
1 cm/yr relative SL drop
1 cm/yr « absolute » sea-level rise derived from altimetry
Velocities field is from ULR6 solution prepared for IGS2 reprocessing
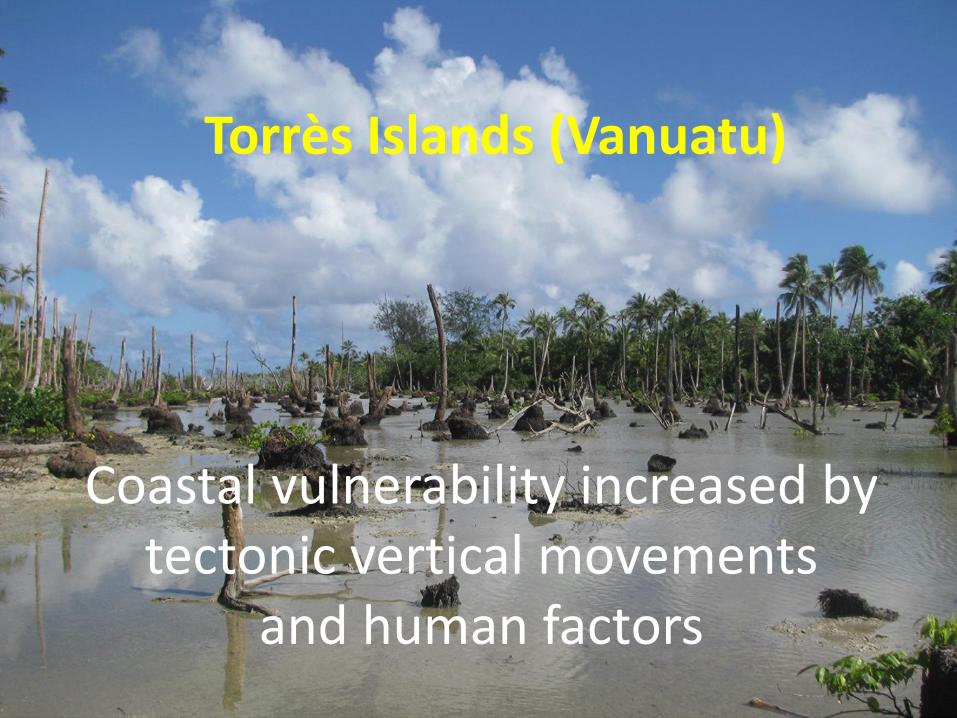
Torrès Islands (Vanuatu)
Coastal vulnerability increased by tectonic vertical movements
and human factors

“possibly the world’s first community to be formally moved out of harms way because of climate change” [2005 Climate Conference in Montreal, UNEP].

Coastal flooding :
Climate related sea level rise?
Tectonic subsidence?
or a combined effect?
?
1993-2014 Regional mean sea level trend in mm/yr
AVISO/CNES/CLS data 2015
Torrès

Ground motion - Interseismic (~1cm/yr) - Co-seismic
Torres
~12cm/yr

Ground motion - Interseismic (~1cm/yr) - Co-seismic
+ Sea level variations - Seasonal + ENSO - long term

Ground motion - Interseismic (~1cm/yr) - Co-seismic
+ Sea level variations - Seasonal + ENSO - long term
=
Relative sea level change
Ballu et al., PNAS 2011

Before After
The dominant factor, in this particular case, is not the global warming…
Coastal vulnerability to SLR is exacerbated by land motion, but also by anthropogenic factors (new settlements in improper location)
Mis-identifying the causes of SLR may lead to non-optimal choices for adaptation strategies…

Gange-Brahmaputra-Meghna delta
Role of flexure due to sediment load

Visco-elastic modeling of the loading effects
Fig.2 Observed vertical land movement rates (Steckler
et al., 2012) Fig.2 Observed vertical land movement rates (Steckler
et al., 2012)
(A) Dynamics of sedimentation
(B) sediment thickness (m) deposited since 11
kyr B.P. after Goodbred and Kuehl (2000).
Fig.4 Sediment thickness (m) of the loading disks
according to Fig.3 . The underwater disks are also
loaded by the water due to sea level rise
A
B
Present-day subsidence due to eustatism and sediment loading since 11kyr

Other contributions to ground level :
• Sediment compaction • Tectonic contribution • Sediment influx
perturbation (embarkments) • Water pumping, etc…
Observed vertical land movement rates (Steckler et al., 2012)
Significant contribution of the lithospheric flexure to total subsidence
Past climate change and associated sedimentation is playing a role in today’s vulnerability to SLR.

Duvat, 2010
KIRIBATI / TARAWA An exemple of mal-adaptative pathway

KIRIBATI Tarawa
Regional MSL trend from Jan 1993 to Dec 2014 (mm/yr)
From CNES/Legos/CLS data, 2015
Are all inhabitants from low lying atolls facing the same issues?
• Not directly exposed to cyclones • No strong vertical land motion • Exposed to king tides (high astronomical tides
during La Niña periods)
Many impressive images…
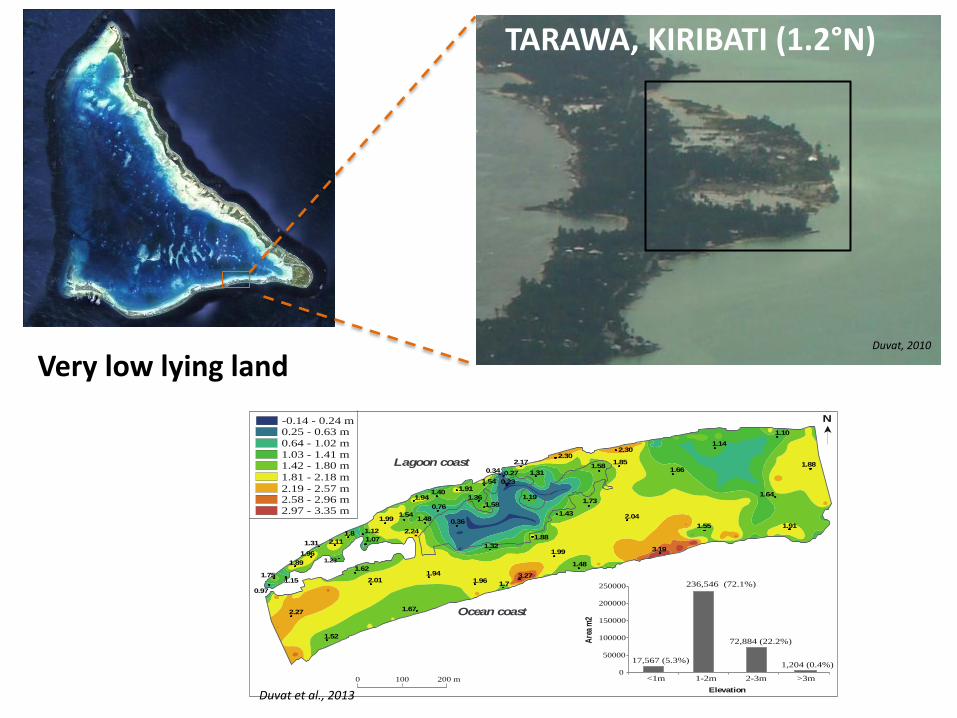
Duvat, 2010
TARAWA, KIRIBATI (1.2°N)
N
Lagoon coast
Ocean coast
0 100 200 m
0.64 - 1.02 m
1.03 - 1.41 m
2.19 - 2.57 m
1.81 - 2.18 m
1.42 - 1.80 m
2.58 - 2.96 m2.97 - 3.35 m
0.25 - 0.63 m-0.14 - 0.24 m
1.10
1.7
2.30
1.40
1.8
1.64
1.91
1.88
1.14
1.66
1.941.62
2.01
2.27
1.48
3.27
1.99
1.55
2.04
3.19
0.36
1.32
1.88
1.43
1.191.73
1.851.58
1.31
2.17
0.23
0.27
1.581.36
1.54
1.48
2.24
0.76
1.91
1.94
1.541.99
1.12
1.23
2.111.31
1.96
1.89
1.75
1.52
1.67
1.96
0.97
1.15
1.07
0.34
2.30
17,567 (5.3%)
236,546 (72.1%)
72,884 (22.2%)
1,204 (0.4%) 0
50000
100000
150000
200000
250000
<1m 1-2m 2-3m >3m
Are
a m
2
Elevation Duvat et al., 2013
Very low lying land

2007
1969
Lagoon coast
Ocean coast
0 400 m200
N
Lagoon coast
Ocean coast
Mangrove
Dense coastal vegetation
Coconut plantation
Coastline Reclaimed land
Aggregate mining and dredging
Coastal defences (seawalls, groynes...)
Buildings
Based on aerial photograph (1969) and Quickbird satellite image (2007) +
Fieldwork April-May 2011
Breach
Coastal defenses, erosion, sand mining… => Maladaptative trajectories of change have increased population and assets exposure to SLR.
Instable and submersible land => uninhabited
Duvat et al., 2013
Massive population influx

Thank you
• Vulnerability to climate change-induced SLR may be increased by land vertical motion and anthropogenic factors
• Many other examples • Need local assessment for proper action/adaptation

For questions…

Bangladesh sediment loading
• The ocean loading was computed by using
the eustatic sea level rise curve from Bard
et al. (1996).
• The sediment loading spatial pattern was
built from the isopach map of Goodbred
and Kuehl (fig.3B) . Uniform spatial
distribution of sediment thickness was set
for the disks outside the isopach map
limits.
• The results presented below correspond to
the lithosphere thickness of 50 km with the
PREM averaged rigidity modulus 52.5 GPa
and the upper and lower mantle viscosities
set to 3*1020Pa*sec and 1021Pa*sec.
Sediment thickness (m) of the loading disks.
The underwater disks are loaded by the water
due to sea level rise

Past climate and induced Holocen high sedimentation rates play a significant role in the present-day subsidence in Bangladesh => increase vulnerability to SLR
Sediment loading
Sea level rise loading

Brown and Nicholls, 2015
Auerbach et al., Nature Climate Change, 2015: Elevation disparity between the natural and poldered landscapes represents ~2 cm/yr of elevation change since polder construction.

High interannual variability
40 cm
El Niño / La Niña

Same process, spatial variability
www.sonel.org

Port-Vila tide gauge / continuous GPS
1km
VILA
VANU
TGBM
PTVL

Vertical land motion and sea level altimetric trend South West Pacific Region
TONGA
HAWAI
PNG
VANUATU FIJI
TUVA
KIRI
GUAM


SEYCHELLES
REUNION
MAURICIUS
BANGLADESH
MALDIVES
Vertical land motion and sea level altimetric trend Indian Ocean Region
0 400 m200
N
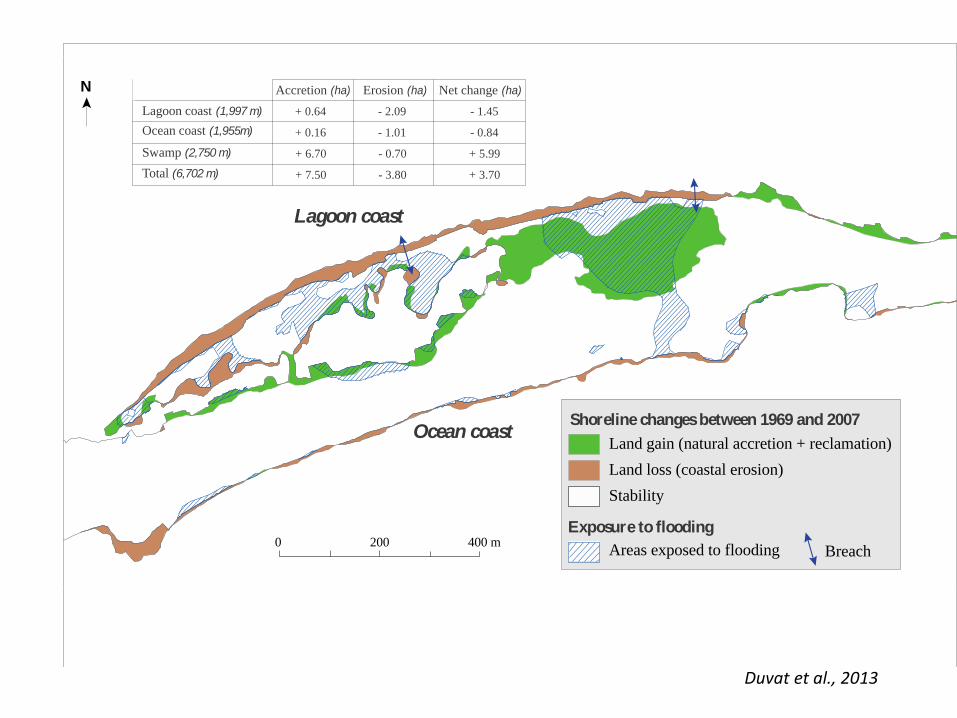
Lagoon coast (1,997 m)
Ocean coast
Lagoon coast
Ocean coast (1,955m)
Swamp (2,750 m)
Total (6,702 m)
Accretion (ha) Erosion (ha) Net change (ha)
+ 0.64
+ 0.16
+ 6.70
+ 7.50
- 2.09
- 1.01
- 0.70
- 3.80
- 1.45
- 0.84
+ 5.99
+ 3.70
Land gain (natural accretion + reclamation)
Land loss (coastal erosion)
Stability
Areas exposed to flooding
Shoreline changes between 1969 and 2007
Exposure to flooding
Breach
Duvat et al., 2013

0 400 m200
N
Ocean coast
Lagoon coast
Level 1 (low exposure)
Level 2 (medium exposure)
Level 3 (high exposure)
BUILDING EXPOSURESHORELINE EVOLUTION (1969-2007)
Land gain (natural accretion + reclamation)
Land loss (coastal erosion)
Stability
Areas exposed to flooding
Level 0 (no exposure)
Level 4 (very high exposure)EXPOSURE TO FLOODING
COASTAL PROTECTION
Good condition seawall
Breach Not surveyed area
Not surveyed building

Tarawa - Eita

N
Lagoon coast
Ocean coast
0 100 200 m
0.64 - 1.02 m
1.03 - 1.41 m
2.19 - 2.57 m
1.81 - 2.18 m
1.42 - 1.80 m
2.58 - 2.96 m2.97 - 3.35 m
0.25 - 0.63 m-0.14 - 0.24 m
1.10
1.7
2.30
1.40
1.8
1.64
1.91
1.88
1.14
1.66
1.941.62
2.01
2.27
1.48
3.27
1.99
1.55
2.04
3.19
0.36
1.32
1.88
1.43
1.191.73
1.851.58
1.31
2.17
0.23
0.27
1.581.36
1.54
1.48
2.24
0.76
1.91
1.94
1.541.99
1.12
1.23
2.111.31
1.96
1.89
1.75
1.52
1.67
1.96
0.97
1.15
1.07
0.34
2.30
17,567 (5.3%)
236,546 (72.1%)
72,884 (22.2%)
1,204 (0.4%) 0
50000
100000
150000
200000
250000
<1m 1-2m 2-3m >3m
Are
a m
2
Elevation Duvat et al., 2013

Torrès islands are not unique…
Vertical land movements are not uncommon, in particular near plate tectonic boundaries.
Can vary spatially significantly.
Taylor et al. 2008, Nature Geosciences,
Solomon, M8.1 EQ, April 2007. Subarya et al., Nature, 2006
Sumatra, M9.3 EQ, Dec. 2004

Sieh et al., Science, 2008

Seismic elastic cycle
• When subsidence is sudden (earthquake), the sea-level rise should be easily attributed to ground motion.
• However, in active areas, for an EQ to happen, stress need to accumulate for decades or centuries and slow vertical motion (uplift or subsidence) can be associated with this stress accumulation => slow relative sea-level changes can occur in between earthquakes (interseismic motion).

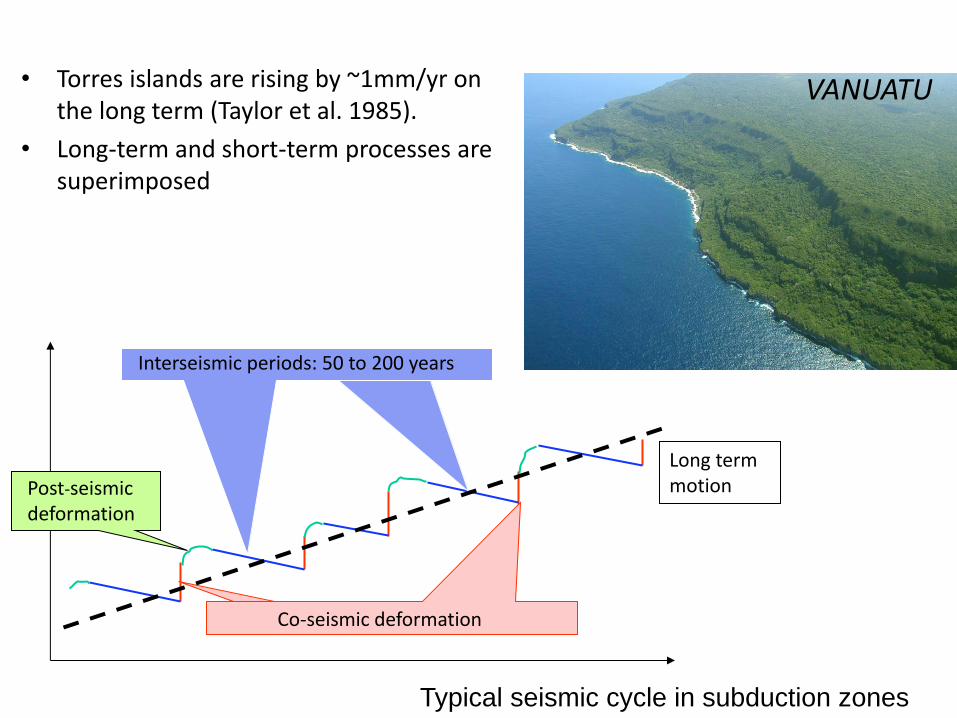
Co-seismic deformation
Post-seismic
deformation
Long term motion
Interseismic periods: 50 to 200 years
VANUATU • Torres islands are rising by ~1mm/yr on the long term (Taylor et al. 1985).
• Long-term and short-term processes are superimposed
Typical seismic cycle in subduction zones

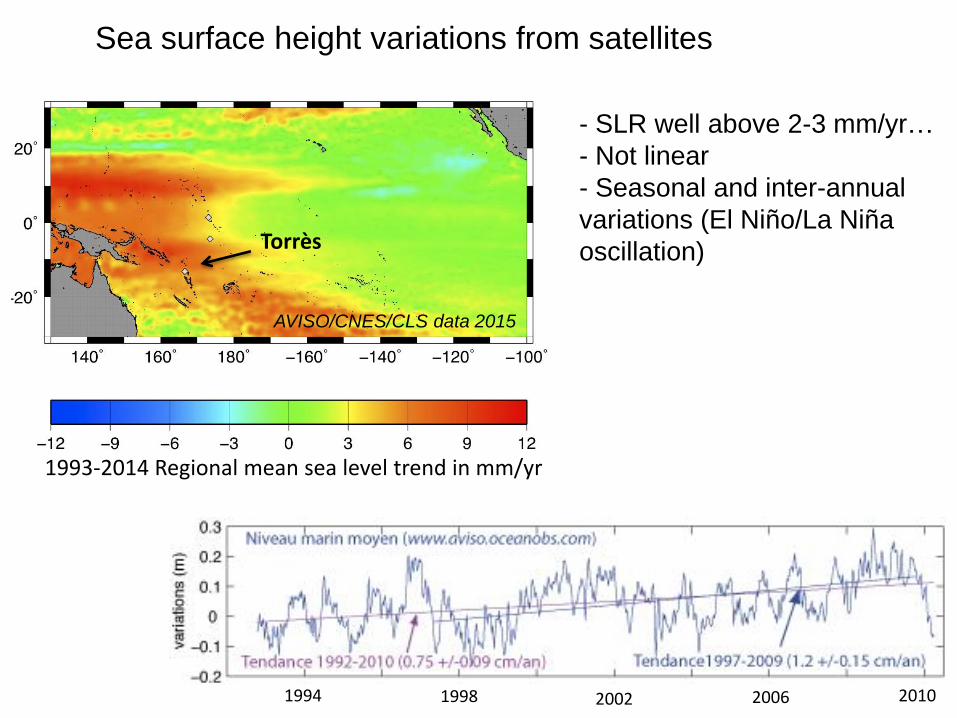
Sea surface height variations from satellites
- SLR well above 2-3 mm/yr…
- Not linear
- Seasonal and inter-annual
variations (El Niño/La Niña
oscillation)
1993-2014 Regional mean sea level trend in mm/yr
AVISO/CNES/CLS data 2015
Torrès
1994 2002 1998 2006 2010