Embed Size (px)
Citation preview

URBAN MOBILITY AND THE ENVIRON MENT
C H A P T E R 7The increasing mobility experi enced in cities all overthe world brings enormous benefits to society andalso provides the essential means by which a city canfunction effectively. The increasing urban mobilityis manifested in three major forms: an increase inthe number of trips made, an increase in the lengthof each trip, and – last but not least – an increasingmotorization of urban people and goods movement.The environ mental consequences of the increasedmotorization – and in particular the use of privatemotorized vehicles (cars and motorcycles) – arecause for major concerns, not only locally in the city,but also globally, as the trans port sector is one ofthe major contributors to greenhouse gas emissions,the major cause of climate change.
In the past, it has often been argued that trans -port is an essential prerequisite for economic growth,at least for cities at an early stage in their devel op -ment. It has also been argued that this relationshipis not so important for cities in developed countrieswhere there is already an extensive network ofroutes and where levels of accessibility are alreadyhigh.1 Recent debates have argued for prosperitywithout growth,2 meaning that economic growth(and transport) needs to be more closely aligned withenviron mental and social priorities.
It is increasingly being acknowledged that urbandevel op ment has to be based not only on economicgrowth, but also on social equity (and equal access)and environ mental sus tain ability. Thus interventionsin urban mobility systems should not only addressthe economic benefits of higher levels of accessibility(and mobility), but at the same time take account ofthe social and environ mental implications of followingparticular policy pathways.3
The purpose of this chapter is to highlight envir -on mental sus tain ability concerns within urbanmobility systems. This includes the identification ofenviron mental costs and a discussion of the meansby which their impacts can be reduced. The chapteracknowledges that urban mobility will always useresources and generate externalities,4 but its impact
on the urban environ ment can be substantiallyreduced, so that it remains within acceptable limitsand makes a strong contribution to other aspects ofsus tain ability, including intergenerational concerns.
The first section of the chapter identifies themain environ mental challenges facing urban mobility,focusing on oil dependence, greenhouse gas emiss -ions, sprawl and human health concerns. This isfollowed by five sections that discuss the policyresponses to these challenges. The second to fourthsections focus on reducing the number of trips made,reducing travel distances in cities and changing themodal split towards non-motorized and publictransport. The fifth section discusses the potentialof technology in reducing the negative externalitiesof motorization by addressing the efficiency and ageof the vehicle stock, standards of fuels used andemissions from vehicles and alternatives to oil-basedfuels, and the need for increased efficiency in theuse of vehicles. The sixth section argues that, inpractical terms, a combination of several approachesis likely to be most effective. This is followed by asection that (briefly) discusses international fundingmechanisms to achieve environ mentally sus tain ableurban mobility systems. The final section contains abrief summary and some major lessons for policy.
ENVIRON MENTALCHALLENGES IN URBANMOBILITY SYSTEMSEnviron mental concerns have, over the last fewdecades, become central to the debates about sus -tain able urban mobility. Yet, in practice, devel op -mental objectives seem to take priority overenvir on mental concerns. A key message underpinningthe discussion in this chapter is the need to find themeans by which both devel op mental and environ -mental concerns can be addressed at the same time,in mutually supporting ways.
1EEE234567891012311145678920123456789301234567894012345678950123456789EEEE
Theenvironmentalconsequences ofthe increasedmotorization . . .are cause formajor concerns, . . . as thetransport sector isone of the majorcontributors to . . . climatechange
Environmentalconcerns have . . . become central tothe debates aboutsustainable urbanmobility. Yet, in practice,developmentalobjectives seem totake priority overenvironmentalconcerns
Planning and Design for Sustainable Urban Mobility130
Motorized urban trans port relies almost entirely(95 per cent) on oil-based products for its energysupply, primarily in the form of petrol and diesel.5
The shift in urban trans port technology towardmotorization has thus led to a significant increase inthe global consumption of such oil-based products.While 45.4 per cent of global oil supplies were usedin the trans port sector in 1973, this figure hadincreased to 61.5 per cent in 2010. Thus, while thetotal amount of oil used globally increased by 63 percent during the 1973–2010 period, the consumptionby the trans port sector increased by 120 per cent.6
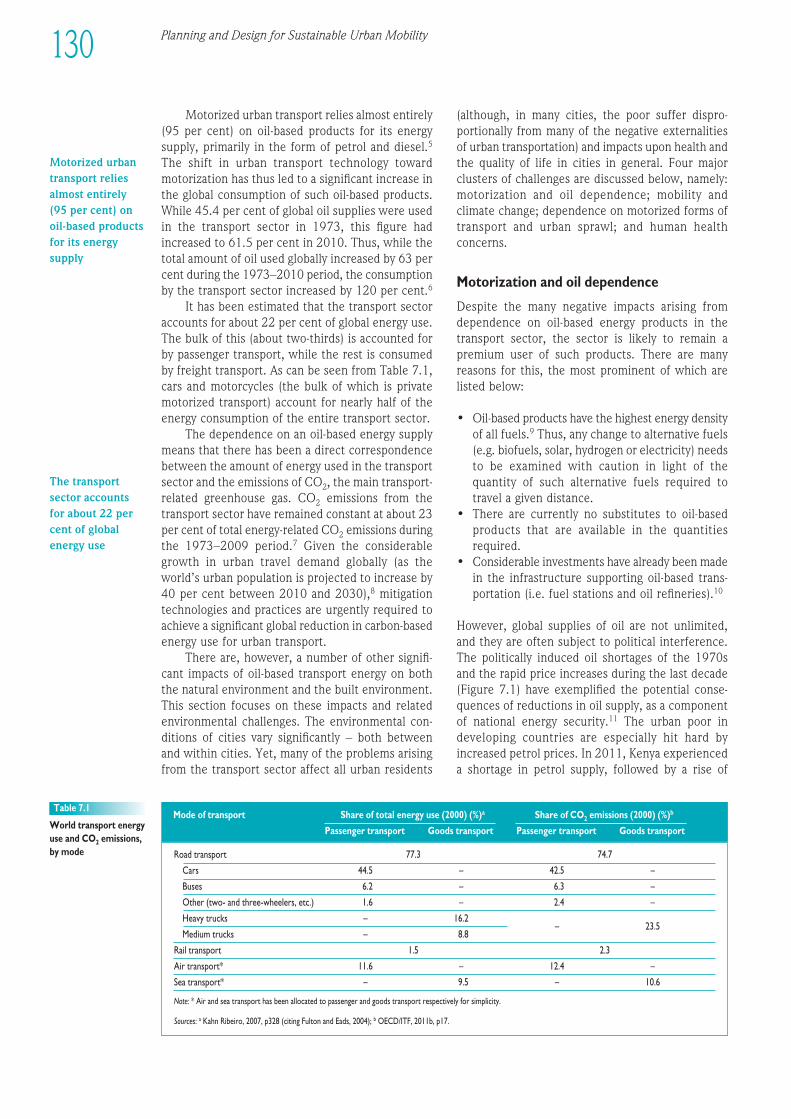
It has been estimated that the trans port sectoraccounts for about 22 per cent of global energy use.The bulk of this (about two-thirds) is accounted forby passen ger transport, while the rest is consumedby freight transport. As can be seen from Table 7.1,cars and motorcycles (the bulk of which is privatemotorized transport) account for nearly half of theenergy consumption of the entire trans port sector.
The dependence on an oil-based energy supplymeans that there has been a direct correspondencebetween the amount of energy used in the trans portsector and the emissions of CO2, the main transport-related greenhouse gas. CO2 emissions from thetrans port sector have remained constant at about 23per cent of total energy-related CO2 emissions duringthe 1973–2009 period.7 Given the considerablegrowth in urban travel demand globally (as theworld’s urban population is projected to increase by40 per cent between 2010 and 2030),8 mitigationtechnologies and practices are urgently required toachieve a significant global reduction in carbon-basedenergy use for urban transport.
There are, however, a number of other signifi -cant impacts of oil-based trans port energy on boththe natural environ ment and the built environ ment.This section focuses on these impacts and relatedenviron mental challenges. The environ mental con -di tions of cities vary significantly – both between and within cities. Yet, many of the problems arisingfrom the trans port sector affect all urban residents
(although, in many cities, the poor suffer dispro -portionally from many of the negative externalitiesof urban transportation) and impacts upon health andthe quality of life in cities in general. Four majorclusters of challenges are discussed below, namely:motorization and oil dependence; mobility andclimate change; dependence on motorized forms oftrans port and urban sprawl; and human healthconcerns.
Motorization and oil dependence
Despite the many negative impacts arising fromdepen d ence on oil-based energy products in thetrans port sector, the sector is likely to remain apremium user of such products. There are manyreasons for this, the most prominent of which arelisted below:
• Oil-based products have the highest energy densityof all fuels.9 Thus, any change to alternative fuels(e.g. biofuels, solar, hydrogen or electricity) needsto be examined with caution in light of thequantity of such alternative fuels required totravel a given distance.
• There are currently no substitutes to oil-basedproducts that are available in the quantitiesrequired.
• Considerable investments have already been madein the infra struc ture supporting oil-based trans -portation (i.e. fuel stations and oil refineries).10
However, global supplies of oil are not unlimited, and they are often subject to political interference.The politically induced oil shortages of the 1970s and the rapid price increases during the last decade(Figure 7.1) have exemplified the potential conse -quences of reductions in oil supply, as a componentof national energy security.11 The urban poor indevel op ing countries are especially hit hard byincreased petrol prices. In 2011, Kenya experi enceda shortage in petrol supply, followed by a rise of
Road transport 77.3 74.7
Cars 44.5 – 42.5 –
Buses 6.2 – 6.3 –
Other (two- and three-wheelers, etc.) 1.6 – 2.4 –
Heavy trucks – 16.2– 23.5
Medium trucks – 8.8
Rail transport 1.5 2.3
Air transport* 11.6 – 12.4 –
Sea transport* – 9.5 – 10.6
Note: * Air and sea trans port has been allocated to passen ger and goods trans port respectively for simplicity.
Sources: a Kahn Ribeiro, 2007, p328 (citing Fulton and Eads, 2004); b OECD/ITF, 2011b, p17.
Table 7.1
World trans port energyuse and CO2 emissions,by mode
Mode of transport Share of total energy use (2000) (%)a Share of CO2 emissions (2000) (%)b
Passen ger transport Goods transport Passen ger transport Goods transport
Motorized urbantransport reliesalmost entirely(95 per cent) onoil-based productsfor its energysupply
The transportsector accountsfor about 22 percent of globalenergy use

Urban Mobility and the Environment 131
1EEE234567891012311145678920123456789301234567894012345678950123456789EEEE
1945
1947
1949
1951
1953
1955
1957
1959
1961
1963
1965
1967
1969
1971
1973
1975
1977
1979
1981
1983
1985
1987
1989
1991
1993
1995
1997
1999
2001
2003
2005
2007
2009
2011
120
100
80
60
40
20
0
Pri
ce o
f cr
ude
oil
(US
$)
Year
Real price (US$ 2011 value)Nominal price (current US$)
Figure 7.1
Crude oil prices(1945–2011)
Source: Based on BP plc, 2012.
30 per cent in petrol prices within a few months.12
Car owners slowly decreased their number of trips;however the mounting prices had an immediateeffect on public transport. Privately owned bus linesinitially decreased the frequency of legs collectingpassen gers to maintain profitability, followed by the suspension of multiple public trans port lines by owners, while at the same time demanding thegovern ment lower petrol prices. As a result, theurban poor living at the fringes of the city sufferedthe most, unable to travel long distances to earn aliving.
In the short term, the trans port sector isprepared to pay for the higher costs of energy, andmost savings in the use of carbon-based energysources will come from the use of more efficienttechnology within the conventional petrol and dieselvehicles. In the longer term, however, and irrespec -tive of the wider environ mental impacts, the trans -port sector needs to diversify its sources of energyand to de-carbonize the sources of fuel used.13
High and volatile prices have encouraged somecountries to subsidize fuel prices to protect their ownmotorists from increasing world prices for petrol and
diesel. Other countries impose various taxes on suchcommodities. Thus, the pump price for petrol variesconsiderably between (and also within) countries,from US$0.02 per litre in Venezuela to US$2.54 in Eritrea (Figure 7.2). The political rationale forsubsidizing fuel prices varies dramatically from onecountry to another.14 However, the perverse effectof fuel subsidies has been to encourage more cartravel. And, it can be argued that fuel subsidies pri marily benefit car owners. Targeted subsidies to public trans port are a better alternative if theobjective is to make trans port more affordable to theurban poor. In general, fuel prices should not besubsidized for the sake of short-term political interest(Box 7.1), as it is important that the full environ mentalcosts of fuels are paid by the user. This is known ininternational law as the ‘polluter pays principle’.15
It has been estimated that ‘a universal phase-out ofall fossil-fuel consumption subsidies by 2020 wouldcut global primary energy demand by 5%’, withsavings predominantly in the trans port sector.16 If fuel subsidies are to be retained, it is often arguedthat it would be better to subsidize renewable energysources, to encourage a shift away from fossil fuels.17
Pump prices(US$/litre)
No data0 – 0.490.5 – 0.991.0 – 1.491.5 – 1.992.0 – 2.99
Figure 7.2
Worldwide retail pricesof petrol (2010)
Source:http://data.worldbank.org/indicator/EP.PMP.SGAS.CD, lastaccessed 21 March 2013.
The transportsector needs todiversify itssources of energyand to de-carbonize thesources of fuelused
The perverseeffect of fuelsubsidies hasbeen to encouragemore car travel

Planning and Design for Sustainable Urban Mobility132
With high oil prices (over US$100 a barrel), many countriesare not passing on these costs to users, as fossil fuels areneeded for cooking, heating, electricity generation as well as powering engines and vehicles. The International MonetaryFund estimates the global bill for fuel subsidies reachedUS$250 billion in 2010, up from US$60 billion in 2003.a
Some 40 per cent of this amount are subsidies for oil products (the rest being natural gas, electricity and coal).b
Other sources quote even higher levels of fossil fuel subsidies, namely: ‘$523 billion in 2011, up almost 30% on2010 and six times more than subsidies to renewables’.c
For oil-producing countries fuel subsidies are part of asocial contract and can be managed. In Iran alone, the totalvalue of oil subsides reached nearly US$25 billion in 2005.b
But for non-oil producers it creates an additional fiscal burdenand it means that investments in other sectors are delayed asforeign currency is used to pay for the oil. In India, it isestimated that fuel subsidies have added US$20 billion, or 1 per cent of GDP, to the national budget.a
Most of those that argue for the continuation ofsubsidies on fossil fuels argue that this is done to assist thepoor. In practice, however, this is rarely the case; as ‘only 8%of the subsidies to fossil-fuel consumption in 2010 reached thepoorest 20% of the population’.d The figure is even lower forpetrol and diesel, where only 6 per cent of the total subsidywent to the poorest 20 per cent of the population.e
For political reasons, ‘Govern ments like to keepsubsidies “off-budget” since “on-budget” subsidies are an easytarget for pressure groups interested in reducing the overalltax burden. For this reason, subsidies often take the form ofprice controls that set prices below full cost, especially wherethe energy company is state-owned, or of a requirement onenergy buyers to take minimum volumes from a specific,usually domestic, supply source. Subsidies may be aimed atproducers, such as a grant paid for each unit of production, orat consumers, such as a rebate or exemption on the normalsales tax’.f
Sources: a Hook et al, 2011; b IEA, 2006, Figure 11.7; c IEA, 2012a, p1; d IEA, 2011c, p7; e IEA, 2011d; f UNEP, 2008, p9.
Box 7.1 Fuel subsidies
Cities make greater efficiency in their use ofenergy for trans port than less densely populatedlocations, as more efficient public trans port canreplace the need to use a private car, and as distancesare shorter. The relative energy efficiencies fordifferent modes of trans port in 84 cities are shownin Table 7.2. The occupancy rates for public trans -port vehicles are central to the interpretation of thistable. The substantial differences in energy efficiencybetween cities in the different regions are partly dueto the technology being used, but also to theoccupancy levels. For example, China has high levels
of efficiencies for all forms of public trans port (exceptferry), while the figures for the US are significantlylower. The general conclusion of the table, however,is that there is a significant potential to reduceenergy use (and thus greenhouse gas emissions) byencouraging more people to use public transport.
Mobility and climate change
As a result of international policy concern during the1970s and 1980s, the United Nations FrameworkConvention on Climate Change, also known as the
World 2.45 – 1.05 0.52 0.56 0.46 0.61 – –
US 4.6 2.63 2.85 0.99 0.67 1.65 1.39 5.41 10
Canada 5.0 1.47 1.50 0.31 0.25 0.49 1.31 3.62 15
Australia and New Zealand 3.9 1.49 1.66 0.36 – – 0.53 2.49 10
Western Europe 3.3 0.86 1.17 0.72 0.69 0.48 0.96 5.66 17
High-income Asia 3.3 0.58 0.84 0.36 0.34 0.19 0.24 3.64 25
Eastern Europe 2.35 0.40 0.56 0.74 1.71 0.21 0.18 4.87 –
Middle East 2.56 0.67 0.74 0.13 0.20 – 0.56 2.32 –
Latin America 2.27 0.76 0.75 – – 0.19 0.15 – –
Africa 1.86 0.51 0.57 – – – 0.49 – –
Low-income Asia 1.78 0.64 0.66 – 0.05 0.46 0.25 2.34 –
China 1.69 0.28 0.26 – – 0.05 – 4.90 –
Notes: The table is based on data from a sample of 84 cities in different regions. ‘–’ implies ‘data not available’.
Sources: Newman and Kenworthy, 2011a (citing Kenworthy, 2008).
Table 7.2
Energy efficiency forurban transport, bymode of transport
Country/region Trans port energy use (megajoule per passen ger kilometre) Assumed
Private Public passen ger transportoccupancy
vehiclesrates for public
Total Bus Tram Light rail Metro Suburban Ferry transport rail in cities (%)
There is asignificantpotential toreduce . . .greenhouse gasemissions, byencouraging morepeople to usepublic transport

Urban Mobility and the Environment 133
1EEE234567891012311145678920123456789301234567894012345678950123456789EEEE
World 28,999 4.29 6,544 0.968 22.6
OECD countries:
North America 6,180 13.27 1,940 4.166 31.4
Asia and Oceania 2,099 10.00 418 1.996 19.9
Europe 3,765 6.85 957 1.742 25.4
Non-OECD countries:
Africa 927 0.92 233 0.230 25.1
Asia (excl. China) 3,153 1.43 492 0.223 15.6
China 6,877 5.14 476 0.356 6.9
Middle East 1,509 7.76 329 1.689 21.8
Europe 2,497 7.46 346 1.032 13.9
Latin America 974 2.16 339 0.751 34.8
Source: Based on IEA, 2011a.
Table 7.3
CO2 emissions levelsoverall and fortransport (2009)
Total CO2 emissions CO2 emissions from transport
Total Per capita Total Per capita % of total (MtCO2) (tCO2) (MtCO2) (tCO2) emissions
Globally, the CO2
emissions fromthe transportsector haveincreased by 85per cent from . . .1973 to . . . 2007
In most cities, theemissions frompublic transportare insignificantcompared to thosefrom privatemotorizedtransport
Climate Convention, entered into force in 1994. Itsultimate objective is to stabilize global greenhousegas concentrations in the atmosphere at a level thatwill prevent human interference with the climatesystem. In order to achieve this, many developedcountries committed (through the Kyoto Protocol) to reduce their overall greenhouse gas emissions byat least 5 per cent below 1990 levels by 2012.18
Although some countries have managed to meettheir commitments, many other countries (primarilythose that did not commit to reductions) have in -creased their greenhouse gas emissions dramatically.Global emissions of CO2 have increased by nearly 50per cent between 1990 (20.97 billion tonnes)19 and2010 (30.6 billion tonnes).20
Globally, the CO2 emissions from the trans portsector have increased by 85 per cent from 3.593billion tonnes in 1973 to 6.665 billion tonnes in2007.21 With respect to the targets of the KyotoProtocol, the emissions have increased by over 47per cent during the 1990–2007 period.22
There is considerable variation in the amountsof CO2 produced by different countries and regions.A similar variation applies to the emissions from thetrans port sector. As can be seen from Table 7.3, thetrans port emissions per capita in North America aremore than four times the global average, and morethan double that in other OECD countries. The CO2emissions from transportation are much lower indevel op ing countries. The emissions in most of Asiaand Africa are about a third or a quarter of the globalaverage, the notable exception is the Middle East,where the transportation emissions per capita aresimilar to those in Europe. Even more striking: whilethe overall CO2 emissions per capita in the US aresome 2.5 times higher than in China, the CO2emissions per capita from transportation in the USare 12 times as high as in China.
As indicated in Table 7.1, road and maritimefreight accounts for about 25 per cent and 10.6 per
cent of the CO2 emissions, respectively. Aviationaccounts for another 12.4 per cent, while theemissions from rail trans port are insignificant. Theremaining 52 per cent of CO2 emissions are beingproduced from passen ger road transport.23 For allparts of the world, more energy (and CO2 emissions)per capita is used in private than in public transport;in Africa the ratio is 3:1, while it is 50:1 in the US.24
At the city level, there is considerable variationin energy use between cities. For example, more thanhalf the total energy consumption in Mexico City andCape Town is trans port based,25 while the levels inmany European cities (for example, London andParis) are about a quarter.26 This reflects the differ -ences between cities in terms of their structure, theirurban form, their densities, their levels of sprawl, theimportance of public trans port and the balancebetween energy use in trans port and other sectors.
Figure 7.3 shows variations in CO2 emissionsfrom passen ger trans port across cities in variousparts of the world. The emissions are highest in US,followed by Canadian and Australian cities, withemissions in the range of 2–7.5 tonnes per capita.Most European cities have emissions in the range of1–2 tonnes per capita. Most devel op ing countrycities, however, have significantly lower emissions.To provide a specific example: the mobility patternsof each resident of Atlanta, US, produce about 150times as much CO2 emissions as those of a residentof Ho Chi Minh City, Viet Nam. Figure 7.3 also showsthat, in most cities, the emissions from public trans -port are insignificant compared to those from privatemotorized transport.
Nearly one-half of the world’s cities are locatedon the coast or along major rivers. These locationshave in the past been subject to occasional flooding,but these risks have increased as a result of morefrequent storm surges and high winds, accentuatedby global warming and sea-level rise. The vulnerabilityof these cities to flooding has thus been substantially

8000
7000
6000
5000
4000
3000
2000
1000
0
Ann
ual k
g p
er c
apita
of
CO
2
Atla
nta
Hou
ston
San
Fra
ncis
coD
enve
rS
an D
iego
Los
Ang
eles
Pho
enix
Was
hing
ton
Chi
cago
New
Yor
kC
alga
ryTo
ront
oM
elb
ourn
eP
erth
Bris
ban
eVa
ncou
ver
Syd
ney
Ott
awa
Mon
trea
lR
iyad
hB
russ
els
Wel
lingt
onFr
ankf
urt
Gen
eva
Rom
eH
amb
urg
Mun
ich
Stu
ttga
rtO
slo
Sto
ckho
lmB
angk
okN
ante
sM
arse
ille
Ruh
rG
lasg
owLy
onZ
uric
hV
ienn
aD
usse
ldor
fC
open
hage
nLo
ndon
New
cast
leM
adrid
Par
isB
erlin
Gra
zB
erne
Mila
nB
olog
naTe
l Avi
vA
mst
erd
amJo
hann
esb
urg
Ath
ens
Man
ches
ter
Sap
por
oTo
kyo
Hel
sink
iS
inga
por
eO
saka
Kua
la L
ump
urP
ragu
eS
ao P
aulo
Seo
ulTa
ipei
Bud
apes
tC
uriti
ba
Bar
celo
naC
ape
Tow
nH
arar
eB
ogot
aC
raco
wH
ong
Kon
gTe
hran
Tuni
sJa
kart
aM
anila
Bei
jing
Dak
arG
uang
zhou
Cai
roC
henn
aiS
hang
hai
Mum
bai
Ho
Chi
Min
h C
ity
Public
Private
Figure 7.3
Per capita emissions ofCO2 from (private andpublic) passen ger trans -port in 84 cities (1995)
Source: Kenworthy, 2003, p18.
increased, and some have taken action to reduce thepotential impacts. However, some 40 million peopleare still exposed to a 1 in 100 year coastal flood event,and this will rise to 150 million in 2070.27 A recentsurvey of 90 cities indicates that severe flooding and storm-water management is among the top threechallenges facing cities.28 Trans port is central to thefunctioning of cities, and it is often the trans portsystem that is initially affected by flooding and hightemperatures. Yet, it is that same trans port systemthat is required to provide access to the locations thathave become isolated as a result of flooding. Further -more, when urban trans port infra struc ture fails this can have far-reaching economic consequences,as people cannot get to work and goods cannot bedistributed.29
There is thus an immediate need for cities totake action to protect the existing trans port infra -struc ture from the impacts of climate change. Thisincludes continuous maintenance, but may alsorequire additional investments in drainage, erosioncontrol and protective engineering structures. At thesame time, cities all over the world should integrateplanning for climate change with general land-useplanning to reduce vulnerability for new devel op -ments. This should include limitations on devel op -ments in flood-prone locations. The infra struc tureitself can be designed to be more resilient to hightemperatures (e.g. buckling of rail, effects on metallicbridges, etc.), and should be raised above the levelsof the surrounding countryside to allow passageduring flooding. Further more, drainage systemsshould be designed with a capacity to move floodwaters away from the infra struc ture.30 Moreover,improvements to existing, or devel op ment of new,trans port infra struc ture should take into account
the requirements of the whole urban population,including vulnerable and dis advan taged groups (seeChapter 6).31
Dependence on motorized forms oftrans port and urban sprawl
Increasing levels of motorization have, in most cities,resulted in lower densities and decentralization,with the second-round effect that suburban living hasgenerally encouraged the ownership of a car. Motor -ization also exacerbates congestion, which can havethe knock-on effect of increasing travel times onpublic transport, thus further encouraging travel byprivate cars. While, in many cities, buses tend to beunreliable (due partly to congestion),32 the car seemsto offer more control as alternative less congestedroutes can be used, giving the driver greater flexi -bility. For those with access to a car, mobility levelsincrease and many also want to live in lower densitydevel op ments. This gives rise to urban sprawl. Thisin turn makes it difficult to provide alternatives tothe car.33 Such devel op ment has been common inlocations where land is available and cheap.34
However, not everyone can afford a private car,leading (in many cities) to a social stratification of urban trans port systems. The poorest and mostvulnerable groups (including women, children, youth,elderly and disabled persons) cannot afford to (or areunable to use) private cars.35 For these groups, urbansprawl often leads to social isolation.36
In addition to more space being taken up by low-density devel op ments, trans port systems in such settlements also use substantial amounts ofspace for roads, railways, car parks and otherassociated infra struc ture. The loss of agricultural
134 Planning and Design for Sustainable Urban Mobility
There is . . . animmediate needfor cities to takeaction to protectthe existingtransportinfrastructurefrom the impactsof climate change
For [the poorestand mostvulnerable]groups, urbansprawl often leadsto social isolation

1EEE234567891012311145678920123456789301234567894012345678950123456789EEEE
135Urban Mobility and the Environment
land and the changing local climate resulting fromgreater amounts of land being allocated to urbandevel op ment (and motorized transport) mean thatthere may be increased fragmentation of naturalhabitats, reductions in biodiversity and impacts onlocal ecosystems as roads act as barriers.37 AnAustralian study found that energy use in suburbanhouseholds was 50 per cent higher than those in theurban centre, and this was explained primarily bygreater car use and longer journeys.38 Other coun-tries (for example, China) now have the problem of loss of productive land as cities spread and as carownership levels increase. In Hyderabad (India),which more than doubled its population between1980 and 1999,39 the urban land take increased from9 per cent to 24 per cent of the total land available(1980–1999). This resulted in a 24 per cent reduc -tion of the agricultural land area.40
Human health concerns
The increased motorization of urban trans port is also causing serious challenges to human health. Thissection summarizes the main physical health con -cerns related to air and noise pollution, reduced
physical activity, as well as issues related to com -munity severance, open spaces and mental health.Road traffic accidents, which are perhaps the mostprominent human health concern from urbanmobility, are discussed in Chapter 6, as part of thediscussion on urban safety and security.
n Air pollutionThe impacts of air pollution on air quality and humanhealth are gaining increasing attention by residentsand local govern ments alike.41 Worldwide, it hasbeen estimated that ‘a record 3.2 million people diedfrom air pollution in 2010, compared with 800,000in 2000’.42 The impacts of transport-related air pol lution affect all urban residents, but there is sub stantial evidence that it affects the poor andvulnerable groups more than others. In fact, the socialgroups that are most seriously impacted are often notthose that cause the pollution.43 The main groups oflocal air pollutants – nitrogen oxides, volatile organiccom pounds, carbon monoxide and particulate matter (as well as some other pollutants) – are described inBox 7.2.
Trucks and other freight carriers emit dis -proportionate amounts of pollutants in cities. Even
Nitrogen oxides (NOx) when combined with other airpollutants can lead to respiratory difficulties and reduced lungfunctions, particularly in urban areas (where densities lead tohigher concentrations). In the 32 member countries of theEuropean Environ ment Agency, trans port emissions of NOx
have reduced by 32 per cent (1990–2008) through theintroduction of catalytic converters, but this reduction hasbeen offset by some growth in traffic.a In many devel op ingcountries the add-on technology is not mandatory and traffichas been growing at a rapid rate.
Volatile organic compounds comprise a wide variety ofhydrocarbons and other substances (e.g. methane andethylene) that result from the incomplete combustion of fossilfuels. When combined with NOx in heat and sunlight,hydrocarbons and volatile organic compounds generate low-level ozone, a main contributor to photochemical smog. Theirimpact has a measurable effect on respiratory functions and asan irritation, but these levels are declining as technologiesimprove.b
Carbon monoxide (CO) is an odourless and almostcolourless gas, which is very toxic as it interferes with theabsorption of oxygen. This in turn can lead to increasedmorbidity and can affect fertility and general levels of health.The trans port sector is a major contributor as carbonmonoxide comes principally from the incomplete combustionof fuel.b
Particulate matter consists of very small particles (under 10microns in diameter: PM10), that come mainly from diesel fuels,
tyre particles and road dust. They can cause cancer, worsenheart and breathing problems for sensitive groups and maylead to premature mortality for all urban residents. Among 59 cities in Asia, Africa and Latin America, only twomeet standards for PM10, while 46 of the cities exceeded thestandard by more than twice (WHO standard is 90 milligramper cubic metre).c Cities in devel op ing countries are most atrisk, partly due to minimal enforcement. In Beijing, China, thegovern ment shut down ‘103 heavily polluting factories andtook 30% of govern ment vehicles off roads to combatdangerously high air pollution . . . but the . . . air remainedhazardous despite the measures’ in January 2013. The reasonwas that the amount of PM2.5 (particles with a diameter of lessthan 2.5 microns) reached more than 500 milligram per cubicmetre, on a scale where 300 is considered hazardous, whilethe WHO recommends a daily level of no more than 20.d
Similar high levels have also been reported in other Asiancities, such as New Delhi, India.e
Other pollutants – such as lead (Pb), ammonia (NH3) andsulphur dioxide (SO2) – have trans port links but are lessimportant than the four listed above, as they are beingreduced through the switch to different and ‘cleaner’ fuels andnew designs for catalytic converters. However, many cities stillallow the use of leaded petrol, despite the known dangers forchildren and their mental devel op ment.Sources: a EEA, 2011a; EEA, 2011b; b EC, 2006; c World Bank, 2007; d Reuters, 2013; e Stainburn and Overdorf, 2013.
Box 7.2 Air pollutants
An Australianstudy found thatenergy use insuburbanhouseholds was50 per cent higherthan those in theurban centre, andthis was explainedprimarily bygreater car useand longerjourneys

Planning and Design for Sustainable Urban Mobility136
In developedcountries, about130 millionpeople areexposed tounacceptablenoise levels
The perceiveddanger of walkingand cycling is astrongdisincentive tonon-motorizedtransport
The links betweenhealth and non-motorizedtransport need tobe emphasizedthrough educationprogrammes andthe involvementof doctors
Communityseverance dividesand fragmentscommunities, andis often a result ofheavily usedtransportinfrastructureforming a barrierso that peoplecannot cross theroad or rail track
though they make up less than 10 per cent of roadtraffic in most European cities, large commercialvehicles can cause half of all nitrogen dioxide emis -sions, about a third of particulate matter, and morethan 20 per cent of greenhouse gas emissions.44
n Noise pollutionNoise and vibration are often cited as nuisances topeople living in urban areas, but it is often the peakor unexpected noises that are most problematical.In developed countries, about 130 million people areexposed to unacceptable noise levels over 65dB(A),and 400 million to inconvenient levels of over55dB(A).45 In some ‘quiet’ countries (parts ofScandinavia) only 5 per cent of residents are exposed,while up to 30 per cent of residents in ‘noisy’ citiescan be exposed.46 Prolonged exposure to noise canlead to anxiety, depression and insomnia.47 Vibrationis caused by all vehicles, but it is heavy trucks thatcause most intrusion and this again affects sleep,increasing levels of stress and anxiety.48 Noises fromhorns are common in many cities, and car alarms alsocause nuisance to residents. In Moscow, aroundthree-quarters of the population live in areas withlevels of trans port noise that exceed WHOstandards.49
n Human health and physical activityThere are also major health effects resulting from thelack of physical activity that accompanies increasedmotorization. The perceived danger of walking andcycling is a strong disincentive to non-motorizedtransport.50 As more people travel by motorizedtransport, the risks to vulnerable road users increase,and, as a result, fewer people walk and cycle. Thereis growing evidence of the links between physicalinactivity and weight, and of the impacts that thesetwo factors have on the risk of diabetes, heart disease,colon cancer, strokes and breast cancer.51 Food-energy intake has not decreased in line withreductions in physical activity, and many countriesare experiencing an epidemic in obesity.52
According to the Global Burden of Disease Study,overweight and obesity accounts for 36 milliondisability adjusted life years (DALYs) lost, withphysical inactivity accounting for a further 32 millionDALYs.53 In the UK, about 66 per cent of adults donot get enough exercise, and the majority of thepopulation is now overweight or obese.54 The linksbetween health and non-motorized trans port needto be emphasized through education programmes andthe involvement of doctors. Copenhagen, Denmark,is often cited as a good example of a cycling city asthere are numerous initiatives, both private andpublic, to promote cycling.55
In a study of 30,000 people over a 14 yearperiod, it was found that cycling to work reducedthe risk of mortality at a given age by 39 per centrelative to those that did not cycle, and over half of
cyclists (54 per cent) cite speed and convenience astheir main reason for cycling, meaning that theirjourney times were reduced.56
n Community severance, open spaces andmental health
Community severance divides and fragments com -munities, and is often a result of heavily used trans port infra struc ture forming a barrier so thatpeople cannot cross the road or rail track. It adverselyaffects the quality of life, the level of activities onthe street and the amount of social interaction withincommunities. It is particularly important for youngpeople who are trying to socialize, and who oftencome to the understanding that the urban spacesurrounding them belongs to motorized vehiclesrather than people.57
The reallocation of space from people to carsmeans that roads are widened and the space availablefor non-motorized modes is reduced. Further more,the expansion of roads often competes with open andgreen spaces (as well as squares and other spaces thatallow people to spend time together). These spacesare important for the quality of life, and for their rolein providing the ‘lungs’ of the city. Much of thesespaces are open to the public and can be used forrecreational and sporting activities, as well asproviding habitat for wildlife and for absorbingcarbon.58
There is also evidence that traffic congestion can impair ‘health, psychological adjustment, workperformance and overall satisfaction with life’.59
Research indicates that job satisfaction and com -mitment declines with increased road commuting dis tance (but not with public transit use), and thatperceived traffic stress is associated with both lowergeneral health status and depression.60 According tothe 2011 IBM commuter pain survey, 42 per centof respondents stated that their stress levels (due tocongestion) had increased and 35 per cent reportedincreased anger.61 Additional environ mental effectsof traffic congestion include pedestrian/vehicle con -flicts on congested streets, which cause safetyconcerns and traffic delays, visual intrusion causedby elevated roads, bus stations, etc., and distortedcity image, which disturbs liveability and reducestourism potential.62
REDUCING THE NUMBER OF MOTORIZED TRIPSThere are many opportunities to reduce the need totravel by motorized transport. One is to travel by non-motorized means instead (i.e. walking or cycling).63
Cycling can be encouraged for many shorter trips (i.e.normally less than 10 kilometres), provided that theinfra struc ture is available, including space to securely

Urban Mobility and the Environment 137
1EEE234567891012311145678920123456789301234567894012345678950123456789EEEE
The city of Changwon is working towards becoming Korea’sleading ‘eco-rich city’, by improving the quality of life throughsus tain able mobility and non-motorized transportation. As apart of this effort, the ‘Nubija’ bicycle sharing system wasintroduced on 22 October 2008, with 20 parking stations(where bikes can be checked out and returned) and a total of430 bicycles.
The system has since increased steadily, and by 2011there were 163 parking stations (with 3300 bicycles). At thattime, the membership of the scheme had reached 76,579,
who ride an average of 4396 kilometres per day. By early 2012 it was reported that the number of parking stations hadreached 230.
The bicycle sharing system has led to annual emissionsreduction of more than 4000 tonnes of CO2 by 2011. Otheroutcomes have been reduced energy consumption, lowerlevels of air pollution and better public health.
Sources: ICLEI, 2010; ICLEI and Changwon City, 2011; Rhee and Bae, 2011; Sociecity,2011; Changwonderful, 2012.
Box 7.3 A successful bicycle sharing system, Changwon, the Republic of Korea
Sainsbury’s is the third largest chain of supermarkets in the UK. Sainsbury’s Online isthe internet shopping brand, where customers choose their grocery items online anditems are delivered to customers from a local store (165 stores operate an onlineservice) by van. This service is available to nearly 90 per cent of the UK population.
In 2005, Sainsbury’s Online tested Smith Electric Vehicles in its home shoppingdelivery applications in and around Central London. The year-long trial proved sosuccessful that Sainsbury’s placed an order for eight vehicles in 2007 and a further 50 in 2008. Each zero emission van will reduce emissions by 5 tonnes of CO2 per year.Source: London, undated.
Box 7.4 Internet shopping
The most effectiveway of reducingthe number oftrips . . . is that aspecific trip is nolonger made as ithas been replacedby a non-travelactivity orsubstitutedthroughtechnology
leave the bicycle. More imaginative innovations arethe cycle hire schemes that are now a feature of manycities (see for example Box 7.3), where old technology(the bicycle) has been matched up with the newtechnology (smartcards), so that bikes can be usedon demand, either free for an initial period or for areasonable charge. Another good example is that ofParis, France, which has introduced a popular bikesharing scheme (vélib) and aims to increase the city’snetwork of bike lanes to some 700 kilometres by2014.64 The co-benefits are manifest for the user(healthy and fast) and for the trans port system (lessspace is used). However, it should be noted that thepotential for increased bicycle use is related to ageand (dis)ability, as well as prevalent culturalconstraints, that may, for example, limit the use ofbicycles by women.
Unfortunately, in many cities of devel op ingcountries the promotion of cycling as an alternativeto motorized travel is fraught with danger, due tolack of dedicated bicycle lanes, forcing riders into a rather uneven competition for road space withmotorized vehicles. There are some positive devel -op ments though. The City of Buenos Aires, Argentina,for example has since 2010 developed a 94-kilometrenetwork of protected bike lanes, and introduced abike-share programme featuring more than 22stations and over 850 bikes. The City intends toexpand its bike lane network to 130 kilometres by2013.65 Similarly, the two Egyptian cities of Fayoumand Shebin El Kom are planning the construction of 14 kilometres of cycling tracks and improvedsidewalks on major streets.66
Another means to reduce the number of tripsis through trip-chaining, where several activities areundertaken on one tour (from home back to home)rather than as a series of several individual trips. Thisagain reduces overall distance travelled, but needsto be matched by the location of destinations in close proximity to each other and by mixed-landuses.67
The most effective way of reducing the numberof trips (at least in theory) is that a specific trip is nolonger made as it has been replaced by a non-travel
activity or substituted through technology, forexample internet shopping (Box 7.4). For many yearsnow there have been debates over the potential forteleworking, teleactivities and teleconferencing,68
and the more recent advent of mobile technology hasopened up many new possibilities.69 Although thereis a large substitution potential, the relationshipsseem to be symbiotic with a greater opportunity forflexibility in travel patterns, as some activities aresubstituted, while others are generated, and somereplaced by fewer longer distance journeys.70
The introduction of new technology has ex -tended to mobile phones, and these have becomeavailable worldwide, often changing lives throughallowing social and business communications. It isunclear about the implications for travel, but theeffects are likely to be positive for the environ ment,as less carbon-based energy will be used.71 Conven -tionally, the impacts of mobile phones have beengrouped into three categories: incremental (improv -ing the speed and efficiency of what people alreadydo), transformational (offering something new) andrelated to production (selling mobiles and relatedservices). The impact of mobile phones has been most profound in devel op ing countries, wheretelephone communications in the past were reservedfor the rich.72

Planning and Design for Sustainable Urban Mobility138
REDUCING TRAVELDISTANCES IN CITIESUrban spatial structure (or urban form)73 is importantin determining trans port mode and distance travelled,as it links the spatial distribution of population and jobs within the city to the pattern of trips. Thus,urban planning has a major role to play in organ-izing spatial activities in cities so that they are in closeproximity to their users. Two important factors are at work here. First, if travel distances are reducedthen accessibility is improved as activities can beunder taken with less travel. Second, if travel dis -tances are short, then it becomes more attractive towalk and cycle – particularly if space is allocated forexclusive rights of way – and to use public transport,and this in turn reduces the energy use and theenviron mental impacts of transport.
Such an approach implies that the availablestreet space in cities can be optimized for the highestnumber of users. An increased focus on urban plan -ning means that the city operates more efficiently,but it also increases equity as services and facilitiesbecome accessible to the entire population. Optim -ization of street space, however, is not only a matterof urban planning. Efficient traffic engin eering design,supply and demand management, enforcement oftraffic law and efficient governance at the city levelare necessary requisites for introducing and sustain -ing urban trans port services and facilities in devel -op ing countries.
Many cities in devel op ing countries are growingrapidly, driven by inward migration and popula-tion growth. This implies a considerable potential for urban planning to keep travel distances as shortas possible. Peripheral sprawl needs to be discouragedas it uses valuable agricultural land, because it in -creases travel distances and makes the provision ofpublic trans port more difficult. The arguments for
high urban densities are strong on both trans port andland take reasons, and cities should be encouragedto build upwards (higher buildings) and not outwards(suburban sprawl).74
Regardless of the form of the city, it is importantto develop around highly accessible public trans-port nodes so that the attractiveness of these areasis fully realized. These areas integrate land use andtrans port through the promotion of high-densitydevel op ment around accessible points and inter -changes on the public trans port network, facilitat-ing walking and cycling and increased use of publictrans port systems. Devel op ment needs to includemixed uses, covering housing, jobs, schools, shops,health facilities, educa tional services (e.g. crèches)and recreational oppor tunities, so that all activitiescan take place in one location. Such devel op mentsare particularly important for women, who often havequite complex travel patterns.75
Trans port devel op ment areas often become the new mega nodes within cities where people meetto carry out their business and social activities, andthey consequently promote social cohesion. Thesepublic trans port interchanges can thus become thenew commercial hubs for cities, for example inCanary Wharf, London (Box 7.5) and Shin Yokohama(Japan). Singapore (Table 7.4) has also constructedpublic housing close to the metro stations, and thisallows lower income people access to both housingand transport.76 Such public trans port interchangescan often be financed by developers, as has been thecase in Hong Kong, Singapore, Frankfurt and London.
Apart from the major contribution that trans portdevel op ment areas can play in encouraging sus tain -able mobility in cities, they are seen as central to theurban regeneration process that involves the creationof new city places and spaces, and there is usuallystrong community involvement so that the benefitscan be widely distributed across all social groups.
Canary Wharf is a major business and finan cial district locatedin the eastern part of London. It contains around 1.3 millionsquare metres of office and retail space and a workforce ofaround 93,000 people (in 2009). It is home to global orEuropean headquarters of numerous major banks, professionalservices firms and media organizations.
Construction began on the old docks area in 1988 aspart of a major urban regeneration programme. A key elementof the planning was to ensure high-quality access by publictrans port through the extension of the Jubilee Line metro, thenew Docklands Light Railway, improved bus services, riverboat services and cycle routes. There is little parking available,but a substantial amount of residential devel op ment has takenplace in the riverside areas surrounding Canary Wharf.
A survey was carried out in June/July 2009 within the
local areas and Canary Wharf to measure the movement ofpeople throughout the area and in particular those travellingto Canary Wharf. During the survey period only 5.1 per centof workers at Canary Wharf travelled by car, down from 6.2per cent in 2007. Cycling has increased in popularity acrossLondon and Canary Wharf is no exception. Nearly 4 per centof workers cycled to work in 2009, up from 2.9 per cent in2007.
Use of public transport, including the Jubilee Line and theDocklands Light Railway, continues to increase, especially fromareas east of Canary Wharf, reflecting the area’s rapidregeneration and the increased number of Canary Wharf-based workers living in East London. About 90 per cent of allpeople coming to Canary Wharf do so by public transport.Source: Canary Wharf Group plc, undated.
Box 7.5 Trans port accessibility to Canary Wharf, London, UK
Urban planninghas a major role toplay in organizingspatial activitiesin cities so thatthey are in closeproximity to theirusers
Regardless of theform of the city, itis important todevelop aroundhighly accessiblepublic transportnodes so that theattractiveness ofthese areas is fullyrealized

Urban Mobility and the Environment 139
1EEE234567891012311145678920123456789301234567894012345678950123456789EEEE
CHANGING THE MODAL SPLITTrans port policy has often been strongly orientatedtowards maintaining and increasing the levels ofpublic trans port use in the city. However, success hasbeen limited, as other factors have intervened, suchas increases in incomes and growing urban popula -tions. These factors have meant that the car and themotorcycle have become dominant. It is important tothe quality of life and to the environ ment that as muchurban travel as possible is undertaken by non-motorized and public transport, as these modes arethe most environ mentally efficient. In many Euro-pean cities up to 60 per cent of all trips are made by walking, cycling or public transport. A survey of26 cities in four EU countries indicated that theproportion of trips by car ranges from 17 to 73 percent. The interesting point to note from this surveyis the variability in modal shares, and that there doesnot seem to be any direct relationship betweenpopulation density (or size) and the prevalence ofspecific trans port modes.77 However, high-capacitypublic transport systems, such as BRT, can offer aviable alternative to car depen dence in cities ofdeveloping countries (see Box 7.6).
It is essential that the full cost of the energy usedin transport, including all externalities, is reflectedin the price.78 Real cost increases reduce the amountof energy used (and thus the greenhouse gases emit -ted) and reduce travel distances (as they encour-age more local travel) and the greater use of non-motorized and public transport. This full economicprice could be based on the carbon content of thefuel, but it also needs to include a number of otherexternal factors.79 There are three basic groups ofstrategies that can be used to encourage modal shiftto more energy-efficient forms of transport, namely:regulatory measures, pricing measures and invest -ments in public transport.80
Regulatory measures can place limitations on the numbers of vehicles on the road at any giventime or day. Limitations can also be placed on thenumber of new vehicles that can be registered in thecity. For example, both Beijing and Singapore use a quota system. In Singapore, the Land TransportAuthority allocates quotas for each vehicle categoryaccording to the current traffic conditions and thenumber of vehicles taken off the roads permanently(Table 7.4). The vehicle quota for a given year isadministered through the monthly release of ‘certifi -cates of entitlement’ and the certificates are allocated
Background information: Manhattan (population 1.6 million) covers Background information: Singapore has a compact urban structure 53km2 and has 35 per cent of the total regional jobs, with the Midtown supported by high-quality public transport.having 2160 jobs per hectare.
Measures: Measures:• Strict zoning with ‘floor area ratio’ 11–15.a • Restraint on car ownership, use and costs through quota system, • Mixed zoning – office, commercial, recreational and housing. electronic road pricing, fuel taxation and parking controls.• Transit system operational throughout 24 hours. • Public housing areas some located at metro stations to give easy access to • Parking spaces taxed by municipality, and most parking is provided employment.
privately and off-street. • Some decentralization to regional centres to reduce travel distances.• Increasing the subway network to 337 kilometres – transit density of • Reductions in need to travel and dependency on car though providing
56 kilometres per million population. high-quality alternatives.• Encourage walk and cycle – 21 per cent trips in New York City are walk • Rail network to double from 138 kilometres to 278 kilometres by 2020
and cycle and a further 55 per cent by mass transit. (US$14 billion) – transit density of 51 kilometres per million population • Ensure the working environ ment is intellectual, fertile and innovative. (2020).
Note: a The floor area ratio refers to the ratio of floor space to the land area of the devel op ment – so a ratio of 11 means that 11,000 square metres of floor space can be built ona piece of land measuring 1000 square metres.
Source: Based on Bertaud et al, 2009.
Table 7.4
Planning anddevelopment measurestaken in New York City and Singapore
New York City (population 8.2 million in 790km2) Singapore (population 5 million in 700km2)
The ‘Sustainable Transport Solutions in East African Cities’project (SUSTRAN) aims to reduce growth in privatemotorized vehicles, thus reducing traffic congestion andgreenhouse gas emissions in the cities of Addis Ababa(Ethiopia), Kampala (Uganda) and Nairobi (Kenya). The project– which is implemented by UN-Habitat in collaboration withUNEP with financial support from the Global EnvironmentFacility – includes support for the design and implementationof transport corridors featuring BRT, non-motorized
transport and travel demand management measures. It alsosupports regional capacity building, including city-to-citylearning. While collaborating with local metropolitan andtransport authorities, the project has promoted the activeinvolvement of current transport operators and otherstakeholders. By 2035, it is projected that this initiative willhave led to a reduction in greenhouse gas emissions amountingto more than 2.5 million tonnes. Source: http://www.unhabitat.org/SUSTRAN, last accessed 6 August 2013.
Box 7.6 Promoting sustainable transport solutions in Eastern African cities
It is important . . . that as muchurban travel aspossible isundertaken bynon-motorizedand publictransport, as these modes are . . . mostenvironmentallyefficient
Regulatorymeasures canplace limitationson the numbers ofvehicles on theroad at any giventime or day

The first two phases of the TransMilenio BRT system inBogotá, Colombia, were completed by 2003, and it has a totalof 84 kilometres of median busways, about 25 per cent ofwhich is completely segregated from other traffic. The finalphase (of another 100 kilometres, which was due to becompleted in 2012) has been delayed due to unresolvedpolitical issues (including plans to construct a metro).
By 2011, the BRT system included some 1190 articulatedbuses, 10 bi-articulated buses, 114 access stations (withprepayment), 6 terminals and 4 intermediate integratedstations. In addition there were 448 feeder buses, running on61 feeder routes with 420 line-kilometres. TransMilenio isfrequently cited as a ‘good practice’ BRT project, and it carriessome 1.7 million passen gers per weekday, with 43,000 passen -gers moving each hour in one direction. The uniqueness ofBogotá’s system is the ‘transformation of a busway corridorwith severe pollution, safety problems and aestheticallydispleasing into a new BRT system with significantly lowertravel times, lower noise and fewer greenhouse gasemissions’.a
By drastically reducing existing travel times and acting onthe radial corridors connecting residential areas to the centralbusiness district, TransMilenio has done much to reinforce theattractiveness of the city centre. Public acceptance of theproject is over 70 per cent, but there have been complaintsabout over crowding and the time taken for interchange fromthe feeder lines. Further more, many people still lack access tothe system as the network does not extend to the locationswhere the poor are living. In 2005, the population located inthe more remote parts of the city accounted for 65 per centof the total population, as the land there was cheaper and thus
more affordable for low-income people. In fact, land-use valueincreases around the TransMilenio corridors have beenestimated to be close to 20 per cent.
While the TransMilenio system has played an importantrole in contributing to more sus tain able mobility system inBogotá, it is worth noting that it was introduced as part ofwider policy package, which also included the followingcomponents:
• Devel op ment of 285,500 square metres of walkways,green spaces, road dividers, sidewalks and shadedpromenades, with 11 metropolitan parks, 3149 neigh bour -hood parks and 323 smaller scale parks.
• Construction of 350 kilometres of bikeways contributedto an increase in bicycle use from 1 per cent in 1995 to 7 per cent in 2010, when there were a total of 1498 bikeparking locations.
• In addition, the introduction of the ciclovia system impliesthat some 120 kilometres of main roads are closed tomotor vehicles for seven hours every Sunday, so thatstreets can be used by people for walking, cycling, joggingand meeting each other.
• Peak and license plate (pico y placa) restrictions duringpeak hours (6–9 am and 4–7 pm) using plate numbers for40 per cent of the private cars.
• Fees and taxes: 20 per cent petrol surcharge (revenueallocated to public trans port infra struc ture and roadmaintenance) and car-free weekday in February (approvedby popular vote).
Sources: Bocarejo and Tafur, 2011; Hidalgo and Carrigan, 2010; Hidalgo et al, 2007;Rodriquez and Targa, 2004; a Estupiñán and Rodriquez, 2008, p299.
Box 7.7 TransMilenio: Supporting sus tain able mobility in Bogotá, Colombia
140 Planning and Design for Sustainable Urban Mobility
Very few citieshave introducedpricing as amechanism tolimit the numbersof cars cominginto the centralarea
through an auction.81 In Bogotá, Colombia, the picoy placa (Box 7.7) limits the numbers of vehicles onthe road on a given day by allowing odd and evennumber plates to be used on alternative days.82
However, this latter type of measure may encouragehigher income-residents to buy a second car, oftenwith an older, less efficient engine (thus leading toincreased emissions).
Parking regulations are important as this relatesto the allocation of space in cities by price and timeof day, and it covers both on-street and off-streetlocations (Box 8.5). As part of the congestion chargingscheme in London, UK (introduced in 2003), parkingavailability was reassessed both within the pricing area(to reduce it) and outside the area to encourage com -muters to leave their cars at home.83 Many cities havealso introduced park-and-ride schemes where driversleave their cars at the periphery and continue theirjourneys into the centre by public transport. A recentsurvey of 45 schemes in Europe found rather unevenimplementation, but where deployment had takenplace there was strong public support, as traffic levelsand levels of pollution had been reduced.84
Pricing measures include electronic roadpricing (Singapore), congestion charging or cordonpricing (London, UK, and Stockholm, Sweden),85
and parking pricing to reflect the value of the spaceused. But very few cities have introduced pricing asa mechanism to limit the numbers of cars cominginto the central area, and even in those cities thathave introduced schemes, it has only covered a smallpart of the city. In addition, fuel prices are oftentaxed, although the levels vary considerably fromcountry to country, as it relates both to the levels ofduty imposed and the additional national and localtaxes imposed.86 Some countries have tried to usefuel duty escalators, so that the real price of petroland diesel increase over time to reflect the fulleconomic costs, but this has proved unpopular withthe oil industry, car manufacturers, as well asmotorists.87 All of these measures have primarily beenintroduced to raise revenues88 and to address conges -tion issues, even though it has been acknowledgedthat there are also environ mental benefits.89
Public trans port fare subsidies can have socialobjectives in increasing the mobility of low-income

1EEE234567891012311145678920123456789301234567894012345678950123456789EEEE
141Urban Mobility and the Environment
households, but it is important that such subsidy goes to the identified user. It is also important tomake sure that the quality of the public trans portfleet is maintained at a high environ mental standard,and that operators are given an incentive to invest.But sub sidies have much wider impacts on liveli -hoods, as illustrated by a study of public trans portin Sub-Saharan Africa:
‘Subsidies and other forms of compensation canhelp formal public trans port but an integratedframework and a level playing field are alsoneeded for all types of trans port to flourish.Finan cial mechanisms should be put in place tosupport the system, integrating the differenttypes of collective trans port rather than allowingprofits to be scooped up by the informal sectorwith no regard for the burden of costs they mightplace on local govern ments and society as awhole. This can include trust funds, better creditfacilities, land-value capture and other sourcesof revenues that can be used to help build sus tain able low-carbon trans port systems thatwill allow Africa to flourish and developeconomically.’90
As noted above, subsidization is a form ofincentive to encourage people to change theirbehaviour, and it can also apply to cars. For example,incentives can be given to encourage the purchaseof more efficient cars and electric vehicles, wherepurchase prices are subsidized, or where preferentialparking is given, or exemption from paying thecongestion charge is given. All three of theseincentives have been introduced in the UK.91
Investment in public trans port and publictrans port infra struc ture are both central to makesure that priority is given to this trans port mode, asit allows the greatest number of people to be carriedmost efficiently. Public trans port has to share spaceon congested roads with other traffic, and this re -duces its efficiency. Trams have provided one effec -tive means to introduce ‘clean’ trans port that has aclear priority through control (traffic signals) andexclusive tracks.92
More recently, BRT is seen as a flexible andcheap means to invest in high-quality public trans -port with a separate right of way.93 As discussed inChapter 3, BRT potentially offers a high-capacity,relatively inexpensive and flexible form of publictrans port in many cities. BRT systems have good envir -on mental credentials and can be introduced in avariety of different forms. Box 7.7 looks at how BRTcan be combined into part of an integrated set ofmeasures that have the potential to change percep -tions of public transport.
TECHNOLOGICALINNOVATION AND VEHICLEEFFICIENCYThis section presents technological and other policyresponses related to increasing the efficiency ofmotorized vehicles and the use of the best availabletechnology. This implies that the use of carbon-based fuels should be substantially reduced andcleaner low-carbon fuels should replace them for allforms of motorized trans port (freight and passen ger).As noted earlier in this chapter, the amount of CO2produced by motorized vehicles is directly related tothe amount of fuel used, and there is considerablepotential for reductions.94
However, it should be remembered that effi -ciency gains must be set against the growth intraffic,95 as this often outweighs those gains. Thediscussion below focuses on four main issues, namely:the efficiency and age of the vehicle stock, standardsof fuels used in vehicles, the potential of alternativefuels, and vehicle occupancy.
It is here important to note that there is asubstantial potential for technological ‘leapfrogging’.Thus there is no reason why cities in devel op ingcountries have to follow the same high-motorization(and high-pollution) pathway as that followed indeveloped countries. Rapid urbanization in manydevel op ing countries thus presents an opportunityto invest in the low-carbon city trans port system ofthe future. That having been said, it is important tonote that this cannot be undertaken without sub -stantial finan cial support from the developed coun -tries. This means that effective mechanisms need tobe established, such as the fuel security credits beingtested by the Asian Devel op ment Bank,96 or initiativesunder the clean devel op ment mechanism of theKyoto Protocol.97
Efficiency and age of the vehicle stock
The scale of any emission reduction is dependent ona set of factors such as the efficiency and turnoverrate of the vehicle stock, the distance driven by eachvehicle, and the tendency to buy larger and heaviervehicles. New vehicle technology has reduced thefuel use per unit of power by 50 per cent over a 15year period (1990–2005), yet most of that potentialsaving has been negated by the overall increase inpower and weight, particularly in the US. Thus thenet effect has been no change.98
The introduction of new technologies does not,however, lead to immediate cuts in emissions. Theefficiency of any single vehicle on the road is alwayslower than that of the newest technology. In general,this implies that overall emissions depend on theaverage age of the vehicle fleet in any particularcountry (or city). And, in the countries with the oldest
Public transportfare subsidies canhave socialobjectives inincreasing themobility of low-incomehouseholds, but itis important thatsuch subsidy goesto the identifieduser
Investment inpublic transportand publictransportinfrastructure areboth central tomake sure thatpriority is given tothis transportmode
Efficiency gainsmust be setagainst the growthin traffic, as thisoften outweighsthose gains
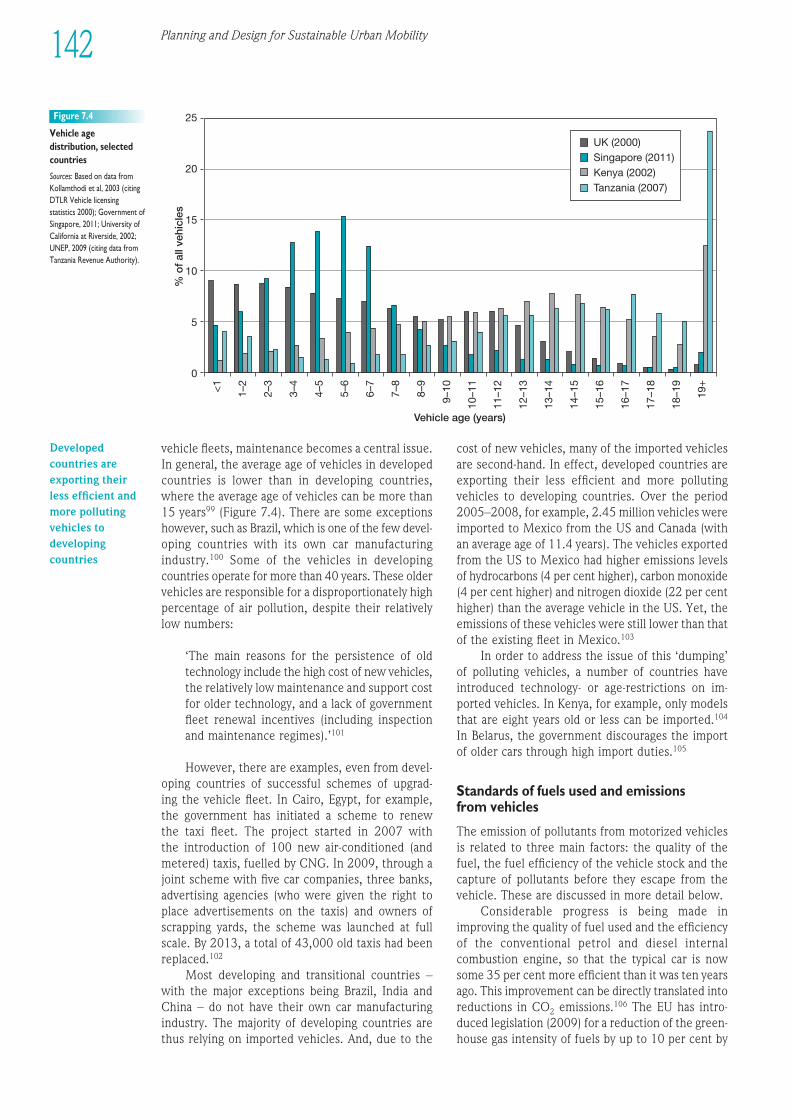
Planning and Design for Sustainable Urban Mobility142
vehicle fleets, maintenance becomes a central issue.In general, the average age of vehicles in developedcountries is lower than in devel op ing countries,where the average age of vehicles can be more than15 years99 (Figure 7.4). There are some exceptionshowever, such as Brazil, which is one of the few devel -op ing countries with its own car manufacturingindustry.100 Some of the vehicles in devel op ingcountries operate for more than 40 years. These oldervehicles are responsible for a disproportionately highpercentage of air pollution, despite their relativelylow numbers:
‘The main reasons for the persistence of oldtechnology include the high cost of new vehicles,the relatively low maintenance and support costfor older technology, and a lack of govern mentfleet renewal incentives (including inspectionand maintenance regimes).’101
However, there are examples, even from devel -op ing countries of successful schemes of upgrad-ing the vehicle fleet. In Cairo, Egypt, for example,the govern ment has initiated a scheme to renew the taxi fleet. The project started in 2007 with the introduction of 100 new air-conditioned (andmetered) taxis, fuelled by CNG. In 2009, through ajoint scheme with five car companies, three banks,advertising agencies (who were given the right toplace advertisements on the taxis) and owners ofscrapping yards, the scheme was launched at fullscale. By 2013, a total of 43,000 old taxis had beenreplaced.102
Most devel op ing and transitional countries –with the major exceptions being Brazil, India andChina – do not have their own car manufacturingindustry. The majority of devel op ing countries arethus relying on imported vehicles. And, due to the
cost of new vehicles, many of the imported vehiclesare second-hand. In effect, developed countries areexporting their less efficient and more pollutingvehicles to devel op ing countries. Over the period2005–2008, for example, 2.45 million vehicles wereimported to Mexico from the US and Canada (withan average age of 11.4 years). The vehicles exportedfrom the US to Mexico had higher emissions levelsof hydrocarbons (4 per cent higher), carbon monoxide(4 per cent higher) and nitrogen dioxide (22 per centhigher) than the average vehicle in the US. Yet, theemissions of these vehicles were still lower than thatof the existing fleet in Mexico.103
In order to address the issue of this ‘dumping’of polluting vehicles, a number of countries haveintroduced technology- or age-restrictions on im -ported vehicles. In Kenya, for example, only modelsthat are eight years old or less can be imported.104
In Belarus, the govern ment discourages the importof older cars through high import duties.105
Standards of fuels used and emissionsfrom vehicles
The emission of pollutants from motorized vehiclesis related to three main factors: the quality of thefuel, the fuel efficiency of the vehicle stock and thecapture of pollutants before they escape from thevehicle. These are discussed in more detail below.
Considerable progress is being made inimproving the quality of fuel used and the efficiencyof the conventional petrol and diesel internalcombustion engine, so that the typical car is nowsome 35 per cent more efficient than it was ten yearsago. This improvement can be directly translated intoreductions in CO2 emissions.106 The EU has intro -duced legislation (2009) for a reduction of the green -house gas intensity of fuels by up to 10 per cent by
25
20
15
10
5
0
% o
f al
l veh
icle
s
UK (2000)Singapore (2011)Kenya (2002)Tanzania (2007)
<1
1–2
2–3
3–4
4–5
5–6
6–7
7–8
8–9
9–10
10–1
1
11–1
2
12–1
3
13–1
4
14–1
5
15–1
6
16–1
7
17–1
8
18–1
9
19+
Vehicle age (years)
Figure 7.4
Vehicle agedistribution, selectedcountries
Sources: Based on data fromKollamthodi et al, 2003 (citingDTLR Vehicle licensingstatistics 2000); Govern ment ofSingapore, 2011; University ofCalifornia at Riverside, 2002;UNEP, 2009 (citing data fromTanzania Revenue Authority).
Developedcountries areexporting theirless efficient andmore pollutingvehicles todevelopingcountries

Urban Mobility and the Environment 143
1EEE234567891012311145678920123456789301234567894012345678950123456789EEEE
2020 – a ‘low carbon fuel standard’. This will beachieved through the greater use of renewable energyin electric vehicles, and the use of biomass sources,such as bio ethanol that is already mixed with fuel(5 per cent).107
Even though diesel vehicles produce less CO2per unit of distance travelled, their increasingdominance in the vehicle fleet (both passen ger andfreight) has been negated by the greater distancestravelled. Diesel vehicles also tend to have largeremissions of other pollutants, such as nitrogen oxidesand particulate matter (Box 7.2). As a result, theWHO has recently stated that diesel exhaust causescancer, and has called for tighter emission standards,comparing the risk of exhaust to second-handcigarette smoke.108
In India, the fuel quality standards for trans portfuels are legislated under the environ mentalProtection Act (which follows the EU specifications).New specifications have been introduced in twophases, first applied in 13 major cities109 and thenfollowed by nationwide implementation. India hasused unleaded petrol nationwide since 2000.110
Reductions in the sulphur levels in diesel havemajor effects on emissions, as many devel op- ing countries have very high sulphur levels111 indiesel fuels. Reducing sulphur to very low levels112
also reduces the emissions of particulate matter, andit enables emission control technologies that provideeven greater emission reductions (i.e. diesel oxidationcatalysts and diesel particulate filters).113 For petrolvehicles, low sulphur levels114 in fuel improve theperformance of catalytic converter systems that arestandard in developed countries. Low sulphur levelsare now being introduced in most devel op ingcountries as well, through the importation of newand second-hand cars.115
Govern ments are increasingly looking towardsvehicle manufacturers to improve the fuel efficiency
of the vehicle stock. Many govern ments are nowsetting more challenging mandatory targets for fuelefficiency in new vehicles, and this single action willsubstantially reduce CO2 and other emissions fromthe trans port sector.116 The EU tried, unsuccessfully,to introduce voluntary agreements with the vehiclemanufacturers during the last decade. It is onlyrecently (2009) that mandatory targets have been set.However, the fact that good progress has already beenmade towards these targets may suggest that thetargets are not tough enough. Figure 7.5 shows thatthere is a clear downward trend in the emissions ofCO2 from new vehicles and the fleet-wide mandatorytargets set by the EU will be a benchmark for othermanufacturers.
Many pollutants can be filtered out through the use of catalytic converters, particulate traps andother technologies, although this means that addi -tional costs are imposed on vehicle owners. It is,however, also important to ensure that the filters areworking effectively, and this again relates to regularmaintenance and testing of vehicles. Catalyticconverters do not work when engines are cold, andso for many short journeys the pollutants are notbeing filtered out. Regulations in Europe havegradually been tightened up so that emissions levelsfor all vehicles (including freight vehicles) conformto EU standards.117 These standards are also beingadopted elsewhere, for example in Russia118 andChina.119 The US and Japan have their own emissionsstandards that have been tougher than those in theEU until 2000, but all three have since followedessentially the same path and are converging towardszero emissions for all pollutants.
Due to the fact that the emission standards onlyapply to new vehicles, it takes a considerable timebefore their full benefits are realized, as existing oldervehicles have to be scrapped and replaced by newvehicles.120 Despite the clear intentions to reduce
270
250
230
210
190
170
150
130
110
90
2002 2004 2006 2008 2010 2012 2014 2016 2018 2020 2022
Gra
ms
CO
2 p
er K
ilom
eter
(NE
DC
Tes
t C
ycle
)
United States
California
European Union
Japan
China
AustraliaRep. of Korea
Figure 7.5
Actual and projectedgreenhouse gasemissions from newpassen ger vehicles, bycountry and region
Note: Solid lines are enacted;dotted lines are proposed orcontested.
Source: UNEP, 2009.
Governments areincreasinglylooking towardsvehiclemanufacturers toimprove the fuelefficiency of thevehicle stock
It takes aconsiderable timebefore [the] fullbenefits [ofemissionstandards] arerealized, asexisting oldervehicles have tobe scrapped andreplaced by newvehicles

144 Planning and Design for Sustainable Urban Mobility
key emissions from vehicles, in practice it will take10–15 years to work its way through the entirevehicle stock in developed countries. In devel op ingcountries, with their considerably older vehicle stockit will take even longer.
Add-on technology (principally the catalyticconverter), cleaner fuels and more efficient andlighter vehicles have helped reduce the levels ofpollutants from petrol engine vehicles by 80 per cent.There are, however, questions about whether thetechnology is working efficiently and the rate ofchange in the existing vehicle fleet, particularly inthose cities with the most rapid increase in levels ofcar ownership. Further more, there are still concernsover whether the same levels of air quality improve -ment can be achieved in diesel vehicles.121 And, theproblem of particulates is still present as this resultsfrom fuels (diesel), from tyres and from other sources,and this is much harder to control (and is a particularproblem for freight trucks in urban areas).
The belief that add-on technology can ‘solve’ the air quality issue is too simple. As noted above,there are important limitations relating to whetherthe catalytic converters are working, whether dieselemissions can be controlled effectively, the timetaken for all vehicles to be fitted, and the slowswitch to alternative fuels. When set against thegrowth in car ownership and use, the catalytic con -verter really only gives a maximum of ten years‘breathing space’ before pollution levels start to riseagain. In the US, for example, the catalytic converterhas been compulsory since 1979, and the full benefitshave already worked their way into the entire carfleet. The CO2 problem has not been addressed, asreduction in fuel use is the only means to reducesuch emissions.122
Alternative fuels
In order to reduce the dependence on oil – and toreduce the emissions of greenhouse gases and otherpollutants – there has been much debate over theintroduction of alternative fuels in the trans portsector. However, while searching for alternatives, itis important to keep in mind the fact that bothpetrol and diesel have very high energy densities,123
and that there have already been substantialinvestments in support infra struc ture in mostcountries (e.g. fuel stations). Thus, alternatives needto have a high energy output and they must beproduced cleanly and cheaply, and in sufficientquantities.
In the near future, it is unlikely that anyalternative fuel can replace the established oil-basedsources of fuel, as they cannot be produced (ordistributed) in the quantities required. This meansthat all alternative fuels are likely to be niche markets.However, these may in turn develop to mass-marketoptions in the longer term. In situations where there
is less established supporting infra struc ture (e.g. indevel op ing countries), the introduction of new fuelsmay happen earlier. This provides an opportunity toinitiate new solutions to urban motorization in devel -op ing countries. This is already evident in somecountries through the use of BRT and electric vehicles(including e-bikes).
In terms of policy, the EU seeks to halve the use of conventionally fuelled cars by 2030, to phasesuch cars out of cities by 2050, and to achievecarbon-free goods movement in cities by 2030. TheEU believes that technological innovation will play amajor role in this process, combined with regulationsand standards being set by individual govern ments,demand management, road pricing and local city-levelcontrols.124
The public discussion related to alternative fuelsstarted with a focus on greater efficiency withinexisting internal combustion engines. As discussedabove, efficiency levels have improved substantially,and a further halving of CO2 emissions is expectedover the next ten years (Figure 7.5). Public debatehas since moved onto biofuels and hydrogen.However, the potential of biofuels has been restrictedby the conflicts arising from increasing food prices,as increasing production of energy crops has led toreduced areas of agricultural land producing foodcrops.125 The production of liquid fuels from sugar,biomass and cellulose also requires huge amounts ofwater. Likewise, the potential of hydrogen as a cleanfuel has been questioned because of the energyrequired in its production (often from carbonproducts, such as oil or coal), and because of issuesrelated to the storage and distribution of thehydrogen.126
More recently, the electric vehicle has emergedas a more suitable alternative for urban transport.Such vehicles include hybrid electric vehicles, plug-in hybrid electric vehicles127 and other electricvehicles (including battery-driven vehicles). Increaseduse of such vehicles would solve many of the localpollution problems. However, the energy still has tobe generated (often from coal), and there are issuesrelating to the recharging infra struc ture, the use ofmaterials and the need for a lifecycle approach toenergy use and emissions.128
The most positive devel op ments have comefrom hybrid vehicles that combine conventionalinternal combustion engine with electric vehicletechnology, as this allows both electric power at lowspeeds and a combination of internal combustionengine and electric power at higher speeds. In suchhybrid vehicles, the conventional engine is supportedby a battery that can be recharged while the vehicleis being used. Greenhouse gases and other pollutantsare still being emitted, but these vehicles provide adirect substitute for the conventional car, but useonly about 60 per cent of the fuel. Over the lifetimeof the car it is likely that there are cost savings to
The belief thatadd-on technologycan ‘solve’ the airquality issue is toosimple
In the near future,it is unlikely thatany alternativefuel can replacethe establishedoil-based sourcesof fuel, as they cannot beproduced (or distributed) in the quantitiesrequired
The most positivedevelopmentshave come fromhybrid vehiclesthat combineconventionalinternalcombustionengine withelectric vehicletechnology
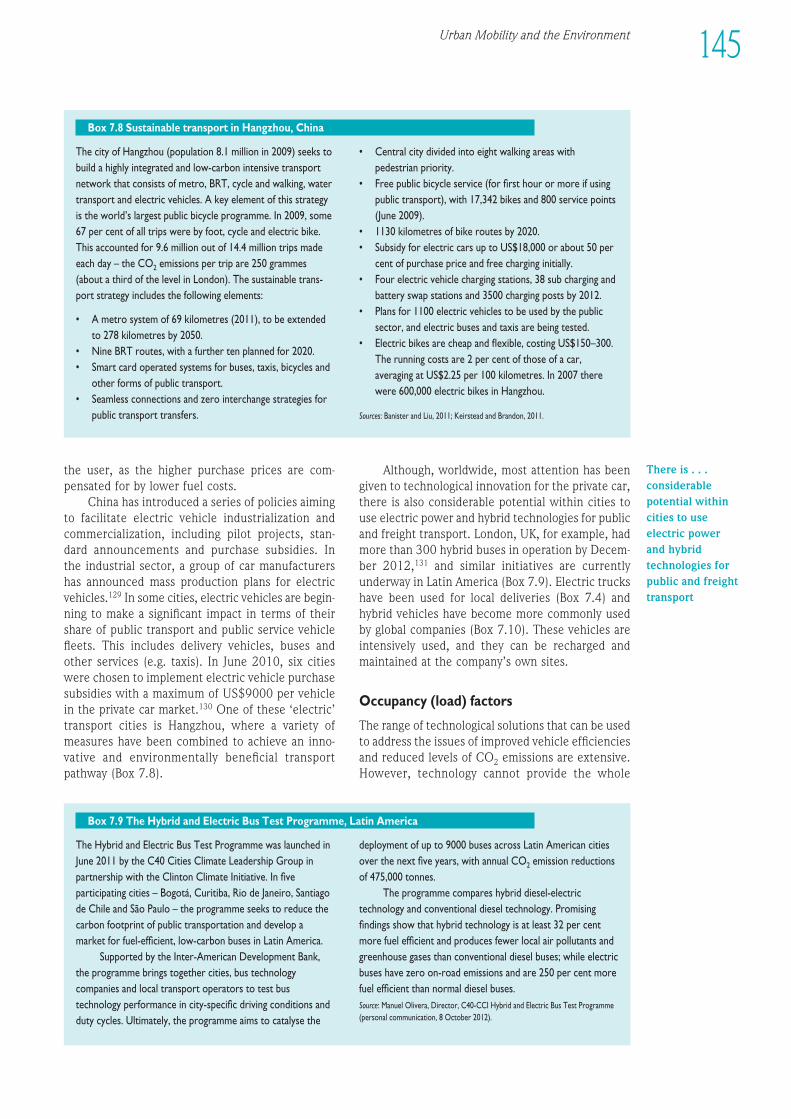
The city of Hangzhou (population 8.1 million in 2009) seeks tobuild a highly integrated and low-carbon intensive trans portnetwork that consists of metro, BRT, cycle and walking, watertrans port and electric vehicles. A key element of this strategyis the world’s largest public bicycle programme. In 2009, some67 per cent of all trips were by foot, cycle and electric bike.This accounted for 9.6 million out of 14.4 million trips madeeach day – the CO2 emissions per trip are 250 grammes(about a third of the level in London). The sus tain able trans -port strategy includes the following elements:
• A metro system of 69 kilometres (2011), to be extendedto 278 kilometres by 2050.
• Nine BRT routes, with a further ten planned for 2020.• Smart card operated systems for buses, taxis, bicycles and
other forms of public transport.• Seamless connections and zero interchange strategies for
public trans port transfers.
• Central city divided into eight walking areas withpedestrian priority.
• Free public bicycle service (for first hour or more if usingpublic transport), with 17,342 bikes and 800 service points(June 2009).
• 1130 kilometres of bike routes by 2020.• Subsidy for electric cars up to US$18,000 or about 50 per
cent of purchase price and free charging initially.• Four electric vehicle charging stations, 38 sub charging and
battery swap stations and 3500 charging posts by 2012.• Plans for 1100 electric vehicles to be used by the public
sector, and electric buses and taxis are being tested.• Electric bikes are cheap and flexible, costing US$150–300.
The running costs are 2 per cent of those of a car,averaging at US$2.25 per 100 kilometres. In 2007 therewere 600,000 electric bikes in Hangzhou.
Sources: Banister and Liu, 2011; Keirstead and Brandon, 2011.
Box 7.8 Sus tain able trans port in Hangzhou, China
The Hybrid and Electric Bus Test Programme was launched inJune 2011 by the C40 Cities Climate Leadership Group inpartnership with the Clinton Climate Initiative. In fiveparticipating cities – Bogotá, Curitiba, Rio de Janeiro, Santiagode Chile and São Paulo – the programme seeks to reduce thecarbon footprint of public transportation and develop amarket for fuel-efficient, low-carbon buses in Latin America.
Supported by the Inter-American Devel op ment Bank,the programme brings together cities, bus technologycompanies and local trans port operators to test bustechnology performance in city-specific driving conditions andduty cycles. Ultimately, the programme aims to catalyse the
deployment of up to 9000 buses across Latin American citiesover the next five years, with annual CO2 emission reductionsof 475,000 tonnes.
The programme compares hybrid diesel-electrictechnology and conventional diesel technology. Promisingfindings show that hybrid technology is at least 32 per centmore fuel efficient and produces fewer local air pollutants andgreenhouse gases than conventional diesel buses; while electricbuses have zero on-road emissions and are 250 per cent morefuel efficient than normal diesel buses.Source: Manuel Olivera, Director, C40-CCI Hybrid and Electric Bus Test Programme(personal communication, 8 October 2012).
Box 7.9 The Hybrid and Electric Bus Test Programme, Latin America
the user, as the higher purchase prices are com -pensated for by lower fuel costs.
China has introduced a series of policies aimingto facilitate electric vehicle industrialization andcommercialization, including pilot projects, stan-dard announcements and purchase subsidies. In the industrial sector, a group of car manufacturershas announced mass production plans for electricvehicles.129 In some cities, electric vehicles are begin -ning to make a significant impact in terms of theirshare of public trans port and public service vehiclefleets. This includes delivery vehicles, buses andother services (e.g. taxis). In June 2010, six citieswere chosen to implement electric vehicle purchasesubsidies with a maximum of US$9000 per vehiclein the private car market.130 One of these ‘electric’trans port cities is Hangzhou, where a variety ofmeas ures have been combined to achieve an inno -vative and environ mentally beneficial trans portpathway (Box 7.8).
Although, worldwide, most attention has beengiven to technological innovation for the private car,there is also considerable potential within cities touse electric power and hybrid technologies for publicand freight transport. London, UK, for example, hadmore than 300 hybrid buses in operation by Decem -ber 2012,131 and similar initiatives are currentlyunderway in Latin America (Box 7.9). Electric truckshave been used for local deliveries (Box 7.4) andhybrid vehicles have become more commonly usedby global companies (Box 7.10). These vehicles areintensively used, and they can be recharged andmaintained at the company’s own sites.
Occupancy (load) factors
The range of technological solutions that can be usedto address the issues of improved vehicle efficienciesand reduced levels of CO2 emissions are extensive.However, technology cannot provide the whole
1EEE234567891012311145678920123456789301234567894012345678950123456789EEEE
145Urban Mobility and the Environment
There is . . .considerablepotential withincities to useelectric powerand hybridtechnologies forpublic and freighttransport

solution to the environ mental impacts of urbanmobility. Improved vehicle standards, better fuels,alternative fuels and innovation can all make animportant contribution, but effective policy actionshere need to be combined with strategies to reducethe need to travel, the distances travelled and themodes of trans port used (see below).
Underlying all strategies, however, is theimportance of vehicle occupancy (freight and passen -ger), and the efficiency figures illustrate the import -ance of occupancy (or load) (Box 7.11). Fully ladenvehicles (public and private, freight and passen ger)are far more efficient than empty ones. This alsoreduces environ mental impacts, improves the qualityof the urban area and contributes to reducingcongestion.
‘High-occupancy vehicle’ lanes or car-pool laneshave been introduced in some cities (primarily indeveloped countries) to increase vehicle occupan-cies. Vehicles that travel in a high-occupancy vehiclelane must carry at least one (sometimes two) passen -gers in addition to the driver. Some high-occupancyvehicle lanes are in operation only during certainhours. Outside of those hours, they may be used byall vehicles.132 High-occupancy vehicle lanes have also been introduced in some devel op ing coun-
tries. On such example is South Africa where suchlanes have been introduced to facilitate bus trans -port in particular.133 According to critics, however,few buses are using these lanes – primarily becausethe lanes are on the wrong side of the road withrespect to loading and off-loading of passen gers,forci ng buses to constantly change lanes – and, dueto lack of controls, these lanes are now used primarilyby private cars.134
THE COMPOSITE SOLUTIONThe preceding sections have presented a number ofexamples of interventions to enhance environ -mentally sus tain able urban mobility systems. Each of the examples has illustrated the impact of specifictypes of policies. In most cases of successful imple -mentation, however, it is not a single policy that hasbeen introduced – but rather a package of measures.Such ‘packages’ are more likely to gain publicacceptance, and they allow a mixture of policies thatmay be seen as dis advan tageous to individual users,but promote overall welfare gains to society (see forexample Box 7.7). Yet, while policy packaging cancertainly support effective and efficient policy-making(not least through enhancing interventions’ imple -mentation and the ex-ante mitigation of unintendedeffects), the packaging process requires a deep andholistic appreciation of policy subsystems, togetherwith a structured approach, if its benefits are to begenuinely realized.135
To promote the environ mental argument it isimportant to consider a wide range of effects thatcontribute co-benefits. For example, health can beviewed in three main ways, as less motorized trafficor ‘cleaner’ vehicles improve local air quality, asslower travel leads to improvements in road safetyand as non-motorized trans port has direct healthbenefits. In addition, these improvements are likelyto have a positive effect on climate change throughreductions in CO2 emissions. All these factors leadto important co-benefits that need to be included inall environ mental evaluation.
In order to achieve the EU 2050 target of zerocarbon emissions from trans port in cities136 somecommunities have started moving towards the ‘car-free city’. One such community is Vauban (inFreiburg, Germany). It was constructed on a scalethat facilitates movement by local public transport,walking and cycling (Box 7.12). Vauban offers oneexample of how many of the different elementsoutlined in this chapter can be brought together intoa coherent set of proposals. Based on this experi enceit seems that urban residents can live in a car-freeenviron ment, provided that: the right trans port linksare established (i.e. to the main station and the city
New regulations in many cities restrict access to the city centre based on the age andload of the vehicle:
• In Amsterdam (the Netherlands), a truck may make deliveries in limited accesszones if it meets the following four conditions: it must be less than eight years old,meet the Euro II standard, have a maximum length of 10 metres, and load orunload at least 80 per cent of its merchandise in the central city.
• In London, the Low Emission Zone (set up in 2008) prohibits trucks older than theEuro III standard to enter the metropolitan area (the area surrounded by the M25highway, totalling 1580 square kilometres).
• In Tokyo, since 2003, the most polluting diesel vehicles have been prohibited fromthe city centre.
Source: World Bank and DfID, 2009, p23.
Box 7.11 Freight loads and emissions standards
A number of global delivery companies (FedEx, DHL, TNT and UPS) have testedhybrid delivery trucks and these are slowly beginning to be introduced into their fleets.FedEx together with Eaton Corporation have developed a diesel hybrid electric vehicledelivery truck and launched a pilot project with 20 hybrid electric vehicle diesel trucks(in 2004). The Eaton truck is a medium weight pick-up delivery truck that operates inurban areas with many short stops for collection and delivery. By 2009 FedEx had afleet of 264 hybrid electric trucks, and they have covered more than 4 million miles ofservice (2004–2009), reducing fuel use by more than 570,000 litres and CO2 emissionsby 1521 metric tonnes.Source: FedEx, undated.
Box 7.10 Hybrid trucks
146 Planning and Design for Sustainable Urban Mobility
Urban residentscan live in a car-free environment,provided that: theright transportlinks areestablished . . . ;there are localfacilities andservices; andthere aresufficient reasonsfor not owning acar

Vauban is a small community of 5500 inhabitants and 600 jobs, 4 kilometressouth of the town centre of Freiburg (Germany). It was started in 1998 as ‘asus tain able model district’ on the site of a former military base. Althoughthe Vauban community itself is small, it is mixed with considerable levels ofinvolvement of the local people in helping to decide priorities andalternatives (the Forum Vauban). The guiding mobility principle has been totry to reduce the use of the car, but giving residents the flexibility to use acar where necessary. This is matched by high-quality public transport,walking and cycling facilities.
Within Vauban, movement is mainly by foot and bicycle, and there is atram link to Freiburg (2006). Cycling is the main mode of trans port for mosttrips and most activities, including commuting and shopping. The town is laidout linearly along the tracks so that all homes are within easy walkingdistance of a tram stop. The speed limit on the district’s main road is 30kilometres per hour, while in the residential area cars should not drivefaster than ‘walking speed’ (5 kilometres per hour). About 70 per cent ofthe households have chosen to live without a private car (2009), and thelevel of car ownership (and use) has continued to fall. In the past, more thanhalf of all households owned a car, and among those who are now living carfree, 81 per cent had previously owned one and 57 per cent gave up theircars on or immediately after moving to Vauban.
The trans port network in Vauban adopts a complex combination grid,with three types of streets: collector roads, local streets andpedestrian/bicycle paths. As indicated in the drawing, most local streets arecrescents and cul-de-sacs. While they are discontinuous for cars, theyconnect to a network of pedestrian and bike paths that permeate the entireneigh bour hood. In addition, these paths go through or by open spacesadding to the enjoyment of the trip.
Further more, most of Vauban’s residential streets lack parking spaces.Vehicles are allowed to drive in these streets (at walking pace) to pick upand to deliver, but are not allowed to park, and enforcement is based onsocial consensus. Each year, households are required to sign a declarationindicating whether they own a car. If they do, they must buy a space in one
of the multi-storey car parks on the periphery (at an annual cost of €18,000in 2008).
The implementation of the traffic concept in Vauban meant that newlaws were needed to accommodate the current building regulations in thefederal state of Baden-Württemberg. The Association for Car-free Living inVauban (Verein für autofreies Wohnen) was founded as a legal body for theimplementation of the concept. For those that want the occasional use of acar, the car sharing company Freiburger Auto Gemeinschaft offers cars foroccasional use by residents of Vauban, and they are parked in thecommunity car park. Those in the car-sharing scheme have access to theshared cars and they also receive a one-year free pass for all publictransportation within Freiburg, as well as a 50 per cent reduction on everytrain ticket for one year.
Sources: Forum Vauban, 1999; Scheurer, 2001; Nobis, 2003; Melia, 2006 and 2010.
Box 7.12 Car-free living: Vauban, Germany
Collector road
Circulation in Vauban
Local streets
Pedestrian/bike paths
1EEE234567891012311145678920123456789301234567894012345678950123456789EEEE
147Urban Mobility and the Environment
centre of Freiburg); there are local facilities andservices; and there are sufficient reasons for notowning a car (e.g. limited and costly parking).
Similarly, in order to improve public transport,a series of policy interventions are necessary tocreate a positive overall experi ence. This includesinvestments in new infra struc ture (including vehicles,routes and maintenance), electronic ticketing (smartcards), 24-hour availability and the feeling of safetyand security. Another essential requirement isorganizational change that allows seamless traveland short interchanges between modes (includingboth route and fare integration). Further more, high levels of public trans port occupancy137 and usepermits, lower fares and extensive networks for allusers are central to sus tain able urban mobility. Allthese factors increase the efficiency of trans port inthe city, and in turn result in environ mental and otherco-benefits (e.g. safety, health and noise). Comple -mentary actions include the slowing down of urban
traffic, the allocation of space to public transport,strong parking controls and road pricing. All of theseinterventions are likely to maximize the use of publictransport.
In addition to prioritizing public transport,investment in separate cycle and pedestrian networkswould strengthen the commitment to promotingnon-motorized transport. The available trans portspace in the city should be determined and allocatedbased on prioritization of low-carbon transport,demand management and the identification of priorityusers (and uses). However, it is important to keepin mind that measures to encourage modal shiftmust be combined with strategies to make the bestuse of the ‘released space’ so that there is a netreduction in motorized traffic.138 Such an approachintroduces the much wider notion of the street, asroad space is no longer considered only as a road butas a space for people, green modes and publictransport. Creative use of that space at different times
The availabletransport space inthe city should bedetermined andallocated based onprioritization oflow-carbontransport, demandmanagement andthe identificationof priority users(and uses)

• Switching trans port mode from air to sea. • Green travel plans are in operation at a number of sites to encourage • Optimizing its European road freight network by improving vehicle employees to reduce the environ mental impact of their travel by sharing
load configuration to maximize use of the available capacity and using vehicles, using public trans port or by cycling to work.fewer trucks. • The distance flown on company business fell by more than 200 million
• Warehousing improvements – lower stock levels. kilometres and nearly 85,000 fewer single flights were made in 2010 • Reducing the number of external warehouses to cut travel between compared to 2009.
sites and the warehouses. • Significant investment has been made in videoconferencing systems, with • Installing intelligent lighting controls and energy efficient lighting. over 500 videoconference rooms in 68 countries. Other technology • Consolidation of refrigerated storage units. includes teleconferencing, desktop and personal videoconference units • Using energy efficient forklift truck charging. and web conferencing. In 2010, there was a 40 per cent increase in the
use of videoconferencing compared to 2009.
Source: GlaxoSmithKline, 2011.
Table 7.5
GlaxoSmithKline – 2010corporate responsibilityreport
Freight transport Employee transport
148 Planning and Design for Sustainable Urban Mobility
The existingcarbon market isnot appropriatefor the transportsector, and aseparate sector-based mechanismmay be required
of the day or days of the week means that new usescan be encouraged (e.g. street markets and playzones).
The experi ence of GlaxoSmithKline, one of thelargest pharmaceutical companies in the world,exemplifies how private-sector companies can reducetheir greenhouse gas emissions, and thus contributeto more environ mentally sus tain able urban transport.The fact that such initiatives are also of finan cialbenefit to the company should provide additionalencouragement for other companies to reduce someof the negative environ mental externalities of theiroperations. Table 7.5 outlines measures implementedby GlaxoSmithKline in 2010 with respect to thecompany’s freight and employee transport. However,more recent data indicate that the company’s totaltrans port emissions grew by 8.4 per cent in 2011,thus cancelling out the gains made in 2010.139
FUNDING MECHANISMSFOR ENVIRON MENTALLYSUS TAIN ABLE URBANMOBILITY SYSTEMSWhile Chapter 8 contains a more elaborate discus-sion of funding for urban trans port investments, itis appropriate here to make a brief reference to globalfinan cial options that are directly related to environ -mental sus tain ability. So far, the mechanisms devisedto address such funding have not been effectivelyused in cities or in the trans port sector. Out of the 6660 clean devel op ment mechanism projectsregistered by 1 April 2013, only 28 were related totransport.140 Another ten projects were under valida -tion, or in the process of being registered.141 Theclean devel op ment mechanism is one of the threeflexible mechanisms under the Kyoto Protocol. Theclean devel op ment mechanism enables the imple -mentation of emissions reduction projects in devel -op ing countries to earn ‘carbon credits’, which canthen be sold internationally (thus being rewarded
for having reduced emissions). By purchasing suchcarbon credits, developed countries can meet partsof their emissions reduction targets (by paying forthe right to pollute).142
Unfortunately, such carbon emissions tradingfavours the cheaper projects, which may not have thegreatest potential to reduce greenhouse gas emis-sions over the longer period. Most trans port projectsare expensive as they require up-front investment or the devel op ment of new fuels and technologies.Apart from the scale of change needed in the trans -port sector, the emissions are diffuse and hard tomeasure, as is the reliable baseline and the need to define project boundaries so that a consistentmonitoring framework can be established. Thus, theexisting carbon market is not appropriate for thetrans port sector, and a separate sector-based mechan -ism may be required.
Alternatively, there could be a greater roleallocated to cities to reduce greenhouse gas emis-sions in trans port and to adopt national appropriatemitigation actions143 for city-scale application. Cer -tainly, there is a strong case to integrate existingfunding mechanisms available for climate changemitigation – such as the Global Environ ment Facility(GEF),144 the environ mental fiscal reform145 andofficial devel op ment assistance – in the clean devel -op ment mechanism.146
Further more, there may be considerable poten -tial for emerging cities and countries to follow a lesscarbon-intensive pathway when it comes to trans-port. The Sus tain able Fuel Partnership,147 for exam -ple, is examining the rationale behind a new marketmechan ism to provide energy incentives for improv -ing energy security in the Asia-Pacific region bytreating energy security as a public good that can bevalued and translated into a cash flow, and therebyto correct market inefficiencies. This will be achievedthrough ‘fuel security credits’ that are designed toreduce actual oil use and to invest in trans portprojects that are less energy intensive, to examinemeans by which trips can be avoided, to encouragemode shift to public and non-motorized transport,and to improve technologies.148

1EEE234567891012311145678920123456789301234567894012345678950123456789EEEE
149Urban Mobility and the Environment
There are also considerable overlaps betweenmany general devel op ment programmes – fundedthrough official devel op ment assistance – and globalpublic goods programmes, including climate changemitigations strategies such as public-sector invest -ments in clean transportation.149 Further more,although it is currently not mentioned specific-ally, there should be considerable scope to includefunding for sus tain able urban mobility – particu-larly in devel op ing countries – in the discussions oninnovative devel op ment financing mechanismscurrently being explored in the global economicarena.150 Thus, both of these sources of funding couldbe drawn upon to finance environ mentally sus tain -able urban mobility systems.
CONCLUDING REMARKSAND LESSONS FOR POLICYWhen sensitively planned and appropriately sup -ported by sus tain able infra struc ture, compact citiesare the world’s most efficient settlement pattern.Urban density reduces the overall spatial footprintof devel op ment and allows for greater preservationof natural areas. It also allows for more efficient useof trans port infra struc ture, which reduces emissionsand resource use. However, current trends in motor -ization and oil dependence – and the increaseddependence on private motorized trans port – posemajor challenges to the devel op ment of environ -mentally sus tain able urban mobility systems, namely:
• greenhouse gas emissions: the main cause ofglobal climate change, which could have catas -trophic impacts on urban transportation systems;
• urban sprawl: leading to increasing trip lengthsand thus increased dependence on the private carto meet individual mobility needs;
• air and noise pollution, and decreased physicalactivity: have major negative impacts on the healthof urban residents;
• road traffic accidents: are among the leadingcauses of premature deaths in cities all around theworld;
• community severance: where major trans portinfra struc ture disrupts neigh bour hoods and servesas physical barriers to human interaction.
To address these challenges, there is a need for policyinterventions that encourage change in five majorareas, namely: a reduction of the number of motor -ized trips made (i.e. telecommuting, online shoppingor a shift to non-motorized transport); reduced traveldistances in cities (i.e. changes to the urban form);changes in the modal split (i.e. encouraging publictransport); technological innovations that reduce thenegative externalities of motorized trans port (i.e.
more efficient fuels and reduced emissions); andincreased vehicle efficiency (i.e. higher occupancyrates).
Most policy interventions may be grouped inthree categories: regulatory measures; pricingmeasures; and investments in public trans port andpublic (and non-motorized) trans port infra struc ture.Regulatory measures may be used to limit the num-ber of cars on the roads at any particular time, or torestrict the number of parking places in inner-cityareas, both of which may encourage a modal shifttowards public transport. Such measures may alsobe used to reduce emissions from motor vehicles toencourage the use of more energy-efficient vehicles,and to encourage more efficient use of infra struc tureand vehicles, for example through the introductionof dedicated high-occupancy vehicle lanes.
Pricing measures may be used to discourage theuse of private motorized trans port – in the form ofelectronic road pricing, congestion charging, park-ing pricing, fuel taxes, etc. – or to encourage the useof more energy-efficient vehicles – for example salesduties related to engine size. Similarly, such measuresmay also be used in the form of subsidies to encour -age the use of public trans port (fare subsidies) andto encourage the purchase of more efficient vehicles(subsidies on low-emission fuels, vehicle purchaseprices, exemptions from congestion or parkingcharges, etc.).
Investments in public transport, and infra struc -ture for public and non-motorized transport, may alsoplay a major role in encouraging shifts to more sus -tain able modes of transport. Improved connectivity,increased capacity, enhanced quality and reducedtravel times for such modes are major factors encour -aging city residents to reduce their reliance on theprivate car.
However, the perhaps most effective approach(at least in the longer term) to reduce the environ -mental impact of urban mobility is to reconsider theurban spatial structure. As discussed in Chapter 5,urban form plays an important part in determiningboth trans port mode and distance travelled, as it linksthe spatial distribution of population and jobs (as wellas other destinations) to the pattern of trips. Throughincreased (population and job) densities and mixed-use devel op ments, urban planning may play a majorrole in organizing spatial activities in cities so thatthey are in close proximity to their users. Well-planned, densely populated settlements can reducethe need for private motorization and decrease traveldistances, thus making it more attractive to walk andcycle. Further more, urban planning based on transit-oriented devel op ment (or similar approaches) helpsto maximize urban densities around trans port nodesand encourages a modal shift to public transport.Such an integration of land-use and trans port planningis a core component of a strategy to create environ -mentally sus tain able urban mobility systems.
There is a needfor policyinterventions thatencourage . . . : a reduction of the number ofmotorized tripsmade . . . ;reduced traveldistances in cities. . . ; changes inthe modal split . . . ; technologicalinnovations thatreduce thenegativeexternalities ofmotorizedtransport . . . ; and increasedvehicle efficiency
The perhaps mosteffective approach. . . to reduce theenvironmentalimpact of urbanmobility is toreconsider theurban spatialstructure

NOTES1 Banister and Berechman,
2000.2 Jackson, 2009.3 Perrels et al, 2008.4 Such externalities include the
costs that are imposed by oneset of users on other users andon society more generally, andwhere these costs are not paidby the polluter (Maddison et al,1996).
5 Carpenter et al, 2008, p439;Banister, 2005.
6 IEA, 2012b. See Figure 1.5.7 IEA, 2009. See also UN-Habitat,
2011; and Barker et al, 2007.For details on how theseemissions distribute acrossmodes, see Table 7.1.
8 UN, 2012a.9 Energy density is the amount of
energy per unit volume of fuel(Savage, 2011).
10 With respect to this last point,this indicates that devel op ingcountries may more easily findalternatives to oil-basedtransport, as these may havelower levels of investment in‘conventional’ trans port infra -struc ture. This might be seen asan opportunity for devel op ingcountries to make the transitionto a low-carbon trans portsystem.
11 Gilbert and Perl, 2010.12 Afrique en ligne, 2011.13 Banister et al, 2011. This is so
despite recent devel op ment interms of the extraction ofunconventional oils, which havethe potential to dramaticallyincrease oil supply in short andmedium term (Gordon andTsay, 2013).
14 See for example UNEP, 2008.15 See for example Principle 16 of
the ‘Rio Declaration on Environ -ment and Devel op ment’,http://www.unep.org/Documents.Multilingual/Default.asp?documentid=78&articleid=1163, lastaccessed 30 January 2013. The removal of subsidies is
necessary, but not sufficient, to ensure payment of the fullenviron mental costs of fuels.
16 IEA, 2010, p569.17 See IEA, 2010, pp571–572.18 UN-Habitat, 2011, pp17–20.19 IEA, 2011a, p13.20 IEA, 2011b.21 Yet, as noted earlier in this
chapter, emissions from thetrans port sector have remainedconstant at about 23 per cent of total CO2 emissions.
22 OECD/ITF, 2011b.23 OECD/ITF, 2011b, Table 4.24 UITP, 2001.25 UN-Habitat, 2008.26 UN-Habitat, 2008.27 Nicholls et al, 2008.28 LSE cities et al, 2013.29 UN-Habitat, 2011.30 For a more elaborate
discussion on this, see UN-Habitat, 2011.
31 Due to the limited access toprivate modes of trans port ofthe urban poor, evacuationplans should provide sufficient(and free) public trans portservices in case of evacuation.
32 BRT systems seem to providean answer to the congestionproblem, as these buses travel indedicated lanes.
33 Banister, 2007.34 See Chapter 5.35 See Chapter 6.36 Lucas, 2009. This issue is
discussed at more length inChapter 6.
37 Banister, 1998.38 Perkins and Hamnett, 2002,
p11.39 From 2.5 million to 5.3 million
(UN, 2012a).40 From 42 per cent to 31 per
cent of total land area (Ernst,2011).
41 See for example the attentionpaid to air pollution ahead ofthe 2008 Olympic Games inBeijing China (UNEP, 2007a).
42 Vidal, 2013; citing Lim et al,2012.
43 Walker, 2012.44 EC-Environ ment, 2011.45 UN, 1997. See also EEA, 2001.
The WHO noise standard fortraffic areas is 70 dB (Berglundet al, 1999, p65).
46 OECD, 1991.47 OECD, 1991.48 OECD, 1991; UN, 1997.49 Suchorzewski, 2011.50 Woodcock et al, 2007; Roberts
and Edwards, 2010.51 Bull et al, 2004.52 Woodcock et al, 2007 and
2009.53 James et al, 2004; WHO, 2009,
Table A4.54 Overweight and obesity
increase with age. In England,the percentage of adults whoare obese has roughly doubledsince the mid-1980s (OxfordUniversity, 2007).
55 See for example http://www.copenhagenize.com/, lastaccessed 6 February 2013.
56 Andersen et al, 2000.57 Vasconcellos, 2011, p351.58 Gehl, 1996; Gehl and Gemzøe,
2001.59 Ontario College of Family
Physicians, 2005, p3.60 Ontario College of Family
Physicians, 2005.61 IBM Corporation, 2011.62 Huzayyin, 2011.63 This option is discussed in more
detail in the section below on‘Changing the Modal Split’.
64 Pineau, 2010. See also Chapter 6.
65 Paula Bisiau, Director for Sus tain able Transportation, City of Buenos Aires (personalcommunication, 8 October2012).
66 Sus tain able Transport Project for Egypt, 2011.
67 The relationship between travelbehaviour and urban form isdiscussed in more detail inChapter 5.
68 Banister and Stead, 2004.69 Larsen et al, 2006.
70 Lyons and Kenyon, 2003.71 See for example Hampshire
et al, 2012; Porter, 2012.72 Castells, 2000; Etzo and
Collender, 2010. See alsoEconomist, 2009.
73 See Chapter 5.74 Glaeser, 2011.75 Chew, 2011.76 Chew, 2011.77 ADONIS, 1999.78 See note 4 above, and
Chapter 8.79 See the discussion above in the
section on ‘EnvironmentalChallenges in Urban MobilitySystems’.
80 Note that governance issues are also important for effectiveimplementation (see UN-Habitat, 2011, p108; andChapter 9 below).
81 Barter and Dotson, 2011.82 The pico y placa in Bogotá was
introduced in 1998, and waslater replicated in Medellín in2005. A similar system (hoy-no-circula), which restricts driversfrom using their vehicles oneweekday per week, wasintroduced in Mexico City in1989 (Gallego et al, 2011).
83 Banister, 2003.84 Dijk and Montalvo, 2011.85 US Department of
Transportation, 2006.86 See also the discussion on fuel
subsidies in the section on‘Motorization and oildependence’ above.
87 The UK introduced such ascheme in 1993, but it wasabolished in 2000 due to publicdiscontent (Politics.co.uk,undated).
88 See discussion in Chapter 8.89 Anas and Lindsay, 2011.90 UITP, 2010, p22.91 Office for Low Emissions
Vehicles, 2011. Many othercountries have introducedsimilar measures, seehttp://en.wikipedia.org/wiki/Govern ment_incentives_for_
While the above interventions are discussedseparately in the report, it is essential to considerthem as components of a package of measures. Such‘packages’ are more likely to be publicly acceptable,as they allow a mixture of policies, some of whichmay be seen as dis advan tageous to individual users,yet as a package they may be seen as supporting thepublic good. To ensure successful implementationof environ mental policies, some of which may involveradical change, public acceptability should be a majorconcern. Communities and other stakeholders shouldthus be involved in all phases of policy devel op ment,including initial discussions, decision-making andimplementation.
The strategic planning of the city, and the roleplayed by trans port systems, needs to be balancedby actions taken at the neigh bour hood level, in asupportive govern ment environ ment at all levels. Itis at the neigh bour hood level that cycling and walkingbecome important modes of trans port – for accessto employment and other services and facilities – andthese complement the need to travel longer distancesby public trans port to other parts of the city. City-wide decisions need to take account of therequirements of the population and businesses – i.e.to ensure access to destinations – so that movementcan take place in an efficient and environ mentallysus tain able manner.
150 Planning and Design for Sustainable Urban Mobility
To ensuresuccessfulimplementation ofenvironmentalpolicies, . . .publicacceptabilityshould be a majorconcern

1EEE234567891012311145678920123456789301234567894012345678950123456789EEEE
151Urban Mobility and the Environment
plug-in_electric_vehicles (lastaccessed 30 January 2013).
92 Hall and Hass-Klau, 1985. See also Bauer et al 2006;Dresdner Verkehrbetriebe AG, 2011.
93 Wright, 2010. See also Chapter3 above.
94 See the section above on‘Motorization and oildependence’.
95 Including increases due to the‘rebound effect’, which impliesthat environ mental policies donot achieve all of their statedaims, as people tend to travelmore if they think that they are doing it more efficiently(Herring and Sorrell, 2008).
96 ADB, 2010a.97 See the section below on
‘Funding Mechanisms forEnviron mentally Sus tain ableUrban Mobility Systems’.
98 Schipper, 2011.99 UNEP, 2009.
100 The average age of all motorvehicles in Brazil in 2010 was 8.7 years (Kliment, 2011),comparable to countries such asSwitzerland: 8.2 years (FederalStatistical Office, Switzerland,2012); and the Netherlands, 8.6 years (Central Bureau ofStatistics, Netherlands).
101 UNEP, 2009, p17.102 Huzayyin and Salem, 2013.
Personal communication withProfessor Ali Huzzayin, CairoUniversity, Egypt, March 2013.
103 Davis and Kahn, 2011.104 Kenya Revenue Authority,
undated.105 UNEP, 2009.106 UNEP, 2009.107 See also the section on
‘Alternative fuels’ below.108 Gallagher, 2012.109 The 13 cities are Delhi, Mumbai,
Kolkata, Chennai, Bangalore,Hyderabad, Ahmedabad, Pune,Surat, Kanpur, Agra, Lucknowand Sholapur.
110 ACFA, 2010.111 Often more than 5000 parts
per million.112 i.e. 50 parts per million and
less.113 UNEP, 2007b, p8.114 i.e. 500 parts per million and
less.115 UNEP, 2007b, p9.116 The Obama administration in
the US is suggesting a fuel-economy standard of 23kilometres per litre average foran automaker’s whole fleet by2025, boosting the price of anew vehicle by at least US$2100(Healey, 2011).
117 See DieselNet, 2012a and2012b.
118 Regional Environ mental Centrefor the Caucasus, 2008.
119 An et al, 2011.120 See also the previous section on
‘Efficiency and age of the vehiclestock’.
121 Bleviss et al, 1996.122 Banister, 1998.123 See the section on
‘Motorization and oildependence’ above.
124 EC, 2011.125 The potential of biofuels may
improve, subject to thesuccessful devel op ment of‘second generation biofuels’ –which seek to utilize local‘biomass consisting of theresidual non-food parts ofcurrent crops, such as stems,leaves and husks that are leftbehind once the food crop hasbeen extracted, as well as . . .non food crops’ (http://en.wikipedia.org/wiki/Second_generation_biofuels, lastaccessed 6 February 2013).
126 Evenson, 2004.127 A hybrid electric vehicle is a
vehicle that uses both anelectric motor and a petrolengine to power the vehicle. A plug-in hybrid electric vehicleis a hybrid electric vehicle that is capable of storing energy
from the grid in onboardbatteries.
128 The conventional approach has been to look at energy useand emissions from a ‘tank-to-wheels’ perspective only, i.e.only the energy used and thecarbon emissions producedfrom the use of the vehicle itself(i.e. the petrol or the electricityfrom the onboard battery). A lifecycle approach implies a‘well-to-wheels’ approach,i.e. all energy used and carbonemissions produced from thesource of the energy to the finaluser (Graham and Reedman,2010).
129 Liu, 2012.130 Banister and Liu, 2011
(RMB60,000).131 Trans port for London, undated
b.132 Ministry of Transport, Ontario,
2007. For an overview of somecities that have introduced high-occupancy vehicle lanes, seehttp://en.wikipedia.org/wiki/High-occupancy_vehicle_lane,last accessed 30 January 2013.
133 De Vries et al, 2010.134 Debra Roberts during the
eighth meeting of the HS-NetAdvisory Board, 20 November2012.
135 Givoni et al, 2013.136 See the section above on
‘Alternative fuels’.137 See the section above on
‘Occupancy (load) factors’.138 Banister and Marshall, 2000.139 GlaxoSmithKline, 2012.140 These 28 projects were
categorized as follows: BRT (13 projects); motorbikes (4 projects); modal shift fromroad to rail (7 projects); moreefficient vehicles (1 project);regenerative braking forrailways (i.e. that the kineticenergy from braking isrecovered and later reused) (1 project); biodiesel fortransport (1 project); and cable
cars (1 project) (UNEP RisøCentre, 2013).
141 UNEP Risø Centre, 2013.142 See UN-Habitat, 2011, p20.143 ‘National appropriate
mitigation actions’ (NAMAs) are a set of actions and policiesthat can be undertaken bycountries as part of acommitment to reducegreenhouse gas emissions.
144 Under GEF, by 2011, there hadbeen 45 ‘sus tain able trans portand urban systems’ projectsfunded over 20 years,accounting for 6 per cent oftotal projects (GEF, 2011, p5).Within the countryprogrammes, the CleanTechnology Fund has allocatedabout 14 per cent of investmentto transport, as of December2011 (CIF, 2011, p14).
145 See World Bank, 2005.146 Bertaud et al, 2009.147 ADB, 2010a.148 ‘The credits will give a value to
the fuel security benefit arisingfrom improvements in fuelconsumption. Trading in thecredits could help devel op ingcountries to access additionalfunds to carry out policies andtechnologies that may nototherwise meet investmentrequirements from a traditionalcost–benefit analysis . . .Accounting for fuelconsumption is far easier thanaccounting for greenhouse gasemissions . . . and, as withcarbon emissions, reducing atonne of oil-equivalent is lesscostly in Asia than in Europe orNorth America’ (IntellAsia.Net,2011).
149 UN, 2012b, p7.150 See, for example, the
discussions of the UnitedNations High-level Panel onFinancing for Devel op ment and the Leading Group onInnovative Financing for Devel op ment (UN, 2012b).